Note: Descriptions are shown in the official language in which they were submitted.
CA 02487058 2009-09-29
MESODERM AND DEFINITIVE ENDODERM CELL POPULATIONS
STATEMENT REGARDING FEDERALLY SPONSORED RESEARCH
This invention was made with U.S. government support under Grant Nos. 2R01 HL
48834-09 and 2R01 HL 65169-02 awarded by the National Institutes of Health.
The
U.S. government may have certain rights in the invention.
' BACKGROUND OF THE INVENTION
During embryonic development, the tissues of the body are formed from three
major cell populations: ectoderm, mesoderm and definitive endoderm. These cell
populations, also known as primary genii cell layers, are formed through a
process known
as gastrulation. Following gastrulation, each primary germ cell layer
generates a specific
set of cell populations and tissues. Mesoderm gives rise to blood cells,
endothelial cells,
cardiac and skeletal muscle, and adipocytes. Definitive endoderm generates
liver,
pancreas and lung. Ectoderm gives rise to the nervous system, skin and adrenal
tissues.
The process of tissue development from these germ cell layers involves
multiple
differentiation steps, reflecting complex molecular changes. With respect to
mesoderm
and its derivatives, three distinct stages have been defined. The first is the
induction of
mesoderm from cells within a structure known as the epiblast. The newly formed
mesoderm, also known as nascent mesoderm, migrates to different positions that
will be
sites of future tissue development in the early embryo. This process, known as
patterning, entails some molecular changes that are likely reflective of the
initial stages of
differentiation towards specific tissues. The final stage, known as
specification, involves
the generation of distinct tissues from the patterned mesodermal
subpopulations. Recent '
studies have provided evidence which suggests that mesoderm is induced in
successive
waves which represent subpopulations with distinct developmental potential.
The
mesoderm that is formed first migrates to the extraembryonic region and gives
rise to
hematopoietic and endothelial cells, whereas the next population migrates
anteriorly in
the developing embryo and contributes to the heart and cranial mesenchyme.
These
lineage relationships were defined initially through histological analysis and
have been
largely confirmed by cell tracing studies. While this segregation of
developmental fates
1
CA 02487058 2004-11-15
WO 2004/098490
PCT/US2003/015658
is well accepted in the field of developmental biology, to date, there are no
available
methods of isolating mesoderm and endoderm, prior to commitment to these
lineages.
The present invention provides a method for isolating mesoderm and definitive
endoderm cell populations. These cell populations are useful to identify
agents that affect
cell growth and differentiation, to identify genes involved in tissue
development, and to
generate differentiated cells and tissues for cell replacement therapies.
SUMMARY OF THE INVENTION
The present invention provides cell populations that are enriched for
mesendoderm and mesoderm cells. Mesendoderm cells are defined herein as cells
that
express brachyury (brach+) and which, in the presence of differentiation-
inducing
conditions, are capable of generating mesoderm and mesoderm derivatives
including
cardiac and skeletal muscle, vascular smooth muscle, endothelium and
hematopoietic
cells, and also are capable of generating endoderm and endoderm derivatives
including
liver cells and pancreatic cells. Mesoderm cells are defined herein as cells
that are brach+
and which, in the presence of differentiation inducing conditions, are capable
of
generating cardiac and skeletal muscle, vascular smooth muscle, endothelium
and
hematopoietic cells, and are not capable of generating endoderm and endoderm
derivatives.
The present invention further provides cell populations that are enriched for
endoderm cells. Endoderm cells are defined herein as cells that do not express
brachyury
(brach") and which, in the presence of differentiation-inducing conditions,
are capable of
generating lung cells, liver cells and pancreatic cells.
The present invention also provides methods of isolating cell populations
enriched
for mesendoderm and mesoderm cells, and cell populations enriched for endoderm
cells.
In another embodiment, the present invention provides methods of identifying
agents that
affect the proliferation, differentiation or survival of the cell populations
of the invention.
A method of identifying genes involved in cell differentiation and development
of
specific lineages and tissues is also provided.
Antibodies that specifically recognize brach+ cells are also provided. The
antibodies are useful, for example, for isolating mesendoderm and mesoderm
cell
populations.
In another embodiment, the present invention provides a method for generating
cells in vitro. Such cells are useful, for example, for cell replacement
therapy.
2
CA 02487058 2004-11-15
WO 2004/098490
PCT/US2003/015658
The present invention also provides a transgenic non-human mammal having a
genome in which DNA encoding a selectable marker is present in the brachyury
locus
such that one brachyury allele is inactivated and the selectable marker is
expressed in
cells in which the brachyury locus is transcribed.
BRIEF DESCRIPTION OF THE DRAWINGS
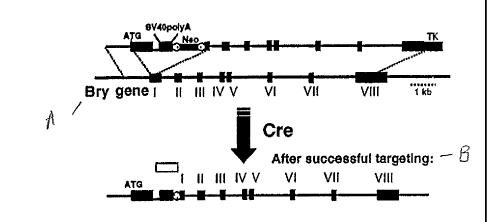
Fig. 1 depicts the scheme of the vector and the strategy used for targeting
the
green fluorescence protein (GFP) to the brachyury locus.
Figs. 2A and 2B depict the expression of GFP and brachyury in developing
embryoid bodies (EBs). Fig. 2A depicts the kinetics of brachyury expression
determined
by reverse transcriptase-polymerase chain reaction (RT-PCR). Fig. 2B depicts
the
kinetics of GFP expression determined by fluorescence activated cell sorting
(FACS)
analysis. Numbers above the figure in Fig. 2A and the histograms in Fig. 2B
represent
day of EB differentiation.
Figs. 3A-C depict the developmental potential of wild type and GFP-Bry ES
cells.
Fig. 3A is a histogram showing developmental potential of day 6 EBs. (Mac/Ery:
colonies of macrophages and definitive erythroid cells; Mac: pure macrophage
colonies;
Eryd: colonies of definitive erythroid cells; Mix: multilineage colonies;
EryP: primitive
erythroid colonies. Fig. 3B is a histogram depicting blast colony-forming cell
(BL-CFC)
potential of EBs. Fig. 3C shows gene expression patterns during EB development
for
wild-type and GFP-Bry cells. Numbers at the top of the lanes represent day of
EB
differentiation.
Figs. 4A and 4B depict the gene expression profile of EB fractions isolated on
the
basis of GFP. Fig. 4A shows the profile of GFP expression in day 3.5 EBs. 1
and 2
represent the gates used to isolate the GFP" and GFP+ fractions. Fig. 4B
depicts RT-PCR
expression analysis of isolated fractions.
Figs. 5A-C demonstrate the isolation and characterization of GFP and F1k-1
populations. Fig. 5A depicts the profiles and gates used to isolate the
GFP7F1k-1-,
GFP+/Flk-1" and GFP+/F1k-1+ fractions from day 3.0 and 3.5 EBs Numbers next to
the
gates represent the three different populations. Fig. 5B shows the Blast
colony (Blast)
and secondary EB (2 ) potential of the different fractions. Fig. 5C shows the
expression
analysis of the isolated fractions. Expression shown in the top panel was
evaluated using
a polyA+ global amplification PCR method described by Brady et al. (1990)
Meth. In
Mol. And Cell Bio. 2:17-25. The data in the lower panels was obtained by RT-
PCR
3
CA 02487058 2004-11-15
WO 2004/098490
PCT/US2003/015658
analysis using gene specific oligonucleotides. Numbers on the top of each row
indicate
the cell population as designated in Fig. 5A.
Fig. 6 depicts the expression of GFP and Flk-1 in isolated day 3 EB-derived
fractions. The top row shows the expression profiles of the three fractions
prior to culture
(pre). The bottom row indicates the profile of the same cell populations
following 20
hours of culture (post). The numbers below each profile indicate the BL-CFC
and
primitive erythroid (EryP-CFC) potential (precursors per lx105 cells plated)
of each
population.
Figs. 7A and 7B depict the BL-CFC potential and Flk-1 expression of the
isolated
cell populations prior to and following culture. In Fig. 7A, the numbers on
the bottom
refer to the cell population: 1 is the presort, 3 is the GFP+/Flk-1- fraction
and 4 is the
GFP+/Flk-1+ fraction. Cells were cultured for 20 hours, and the aggregates
were then
dissociated and analyzed for BL-CFC. Data are shown for cells isolated from
day 3, 3.5
and 4.0 EBs. In Fig. 7B, the top row represents GFP+/Flk-1- cells isolated
from day 3.0,
3.5 and 4.0 EBs prior to culture (pre). The bottom row shows the Flk-1
expression
pattern of the same fraction, following culture (post). Numbers above the bars
represent
the percentage of F1k-1+ cells.
Figs. 8A and 8B demonstrate the effects of BMP-4 and fetal calf serum (FCS) on
the development of brachyury and Flk-1+ in/on day 3.0 EB derived cells under
the
conditions indicated at the top of each histogram. Fig. 8B depicts expression
of
brachyury and Flk-1 on cell populations generated from GFP+//Flk-1- cells
cultured for
20 hours under the indicated conditions.
Fig. 9 is a schematic model of mesoderm formation and specification in EBs.
Fig. 10 shows the expression of genes in EBs in the presence and absence of
serum.
Fig. 11 is a graph depicting brachyury expression in EBs generated under
different
conditions.
Fig. 13 is a schematic diagram showing neuronal differentiation is the
presence
and absence of serum.
Fig. 14 shows the expression of genes in EBs initiated for two days in serum
and
then switched to serum free conditions.
Fig. 15 shows gene expression in EBs cultured in the presence of bFGF.
Fig. 16 shows gene expression patterns in Bry+ and Bry- cells cultured in the
presence of bFGF.
4
CA 02487058 2004-11-15
WO 2004/098490
PCT/US2003/015658
Fig. 17 is a diagram of the mesoderm and endoderm populations of the present
invention and the differentiation of these population to derivative cell
types.
Fig. 18 depicts the kinetics of expression of GFP (brachyury) and Flk-1 in EBs
differentiated for 2.5, 3.0, 3.5 and 4.0 days. Arrows indicate the GFP+
population isolated
used for the analyses in subsequent studies.
Fig. 19 depicts the hemangioblast and cardiac potential of the GFP+
populations
isolated from the four stages of EB differentiation. Cells from each stage
were isolated
by cell sorting, reaggregated for 24 hours and analyzed for hematopoietic and
cardiac
potential. Data are indicated as blast colonies (hemangioblast) per lx105
cells recovered
from the reaggregation culture or as the % of aggregates that gave rise to
beating cell
masses indicative of cardiac muscle differentiation.
= Fig. 20 provides the RT-PCR expression analysis of the indicated genes in
the
four GFP + EB-derived cells populations. Numbers indicate day of EB
differentiation.
Fig. 21 shows HNF3 13 expression in GFP + populations isolated from day 3.0
and 4.0
EBs. Pre represents cells prior to sorting, -/- are cells that express no GFP
or Flk-1 and
+/- represents the GFP + Flk-l-population.
Figs. 22A-C demonstrate the effects of activin on development of EBs in serum-
free cultures. A) FACS profile showing GFP expression in day 6 EBs
differentiated in
the presence of 100 ng/ml of activin. B) Kinetics of GFP induction in cultures
containing
100 ng/ml of activin. Open circles are EB differentiated in the presence of
activin, closed
squares are EBs differentiated in absence of activin. C) RT-PCR expression
analysis of
indicated genes in day 6 EBs grown in the presence (+ activin) or absence (-
activin) of
activin. Numbers indicate day of EB differentiation.
Figs. 23A and B show the effects of different concentrations of activin on the
developmental potential of EBs. A) GFP expression in day 7 EBs induced with
different
concentrations of activin. B) RT-PCR expression analysis of day 7 EBs induced
with
different concentrations of activin.
Figs. 24A and B show the hematopoietic progenitor content of EBs
differentiated
in the presence of different concentrations of activin. A) Progenitor
potential of day 7
EBs, Ep are primitive eiythroid progenitors, mac/mix represent definitive
hematopoietic
progenitors. B) Progenitor potential of day 7 activin-induced EBs following
2.5 days of
exposure to serum.
Fig. 25 shows the development of albumin expressing cells from GFP + cells
induced with ether 3 or 10Ong/m1 of activin. GFP + and GFP- cells were
isolated at day 6
5
CA 02487058 2004-11-15
WO 2004/098490
PCT/US2003/015658
of differentiation and cultured for a further 8 days in the conditions
previously described
to support hepatocyte differentiation.
Figs. 26A and B depict three-week old renal grafts of bry+ (Fig. 26A) and bry-
(Fig. 26B) cell populations. Fig. 26C depicts sections of grafts of the bry+
and bry
populations.
Fig. 27A is a FACS profile indicating the bry+/c-kit+ (+/+) and bry+/c-kil (+/-
)
fractions isolated from day three serum-stimulated EBs. Numbers represent the
proportion of cells in each of the fractions. Fig. 27B shows expression
analysis of each of
the fractions. Day 3 represents cells analyzed immediately following sorting.
Day 15
represents cell populations cultured for 15 days in hepatocyte conditions.
Fig. 28 depicts expression analysis of cell populations derived from EBs
induced
with different concentrations of activin. Numbers at the top of the figure
indicate activin
concentration. Numbers at the bottom of the figure represent an estimate of
the
proportion of EBs with skeletal muscle outgrowths.
- Fig. 29
depicts expression analysis of brachyury fractions isolated from activin-
induced populations. Numbers at the top of the figure indicate activin
concentration.
DETAILED DESCRIPTION OF THE INVENTION
During embryogenesis, the formation of mesoderm is a critical step in the
establishment of a body plan and in the development of multiple organ systems
such as
blood, endothelium, heart and skeletal muscle. The molecular mechanisms that
control
mesoderm formation, however, are poorly defined. A model system based upon the
differentiation of embryonic stem (ES) cells in culture has been used to study
mesodermal-derived populations including hematopoietic, endothelial, cardiac
and
skeletal muscle and adipocyte lineages. The in vitro model supports the
induction and
specification of mesoderm, but these differentiation events take place in
complex colonies
known as embryoid bodies (EBs) generated from ES cells. It would be
advantageous to
isolate mesoderm cell populations from EBs as they are formed, in order to
better
understand mesoderm formation and tissue development. However, it has not been
possible to isolate these populations by cell sorting using antibodies,
because antibodies
specific for nascent mesoderm cell populations are not well-defined.
Brachyury (also known as T) is the founding member of a family of
transcription
factors known as T-box genes and was first identified as a naturally occurring
mutation in
mice. Papaioannou et al. (1998) Bioessays 20:9-19. Heterozygous mice are
viable but
have a shorter tail than wild type animals. Homozygous mutants, which die at
6
CA 02487058 2004-11-15
WO 2004/098490
PCT/US2003/015658
approximately day 10 p.c., lack a notochord and display defects in the
development of
posterior mesodermal tissues. Through the analysis of chimeric animals,
brachyury has
been shown to affect the migratory properties of the mesodermal cells. Wilson
et al.
(1995) Development 121:877-86. Expression analysis revealed a unique and
interesting
pattern for brachyury. It is expressed transiently in all cells ingressing
through the
primitive streak as well as in the nascent and early migrating mesoderm.
Wilkinson et al.
(1990) Nature 343:657-9; Herrmann et al. (1991) Development 113:913-7.
Expression is
rapidly downregulated in paraxial, lateral and extraembryonic mesoderm and
following
regression of the steak, is confined to the tailbud and notochord. Given this
pattern,
brachyury is considered to be one of the best markers of early mesoderm and is
used to
track the development of this lineage. Brachywy has been identified in all
species
analyzed, suggesting that its role in mesoderm development is preserved
throughout
phylogeny. Papaioannou et al. (1998).
In accordance with the present invention, a selectable marker gene has been
recombinantly targeted to the brachyury locus. It has been discovered that,
following the
initiation of ES cell differentiation, the selectable marker is expressed in a
pattern that
reflects brachyury expression. The selectable marker has allowed the sorting
of
brachyury positive (Brach) cells from EBs, and thereby the isolation and
characterization
of cell populations that are enriched for mesendoderm and mesoderm cells.
The selectable marker exemplified in accordance with the present invention is
the
enhanced green fluorescence protein (EGFP or GFP). Other selectable markers
that will
facilitate cell sorting are known to those of ordinary skill in the art and
may be used in the
present invention. The cDNA encoding GFP is known in the art (and is
commercially
available, for example as plasmid pEGFP.C1 from Clontech, Palo Alto, CA), and
may be
targeted to the brachyury locus by constructing targeting vectors (GFP-Bry) by
methods
known in the art. The vectors are preferably designed to replace approximately
two-
thirds of the first exon of the brachyury gene with a GFP expression cassette.
Brachyury genes from numerous species, including human and mouse, are known
in the art and reviewed, for example, by Smith (1997) Current Opinion in
Genetics &
Development 7:474-480. The GFP expression cassette preferably contains GFP
cDNA
and one or more translational stop codons to prevent translation of downstream
brachyury
exons. The cassette may further contain an exon encoding the SV40
polyadenylation
signal sequence to prevent transcription of downstream regions of the brachywy
gene.
7
CA 02487058 2004-11-15
WO 2004/098490
PCT/US2003/015658
The vectors are introduced into ES cells by methods known in the art to
integrate
the GFP-Bry construct by homologous recombination. ES cells may be isolated
from
blastocysts by methods known in the art and disclosed for example by Evans et
al. (1981)
Nature 292:154-156, Thomson et al. (1995) Proc. Nat'l. Acad. Sci. USA 92;
7844; U.S.
Pat. No. 5,843,780; and Reubinoff et al. (2000) Nature Biotech. 18:399. In a
preferred
embodiment the ES cells are mouse or human ES cells. Following successful
targeting
the brachyury start codon becomes the start codon of GFP, resulting in the
disruption of
the targeted brachyury allele. The resulting cells are designated GFP-Bry ES
cells. GFP-
Bry ES cells are defined herein as ES cells in which one brachyury allele is
inactivated
and GFP is expressed under the control of the brachyury regulatory elements.
It has been discovered in accordance with the present invention that GFP-Bry
ES
cells, in which one brachyury allele is inactivated, are viable and develop
and
differentiate normally. Further, it has been discovered that GFP expression
mirrors
endogenous brachyury expression. Accordingly, brach+ cells may be isolated by
selecting
for cells that express GFP. Cells that express GFP may conveniently be
isolated by flow
cytometry, for example by fluorescence-activated cell sorting (FACS). Methods
for
sorting cells based on fluorescent properties are well-known to those of
ordinary skill in
the art.
Cell populations that are enriched for mesendoderm and mesoderm cells, as
defined hereinabove, may be obtained by culturing GFP-Bry ES cells in the
presence of
serum for a time sufficient to obtain GFP + cells, for example for from about
one to about
four days for mouse cells, and sorting and isolating GFP + cells, for example
by flow
cytometry. The cell population that is isolated contains at least about 50%,
and preferably
at least about 75%, and more preferably at least about 90%, and most
preferably at least
about 95% or at least about 99% mesendoderm and mesoderm cells. The relative
amounts of mesendoderm and mesoderm may be varied by adjusting the length of
the
culture in serum, with shorter culture times favoring the presence of
mesendoderm and
mesoderm patterned to the hematopoietic and endothelial lineages, and longer
culture
times favoring the presence of mesoderm patterned to the cardiac and skeletal
muscle
lineages. For example, a cell population enriched for mesoderm may be obtained
by
culturing in serum for about 2.5 to 4.5 days, followed by sorting and
isolating GFP + cells.
Culturing in the presence of serum is defined herein as culturing in media
supplemented
with animal serum, for example fetal calf serum (FCS). In a preferred
embodiment, the
media is supplemented with from about 5% to about 25% serum. The optimal
8
CA 02487058 2004-11-15
WO 2004/098490
PCT/US2003/015658
concentration may be serum batch dependent and can be determined by one of
ordinary
skill in the art.
Cell populations that are enriched for mesendoderm and mesoderm cells may be
obtained from GFP-Bry ES cells generated from human ES cells by a similar
method in
which the length of time of culture in serum is lengthened to account for
difference in
times of differentiation in vitro for human and mouse cells. Accordingly, GFP-
Bry ES
cells generated from human ES cells are cultured in serum for a time
sufficient to obtain
GFP+ cells, for example about 2 to about 18 days, before sorting and isolating
GFP+ cells.
For both mouse and human cell populations, it can be easily determined whether
the isolated cells have differentiated beyond mesoderm, for example to
hemangioblasts,
by assaying for the presence of the tyrosine kinase receptor, human KDR or
mouse Flk-1.
KDR and Flk-1 are not expressed in mesendoderm and nascent mesoderm, but as
these
cells differentiate to a hemangioblast/pre-erythroid population, KDR or Flk-1
expression
is detectable. KDR + and flk-1+ cells may be identified by flow cytometry
using
antibodies to KDR or Flk-1. Such antibodies are known in the art, and may also
be
generated using standard methods of antibody production. The cell populations
enriched
for mesendoderm and mesoderm may be further enriched by removing KDR + or Flk-
1+
cells by cell sorting.
As depicted in Fig. 17, it has been discovered in accordance with the present
invention that mesendoderm is a previously unidentified cell population that
gives rise to
both endoderm and mesoderm and their corresponding lineages. It has been
further
discovered that presence or absence of serum in the in vitro culture may be
used to dictate
which lineage is generated from mesendoderm. In particular, a cell population
that is
enriched for endoderm cells may be obtained by culturing GFP-Bry ES cells
generated
from mouse ES cells in the presence of serum for about two to four days,
sorting and
isolating GFP+ cells, for example by flow cytometry, followed by culturing the
GFP in
the absence of serum for from about one to about ten days. The cell population
that is
isolated contains at least 50%, and preferably at least about 75%, and more
preferably at
least about 90%, and most preferably at least about 95% or at least about 99%
endoderm
cells, as defined hereinabove.
Cell populations that are enriched for endoderm cells may be obtained from GFP-
Bry ES cells generated from human ES cells by culturing the GFP-Bry ES cells
in the
presence of serum for about 2 to 10 days, and then sorting and isolating GFP+
cells
9
CA 02487058 2004-11-15
WO 2004/098490
PCT/US2003/015658
followed by culturing the GFP+ cells in the absence of serum for from about 1
to about 15
days.
The populations enriched for endoderm cells may be further enriched by
identifying and sorting out KDR+ or Flk-1+ cells as described above.
It has further been discovered in accordance with the present invention that
cell
populations enriched for endoderm may be obtained by culturing GFP-Bry
embryonic
stem cells in the absence of serum and in the presence of the growth factor
activin, for
about two to about ten days, and isolating cells that express brachyury. The
amount of
activin is sufficient to induce differentiation of embryonic stem cells to
endoderm. Such
differentiation may be measured by assaying for the expression of genes
associated with
endoderm development, including for example HNF3 p, Soxl
7, Hex-1 or pdx-1.
In a preferred embodiment, the concentration of activin is at least about 30
ng/ml. In
another preferred embodiment the concentration of activin is about 100 ng/ml.
Cell populations enriched for mesoderm may be obtained by culturing GFP-Bry
embryonic stem cells in the absence of serum and the presence of activin for
about two to
about ten days, and isolating cells that express brachyury. The amount of
activin is
sufficient to induce differentiation of embryonic stem cells to mesoderm, but
insufficient
to induce differentiation to endoderm. Differentiation to mesoderm may be
measured by
assaying for the expression of genes associated with mesoderm development,
including
for example GATA-1, and the absence of expression of genes associated with
endoderm
development. In a preferred embodiment, the concentration of activin is less
than 30
ng/ml. In another preferred embodiment the concentration of activin is about 3
ng/ml.
The present invention further provides a method of identifying agents that
affect
the proliferation, differentiation or survival of the cell populations
described above. The
method comprises culturing cells from one of the cell populations described
hereinabove
in the absence and presence of an agent to be tested, and determining whether
the agent
has an effect on proliferation, differentiation or survival of the cell
population. The agent
to be tested may be natural or synthetic, one compound or a mixture, a small
molecule or
polymer including polypeptides, polysaccharides, polynucleutides and the like,
an
antibody or fragment thereof, a compound from a library of natural or
synthetic
compounds, a compound obtained from rational drug design, or any agent the
effect of
which on the cell population may be assessed using assays known in the art,
for example
standard proliferation and differentiation assays as described in U.S. Patent
No.
CA 02487058 2004-11-15
WO 2004/098490
PCT/US2003/015658
6,110,739. Such agents are useful for the control of cell growth and
differentiation in
vivo and in vitro.
The present invention further provides a method of identifying genes involved
in
cell differentiation and development of specific lineages and tissues. The
method
comprises isolating populations of GFP+ cells of the invention after different
amounts of
time in culture, comparing gene expression profiles in the different
populations, and
identifying genes that are uniquely expressed in a population. In a preferred
embodiment,
microarray analysis and subtractive hybridization are used to compare gene
expression
profiles.
In another embodiment, the present invention provides methods of making
antibodies that recognize brachyury positive (brach) cells but not brachyury
negative
(brach-) cells. Polyclonal antibodies may be made by injecting an animal with
the cells of
the invention in an immunogenic form. Also, antibodies may be made by
identifying
cells surface markers present in GFP+ but not GFP" cells, and making
antibodies against ,
the markers or fragments thereof. The antibodies may be monoclonal or
polyclonal, and
may be fragments, genetically engineered antibodies, single chain antibodies,
and so on.
Antibodies may be made by methods well-known in the art. Such antibodies are
useful
for identifying and isolating brach+ cells such as mesendoderm and mesoderm.
The present invention also provides a method for generating mammalian cells in
vitro. In one embodiment, the method comprises culturing cells from a cell
population
enriched in mesendoderm and mesoderm cells under conditions effective for the
differentiation of mesoderm into cardiac muscle, vascular smooth muscle,
endothelium or
hematopoietic cells. Conditions effective for differentiation into the various
cell types in
vitro are known in the art. In another embodiment, the method comprises
culturing cells
from a cell population enriched in endoderm cells under conditions effective
for the
differentiation of endoderm into liver cells or pancreatic cells. Effective
conditions for
such differentiation are known in the art. The production of insulin-producing
pancreatic
islet cells is specifically contemplated.
As demonstrated in accordance with the present invention, brach+ cells
isolated
from different aged EBs have different developmental potentials. Brach+/Flk-
cells from
about day 3 mouse EBs efficiently generate hemotopoietic and endothelial
lineages, while
the cells from about day 3 to 10 EBs generate cells of cardiomyocyte lineages.
Accordingly, by adjusting the time of culture of the ES cells used for
obtaining the cell
population enriched for mesendoderm and mesoderm, one of ordinary skill in the
art can
11
CA 02487058 2009-09-29
select for efficient production of hemotopoetie and endothelial lineages or
cardiomyocyte
lineages.
Such cells are useful, for example, for cell replacement therapy for the
treatment
of disorders that result from destruction or dysfunction of a limited number
of cell types.
Such disorders include diabetes mellitus, liver failure, heart failure,
cardiovascular and
other vascular disease, Duchenne's muscular dystrophy, osteogenesis
imperfecta, and
disorders treatable by bone marrow transplant, for example leukemias and
anemias. See,
Odorico et al., (2001) Stem Cells 19:193-204.
The cell populations of the present invention are useful for generating
differentiated cells and tissues for cell replacement therapies. The
suitability of the cell
populations of the present invention for cell replacement therapy may be
assessed by
transplanting the cells into animal models of disorders that are associated
with the
destruction or dysfunction of a limited number of cell types. For example, the
fumarylacetoacetate (FAH) deficient mouse disclosed for example by Grompe et
al.
(1993) Genes & Dev. 7:2298, provides a model for liver
failure. FAH deficient mice suffer from progressive liver failure and renal
tubular
damage unless treated with NTBC (2-(2-nitro-4-trifluoromethyl benzoyl) ¨1,3-
cyclohexedione) or transplanted with normal hepatocytes. These mice thus
provide an
ideal model for testing the potential of cells with characteristics of
immature hepatocytes
generated from EBs. Methods for transplantation of hepatocytes into FAH
deficient mice
removed from NTBC are known in the art and disclosed for example by Overstuff
et al.
(1996) Nature Genet. 12:266-273. Normal liver function is indicated by
survival of the
mice, and may also be assessed by measuring serum aspartate transaminase
levels, plasma
bilirubin levels, and by determining normal structure of the regenerated
liver.
Animal models for other disorders that result from the destruction or
dysfunction
of particular cells types are known in the art. Such models may similarly be
used to
assess other cell populations of the present invention.
The present invention also provides a transgenic non-human mammal in which
DNA encoding a selectable marker is present in the brachywy locus such that
one
brachywy allele is inactivated and the selectable marker is expressed in cells
in which
the brachywy locus is transcribed. In a preferred embodiment the mammal is a
mouse
and the selectable marker is GFP. In particular, the transgenic mouse has a
genome
comprising a transgene in which a DNA sequence encoding GFP is operably linked
to
brachywy regulatory elements, and the transgene is expressed in cells that
normally
12
CA 02487058 2009-09-29
express brachyury. The transgenic mouse may be obtained by injecting the GFP-
Bry ES
cells described hereinabove into blastocysts, which are then implanted into
pseudopregnant females. Tmnsgenic pups are identified by the short-tail
phenotype
associated with brach +1-, and by molecular analysis. Such transgenic animals
are useful
for obtaining early embryos from which to isolate mesodemi to be used in
accordance
with the methods of the invention, and for the identification, isolation and
characterization of any adult cell populations that express the brachyloy
gene. Such cells
may represent novel stem cell populations.
The following examples serve to further illustrate the present invention.
Example 1
Materials and Methods
ES cell growth and differentiation. ES cells were maintained on irradiated
embryonic feeder cells in Dulbecco's Modified Eagle Medium (DMEM) supplemented
with 15% fetal calf serum (FCS), penicillin, streptomycin, LIF (1% conditioned
medium)
and 1.5 x l0 M monothioglycerol (MTG; Sigma). Two days prior to the onset of
differentiation, cells were transferred on gelatinized plates in the same
media. For the
generation of EBs, ES cells were trypsinized and plated at various densities
in
differentiation cultures. Differentiation of EBs was carried out in 60 mm
petri grade
dishes in IMDM supplemented with 15% FCS, 2mM L-glutamine (Gibco/BRL),
transferrin (200 uWm1), 0.5mM ascorbic acid (Sigma), and 4.5 x 10⁴ M MTG.
Cultures
were maintained in a humidified chamber in a 5% CO2/air mixture at 37 C.
Serum Free Medium. Two different serum-free media were used in different
aspects of the following examples: IIMD supplemented with Knockout SR (Gibco
BRL)
and StemPro 34 (Gibco BRL).
Methylcellulose Colony Assay. A) Blast colonies: For the generation of blast
cell
colonies (BL-CFC assay), EB-derived cent were plated at 0.5 X-- 1.5 x 10⁵
cells/ml in 1% =
methylcellulose supplemented with 10% FCS (Hyclone), vascular endothelial
growth
factor (VEGF; 5 ng/ml), c-kit ligand (KL; 1% conditioned medium), IL-6
(5nghni) and
25% D4T endothelial cell conditioned medium (Kennedy et al. (1997) Nature
386:488-
93). Transitional colonies were generated in the absence of VEGF. Colonies
were scored
following four days of culture. B) Hematopoletic colonies: For the growth of
primitive
and definitive hematopoietic colonies, cells were plated in 1% methylcellulose
containing
10% plasma-derived serum (PDS; Antech), 5% protein-free hybridoma medium (PFHM-
13
CA 02487058 2009-09-29
II; Gibco-BRL) plus the following cytokines: c-kit ligand (KL; 1% conditioned
medium),
erythropoietin (2 U/m1), IL-11 (25 ng/ml), IL-3 (1% conditioned medium), GM-
CSF (3
ng/ml), G-CSF (30 ng/ml), M-CSF (5 ng/m1), IL-6 (5 ng/m1) and thrombopoietin
(TPO;
5ng/m1). Cultures were maintained at 37 C, 5% CO2. Primitive erythroid
colonies were
scored at day 5-6 of culture, whereas definitive erythroid (BFU-E),
macrophage, and
multilineage colonies were counted at 7-10 days of culture. C-kit ligand was
derived
from media conditioned by CHO cells transfected with KL expression vector
(kindly
provided by Genetics Institute). IL-3 was obtained from medium conditioned by
X63
AG8-653 myeloma cells transfected with a vector expressing IL-3. VEGF, GM-CSF,
M-
CSF, IL-6 ,IL-11, activin BMP2, BMP4, bFGF, FGF8, and 11th were purchased from
R&D systems.
Reaggregation Cultures. Cells were cultured at 2x10⁵ per ml IMDM
supplemented with 15% FCS (or Knockout SR), 2mM L-glutamine (Gibco/I3RL),
0.5mM
ascorbic acid (Sigma), and 4.5 x 10⁴ M MTG in 24-well petri-grade plates.
These were
used to prevent adhesion of the cells to the bottom of the well.
Cardiac muscle assays. GFP+ cells were reagvegated in IMDM supplemented
with 15% serum replacement. Twenty hours later the aggregates were cultured in
wells of
either a 24- or 96-well plate in IMDM with 10% serum replacement (serum-free).
The
wells were pre-treated with gelatin. Cultured were monitored daily for the
development of
the appearance of beating cells. Beating cells were usually detected between
days 2 and 6
of culture.
Cell surface markers staining and FACS analysis. Standard conditions were
used to stain the cells.. Stained suspensions were analyzed on a FACScan
(Becton
Dickinson, CA).
Gene Expression Analysis For the poly A+ RT-PCR analysis the method of
Brady et al. ((1990) Meth. in Mol. and Cell Bio. 2:17-25) was used. Reverse
= transcription, poly-A tailing and PCR procedures were performed as
described, with the =
exception that the X-dT oligonucleotide was shortened to 5%
GTTAACTCGAGAATTC(T)24-3'. The amplified products from the PCR reaction were
= 30 separated on agarose gels and transferred to a Zeta-probe GT membrane
(Biorad) or
transferred to the membrane with a slot blot apparatus (Schleicher & Schoen).
The
resulting blots were hybridized with 32P randomly primed cDNA fragments (Ready-
to-Go
Labelling, Pharmacia) corresponding to the 3' region of the genes (for all
except 13-Hl). A
-H1-specific probe was prepared by annealing two oligonucleotides, (5'-
14
*Trade-mark
CA 02487058 2009-09-29
TGGAGTCAAAGAGGGCATCATAGACACATGGG-3', 5'-
CAGTACACTGGCAATCCCATGTG-3') which share an 8 base homology at their 3'
termini. This 8-HI specific otigonucleotide was labeled with 32P using a
Klenow fill-in
reaction. For gene specific PCR, total RNA was extracted from each sample with
RNeasy*
mini kit and treated with RNase free DNase (Qiagen). Two microgram of total
RNA was
reverse-transcribed into cDNA with random hexamer using a Omniscript RT kit
(Qiagen).
PCR was carried out using appropriate oligonucleotides. The PCR reactions were
performed with 2.5 U of Taq polyrnerase (Promega), PCR buffer, 2.5 mM MgC12,
0.2uM
of each primer and 0.2mM d/NITP. Cycling conditions were as follows; 94 C for
5 min
followed by 35 cycles of amplification (94 C denaturation for I min, 60 C
annealing for
1 min, 72 C elongation for I min) with a final incubation at 72 C for 7 min.
Example 2
Generation of Targeted ES Cells
Under appropriate conditions in culture, embryonic stem (ES) cells will
differentiate and form three dimensional colonies known as embryoid bodies
(EBs) that
contain developing cell populations from a broad spectrum of lineages. Smith
(2001)
Annu. Rev. Cell Dev. Biol. 17:435-62. Among these EB-derived populations, one
can
detect mesodermal derivatives including those of the hematopoietic,
endothelial, cardiac
muscle and skeletal muscle lineages.
In order to track the onset of mesoderm in EBs and to isolate cells
representing
this population, the green fluorescence protein (GFP) was targeted to the
brachyury locus.
The targeting construct contained the GFP cDNA, and artificial intron, SV40
poly(A)
sequences and a loxP flanked neo cassette in the first exon and is depicted in
Fig. 1. The
thyrnidine kinase (TK) gene was included at the 3' end of the targeting
construct to select
against random integration. The targeting vector was constructed as follows.
A BAC clone carrying the entire mouse Brachyury (Bry) gene was isolated by
=
'PCR screening of a 129/01a strain genomic library (Genome Systems) with
primers 5%
AAGGAGCTAACT AACGAGATGAT-3' and 5' -TACCITCAGCACCGGGAACAT-
3'. These primers anneal within the first and second Bry exon, respectively,
and amplify a
diagnostic band of ¨ 600 bp. An approximately 3 kb long Pstl restriction
fragment
carrying the 1 exon of the Bry gene along with more than 2 kb of 5' flanking
region was
identified and subcloned from the BAC into plasmid pBSK (Strategene),
resulting in
construct pBSK.Bry-5'. Approximately 2 kb of the region immediately upstream
of the
*Trade-mark
CA 02487058 2004-11-15
WO 2004/098490
PCT/US2003/015658
start codon were sequenced to identify appropriate primer annealing sites for
the
construction of vectors.
Oligos 5'-GCTAGCTAATGGATCCA-3' / 5'- GATCTGGATCCA
TTAGCTAGCTGCA-3 'and 5'-
GATCTTAATGAACGGCAGGTGGGTGCGCGTCCGGA G-3' /
5 'TCGACTCCGGACGCGCACCCACCTGCCGTTCATTAA-3 were inserted into the
PstI/SalI sites of plasmid pBSK to create a new, more suitable polylinker with
two
successive translational stop codons and an artificial 3' splice site
(construct pBry-AA).
Plasmid pEGFP.C1 (Clontech) was double-digested with NheI/Bg111 and the
resulting ¨
760bp DNA fragment encoding EGFP without stop codon was cloned into the
NheI/BglII
sites of pBRY-AA, resulting in construct pBry-AB. An XhoI/SalI fragment of
plasmid
pL2-Neo2 carrying a loxP-flanked neomycin resistance gene was inserted into
the Sall
site of pBry-AB to give rise to plasmid pBry-AC (transcription of EGFP and Neo
in same
direction).
A 556 bp XmaI/MluI fragment carrying a consensus splice donor site, an
artificial
intron, a splice acceptor site and a short exon including the SV40
polyadenylation
sequence, was excised from the commercial expression vector pBK-CMV
(Stratagene).
This fragment was inserted into plasmid pBry-AC in the following way: the XmaI
end
was ligated into the BspEI site following the last EGFP codon, whereas the Mlu
end was
inserted along with oligos 5 '-CGCGTTACTAGTAAGACGTCT-3' / 5'-CCGGAGA
CGTCTTACTAGTAA-3' as linkers into the BspEI site located just upstream of the
loxP-
neo-loxP cassette. Resulting construct: pBry-AE. An ¨1.9 kb XhoI/SalI fragment
encoding the HSV thymidine kinase gene was inserted into the XhoI site of pBry-
AE to
allow selection against random integration (construct pBry-AH). A
NotI/Eco47Ill
fragment encoding the "short arm" of homology was excised from pBry-AF and
cloned
into the NotI/Eco4711I sites of pBry-AH to give rise to plasmid pBry-AL The
"long arm"
of homology was excised from pBry-AK with SalI and inserted in the correct
orientation
into the Sail site of pBry-AI to yield final targeting vector B.
Embryonic stem cells (E14. 1, 129/01a Hooper etal. (1987) Nature 326:292) were
electroporated with NotI-linearized targeting vector pBry-AM. Four dishes with
transfected cells were subjected to G418 single-and another four dishes to
G418 +
Gancyclovir (Ganc) double-selection. Clones that had undergone a homologous
recombination event were identified by PCR with one primer (5 '-
CAGGTAGAACCCACAA CTCCGAC-3') annealing to genomic sequences in the 5'
16
CA 02487058 2004-11-15
WO 2004/098490
PCT/US2003/015658
region of the Bry gene, just upstream of the "short arm of homology", the
other (5 '-
CCGGACACGCTGAACTTGTGGC-3') to the 5' portion of EGFP (diagnostic band:
approximately 1.3 kb). Correctly targeted clones were confirmed by Southern
blot
analysis: genomic DNA of candidate clones was digested with HincII and
hybridized to a
probe located outside of the targeting construct. The probe was derived from
the Bry
5'flanking region (-2018 to ¨1249 with respect to the Bry ATG start codon) by
PCR
using the oiigonucleotide pair 5'-ACAGGATCCCTAAGCCTCAAAAGAGTCGCT-
3 '/5 ' -TCTTGGATCCTCCTAT CCTATCCCGAAGCTCCT-3' . 384 G418 single- and
80 G418 + Ganc double-selected clones were screened, of which 4 respectively 3
proved
to be positive, corresponding to a targeting efficiency of 1.04% and 3.75%.
Two positive
clones were transiently transfected with a modified Cre recombinase expression
vector to
remove the neo gene. These targeted clones are referred to hereinafter as GFP-
Bry ES
cells.
Brachyury is expressed transiently in developing EBs with the onset preceding
the
expression of genes that define the establishment of the hematopoietic and
endothelial
lineages. To determine whether GFP expression in GFP-Bry ES cells accurately
reflects
expression of the brachyury gene during EB development, GFP expression was
assessed.
A typical expression pattern during a 6-day EB differentiation period is shown
in
Figure 2A. In this experiment, low levels of message were detected within 24
hours of
differentiation. Expression was upregulated over the next 48 hours, persisted
through day
4 and then declined sharply to undetectable levels by day 6 of
differentiation. GFP
expression, as defined by FACS analysis, followed a similar temporal pattern.
Low levels
of GFP + cells (-5%) were detected as early as day 2 of differentiation. More
than half
(65%) of the EB-derived cells expressed GFP at day 3 and almost all the cells
were
positive at day 4 of differentiation. As observed by PCR, expression dropped
sharply after
this point and by day 6 few, if any, GFP + cells were present. This rapid
decline in GFP
expression indicated that it did not persist within the cells for extended
periods of time.
The high proportion of GFP+ cells at days 3 and 4 of differentiation suggests
that
development of mesoderm within the EBs under these conditions is extensive.
Taken
together, these findings indicate that GFP expression accurately reflects
expression of the
brachyury gene during EB development.
The possibility that inactivation of a single brachyury allele could have
detrimental effects on the in vitro developmental potential of the ES cells
was assessed.
As indicated, heterozygous mice demonstrate a mild phenotype. To determine if
the GFP-
17
CA 02487058 2004-11-15
WO 2004/098490
PCT/US2003/015658
Bry ES cells display any detectable defects in hematopoietic development, EBs
generated
from them were analyzed for hematopoietic precursor and blast colony-forming
cell (BL-
CFC) content and for gene expression patterns. The data in Figures 3A and 3B
indicate
that GFP-Bry ES cells generate comparable numbers of primitive (EryP) and
definitive
(Eryd, Mac, Mac/Ery, and Mix) hematopoietic precursors and BL-CFC compared to
the
wild type cells. Gene expression patterns (Figure 3C) confirmed the precursor
analysis
and show little difference between the EBs generated from the GFP-Bry and wild
type ES
cells. Both sets of EBs showed a decline in Rex-1 expression over the first 3
days of
differentiation. Rex-1 is a transcription factor that is expressed in ES cells
and
downregulated as they undergo differentiation. Rogers et al. (1991)
Development
113:815-24. The decline in Rex-1 is followed by the typical transient wave of
brachyury
expression which immediately precedes the onset of genes involved in the
development
of the hematopoietic and endothelial lineages. Fik-1, a receptor tyrosine
kinase essential
for the establishment of these lineages (Shalaby et al. (1995) Nature 376:62-
6) is
expressed between day 3 and 6 of differentiation. GA TA-1, a hematopoietic
transcription
factor, and the embryonic and adult globin genes, 18H1 and &ajar, were
detected at low
levels at day 4 of differentiation. Expression of all 3 genes was upregulated
over the next
24 hours, reflecting the expansion and maturation of the primitive erythroid
lineage at this
developmental stage. Palis et al. (1999) Development 126:5073-84. The
precursor
numbers and the gene expression patterns observed in this example are
consistent with
those found in previous studies and indicate that the molecular programs
leading to the
establishment of the hematopoietic system are intact in the targeted GFP-Bry
ES cells.
Example 3
Isolation of Brachyury+ Cells
To determine if brachyury + cells could be isolated based on GFP expression,
the
GFP + population from day 3.5 EBs was sorted and analyzed for expression of
appropriate
genes. Figure 4A shows the gates used for the isolation of the GFP positive
(2) and
negative(1) populations. RT-PCR analysis revealed brachyury expression was
restricted
to the GFP + fraction indicating that cell sorting based on GFP expression can
be used to
isolate brachyury + cells. Flk-1, one of the earliest makers of hematopoietic
and
endothelial development, was present at higher levels in GFP + that in the GFP-
fraction
indicating that it was expressed in at least a subpopulation of brachyury +
cells. In contrast
to brachyury and Flk-1, Pax-6, a gene involved in early neuronal development
[79,80],
was expressed at higher levels in the GFP- fraction consistent with precursors
of this
18
CA 02487058 2004-11-15
WO 2004/098490
PCT/US2003/015658
lineage being brachyury negative. These cell-sorting studies indicate that
expression of
GFP under the control of the brachyury locus provides a novel marker for the
isolation,
characterization and manipulation of brachyury + cells from EBs.
This example demonstrates that GFP + cells can be isolated from day 3.5 EBs by
cell sorting. Gene expression analysis of the GFP + and GFP- fractions shows
that
brachyury expression segregates predominantly to the positive fraction, a
finding which
clearly demonstrates that fractionation based on GFP provides a method for
isolating
brachyury positive cells. In addition to brachyury, the receptor tyrosine Flk-
1 involved in
early hematopoietic and endothelial development is also expressed at higher
levels in the
positive than in the negative fraction. In contrast, Rex-1 and Pax-6, markers
of early
ectoderm and neuroectoderm, are expressed in the GFP- fraction. These findings
demonstrate that expression of GFP in the context of brachyury can be used to
separate
mesoderm from ectoderm.
Example 4
Separation of Brachyury Positive Cells
into Subpopulations Based Upon Flk-1 Expression
Flk-1 has been shown to be essential for the establishment of the
hematopoietic
and endothelial lineages in the early embryo and is expressed on the earliest
precursors of
these lineages, including the BL-CFC [Faloon et al. (2000) Development
127:1931-41].
Given this pivotal role in blood and vascular development, its expression
within the GFP+
population was hypothesized to define a subpopulation of mesoderm undergoing
specification to these lineages. To investigate this possibility further, EBs
were analyzed
at several stages Of development for the presence of GFP and Flk-1 positive
cells. In the
experiment illustrated in Figure 5A, 4.8% of the day 3.0 EB population
expressed GFP
but not Flk-1, whereas 1.2% of the cells expressed both markers. The size of
both
fractions increased dramatically over the next 12 hours with the GFP+/Flk-1-
and
GFP+/Flk-1+ cells representing 52% and 26% of the total EB population,
respectively. To
assess the developmental potential of the three populations defined by GFP and
Flk-1
expression, GFP7F1k-1- (fraction 2), GFP+/Flk-1- (fraction 3) and GFP+/Flk-1+
(fraction
4) cells were isolated at both time points and analyzed for BL-CFC and 2 EB
content and
for gene expression patterns. The potential of the fractions was compared to
that of the
pre-sorted population (fraction 1). The majority of the BL-CFC were found in
the
GFP+/Flk-1+ fraction at both day 3.0 and 3.5 of differentiation (Figure 5B).
This is not
surprising given that previous studies have shown that all BL-CFC express Flk-
1. The 2
19
CA 02487058 2004-11-15
WO 2004/098490
PCT/US2003/015658
EB were restricted to the GFP1F1k-1" fraction, a finding consistent with the
fact that they
derive from residual undifferentiated ES cells in the primary EBs. The
GFP+/Flk-1"
fraction generated few colonies under the conditions used in these cultures.
The gene
expression analysis revealed some interesting differences between the
populations
isolated at the 2 time points (Figure 5C). Rex-1, the ES cell marker, was
expressed at
lower levels in the GFP+ than in the GFIT fraction, indicating that these
populations are
undergoing differentiation. Brachyury was expressed in the GFP+ fractions at
both time
points. The levels appear to be higher in the GFP+/Flk-1- than the GFP+/Flk-1+
fraction
isolated from day 3.5 EBs, suggesting that its expression could be
downregulated as these
cells mature towards the hematopoietic and endothelial lineages. As expected,
Flk-1 was
expressed predominantly in the GFP+/Flk-1+ cells at both time points. Scl, a
helix-loop-
helix transcription factor that is essential for both primitive and definitive
hematopoietic
development (Shivdasani et al. (1995) Nature 373:432-4), appears to be
restricted to the
GFP+/F1k-1+ fraction. Similarly, the transcription factor Runxl, required for
establishment of the definitive hematopoietic system (Wang et al. (1996) Proc.
Natl.
Acad. Sci. 93:3444-9), was most readily detected in GFP+/Flk-1+ fraction.
There was
some Runxl expression in the GFP+/F1k-1" fraction isolated from day 3.0 EBs.
Nodal is
expressed in all 3 fractions at day 3 of differentiation. At day 3.5, the
levels of expression
in the GFP+/Flk-1+ fraction appear to be significantly lower than in the other
fractions.
Wnt3a and Wnt8a showed a remarkably restricted pattern of expression and were
found
only in the GFP+/Flk-1" fraction at both time points, consistent with an early
mesoderm
function prior to the expression of lineage restricted markers. BMP2 was
expressed in
both GFP+ fractions whereas BMP4 was found predominantly in the GFP+/Flk-1+
cells,
indicating that these molecules play a role at distinct stages of development
in this
system. The BL-CFC potential and gene expression pattern of the GFP+/Flk-1+
cells
indicates that they are representative of the extraembryonic mesoderm found in
the mouse
embryo.
This example demonstrates that the brachyury fraction of day 3 and day 3.5 EBs
can be separated into two fractions based on Flk-1 expression: brachyury+
(GFP+/Flk-1") and brachyury+/Flk-1+ (GFP+/Flk-1+) (Figure 5A). Functional
studies
demonstrated that precursors (BL-CFC) able to generate both hematopoietic and
endothelial cell segregated to the (GFP+/Flk-l+) fraction, suggesting that
upregulation of
Flk-1 is indicative of commitment to these lineages (Figure 5B). Gene
expression studies
CA 02487058 2004-11-15
WO 2004/098490
PCT/US2003/015658
demonstrated distinct differences between the GFP+/Flk-1- and GFP+/Flk-1+
populations
(Figure 5C).
Example 5
Developmental Relationships
among the GFP/FLK Fractions
The expression patterns observed in Figure 5 are consistent with the
interpretation
that the three fractions represent a developmental continuum with the GFP1F1k-
1" cells
giving rise to the GFP+/Flk-1- cells which in turn give rise to the GFP+/Flk-
1+ cells. To
determine if these fractions do represent specific stages within a common
developmental
pathway, each was isolated from day 3 EBs, cultured for 20 hours and then re-
analyzed
for GFP and Flk-1 expression. BL-CFC and EryP-CFC potential was determined for
each
of the populations prior to and following culture. The isolated cells were
cultured at
densities of 1x10⁵ cells or greater in petri-grade 24-well plates in the same
medium used
for EB differentiation. Under these conditions, the cells rapidly reaggregate
and form EB-
like structures that appear to follow a normal developmental program with
little
expansion or loss in cell number. Following the 20-hour reaggregation culture,
the GFP-
/Flk-l- cells gave rise to a significant population of GFP+/Flk-1- cells as
well as to a small
number of GFP+/Flk-1+. GFP+/F1k-1" cells generated a substantial population of
GFP+/Flk-1+ cells during the same culture period. The GFP+/Flk-1+ population
appeared
to lose some GFP and Flk-1 expression following the reaggregation culture.
Results are
shown in Figure 6. The changes in precursor potential were consistent with the
changes in
surface markers. The GFIT/F1k-1- fraction, the most immature of the three,
contained an
undetectable number of BL-CFC and EryP-CFC before or after culture. The
GFP+/Flk-1-
fraction also contained few BL-CFC and EryP-CFC prior to culture. However,
following
culture, the BL-CFC potential increased dramatically, from 74 to 1564 per 105
cells,
consistent with the increase in Flk-1 expression. The frequency of EryP-CFC
did not
change during the culture period. The GFP+/Flk-1+ fraction contained BL-CFC
but few
EryP-CFC prior to culture. No BL-CFC were detected following culture, however,
the
population now contained EryP-CFC. Together with the surface marker analysis,
these
precursor data support a developmental progression from a pre-mesoderm
(GFP1F1k-1")
to a mesoderm/pre-hemangioblast (BL-CFC) population (GFP+/Flk-r) to a
hemangioblast/pre-erythroid population (GFPf/Flk-1+) to a post
hemangioblast/erythroid
population (possibly GFP1'/Flk-11 ). Not all the cells in a given population
appear to
21
CA 02487058 2004-11-15
WO 2004/098490
PCT/US2003/015658
differentiate following the 20-hour culture period as cells with the starting
phenotype
persisted in the GFIY/Flk-1- and GFP+/Flk-1" cultures.
This example indicates that when isolated and recultured for 20-24 hours, each
of
the three populations isolated from day 3 EBs continued to differentiate and
in a pattern
that indicates that these populations represent a developmental continuum. For
instance,
GFP7F1k-1" gave rise to GFP+/Flk-1- cells which in turn gave rise to GFP+/Flk-
1+. These
changes in cell surface characteristics were associated with the expected
changes in
developmental potential. The GFP+/Flk-i- fraction contained few
hematopoietic/endothelial precursors (BL-CFC) prior to culture. Following
culture, these
precursors were detected, clearly demonstrating that the GFP+/Flk-1- fraction
from day 3
EBs does contain the potential to give rise to Flk-1+ cells with hematopoietic
and
endothelial potential.
Example 6
Potential of GFP/F1k-1" Cells
The foregoing examples demonstrated that GFP+/Flk-1" cells isolated from day
3.0
EBs efficiently generated GFP+/Flk-1+ cells and BL-CFC following overnight
culture. To
determine if this pre-BL-CFC potential was specific to the GFP+/F1k-1-
fraction isolated
at this stage of development, GFP+/Flk-1- cells from different aged EBs were
assayed for
their ability to give rise to BL-CFC. As shown in Figure 7A, the capacity to
generate BL-
CFC was most robust in the day 3 GFP+/Flk-1" cells. This developmental
potential
decreased dramatically by day 3.5 of differentiation and was almost non-
existent at day
4Ø The BL-CFC content of the freshly isolated GFP+/Flk-1+ fraction from
these same
EBs increased over this period of time, indicating that differentiation was
progressing in a
normal fashion. The Flk-1 expression patterns in the reaggregated cultures
from the
different staged EB cells were consistent with BL-CFC data. The cultures from
the
reaggregated day 3.0 GFP+/F1k-1- cells contained a distinct Flk-1 fraction
that represented
more than 40% of the total population (Figure 7B). Flk-1 expression in the day
3.5 and
4.0 cultures was significantly lower and consisted of a shoulder of the total
population
rather than a distinct peak.
Example 7
Cardiomyocyte Potential of GFP and Flk-1 Subpopulations
Given the sequence of events in the mouse embryo in which the development of
hematopoietic and endothelial mesoderm is followed by the development of
cardiac and
cranial mesoderm, the cardiomyocyte potential of the isolated populations was
22
CA 02487058 2004-11-15
WO 2004/098490 PCT/US2003/015658
determined. For this analysis, aggregates from the cultures of the different
populations
were transferred to microtiter or 24-well plates in serum-free medium and
monitored for
the development of beating cell masses, indicative of cardiomyocytes. These
conditions
are known to support the efficient development of cardiomyocytes from the
reaggregated
cells. As an independent confirmation of the cardiomyocyte nature of the cells
within
these masses, a representative group was transferred to microscope slides,
fixed and
stained for the presence of the cardiac-specific isoform of Troponin T. All
beating cell
masses analyzed were found to contain Troponin T positive cells indicating
that they
were cardiomyocytes. Using this assay, the cardiomyocyte potential of the
reaggregated
GFP+/Flk-1- and GFP+/Flk-1+ fractions from different staged EBs was
determined. For
comparison, the BL-CFC potential of the freshly isolated GFP+/Flk-1+ cells and
of the
cultured GFP+/F1k-1- cells was analyzed.
EB GFP+F1k GFP+ FIk+
Age
BL-CFC beating following BL-CFC beating following
following culture culture direct plating culture
2.75
3.5 -H- I I I
4.0 +/- ++ ti
Table I: BL-CFC, pre-BL-CFC and cardiomyocyte potential of the GFP+/Flk-1- and
GFP+/Flk-1+ fractions isolated from different staged EBs.
As shown in Table 1, the BL-CFC potential of the different fractions was
similar
to that observed in previous experiments. The GFP+/F1k-1+ cells isolated from
the three
different EB populations generated BL-CFC, with the highest number found at
day 3.5
and 4Ø The pre-BL-CFC potential in the GFP+/Flk-1- cells was greatest at day
2.75 and
decreased significantly at 3.5 and 4Ø The cardiomyocyte potential of the
fractions
showed a reverse pattern. A significant proportion (>80%) of the transferred
aggregates
from day 3.5 and 4.0 GFP+/Flk-1" cells generated beating cardiomyocytes. No
beating
cells were observed in the aggregates generated from the earliest (day 2.75)
GFP+/Flk-1"
cells. Beating cells were not detected in aggregates generated from the
GFP+/F1k-1+ cells
isolated from EBs at any of the three stages of development. The findings from
this
analysis are consistent with the notion that GFP+/F1k-1- cells isolated at
different stages
23
CA 02487058 2004-11-15
WO 2004/098490
PCT/US2003/015658
have different potentials. Those that develop early appear to have a
hemangioblast fate,
whereas those that develop later generate the cardiac lineage and possibly
other
populations. The GFP+/Flk-1+ populations appear to have lost the cardiomyocyte
potential
and may be restricted to the hemangioblast lineages. Given these findings, the
early
developing (day 2.75-3.0) GFP+/Flk-1- cells are referred to as pre-
hemangioblast
mesoderm whereas the population that develops between day 3.5 and 4.0 are
referred to
as pre-cardiac mesoderm. The day 3.0-3.5 GFP+/Flk-1+ populations generate BL-
CFC,
whereas those isolated from later stage EBs (day 4.0) contain primitive
erythroid
progenitors, indicating the onset of hematopoietic commitment. Given this
developmental
potential, the GFP+/Flk-1+ population is referred to as hemangioblast
mesoderm.
Examples 5 and 6 demonstrate that GFP+ cells isolated from different aged EBs
have different developmental potential. As indicated in the previous examples,
GFP+/Flk-
i- cells from day 3 EBs efficiently generate both hematopoietic and
endothelial lineages.
These cells did not give rise to cardiotiyocytes (heart tissue) as
demonstrated by the lack
of beating cell masses. In contrast, GFP+ cells from day 4 EBs gave rise to
few Flk-1+
cells and BL-CFC following culture. This population did, however, generate
cells of the
cardiomyocte lineage. These findings demonstrate that the GFP+ (brachyury4)
fraction
isolated from different aged EBs have become patterned to distinct populations
with
different developmental fates. In addition to the conditions used and
potentials observed
in the foregoing examples, other potentials may be observed by altering
conditions and
additives.
Example 8
Role of Serum-Derived Factors
To assess the role of serum in the development of brachyury+ cells, EBs were
differentiated the absence of serum. EBs did develop under these conditions,
although
they were somewhat smaller than those found in normal conditions. In the
absence of
serum, no GFP+ cells were detected within these EBs, indicating that mesoderm
was not
induced under these conditions (Figure 8). Significant numbers of GFP+/Flk-1-
and
GFP+/Flk-1+ cells did develop when serum was added to the cultures. These
findings
clearly demonstrate that components found within serum are able to induce the
development and differentiation of brachyury+ cells. As a first step in
identifying factors
that might play a role in this process, BMP4 (20ng/m1) was added to the
developing EBs
in the serum free cultures. At this concentration, BMP4 did induce a
significant
population of brachyury+ cells within 3 days of differentiation. However, in
contrast to
24
CA 02487058 2004-11-15
WO 2004/098490
PCT/US2003/015658
the serum, BMP4 did not support the development of the GFP+/Flk-1+ population
in this
period of time. To determine if BMP4 could induce GFP+/Flk-1+ from GFP+/F1k-1"
cells
that were induced in the presence of serum, GFP+/Flk-1- cells were isolated
from EBs
differentiated for three days in the presence of serum. These cells were
reaggregated in
medium alone, in medium with serum or in medium with BMP4. As shown in the
lower
row of Figure 8, GFP+/Flk-1- cells did not differentiate substantially when
reaggregated in
the absence of serum. As expected, the same population generated a large
GFP+/Flk-1+
population when serum was added to the cultures. Consistent with the findings
in the
primary differentiation cultures, BMP4 was unable to induce the development of
significant numbers of GFP+/Flk-1+ cells from the cultured GFP+/Flk-1" cells.
Fig.9 summarizes the stages in mesoderm development based upon the foregoing
examples. Step #1 represents mesoderm induction and patterning to a pre-
hematopoietic
and endothelial (pre-hemangioblast) fate. Step #2 represents specification to
the
hematopoietic and endothelial lineages. Steps #3 and #4 represent patterning
to the pre-
cardiac fate.
Example 9
Isolation and Characterization of Endoderm
Potential of Cell Populations
Studies using model systems such as Xenopus and Zebrafish have suggested that
mesoderm and endoderm develop from a common precursor population known as
mesendoderm. To determine whether or not a mesendoderm stage of development
does
exist in EBs, conditions for the development of the endoderm lineage were
established.
As a first step in establishing culture conditions for the development of this
lineage, the
amount of serum in the differentiation cultures was varied. EBs were generated
in the
presence and absence of serum (SP34 and then IMDM plus SR) and assayed at
different
stages for expression of genes associated with ectoderm, endoderm and mesoderm
development. For the ectoderm lineage, development of the neuronal lineage was
assessed analyzing expression of PAX6, Wntl, neruoD and neurofilament (NFL).
These
genes are known to be expressed at different stages of neruonal development.
The early
stages of endoderm development were monitored by expression of HNF3P. To
evaluate
later stages of endoderm development and specification, genes involved in
liver
development were analyzed. These included Hex, a-fetoprotein (AFP), HNF4,
Albumin
(Alb), a¨l-antittrypsin (AAT) and tyrosine aminotransferase (TAT). Mesoderm
development was monitored by expression of brachywy and GATA-1. In addition to
CA 02487058 2004-11-15
WO 2004/098490
PCT/US2003/015658
gene expression patterns, neuronal development was assayed by monitoring
neurite
outgrowth from EBs. The neuronal nature of these neurites was demonstrated by
I3III-
Tubulin expression. Mesoderm development was also assessed by enumeration of
hematopoietic progenitors in the EBs. Figure 10 shows the impact of serum on
the
developmental potential of EBs over a 10-day differentiation period. In the
presence of
serum (serum) there is little neuro-ecotderm differentiation as demonstrated
by the lack of
expression of the genes associated with development of this lineage. HNF3I3 is
expressed
at early stages of differentiation (day 2-3) and then downregulated. As
expected, GATA-
1 is expressed in the EBs generated under these conditions. The pattern of
expression of
these genes was basically reversed in EBs grown in the absence of serum (serum-
). These
EBs expressed all the genes associated with neuroectoderm, but did not express
the
mesoderm/hematopoietic marker GATA-1. HNF3f3 was expressed in late stage EBs
(day
10) grown under these conditions. The patterns of brachyury expression as
monitored by
GFP expression were consistent with these findings. EBs generated in the
presence of
serum generated a substantial brachyury+ population that was present between
days 2 and
5 of differentiation (Figure 11,¨B-line). Brachyury was not detected in EBs
grown in the
absence of serum (Figure 11,-H- line). Hematopoietic precursor assays
confirmed these
findings. EBs generated in serum contained precursors (Figure 12, speckled
bar),
whereas those grown without serum did not (Figure 12, solid bar, not visible).
Finally,
evaluation of neurite potential of the EBs was consistent with these various
analyses.
None of the EBs grown in serum generated neurites. In contrast, 85% of those
generated
in the absence of serum displayed this activity (Figure 13). Taken together,
these findings
demonstrate the importance of culture conditions (serum) for the generation of
specific
lineages. They also demonstrate that neither serum complete- nor serum-free-
conditions
were optimal for endoderm development.
The strong upregulation of HNF313 in the early stage EBs generated in serum
suggested that serum might be important for the establishment, but not the
maturation of
the endoderm lineage. To test this possibility, EBs were initiated for 2 days
in the
presence of serum and then switched to serum-free conditions (SR). As shown in
Figure
14, EBs generated under these conditions (serum+/-) expressed HNF3I3 between
days 3
and 5 of differentiation. AFP was upregulated at day 5 of differentiation.
GATA-1
expression levels were reduced compared to those found in serum-stimulated
EBs. Next,
day 6 EBs generated under the serum+/- conditions were plated in tissue
culture grade
dishes (to allow them to adhere) in the presence of the growth factor bFGF.
The dishes
26
CA 02487058 2004-11-15
WO 2004/098490
PCT/US2003/015658
were coated with either gelatin or matrigel to determine if substrate had any
impact on
further endoderm differentiation. Five days later, the medium was changed and
additional factors were added to these cultures to promote the development of
the liver
lineage. The experimental outline and data are shown in Figure 15. In this
experiment
AFP was not expressed at the day 6 EB stage. Its levels of expression were
upregulated
when cultured in the presence of bFGF on either gelatin of matrigel. Low
levels of ALB
were also detected at this stage. ALB expression increased following the
additional
culture period in all conditions tested. AAT and TAT were also expressed
following the
last culture step. The highest levels of TAT were found when EB-derived cells
were
cultured in the presence of bFGF and Dex. These findings clearly indicate that
it is
possible to generate cells of the endoderm lineage and that under appropriate
conditions,
they will give rise to cells that express genes associated with the developing
liver.
It was further determined if these endodermal cells developed from brachyury+
or
brachyury- cells. To address this question, GFP (Bry)+ and GFP (Bry)- cells
were isolated
from day 2.5 EBs by cell sorting. These populations were allowed to
reaggregate and
cultured as clusters until day 6. On day 6, they were moved to the tissue
culture grade
dishes in medium with bFGF for 4 days (total of 10 days). Gene expression
analysis
indicated that cells, which express HNF313, segregated to the GFP + fraction
(d2.5) (Figure
16). With time in culture, this gene was expressed in cells generated from the
GFP
fraction. This likely reflects the fact that at later stages of expression
HNF3I3 is expressed
in non-endodermal population. APP, HEX, ALB and HNF4 were all expressed in
derivatives of the GFP+ fraction, but not in cell populations generated from
the GFP
cells. In contrast, PAX6 and neuroD, markers of neuroectoderm, were found
predominantly in cells generated from the GFP- fraction. These findings
indicate that the
endoderm lineage is established from a brachyury+ population, which also gives
rise to
the mesodermal lineage, and that these lineages derive from a common
precursor, the
mesendoderm.
To further evaluate the liver potential of the brachyury expressing cells,
cell
populations derived from both the bry+ and bry- fractions were analyzed for
expression
of genes representing early hepatocyte development such as a-fetoprotein
(APP), albumin
(ALB) and transthyretin (TTR) and genes indicative of maturation of the
lineage
including alphal-antitrypsin (AAT), tyrosine aminotransferase (TAT) and
carbamoyl
phosphate synthetase I (CPase). 13-actin expression was used as a control.
Cells were
27
CA 02487058 2004-11-15
WO 2004/098490
PCT/US2003/015658
analyzed prior to sorting and subsequent to sorting into bry+ and bry"
populations. Fetal
liver and adult liver controls were also analyzed. Expression of all of these
genes was
restricted to the cells derived from the bry+ population, indicating that
cells with
hepatocyte characteristics develop from brachyury expressing cells.
Example 10
Kinetics of Mesoderm and Endoderm Development in EBs
The preliminary kinetic analysis described in Example 6 demonstrated that
subpopulations of mesoderm with distinct developmental fates were generated in
a
defined temporal fashion. A more detailed kinetic analysis showed the dynamic
development of the GFP+Flkr (hereafter referred to as the GFP+ population)
population
between days 2.5 and 4.0 of differentiation (Figure 18). When isolated and
reaggregated,
the day 2.5 and 3.0 GFP+ fractions generated blast cell colonies (indicated as
hemangioblast potential in Figure 19) that represent the earliest stages of
hematopoietic
and endothelial commitment (Figure 19). This population of GFP+ cells
displayed little
cardiomyocyte (cardiac) potential. In contrast to the early GFP+ cells, those
isolated from
day 3.5 EBs showed significantly reduced BL-CFC potential, but were efficient
at
differentiating into cardiomyocytes. GFP+ cells isolated from day 4 EBs did
not give rise
to cardiomyoctes and had little capacity to generate BL-CFC, suggesting they
may be
fated to some other mesodermal lineage. Gene expression analysis supported
these
functional assays and demonstrated molecular differences between the four GFP+
fractions (Figure 20). While some genes were expressed in all populations,
others
showed intriguing differential patterns. Wnt3a, a gene thought to be important
for
hematopoietic development and inhibitory for cardiac differentiation, was
expressed in
the day 2.5 and 3.0 populations and down regulated in the day 3.5 and 4.0
cells. This
pattern is consistent with the change in developmental potential of these
populations from
hematopoietic/vascular to cardiac muscle. A second pattern of interest is that
of the gene
Mix1-1. This gene, which plays a role in the development of mesoderm and
endoderm,
was expressed in the day 2.5 and 3.0 GFP populations but not in the day 3.5
and 4.0
fractions. Taken together, the findings of this example clearly demonstrate
that
mesoderm populations with different developmental potential are generated in a
defined
temporal pattern within the EBs. In
addition, expression analysis of the
mesoderm/endoderm gene Mix1-1 indicates that cells with endoderm potential are
also
generated at a specific time, namely between day 2.5 and 3.0 of
differentiation.
28
CA 02487058 2004-11-15
WO 2004/098490
PCT/US2003/015658
To further investigate the kinetics of endoderm development, GFP+ cells from
day
3.0 and 4.0 EBs were isolated and cultured under conditions that promote the
differentiation into hepatocyte-like cells. As shown in Figure 21, GFP+ cells
(+/-)
isolated from day 3.0 but not those from day 4.0 displayed endoderm potential
as defined
by expression of HNF3p. These findings indicate that endoderm is generated
within the
GFP+ population at a specific period of time, prior to day 4 of
differentiation.
Example 11
Developmental Potential of GFP+ populations in vivo
To further evaluate the endoderm potential of the GFP+ population, GFP+ and
GFP" day 2.5 EB cells were cultured for 14 day days under conditions known to
promote
hepatocyte differentiation and then transplanted under the kidney capsule of
recipient
SCID-beige mice. Several mice were sacrificed immediately following the
transplant, the
kidney with the graft was sectioned and the sections were stained with
antibodies against
Hep 1 and AFP. Hep 1 is a specific marker of hepatocytes whereas AFP is
expressed in
definitive endoderm and immature cells of the hepatocyte lineage. Some of the
cells
within the section stained positive for Hep 1, whereas other cells, in the
vicinity of the
Hep 1+ cells were found to express AFP. No Hepl+ or AFP + cells were found in
the graft
of the GFP" negative cells. These findings support PCR data and demonstrate
that there
culture conditions support the development of cells with characteristics of
immature
hepatocytes, as defined by express of Hepl.
While these transplantation experiments demonstrate the presence of hepatocyte-
like cells in the grafts immediately following transplantation, it was
difficult to monitor
the maturation of these populations over time, as the transplanted tissues
generated
tumor-like masses known as teratomas. The teratomas likely develop from
contaminating
undifferentiated ES cells or from GFP+ primordial germ cells that are known to
be of
mesoderm origin and to express brachywy.
Example 12
Induction of Mesoderm and Endoderm by Activin
To further enrich for cells with endodermal potential, the effects of growth
factors
known to induce this cell population in other model systems were tested.
Studies in
Xenopus have shown that activin will induce both mesoderm and endoderm from
ectoderm in culture. Of particular interest was the observation that activin
behaved as a
morphogen in this model in that it induced different cell types at different
concentrations
used. To determine if activin displayed similar potential in the ES/EB system,
it was
29
CA 02487058 2009-09-29
added to the EB cultures using the following protocol. ES cells were
differentiated for 2
days in Stem Pro 34 medium without serum. At this stage, the developing EBs
were
harvested and recultured in IMDM supplemented with serum replacement (serum
free)
and activin at a concentration of 100 ng/ml. EBs were harvested at different
days and
assayed for GFP + expression and expression of genes indicative of ectoderm,
mesoderm
and endoderm development. As shown in Figure 22A,B this amount of activin-
induced
brachyury as measured by GFP. While the kinetics of GFP induction was delayed
compared to EBs differentiated in serum, this concentration of activin did
induce
substantial numbers of brachyury positive cells (60%) by day 6 of
differentiation.
Molecular analysis indicated that the activin-induced cells expressed a broad
spectrum of
genes associated with endoderm development including HMV, Mix1-1, Sox17, Hex-
1,
and pdx-1 (Figure 23C). Induction of pdx-I is of interest, as this gene is
essential for
pancreas development. Genes associated with hematopoietic development, such as
GA TA-1 and those indicative of neuroectoderm differentiation such as PAX6
were not
induced by activin.
To determine if activin displayed morphogenic properties in the ES
differentiation
model, different concentrations of the factor were added to the EB cultures.
As little as 1
ng/ml of activin induced GFP+ expression (10% of the total population) by 7
days of
culture (Figure 23A). The frequency of GFP + cells increased to 40% in
cultures
stimulated with 3ng/m1 and reached plateau levels of greater than 50% at
3Ong/ml. Gene
expression analysis of these populations indicated that different
concentrations of activin
did induce different developmental programs. EB differentiated in the presence
of 1 or 3
ng/ml of activin showed weak, if any, expression of the genes indicative of
endoderm
development (Figure 23A). HMV, Sox17, Hex-1 were all induced in cultures
stimulated
with 10, 30, or 100 ng/ml of activin. Par-1 expression required the highest
amount of
activin and was induced best in EBs stimulated with 10Ong/ml. Neither GATA1
nor c-fins
was expressed at any concentration of activin. The pattern of PAX6
expressionvas the
reverse to that of the endoderm genes and was downregulated with increasing
concentrations of activin.
Activin-induced EBs did not express genes associated with hematopoietic
commitment indicating that this developmental program was not induced. To
further
evaluate the hematopoietic potential of these EBs, they were analyzed for
progenitor
potential. As expected from the molecular analysis, these EBs contained no
appreciable
=
numbers of primitive (Ep) or definitive (mac/mix) hematopoietic progenitors
(Figure
*Trade-mark 30
CA 02487058 2004-11-15
WO 2004/098490
PCT/US2003/015658
24A). When these activin induced EBs were further stimulated with serum for
2.5 days,
however, they did generate some hematopoietic progenitors, indicating that
they do
contain mesodermal potential (Figure 24B).
PCR analysis demonstrated that activin induced expression IINF3fl as well as
other genes known to be involved in endoderm differentiation. To better
estimate the
proportion of endodermal progenitors in the activin-induced EBs, cells from
cultures
stimulated with 10Ong/m1 activin were stained with antibodies against HNF313
and Hex 1.
EBs from un-induced cultures were used as controls (Activin-). A significant
portion of
the activin induced population (estimated at 50-60% of total) expressed both
HNF3f3 and
Hexl . None of the cells in the un-induced EBs expressed these proteins. These
findings
clearly demonstrate that a substantial number of cells within these EBs are of
the
endoderm lineage.
To further investigate the potential of these activin-induced populations,
GFP+
cells were isolated from EBs stimulated with 3ng or 10Ong and cultured further
(14 day
total) in hepatocyte conductions. As shown in Figure 25, only cells from the
10Ong
cultures differentiated into cells that expressed albumin consistent with
liver
differentiation. Taken together, the findings from these studies indicate that
activin
functions as a morphogen in the ES/EB system and that high concentration are
required
for endoderm induction.
If the teratomas generated by the serum-induced brachyury+ cells resulted from
the presence of primordial germ cells, it is possible that the activin induced
cells may
represent a better source of progenitors for transplantation, as the germ-cell
program may
not be induced under these conditions. To test this hypothesis, GFP+ and GFP"
cells were
isolated from EBs induced with 100 ng/ml of activin and cultured for 14 days
to promote
the differentiation of hepatocyte-like cells. Following this culture period,
the cells were
harvested and transplanted to the kidney capsule of recipient animals. Three
weeks
following transplantation, the mice were sacrificed and the kidneys analyzed.
Results are
shown in Figs. 26A-C. All mice engrafted with GFP" cells developed large,
multilineage
teratomas, consisting of cells from all three germ layers. In contrast, no
teratomas were
detected in the animals transplanted with GFP+ cells. These cells give rise to
differentiated cell masses consisting of endodermal and mesodermal derived
tissues
including gut epithelium, bone and skeletal muscle. In some instances, skin
was also
,
observed in the graft from the GFP+ cells, suggesting that this lineage might
also develop
from a bry+ cell. These findings indicate that it is possible to generate GFP+
populations
31
CA 02487058 2004-11-15
WO 2004/098490
PCT/US2003/015658
from a bry+ cell. These findings indicate that it is possible to generate GFP+
populations
that give rise to differentiated tissue without forming teratomas following
transplantation.
Example 13
Developmental potential of bry+/c-kit- and bry41c-kit+ cells
The foregoing exmples clearly indicate that the hepatocyte lineage develops
from
a bry+ cell population that has both mesoderm and endoderm potential. Analysis
of the
bry+ fraction revealed that a subpopulation of these cells expressed the
receptor tyrosine
kinase c-kit (Figure 27A) and that this population was distinct from those
cells that
expressed Flk-1. To determine if c-kit expression could be a useful marker for
the
segregation of cell with endodermal potential, bry+/c-kit- (+/-) and bry+/c-
kit+ (+1+) cells
from day 3 serum-stimulated EBs were assayed for hepatocyte potential. As
shown in
Figure 27B, HNF313 , AFP and ALB expressing cells were all derived from bry+/c-
kit+
population. To estimate the endodermal potential of this fraction, sorted
cells were plated
onto glass coverslips and stained with an antibody to HNF313. Greater than 80%
of the
bry+/c-kit+ cells expressed HNF313 protein, whereas less than 10% bry+/c-kit-
were
positive. These findings indicate that endodermal progenitors express both
brachyury and
c-kit and that this population is highly enriched for cells with endoderm
potential.
Isolation of cells based on brachyury and c-kit expression provides a novel
strategy for
the isolation of endodermal progenitors.
Example 14
Developmental potential of activin-induced cells
The PCR analysis presented in Figure 23 indicates that different
concentrations of
activin induce different developmental programs and that cells with endodermal
potential
are induced with the highest levels of this factor. To quantify the
differential response of
activin, cells stimulated with different concentrations of activin were
adhered to
coverslips and stained with the anti-HNF313 antibody. More than 50% of the
entire EB
population stimulated with 10Ong/m1 of activin expressed HNF313 whereas only
10% of
the cells stimulated with 3ng/m1 were positive. Only background levels of
staining were
observed in the non-stimulated population. These findings demonstrate that
high
concentrations of activin can stimulate a robust endodermal program,
representing a
significant portion of entire EB population.
32
CA 02487058 2004-11-15
WO 2004/098490
PCT/US2003/015658
As a further assessment of the potential of activin treated cells, day 6 EBs
differentiated in the presence of different concentrations of this factor were
transferred to
serum replacement media for 4 days and then replated in hepatocyte conditions
for an
additional 4 days. At day 14 of culture, the cells from each group were
harvested and
subjected to PCR expression analysis. Expression of Myf5 and skeletal actin
were
monitored to evaluate skeletal muscle development representing an additional
mesoderm-
derived lineage. Surfactant protein C (SP-C), a lung-specific gene, was
included as a
marker of endoderm differentiation in addition to AFP and ALB. As shown in
Fig. 28,
Myf5 and skeletal actin were expressed in cultures stimulated with as little
as lng/ml of
activin and this expression was detected over a broad range of factor
concentrations.
Expression of both genes was, however, downregulated at the highest
concentration of
activin (10Ong/m1). Cultures stimulated with low amounts of activin contained
groups of
cells with the morphology of skeletal muscle. Immunostaining demonstrated that
these
cells expressed both skeletal myosin and a-actinin, indicating that they are
of the skeletal
muscle lineage. Evaluation of the proportion of replated EBs that generated
skeletal
muscle outgrowths was consistent with the gene expression analysis, as those
stimulated
with 3 and 10 ng/ml displayed the most robust skeletal muscle development as
depicted in
Fig. 28. The expression patterns of the three endodermal genes differed from
that
observed for the skeletal muscle genes. None were expressed at low activin
concentrations and all were readily detected in cultures stimulated with the
highest
concentrations of the factor. Expression of PAX6 was restricted to untreated
cultures and
those stimulated with low concentrations of factor. The findings from this
analysis
confirm and extend those from Example 12 hereinabove in demonstrating that
different
concentrations of activin induce different developmental programs, with low
concentration favoring a mesodermal fate and high concentrations an endoderm
fate. In
addition, these results indicate that the endodermal cells induced by activin
are able to
differentiate and give rise to cells with hepatocyte and lung characteristics.
Brachyury positive and negative populations isolated from EBs stimulated with
low and high concentrations of factor were also analyzed for expression of the
skeletal
muscle and endoderm genes. As shown in Figure 29, both myf5 and skeletal actin
expression were restricted to the population generated from the bry+
population isolated
from EBs stimulated with 3ng/m1 of activin. Similarly, the endoderm genes were
expressed in the brachyury+-derived cells isolated from EBs generated in the
presence of
33
CA 02487058 2004-11-15
WO 2004/098490
PCT/US2003/015658
10Ongiml of factor. These findings further demonstrate that both mesoderm and
endoderm develop from brachyury+ cells.
34
CA 02487058 2006-06-15
SEQUENCE LISTING
<110> Mount Sinai School of Medicine of New York University
<120> Mesoderm and Definitive Endoderm Cell Populations
<130> PAT 61565W-1
<140> CA 2,487,058
<141> 2003-05-19
<150> US 60/444,851
<151> 2003-02-04
<150> US 60/381,617
<151> 2002-05-17
<160> 15
<170> PatentIn version 3.3
<210> 1
<211> 40
<212> DNA
<213> Artificial
<220>
<223> Synthetic
<400> 1
gttaactcga gaattctttt tttttttttt tttttttttt 40
<210> 2
<211> 32
<212> DNA
<213> Artificial
<220>
<223> Synthetic
<400> 2
tggagtcaaa gagggcatca tagacacatg gg 32
<210> 3
<211> 24
<212> DNA
<213> Artificial
<220>
<223> Synthetic
<400> 3
cagtacactg gccaatccca tgtg 24
<210> 4
<211> 23
<212> DNA
1
CA 02487058 2006-06-15
<213> Mus musculus
<400> 4
aaggagctaa ctaacgagat gat 23
<210> 5
<211> 21
<212> DNA
<213> Mus musculus
<400> 5
taccttcagc accgggaaca t 21
<210> 6
<211> 17
<212> DNA
<213> Artificial
<220>
<223> Synthetic
<400> 6
gctagctaat ggatcca 17
<210> 7
<211> 25
<212> DNA
<213> Artificial
<220>
<223> Synthetic
<400> 7
gatctggatc cattagctag ctgca 25
<210> 8
<211> 36
<212> DNA
<213> Artificial
<220>
<223> Synthetic
<400> 8
gatcttaatg aacggcaggt gggtgcgcgt ccggag 36
<210> 9
<211> 36
<212> DNA
<213> Artificial
<220>
<223> Synthetic
<400> 9
2
CA 02487058 2006-06-15
tcgactccgg acgcgcaccc acctgccgtt cattaa 36
<210> 10
<211> 21
<212> DNA
<213> Artificial
<220>
<223> Synthetic
<400> 10
cgcgttacta gtaagacgtc t 21
<210> 11
<211> 21
<212> DNA
<213> Artificial
<220>
<223> Synthetic
<400> 11
ccggagacgt cttactagta a 21
<210> 12
<211> 23
<212> DNA
<213> Artificial
<220>
<223> Synthetic
<400> 12
caggtagaac ccacaactcc gac 23
<210> 13
<211> 22
<212> DNA
<213> Artificial
<220>
<223> Synthetic
<400> 13
ccggacacgc tgaacttgtg gc 22
<210> 14
<211> 30
<212> DNA
<213> Artificial
<220>
<223> Synthetic
<400> 14
3
CA 02487058 2006-06-15
acaggatccc taagcctcaa aagagtcgct 30
<210> 15
<211> 33
<212> DNA
<213> Artificial
<220>
<223> Synthetic
<400> 15
tcttggatcc tcctatccta tcccgaagct cct 33
4