Note: Descriptions are shown in the official language in which they were submitted.
CA 02506835 2005-05-09
SONIC WELL LOGGING METHODS AND APPARATUS UTILIZING PARAMETRIC
INVERSION DISPERSIVE WAVE PROCESSING
BACKGROUND OF THE INVENTION
1. Field of the Invention
This invention relates generally to sonic well logging.
More particularly, this invention relates to sonic well
logging techniques useful in quantifying subsurface parameters
which are helpful in searching for and exploiting hydrocarbons
and other valuable resources. The invention has particular
application to determining dipole flexural dispersion curves
as well as shear slowness of a formation via utilization and
processing of dispersive wave information such as flexural
waves.
2. State of the Art
Sonic well logs are typically derived from tools
suspended in a mud-filled borehole by a cable. The tools
typically include a sonic source (transmitter) and a plurality
of receivers which are spaced apart by several inches or feet.
Typically, a sonic signal is transmitted from one longitudinal
end of the tool and received at the other, and measurements
are made every few inches as the tool is slowly drawn up the
- 1 -
CA 02506835 2013-03-26
69897-75
borehole. The sonic signal from the transmitter or source
enters the formation adjacent the borehole, and the arrival
times and perhaps other characteristics of the receiver
responses are used to find formation parameters. In most
formations, the sonic speeds in the tool and in the drilling
mud are less than in the formation. In this situation, the
compressional (P-wave), shear (S-wave) and Stoneley arrivals
and waves are detected by the receivers and are processed.
Sometimes, the sonic speed in the formation is slower than the
drilling mud; i.e., the formation is a "slow" formation. In
this situation, there is no refraction path available for the
shear waves, and the shear waves are typically not measurable
at the receivers. However, the shear slowness of the formation
is still a desirable formation parameter to obtain.
One sonic log of the art which has proved to be useful is
the slowness-time coherence (STC) log. Details of the
techniques utilized in producing an STC log are described in
U.S. Pat. No. 4,594,691 to Kimball et al., as well as in
Kimball, et al., "Semblance Processing of Borehole Acoustic
Array Data"; Geophysics, Vol. 49, No. 3, (March 1984) pp. 274-
281.
Briefly, the slowness-time coherence log
utilizes the compressional, shear, and Stoneley waves detected
- 2 -
CA 02506835 2005-05-09
by the receivers. A set of time windows is applied to the
received waveforms with the window positions determined by two
parameters: the assumed arrival time at the first receiver,
and an assumed slowness. For a range of values of arrival time
and slowness, a scalar semblance is computed for the windowed
waveform segments by backpropagating and stacking the
waveforms and comparing the stacked energies to the unstacked
energies. The semblance may be plotted as a contour plot with
slowness and arrival times as axes, with maximum semblance
values indicating the determined formation slowness value. In
addition, local maxima of the semblance function are
identified by a peak-finding algorithm, and the corresponding
slowness values may be plotted as gray-scale marks on a graph
whose axes are slowness and borehole depth. The intensity of
the gray-scale marks is proportional to the height of the
semblance peak.
As indicated in the aforementioned article and U.S. Pat. No.
4,594,691 to Kimball et al., the same backpropagation and
stacking techniques are used regardless of whether the wave
being analyzed is a P-wave, S-wave or a Stoneley wave; i.e.,
regardless of whether the wave is non-dispersive (P- or S-
wave) or dispersive (e.g., Stoneley). However, while such
backpropagation and stacking techniques may be optimal for
non-dispersive waves, they are not optimal for dispersive
- 3 -
CA 02506835 2013-03-26
69897-75
waves. In response to this problem, several different
approaches have been utilized. A first approach, such as
disclosed in Esmersoy et al., "P and SV Inversion from
Multicomponent Offset VSPs", Geophysics, Vol. 55; (1990)
utilizes parametric inversion of the total waveform. However,
this approach is not preferred because it is unreliable and
computationally time consuming.
A second approach which was used commercially is
disclosed in A. R. Harrison, et al., "Acquisition and Analysis
of Sonic Waveforms From a Borehole Monopole and Dipole
Source... ", SPE 20557, pp. 267-282, (Society of Petroleum
Engineers, Inc. 1990).
In the Harrison disclosure,
the flexural waveform is processed as in the STC technique,
but the non-dispersive processing results is corrected by a
factor relating to the measured slowness; i.e., the STC
results are post-processed. In particular, correction values
are obtained by processing model waveforms with the STC
techniques and comparing the measured slowness with the
formation shear slowness of the model. The model waveforms
assume a particular source and are bandlimited to a prescribed
band (typically 1 to 3 KHz) before STC processing. Tables of
corrections are designated by a particular source and
- 4 -
_
CA 02506835 2005-05-09
processing bandwidth, and contain corrections as percentage-
of-measured-value factors functions of measured value and hole
diameter. The percentage correction required decreases with
hole diameter and increasing formation slowness, and ranges
from less than one percent to as much as fifteen percent. This
approach, as did the parametric inversion approach, has its
own drawbacks. In particular, the waveform spectra often
disagree with those of the model. Further, the analysis band
may exclude the majority of the flexural mode energy as well
as reducing sensitivity to environmental parameters.
Other approaches such as first motion detection of
flexural mode onset, and non-dispersive processing over a low
frequency band, have also been utilized. Each of these
approaches, however, has its own drawbacks. The flexural mode
onset approach is driven by the realization that the fastest
parts of the flexural mode dispersion curve approaches the
formation shear slowness, and that the calculated moveout can
be taken as the estimate of formation shear slowness. Problems
with this technique include, among others, that: the flexural
mode onset can be preceded by the compressional arrival; the
early onset of the flexural wave may not propagate at the
formation shear slowness because the flexural wave does not
have energy at low frequencies; early time portions of
- 5 -
CA 02506835 2013-03-26
69897-75
arrivals have low energy content; measured flexural mode
onsets practically never line up exactly in arrays with
several receivers. The non-dispersive processing over a low
frequency band approach is driven by the realization that the
low frequency limit of the flexural mode dispersion curve is
the formation shear slowness. Among the problems with the low
frequency processing are that: with fixed array lengths, the
resolution of the slowness measurement diminishes with
frequency; generating significant flexural mode energy at low
frequencies is extremely difficult; and road noise increases
as the frequency decreases.
In U.S. Patent #5,278,805 to Kimball,
many of the
issues with the previous techniques were resolved. The
technique proposed by Kimball in the '805 patent is called
dispersive STC or DSTC and has become commercially successful.
According to the DSTC technique, a sonic tool is used to
detect dispersive waves such as flexural or Stoneley waves.
The signals obtained by the sonic tool are then Fourier
transformed and backpropagated according to equations using
different dispersion curves. The backpropagated signals are
then stacked, and semblances are found in order to choose a
dispersion curve of maximum semblance, thereby identifying the
- 6 -
CA 02506835 2005-05-09
shear slowness of the formation. Formation shear slowness can
then be plotted as a function of borehole depth.
In the Kimball patent, different embodiments are set
forth. In one embodiment called quick DSTC or QDSTC, prior to
Fourier transforming, the signals are stacked according to a
previous estimation of slowness, and are windowed for maximum
energy. The reduced set of data in the window are then
extracted for Fourier transformation, and prior to
backpropagation, multiplied by the estimation of slowness to
reset them for backpropagation and stacking. In the standard
DSTC embodiment, after the signals are backpropagated, the
backpropagated signals are inverse Fourier transformed and
windowed. In DSTC, semblance values may be plotted as a
function of slowness and time. Regardless of embodiment,
Kimball accounts for non-dispersive waves by using dispersion
curves of constant value during backpropagation.
While DSTC represented a major improvement in the art, it
has since been found by the present inventor that DSTC is not
fully accurate. In particular, DSTC employs an assumption
that the formation is homogeneous and isotropic, and thus the
dispersion curves utilized by the backpropagation technique do
not necessarily approximate the dispersion curve of the
- 7 -
CA 02506835 2013-03-26
=
69897-75
formation. Thus, when formations deviate from the isotropic,
homogeneous formation assumption, the results generated by DSTC
are not as accurate as desired.
SUMMARY OF THE INVENTION
It is therefore an object of some embodiments of the
invention to provide techniques in slowness logging which
account during processing for sonic wave dispersion by an
inhomogeneous anisotropic formation.
It is another object of some embodiments of the
invention to account for dispersion of an inhomogeneous
anisotropic formation in slowness logging by backpropagating
the received waveforms and accounting for dispersion in the
frequency domain.
It is a further object of some embodiments of the
invention to provide techniques in slowness logging which are
easily and quickly calculated.
It is an additional object of some embodiments of the
invention to parameterize dispersion curves utilizing functions
of at least a kick-in frequency and a flexion frequency and to
utilize the
- 8 -
CA 02506835 2013-03-26
69897-75
parameterized dispersion curves in accounting for dispersion
during slowness logging processing.
A further object of some embodiments of the invention is
to provide techniques in slowness logging which yield
dispersion curve answer products for locations in a borehole.
An additional object of some embodiments of the
invention is to provide techniques in slowness logging of
anisotropic formations which yield slowness answer products
at different orientations about a borehole.
In accord with the objects of the invention, methods and
related apparatus for conducting slowness logging are set
forth. The methods broadly comprise backpropagating detected
dispersive waveforms in the Fourier domain while accounting
for dispersion in an anisotropic and inhomogeneous formation,
and then stacking the processed waveforms. The stacking of the
processed waveforms may occur in the frequency or time
domains. The semblance of the stacked and windowed waveforms
may then be compared against the detected waveforms. In
accounting for dispersion during backpropagation, a plurality
of parameters which describe dispersion curves are varied over
ranges in order to optimize semblance. At each depth of
- 9 -
CA 02506835 2013-03-26
69897-75
interest, it is then possible to obtain a dispersion curve of
greatest semblance. Where both an x-dipole and y-dipole are
used to generate the waves, a dispersion curve of greatest
semblance for each orientation may be generated. In addition,
and if desired, from the dispersion curves, formation shear
slowness(es) may be plotted as a function of formation depth
and azimuthal orientation.
In accord with some aspects of the invention, the
parameters utilized in characterizing the dispersion curves
include a normalized value for a kick-in frequency kk(the
frequency at which the second derivative of the dispersion
curve is a maximum), a normalized value for a flexion
frequency 47,, (the frequency at which the first derivative of
the dispersion curve is a maximum), a value for a slowness at
a first normalized frequency s(f1), and a value for a slowness
= at a second normalized frequency Mb. Preferably, the first
normalized frequency is chosen to be zero or nearly zero, and
second normalized frequency is chosen to be substantially
greater than the normalized flexion frequency.
While according to some aspects of the invention, time windowing
is not necessary, in order to limit the amount of processing required,
prior to Fourier transforming the detected waveform,
- 10 -
_
CD, 02506835 2013-03-26
69897-75
time windowing can be utilized. Time windowing may be
accomplished in various manners, including the manner utilized
in DSTC.
Additional aspects of the invention include the use
of a dipole source in order to produce a large flexural wave
signal (the flexural wave being a dispersive wave), and the use
of an x-dipole source and a y-dipole source in order to obtain
azimuthal information.
The apparatus of the invention relates closely to the
methods of the invention.
In one aspect of the invention, there is provided a
method for determining a characteristic of a formation
traversed by a borehole, comprising the steps of: a) obtaining
signals from a plurality of sonic detectors, which signals
include dispersive waveform information; b) Fourier
transforming at least a portion of said signals to obtain
Fourier transformed signals; c) backpropagating said Fourier
transformed signals utilizing a dispersion curve defined by a
plurality of parameters to obtain a set of backpropagated
signals, said plurality of parameters including at least one of
(i) a slowness at an indication of first frequency and a
slowness at an indication of second frequency, (ii) an
indication of a kick-in frequency, and (iii) and an indication
of a flexion frequency; d) modifying at least two of said
plurality of parameters according to a search algorithm, and
repeating said backpropagating step a plurality of times with
modified parameters; and e) using sets of backpropagated
signals, identifying a best-fit dispersion curve for at least
one depth of the formation.
- 11 -
CA 02506835 2013-03-26
=
69897-75
In another aspect of the invention, there is provided
a method for determining a characteristic of a formation
traversed by a borehole, comprising the steps of: a) obtaining
signals from a plurality of sonic detectors, which signals
include dispersive waveform information; b) Fourier
transforming at least a portion of said signals to obtain
Fourier transformed signals; c) backpropagating said Fourier
transformed signals utilizing a dispersion curve defined by a
plurality of parameters to obtain a set of backpropagated
signals; d) modifying at least two of said plurality of
parameters according to a search algorithm, and repeating said
backpropagating step a plurality of times with modified
parameters; and e) using sets of backpropagated signals,
identifying a best-fit dispersion curve for at least one depth
of the formation; and f) conducting steps a) through e) for x-
directed signals and y-directed signals in order to obtain two
best-fit dispersion curves for said at least one depth of the
formation.
In another aspect of the invention, there is provided
a method for determining a characteristic of a formation
traversed by a borehole, comprising the steps of: a) obtaining
signals from a plurality of sonic detectors, which signals
include dispersive waveform information; b) Fourier
transforming at least a portion of said signals to obtain
Fourier transformed signals; c) backpropagating said Fourier
transformed signals utilizing a dispersion curve defined by a
plurality of parameters to obtain a set of backpropagated
signals d) modifying at least two of said plurality of
parameters according to a search algorithm, and repeating said
backpropagating step a plurality of times with modified
- ha -
CD, 02506835 2013-03-26
69897-75
parameters; and e) using sets of backpropagated signals,
identifying a best-fit dispersion curve for at least one depth
of the formation, wherein said dispersion curve defined by a
plurality of parameters is Bessel-function based.
In another aspect of the invention, there is provided
a method of analyzing dispersive sonic wave data obtained in a
borehole resulting from generated sonic signals, said method
comprising the steps of: a) determining an initial set of
parameter values for a parametric expression having a plurality
of parameters and capable of fitting sonic dispersion data,
thereby defining an initial dispersion curve, said plurality of
parameters including at least one of (i) a slowness at an
indication of first frequency and a slowness at an indication
of second frequency, (ii) an indication of a kick-in frequency,
and (iii) and an indication of a flexion frequency; b) first
processing said sonic wave data utilizing said dispersion curve
and comparing a result of said first processing to obtain an
indication of fit; c) varying one or more of said parameter
values, thereby defining an alternative dispersion curve; d)
next processing said sonic wave data utilizing said alternate
dispersion curve and comparing a next result of said next
processing to obtain another indication of fit; e) repeating
steps c) and d) so that said parameter values for at least two
of said plurality of parameters are varied, and until a set of
parameters are identified that define a dispersion curve
resulting in a best fit.
In another aspect of the invention, there is provided
a method of analyzing dispersive sonic wave data obtained in a
borehole resulting from generated sonic signals, said method
comprising the steps of: a) determining an initial set of
- llb -
CA 02506835 2013-03-26
=
69897-75
parameter values for a parametric expression having a plurality
of parameters and capable of fitting sonic dispersion data,
thereby defining an initial dispersion curve; b) first
processing said sonic wave data utilizing said dispersion curve
and comparing a result of said first processing to obtain an
indication of fit; c) varying one or more of said parameter
values, thereby defining an alternative dispersion curve; d)
next processing said sonic wave data utilizing said alternate
dispersion curve and comparing a next result of said next
processing to obtain another indication of fit; e) repeating
steps c) and d) until a set of parameters are identified that
define a dispersion curve resulting in a best fit; and f)
conducting steps a) through e) for x-directed signals and y-
directed signals in order to obtain two best-fit dispersion
curves for a depth of the formation.
In another aspect of the invention, there is provided
a method for determining a characteristic of a formation
traversed by a borehole, comprising: a) obtaining signals from
a plurality of sonic detectors, which signals include
dispersive waveform information; b) Fourier transforming at
least a portion of said signals to obtain Fourier transformed
signals; c) backpropagating said Fourier transformed signals
utilizing a plurality of dispersion curves defined by a
plurality of parameters including at least two of (i) slowness
at an indication of first frequency, (ii) slowness at an
indication of second frequency, (iii) an indication of a kick-
in frequency, and (iv) an indication of a flexion frequency, to
obtain a plurality of sets of backpropagated signals; d)
stacking said backpropagated signals of each set to provide
- 11c -
CA 02506835 2013-03-26
69897-75
stacked sets; e) using said stacked sets to determine an
indication of a formation characteristic.
In another aspect of the invention, there is provided
apparatus for determining characteristics of a formation
traversed by a borehole, comprising: a) a sonic source which
generates substantially non-attenuating dispersive waves; b) a
plurality of sonic receivers which detect said non-attenuating
dispersive waves generated by said sonic source and generate
signals in response thereto; and c) a processor which (i)
obtains said signals, (ii) processes said signals utilizing an
initial dispersion curve defined by a parametric expression
having a plurality of parameters with an initial set of
parameter values and capable of fitting sonic dispersion data
to obtain a result, said plurality of parameters including at
least one of (I) a slowness at an indication of first frequency
and a slowness at an indication of second frequency, (II) an
indication of a kick-in frequency, and (III) and an indication
of a flexion frequency; (iii) analyzing said result to obtain
an indication of fit, (iv) varies one or more of said parameter
values, thereby defining an alternative dispersion curve, (v)
processes said signals utilizing said alternate dispersion
curve to obtain another result, (vi) compares said another
result to obtain another indication of fit, and (vii) repeats
(iv), (v) and (vi) so that said parameter values for at least
two of said plurality of parameters are varied, and until a set
of parameters are identified that define a dispersion curve
resulting in a best fit.
In another aspect of the invention, there is provided
apparatus for determining characteristics of a formation
traversed by a borehole, comprising: a) a sonic dipole source
- lld -
CD, 02506835 2013-03-26
=
69897-75
which generates substantially non-attenuating dispersive waves;
b) a plurality of sonic receivers which detect said non-
attenuating dispersive waves generated by said sonic source and
generate signals in response thereto; and c) a processor which
(i) obtains said signals, (ii) processes said signals utilizing
an initial dispersion curve defined by a parametric expression
with an initial set of parameter values and capable of fitting
sonic dispersion data to obtain a result; (iii) analyzing said
result to obtain an indication of fit, (iv) varies one or more
of said parameter values, thereby defining an alternative
dispersion curve, (v) processes said signals utilizing said
alternate dispersion curve to obtain another result, (vi)
compares said another result to obtain another indication of
fit, and (vii) repeats (iv), (v) and (vi) until a set of
parameters are identified that define a dispersion curve
resulting in a best fit, wherein said dipole source includes an
x-dipole source and a y-dipole source.
Additional objects and advantages of the invention
will become apparent to those skilled in the art upon reference
to the detailed description taken in conjunction with the
provided figures.
BRIEF DESCRIPTION OF THE DRAWINGS
Fig. 1 is an overall schematic illustration of a
logging system making use of an exemplary embodiment of the
invention.
Fig. 2 illustrates waveforms on sonic signals
received at a set of sonic receivers spaced from each other
along the
- lie -
CA 02506835 2013-03-26
69897-75
length of a sonic tool and from a transmitter carried by the
same tool.
Fig. 3 is a plot of a normalized flexural dispersion
curve along with its first and second derivatives.
Figs. 4a and 4b are block diagrams of the processing
accomplished by the processing means of Fig. 1 according to
two alternative embodiments of the invention.
Figs. 5a-1 and 5b-1 are synthetic waveforms for altered
and homogenous formations.
Figs. 5a-2 and 5b-2 are backpropagated waveforms
resulting from backpropagating the waveforms of Figs. 5a-1 and
5a-2.
Fig. 5c shows dispersion curves determined from the
backpropagated waveforms of Figs. 5a-2 and 5b-2 utilizing the
processing of the invention and results of another technique
for comparison purposes.
Fig. 5d is a comparison plot to Fig. 5c showing signal energy
to noise spectra.
- 12 -
CD, 02506835 2005-05-09
Fig. 6a is a log of the shear slownesses calculated
according to the techniques of the invention for the x- and y-
dipoles from depths of 3000 through 3500 in a formation.
Fig. 6b is a log of the relative amount of shear
anisotropy shoWn by Fig. 6a.
Fig. 6c is a log of the amount of stress anisotropy
calculable from the techniques of the invention along the
indicated depths of the formation.
Fig. 6d is a log of relative alteration of the formation
along the indicated depths of the formation.
Figs. 7a and 7b are actual x-dipole and y-dipole non-
rotated waveforms received at a depth of 3106 feet in a
formation of Fig. 6a.
Fig. 7c shows dispersion curves calculated according to
the invention for the waveforms of Figs. 7a and 7b overlaid on
results from other techniques.
- 13 -
CD. 02506835 2005-05-09
Figs. 8a and 8b are actual x-dipole and y-dipole non-
rotated waveforms received at a depth of 3048 feet in a
formation of Fig. 6a.
Fig. 8c shows dispersion curves calculated according to
the invention for the waveforms of Figs. 8a and 8b overlaid on
results from other techniques.
Figs. 9a and 9b are actual x-dipole and y-dipole non-
rotated waveforms received at a depth of 3256 feet in a
formation of Fig. 6a.
Fig. 9c shows dispersion curves calculated according to
the invention for the waveforms of Figs. 9a and 9b overlaid on
results from other techniques.
Figs. 10a and 10b are actual x-dipole and y-dipole non-
rotated waveforms received at a depth of 3138 feet in a
formation of Fig. 6a.
Fig. 10c shows dispersion curves calculated according to
the invention for the waveforms of Figs. 10a and 10b overlaid
on results from other techniques.
- 14 -
CA 02506835 2005-05-09
Figs. ha and 11b are actual x-dipole and y-dipole non-
rotated waveforms received at a depth of 3370 feet in a
formation of Fig. 6a.
Fig. 11c shows dispersion curves calculated according to
the invention for the waveforms of Figs. ha and llb overlaid
on results from other techniques.
DETAILED DESCRIPTION OF THE PREFERRED EMBODIMENTS
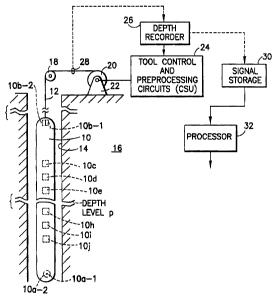
Referring to Fig. 1, an overall schematic illustration of
a well logging system making use of the invention is seen. A
sonic tool 10 is shown lowered on an armored multi-conductor
cable 12 into a borehole 14 (cased or otherwise) to take sonic
logs of a subsurface formation 16. Tool 10 is provided with at
least one sonic source or transmitter 10a (either monopole or
dipole), and a plurality of sonic receivers (either monopole
or dipole). In the preferred embodiment of the invention, at
least two dipole transmitters are provided, including a x-
dipole transmitter and a y-dipole transmitter. In FIG. 1,
tool 10 is shown with four dipole transmitters (including x-
dipoles 10a-1 and 10b-1, and y-dipoles 10a-2 and 10b-2), and
eight receivers 10c through 10j, it being appreciated that
this is by way of example only and not intended to be
- 15 -
CA 02506835 2005-05-09
limiting. The receivers are spaced along the length of tool 10
from each other and from the transmitter(s), and typically the
distance between each transmitter and the receiver closest
thereto is much greater than the inter-receiver distance. For
example, the distance between the transmitter and the receiver
nearest thereto is typically in the range of 5-25 feet, and
the inter-receiver distance is typically less than half a
wavelength of the sonic signal from the transmitter; e.g.,
about a half a foot to a foot.
Tool 10 is adapted from movement up and down borehole 14,
and as the tool 10 is moved, the transmitters 10a-1, 10a-2
periodically generate sonic signals. The generated sonic
signals travel through the borehole and/or through the
formation, and the receivers typically detect some energy
which results from the generated signals. The mechanism for
moving the tool 10 in the borehole includes the cable 12 which
extends to the sheave wheel 18 at the surface of the
formation, and then to a suitable drum and winch mechanism 20
which raises and lowers the tool 10 in the borehole as
desired. Electrical connection between the transmitter and
receivers on the one hand, and the surface equipment on the
other hand, is made through suitable multi-element slipping
and brush contact assembly 22 associated with the drum and
- 16 -
CD, 02506835 2005-05-09
winch mechanism 20. A unit 24 contains tool control and pre-
processing circuits which send electrical signals to tool 10
and receive other electrical signals (sonic logs) therefrom
via cable 12 and assembly 22. Unit 24 cooperates with a depth
recorder 26 which derives depth level signals from depth
measuring wheel 28 so as to associate the signals from
receivers 10c through 10n with respective depth levels z in
borehole 14. The outputs of sonic receivers 10c through 10n,
after optional pre-processing in unit 24, are sent to signal
storage 30, which can also receive signals from or through
depth recorder 26 so as to associate sonic receiver outputs
with respective depth levels z in borehole 14. Storage 30 can
store the outputs of sonic receivers 10c through 10j in analog
form but more typically stores them in the form of digital
sonic log measurements, a set for each respective depth level
z, derived by digitizing such analog signals, for example in
unit 24. Storage 30 can comprise any of various storage media
known in the art. The processing of the digitized log
measurements is then accomplished by a computer or processor
32 which processes the information according to the techniques
set forth below. The output of the processing preferably
includes one or more dispersion curves (e.g., an x-shear
dispersion curve and a y-shear dispersion curve) at each depth
of interest (see. e.g., Fig. 7c, Fig. 8c, Fig. 9c), and a log
- 17 -
CD, 02506835 2005-05-09
(or logs) of formation slowness versus formation depth z as
seen in Fig. 6a. In addition, logs of the relative amount of
shear anisotropy (Fig. 6b), the amount of stress anisotropy
(Fig. 6c), and the relative alteration of the formation (Fig.
6d) along the indicated depths of the formation may be
generated.
The response of any given one of receivers 10c through
10j to a sonic signal from a transmitter is typically a
waveform of the general type illustrated in Fig. 2. As seen in
Fig. 2, the responses of the several receivers are staggered
in time due to the different spacing of the receivers from the
transmitter. It will be appreciated that where the sonic
signal detected is non-dispersive (e.g., P-waves and S-waves),
the signal obtained at each receiver will take the same or
similar form. However, where the sonic signal is dispersive
(e.g., flexural waves), the signal obtained at the different
receivers will appear different. Thus, the waveforms shown in
Fig. 2 are illustrative of a dispersive wave. As discussed in
more detail hereinafter, the primary waves of interest in the
instant invention are the dispersive waves, such as flexural
waves.
- 18 -
CA 02506835 2005-05-09
As mentioned in the Background section, in slow
formations, it is possible that a shear wave signal is not
detected by the receivers. Without a shear wave signal
detection, a direct measurement of formation shear slowness is
not possible. However, the formation shear slowness may be
determined from measurements of dipole flexural mode.
Particularly, in the special case of isotropic and homogenous
formation, the formation shear slowness is related to other
parameters according to the following:
Sp(I):= Flexural(D, Rpm IR flutd,V fluid) (1)
where Sp(f) is the phase slowness of the formation, D is the
diameter of the borehole, Vs is the unknown shear wave
velocity, Af,,m and Rfluid are the densities of the formation and
borehole fluid, and Vf/uid is the borehole fluid velocity.
Typically, the borehole diameter, the formation and borehole
fluid densities, and borehole fluid velocity are known, may be
assumed, or may be determined according to known techniques.
As a result, if it is possible to measure the phase slowness
of the formation via flexural wave measurements, then a
determination of the formation shear velocity or slowness is
possible. It should be understood that for an anisotropic and
inhomogeneous formation, additional formation parameters
beyond equation (1) are required to properly find the shear
slowness.
- 19 -
CA 02506835 2005-05-09
Before turning to Figs. 4a and 4b which set forth methods
of determining dispersion curves so that formation shear
slowness may be determined, an understanding of the physics
and mathematics governing the invention is helpful. In
particular, an understanding of dispersion, and
backpropagation and stacking (beamforming) is in order.
When a transmitter of a sonic tool is fired, the
receivers measure waveforms representing the total borehole
response. Based on experience and mathematical models, certain
portions of the total response are identified as a "wave" or
"arrival". Ideally, a wave would be an isolated wave packet
which moves across the array at a recognizable slowness. Given
the total response, the designation of a particular wave is an
imprecise concept. In STC-type processing, the designation is
made by specifying a particular moved-out time window in which
certain properties (such as high semblance) are obtained. But
the physics provides no assurance that such isolation can be
performed. In general, a window contains components from many
waves, and a particular wave is simply dominant in its window.
The transmitter-to-first receiver distance in sonic tools has
been selected to facilitate separation of waves of different
slownesses by windowing. While the invention preferably
- 20 -
CA 02506835 2005-05-09
assumes that the different types of waves are perfectly
isolated by windowing, it will be appreciated that this
assumption is not strictly true, and that additional
techniques can be utilized to help distinguish between the
different types of waves.
A propagating wave is often modeled in terms of its
wavenumber k(f) which is, in general, a complex-valued
function of frequency. If Ai(f) is the amplitude spectrum of
the waveform at the i-th receiver located at distance zi from
the source, then the spectrum of the output A +1(f) of the i+l-
th receiver at a distance zi.,1 from the source is given by:
(f) = A,(f (2)
If the wavenumber k(f) is real, which preferably is assumed
for purposes of this invention, then the exponential in
equation (2) represents only a phase shift and the wave does
not attenuate as it propagates. A possible further restriction
on the wavenumber k(f) is that it is proportional to
frequency; i.e.,
k(1)=214/ (2a)
where S is the slowness of the wave in units of time/distance.
If the propagating wave satisfies this restriction, the
propagating wave is non-dispersive. Fourier transform
relations show that a non-dispersive wave at position zi+1 is
- 21 -
,
CA 02506835 2005-05-09
simply a time-shifted (by S(Zi+1 -Zi)) version of the wave at
position zi as discussed above with reference to Fig. 2.
In many applications, a plot of the magnitude of k(f)
versus frequency, f, is not instructive. Two more convenient
parameters are the phase slowness, Sp(f), and group slowness
SG(f), where:
Sp(1)=k(f)12at (3a)
SG(f)=(-1lz)dk(f)ldf (3b)
2
Sp(f) gives the slowness at which the phase of sinusoid at
frequency f moves out with distance. SG(f) gives the slowness
at which the envelope of a narrowband signal centered at
frequency f moves out with distance. For a non-dispersive
wave, Sp(f) and SG(f) are equal and independent of frequency.
For a propagating dispersive wave, Sp(f) is known as the
"dispersion curve". An example of a dispersion curve is seen
in Fig. 3 which also shows first and second derivatives of the
dispersion curve (where a maximum value for the first
derivative is identified as the "flexion frequency", and the
maximum value for the second derivative is called the "kick-in
frequency"). While the instant invention, as set forth in
more detail below, can utilize and provide results for non-
dispersive waves, it will be appreciated that the dispersive
waves are of primary interest. As will be discussed
- 22 -
CA 02506835 2005-05-09
hereinafter, according to the preferred embodiment of the
invention, the kick-in and flexion frequencies are two
parameters utilized to characterize the dispersion curves.
In reality, in frequency bands of interest, the flexural
mode can be highly dispersive; i.e., the phase and group
delays can differ significantly. Dispersion-based distortion
can easily be misinterpreted as being the result of two
arrivals. At low frequencies (e.g., f less than 1.5 KHz), the
dispersion is small, and the phase and group slowness are
nearly equal to the formation shear slowness S. However, as
discussed in the Background section hereto, excitation of the
flexural mode at low frequencies is extremely difficult, and
low frequency band processing has numerous difficulties.
Because dispersive waves are parameterized by more than
one parameter, they are inherently more difficult to process
for formation parameters than a non-dispersive wave. For non-
dispersive waves, the dispersion "curve" has a constant phase
slowness and a one-dimensional processing can estimate the
wave slowness. For dispersive waves, the phase slownesses vary
with frequency (as seen in Fig. 3) and depend on several
formation parameters. Consequently, processing of a dispersive
wave requires a multi-dimensional inversion of the data to
- 23 -
CA 02506835 2005-05-09
,
,
determine formation parameters. In DSTC processing, all but
the formation shear velocity or slowness is assumed known so
that only a one-dimensional inversion is necessary. However,
according to the preferred embodiment of the invention,
dispersive waves are characterized by a plurality of
parameters so that a multi-dimensional parameter inversion is
necessary. In particular, by utilizing a Bessel function
based parametric expression, it can be seen that empirical
approximations of dispersive waves can be made using a
plurality of parameters such as the kick-in frequency, the
flexion frequency, and slowness values at a frequency below
the flexion and kick-in frequency and at a frequency above the
flexion and kick-in frequency.
If f denotes frequency, and s(f) denotes the slowness of
a borehole dipole flexural mode, then the following may be
defined: so=s(/ =0),, soo=s(/-44-00). Physically, sois the shear
slowness of the virgin formation and so, is the slowness of the
Scholte wave. A normalized frequency/ may then be defined by
1 :#: losot (4a)
where D (the borehole diameter) is twice the borehole radius.
A Bessel function based parametric expression is given by
-
J -0)
s( f ) = so + (so. so) a if (4b)
Jo (P)
- 24 -
CA 02506835 2005-05-09
whereaandf3 are parameters and J is the Bessel function of the
first kind with order of a/I.
Those skilled in the art will appreciate that equation
(4b) may be expressed within a normalized frequency band
(j; <1<j.2) as
-05)--(
Jalfi
(4c)
J - (/.1)¨ J 11)
cah caf,(
Mathematically the "local" expression (4c) is equivalent to
the "global" expression (4b). The local expression (4c)
allows inversion within the bandwidth (f; <f<f2). In the
preferred embodiment of the invention, the local expression is
utilized.
The Bessel function based parametric expression is
capable of accurately fitting dipole dispersion curves of
arbitrary formations. It has been tested against many
different dispersion curves and fits well in all the cases
considered, including isotropic formations, intrinsic and
stress induced anisotropic formations, and formations with
alterations. Indeed, the fits are so good that hardly any
difference can be seen between the analytical solution and the
parametric expression. Thus, the Bessel function based
- 25 -
CA 02506835 2005-05-09
parametric expression can be considered as an empirical
approximation.
As previously mentioned, Figure 3 illustrates a
normalized dispersion curve along with its first and second
order derivatives with respect to j. In Fig. 3, the normalized
dispersion curve is defined as
s(f)-s(f)(A)
= = (4d)
s(f2)-s(fi ) J - (fi)
crif,
In the particular case of Fig. 3, the bandwidth from j; =0 to
f2=2 is considered. The kick-in frequency, denoted by
/kick is
located at about 1.02. The flexion frequency, denoted byhex,
is located at about 1.62. The kick-in and flexion frequencies
are two key parameters defining the shape of any dispersion
curve. In employing equation (4c), it is efficient to replace
a and p with the kick-in frequency kkand flexion frequency
hex.. To do that, mapping functions a( lkick , lflõ) and 51 (
.41Ck 5 hex) should
be computed.
A mapping can be achieved by computing one-dimensional
arrays as follows. First, given a fixed a=a0and given an
array p=p, the kick-in and flexion frequencies can be computed
based on equation (4d). The arrays of kick-in and flexion
- 26 -
CA 02506835 2005-05-09
frequencies are denoted by 'Land gx. Next, the array
riZ/iIis computed and saved. In doing so, two functions are
obtained:134y)andiL e0 N (or
arrays and and jI in correspondence
k
with array y).
Those skilled in the art will appreciated that
13 ( /kick, /flex 130 (y) with 7 =
f flex / ikick = In addition,
( fkick fflex) =a0 / Tax (y) with 7= file., = fkick = With a( kick f
flex) and
13( Lick .7flex) equation (4d) may be rewritten as
3( f) = f ( f flack, ffl.) (4e)
which suggests that the shape (i.e., the slownesses) of the
normalized dispersion curve is determined by parameters fkk
and /*flex. Equation (4c) may also be rewritten as
s(f)= s(fi)+ [s(f2)- s( fi)lf (f fkick, f flex) (4f)
which suggests that dispersion curves may be well
characterized by four parameters: the slowness at a first
normalized frequency Ail), the slowness at a second normalized
frequency AiO, the normalized kick-in frequency
Lick and the
normalized flexion frequency iflex. In accord with the
preferred embodiment of the invention, the first normalized
frequency is preferably chosen to be below the normalized
kick-in frequency and the normalized flexion frequency, while
- 27 -
CA 02506835 2005-05-09
the second normalized frequency is preferably chosen to be
above the normalized kick-in frequency and the normalized
flexion frequency. As will be discussed hereinafter,
according to the invention, dispersion curves characterized by
these four parameters are utilized in the backpropagation step
of the invention.
A summary of semblance and mean-squared error concepts is
helpful at this point. If Xi(f) is the complex spectral value
at frequency f at the i-th receiver of an array, i=1,...,M,
then the average complex spectral value Y(f) over the array is
given by
m
Y(f)=-1 1,X,(f) (5)
The average energy E(f) in the spectral components is given by
1 "
E(F)=¨IIX,(f)12 (6)
i=1
where E(f) is a positive and real number. The semblance and
normalized mean squared error at frequency f are defined by
2
gf)=1Y(f)1 ( 7)
E(f)
1
E2(f)=
ME(f)EIX,(f)-Y(f) 12
( 8)
- 28 -
CA 02506835 2005-05-09
Semblance is the ratio of the energy of the average spectral
value to the average energy, the normalized mean-squared error
is the average error between the spectral values and the
average, normalized by the average energy. Values of p(f) and
c2(f) at a particular frequency are sometimes called the
"point" semblance or the "point" normalized mean squared error
at the frequency. Semblance and the normalized mean squared
error are simply related by
E2(f)=1-p(f) (9)
so that minimizing normalized means squared error as a
function of a parameter, such as slowness, is equivalent to
maximizing the semblance as a function of that parameter.
Given values of p(f) and c2(f) over a range of frequencies F,
the overall semblance and normalized mean-squared error (NMSE)
can be found:
JE(01;04
E(f)df (10)
SE(f)E2(f)df
(11)
$E(f)df
where the integrations are over a range of frequencies F. For
the overall semblance and overall NMSE, c2 =1-p. Here, the
choice of whether to derive an expression in terms of the
semblance or mean-squared error has been made to simplify the
derivation.
- 29 -
CA 02506835 2005-05-09
Turning to the beamforming theory, when a non-attenuating
dispersive wave with dispersion curve Sa(f) propagates past a
linear array of M equally spaced (by a distance 5) receivers,
the complex spectrum at the i-th receiver is given by:
Ai(f)= A(f )e-'21tfsocno-,)
(12)
for i=1,...,M. A beamformer has a stacked output Y(f) at a
frequency f which is the summation of phase-shifted (by
0(f,i)) receiver spectral values:
Y(f)=EA,(f)e'eu'') (13)
Assume that the data is processed by beamforming based on a
second dispersion curve Sb(f); i.e.,
6(1,0= j27tfSb(fb(i-1)) (14)
where Sb can be characterized by a plurality of parameters
(e.g., All), A10, flack' and fflex). Then, the backpropagated wave
for each receiver which takes into account the parametrically
characterized dispersion curve is:
X,(f)=Ai(f)e-imisb(f),-1 (15)
Substituting equation (12) into equation (15) yields:
Xi(f)= A(f )e-J2nics(f)--sbuxi-i) (16)
For the dispersion curve Sb(f), semblance of the beamformer
output at frequency f is:
- 30 -
CA 02506835 2005-05-09
i(f)2
=1
p8(f)=¨, (17)
AII1Xt(f)21
where the numerator of equation (17) is the stack at frequency
f.
Substituting equation (16) into equation (17) and
simplifying the geometric series yields:
1 sin2M#8(Sa(f)-Sb(f))
(18)
PB(f)= M2 Sin2 itfo(Sa(f)- Sb(f))
From equation (10), the overall semblance for the
parametrically-characterized dispersion curve Sb(f) is the
weighted integral of equation (18) over frequency:
1
pB(S ,Sb)= _________ s I Au.) 12 sin2 Ainfo(Sa(f)¨ ( f)) df (19)
õ
UM2 sin2 Rfo(So(f)¨ Sb(f))
where
U= f I A(f) 12 df (20)
Both integrals are over frequency interval F. Equation (19)
contains no approximations. If Sa(f)=Sb(f) for all f, then the
arguments to the sine functions in equation (19) are zero, and
the ratio of the squared sine function is M2, and p=1. In other
words, if a dispersion curve (Sb(f)) has been chosen which
matches the actual dispersion curve of the formation, the
semblance will be one, and the beamformer error will be zero.
It will be appreciated that it is the object of the invention
- 31 -
CD, 02506835 2005-05-09
to apply different dispersion curves during the
backpropagation so that a dispersion curve which most closely
matches the actual dispersion curve of the formation is found.
The different dispersion curves are generated by utilizing a
plurality of parameters which describe the dispersion curves
and varying the parameters over ranges until a maximum
semblance is obtained. The dispersion curve with the maximum
semblance is the dispersion curve which most closely matches
the actual dispersion curve of the formation. With the
dispersion curve found, the shear slowness of the formation
may also be determined. Typically the shear slowness is taken
as the slowness of the dispersion curve at 0 frequency.
It will be appreciated that equation (19) can be
simplified by making a Taylor series expansion around the
argument of the sine functions of equation (19), and utilizing
the first and, if desired, the second Taylor series terms.
The mathematics which helps define the preferred
processing of the received waveform data so as to accurately
account for dispersion during the backpropagation process is
best understood by reference to the standard STC processing.
In particular, standard non-dispersive STC processing
- 32 -
CA 02506835 2005-05-09
calculates the semblance over a two dimensional grid of
slowness, S, and window starting time, T, according to:
2
f TT+Tõ + S(i -DJ) dt
1
p(S,T)= (21)
M4,1 i#1
õ r ,
j7,- lai(t - S(i -1)(5)12 dt
i#1
where a(t) is the output time waveform from the i-th receiver,
i=1,...,M, 8 is the inter-receiver spacing, and Tw is the time
window length. In commercial processing, Tw is different for
monopole and dipole waveforms. Contour plots of p(S,T) are a
widely used analytic tool and are called ST plots. For
logging, STC processing performs a constrained search on
p(S,T) over the slowness-time plane, identifying local maxima
as arrivals, and outputting their slowness coordinate.
Implementation of STC is traditionally done in the time domain
for computation speed.
In accord with the invention, equation (12) can be viewed
in a more general way by recognizing that the time shifted
waveforms ai(t+S(i-1)8) are backpropagated versions (at a non-
dispersive slowness, S) of the received waveforms ai(t). If the
Fourier transform of x(t) is indicated by F[x(t)]=X(f), and
the inverse Fourier transform is denoted by F-1 [X(f)], then if
Ai(f)=F[ai(t)], by the Fourier time shifting property:
ai(t+S(i-1)6)=FIA(Pe-1245(1-1)1 (22)
- 33 -
CA 02506835 2005-05-09
The term in the brackets on the right hand side of equation
(22) is the backpropagated spectrum Xi(f) of equation (15) for
a non-dispersive wave of slowness S.
Generalizing equation (22) to allow backpropagation by a
dispersive wave is accomplished by replacing S with a
dispersion curve Sp ( f s(f2) flex
) parameterized by Af),
s(f2) hick and file, . Thus,
xi(t)= F-1[A1(f )e-i2A1Sp ( f ,s( )4( i2 )jkirk i-1)8 ] (23)
Replacing ai(t+S(i-1)6) in equation (21) with xi(t) gives the
semblance for the STC processing according to the invention
which accounts for dispersion in the backpropagated process,
such that:
2
1
MU(S,T) F¨I Ai(f
dt (24)
where
U(S,T)=IfTT+Tõ. F¨I[Ai(pe¨ronisr(fx1.),s112):4a4 dt, (25)
i=1
This procedure will be known as shear parametric inversion or
SPI (also Sit) . It will be appreciated that if
Sp(f, Afi),s(A),k:/4'fle,)=S, then equations (21) and (24) are the
same; i.e., equation (24) reduces to equation (21). In other
words, if the dispersion curve is constant (i.e., the wave is
non-dispersive), then backpropagation proceeds according to
- 34 -
ak 02506835 2005-05-09
the prior art STC model. Likewise, if the formation is
isotropic and homogeneous in the area of investigation, then
the results of backpropagation using SPI will be equivalent to
the results utilizing DSTC providing the flexural wave model
used in DSTC corresponds well to the flexural wave being
defined by s(4), M(f2), Ikick and fflõ.
Because the SPI processing according to equation (24)
requires an inverse Fourier transform which accounts for four
parameters in order to invert the averaged spectrum, and an
inverse transform of each backpropagated waveform in order to
calculate U(S,T), it will be appreciated that it is desirable
to reduce the amount of processing required. Thus, starting
guesses are provided for each of the four parameters, and
ranges for the parameters are defined. In particular, it has
been found that lkick will often have a value of approximately 1
and jflex will often have a value of approximately 1.6; and so,
those values can be used as starting values. Generally, all
flexural waves which will be encountered in formations of
interest will have an fkwk of between .5 to 1.5, and an & of
between 1 to 2.5, so that those values may be chosen as range
limits. The values for the normalized frequencies are
typically either preset (e.g., (4). 0, (10= 2) or chosen based
on information regarding the logging frequency of the tool,
- 35 -
CA 02506835 2005-05-09
and starting values and ranges for Ail) and s(12) can be preset,
obtained based on known information about the borehole, or
obtained by using techniques such as STC. Using the starting
values, an optimization code such as IMSL BCPOL can be
utilized to range the variables and find optimum values.
While such processing is practical, it will be
appreciated that faster processing is desirable. In
particular, the intensive processing required by SPI is
incurred in returning the backpropagated spectra to the time
domain for time windowing. If time windowing is eliminated;
i.e., if the entire waveform at each receiver is used, then
four-dimensional semblances can be calculated entirely in the
frequency domain with a great time savings. Without time
windowing, equation (24) simplifies to:
2
Ai( ne- '24sPu.'su''s(h'iL.4'ff."1-1)5 df
I __________________________________________
p(S)=
An m(26)
If Ai( pe- 127,ap(I ,s(ji )4(12 ).i4.4 jfleAXi-101 2 df
i= I
where the integrations are over the frequency band F. In
equation (26) the waveforms are Fourier transformed only once.
Further the denominator in equation (26) need only be computed
if a semblance quality measure is desired. This technique is
called unwindowed SPI and is usually faster then standard SPI
processing.
- 36 -
ak 02506835 2005-05-09
The ability to quickly process waveforms using
parameterized dispersion curves is the advantage of unwindowed
SPI. However, the processing time advantage of unwindowed SPI
is only an advantage if the results are accurate, and this
would appear to depend on whether the waveforms contain only
the flexural mode data or whether they also include other
arrivals or noise. In order to gain the advantages of
unwindowed SPI without losing accuracy due to other arrivals
or noise, a second embodiment of the invention (called "Quick
SPI" or QSPI) which also accounts for dispersion in the
backpropagation is set forth.
According to the Quick SPI embodiment, only that part of
the data that is within a linearly-moved-out time window is
processed. The moveout of this window corresponds to an
initial estimate So of the arrival slowness. The starting time,
To is for the window is found by a search process. The windowed
data is processed in a manner analogous to unwindowed SPI.
More particularly, QSPI starts with an initial slowness
estimate So which may be obtained in any desired manner. For
example, the procedures discussed above may be used to provide
an initial slowness estimate, or any of the prior art
- 37 -
CA 02506835 2005-05-09
procedures (including STC or DSTC) may be utilized. Given the
initial slowness estimate, So, the time origin To of the window
is determined through a search called a time scan. The
starting time To is chosen so as to maximize the stacked energy
Es(So,T) over a restricted time interval. Stacked energy rather
than semblance is the default variable to be maximized because
flexural mode is typically the highest energy arrival in the
waveforms. The stacked energy at non-dispersive slowness So and
window starting time T is defined by
2
E s(SO,T)= frT=T. lap+ So(i-1)(5) dt (27)
To is defined as the window starting time T which maximizes
Es(So,T) subject to the constraints Tstart(So)S T S Tlast (So).
The constraints Tstart(S0) and Tiast(S0) specify a time interval
about the slowness-time line T.SZTR where ZTR is the
transmitter-to-first-receiver spacing in feet:
Tstart(S0) = SOZTR Toffset
( 2 8 )
Tlast(So) (SOZTR Toffset)+ Triodth
where Toffset and Twidth are time scan parameters and are
analogous to the T limits in the STC peak-finding algorithm.
It should be appreciated that instead of maximizing the
stacked energy Es(S01T), semblance p(S,TO may be maximized,
- 38 -
CA 02506835 2005-05-09
particularly for low level signals such as monopole
compressional arrival.
Assuming that So, and To have been found, then the
windowed waveforms w(t) are given by:
wi(0= ai(t +To+ So(i ¨1)6) (29)
for t=0,...,Tw. If the Fourier transform of w1(t) is Wi(f),
then a power-of-two Fourier transform (FFT) computes Wi(f).
The SPI parametric dispersion curves Sp(f, AjD,A121
' ikick
"flex )
cannot be applied directly to W (f) as in equation (21) because
these spectra include the non-dispersive moveout at slowness So
introduced by the windowing operation of equation (29). The
spectra of the windowed data after correcting for this moveout
are:
wio(f)=wi(ned2vsou-na6
(30)
Assuming the dispersion curve at slowness S is given by Sp(f,
S(fl)lS(f2)fkickIfflex)I the QSPI semblance is given by:
2
1 rN7 o ¨i2AfsPUXAMq17.0-10
df, , (31)
p(S)= (f)e "
MU
where
U = [wio(f 0--Lick,inõxi_101 df
(32)
i=1
- 39 -
ak 02506835 2005-05-09
The integrals of equations (31) and (32) are over the
frequency range F. rf
,-lower = = = fupper] = Conveniently,
-lower may be
chosen to correspond to fl and f
-upper may be chosen to
correspond to f2 (where fl and f2 are associated with A and 12
through equation 4(a)). U is only needed to yield semblance as
a normalized quality control measure or to provide a signal
level indicator. In practice, calculation of U requires
negligible processing time.
Based on the physics and mathematics set forth above, and
turning now to FIG. 4a, a block diagram according to a first
embodiment of the invention (SPI) is seen for processing with
processor 32 the information obtained by the sonic receivers
10c-10j. In the processing of FIG. 4a, it is assumed that the
source 10a-1 is a x-dipole source, source 10a-2 is a y-dipole
source, sonic receivers 10c-10j are dipole receivers, and that
the flexural wave is of primary interest. In accord with the
first preferred embodiment of the invention, data signals
received by the receivers of the tool are digitized at 112 and
are Fourier transformed at 114 (via a fast Fourier transform--
FFT) to provide frequency domain spectra. Each of the
frequency domain spectra are then backpropagated at step 116
according to equation (15) where a first dispersion curve SID(f)
is utilized in the backpropagation. The parameters of the
- 40 -
CA 02506835 2005-05-09
first dispersion curve (e.g., All), ,s(f2) flock' I flex ) are
preferably stored in memory. The results of the
backpropagations are then preferably retransformed into the
time domain via an inverse FFT at step 117 to provide
backpropagated signals which accounts for dispersion. At step
118, results are windowed to remove the effects of other waves
such as P-waves, and at step 120, the windowed data for the
detectors are stacked according to the numerator of equation
(17). Then the overall semblance for the first dispersion
curve is calculated at step 122 and stored. As will be
discussed hereinafter, the semblance calculated at 122 will be
compared at 128 to semblances of other dispersion curves in
order to help in the search process and identify a maximum
semblance.
In order to find the find a best-fit dispersion curve as
well as the formation slowness, it is desirable that the
backpropagation step 116 be repeated for a plurality of
different dispersion curves until a best-fit curve is found.
According to the invention, this is accomplished by varying
the parameters which define the dispersion curves over ranges.
Thus, a loop is shown where the dispersion curve is changed at
step 126 by varying the parameters. For each different
dispersion curve, the results of the backpropagation are
- 41 -
CA 02506835 2005-05-09
preferably retransformed into the time domain prior to
windowing and stacking. As previously described, the overall
semblances for each dispersion curve are then calculated at
step 122 and compared at 128. In accord with the preferred
embodiment of the invention, the parameters of the dispersion
curves are varied over their ranges utilizing a search
algorithm until a maximum semblance is found. When a maximum
semblance is found, the dispersion curve utilized to obtain
that semblance is identified as the best-fit dispersion curve
at 130. In addition, the formation shear slowness (preferably
taken as the value of the slowness of the best-fit dispersion
curve at 0 frequency) may be identified at step 130. If
desired, a log of shear slowness over borehole depth z such a
seen in FIG. 6a is generated at step 132. Likewise, a
dispersion curve at each depth of interest may be generated
(as seen, e.g., in Figs. 7c, 8c, 9c, 10c, and 11c).
Steps 112-132 of Fig. 4a may be carried out for both x-
oriented and y-oriented signals received by the receivers. As
a result, and as described in more detail below, the best-fit
dispersion curve found for the x-dipole generated signals and
y-dipole generated signals may be different. Thus, two
different best-fit dispersion curves are seen in Figs. 8c, 9c,
- 42 -
ak 02506835 2005-05-09
10c, and 11c. Different best-fit dispersion curves are
indicative of formation anistropy.
It will be appreciated that some of the steps of FIG. 4a
may be varied. For example, it is not absolutely necessary to
window the backpropagated results prior to stacking (i.e.,
unwindowed SPI). Thus, it is possible to stack in the Fourier
domain, and to find semblances so as to identify the best
dispersion curve and the formation shear slowness without ever
returning to the time domain. It will be appreciated that
processing according to FIG. 4a could be conducted on non-
dispersive waves such as P-waves or shear waves. In such a
case, the dispersion curves utilized in the backpropagation
should be constant values.
Turning to FIG. 4b, a block diagram of the preferred
processing according to the second preferred embodiment (QSPI)
of the invention is seen. In the QSPI embodiment of FIG. 4b,
the signals obtained by the receivers are digitized at 150 and
are stacked at 152 based on a moveout dictated by an assumed
slowness So input 153 and in accord with equation (27). At step
154, the stacked signals are scanned by a moving or sliding
window (e.g., of thirty-two data points) to find a maximum
stacked energy for a window of given size. Based on the
- 43 -
CA 02506835 2005-05-09
maximum stacked energy, at step 156 a starting window time is
defined, and the windowed waveforms are defined according to
equation (29). Based on the windows, the data is extracted;
i.e., at step 158, the Fourier transform of the data window of
each receiver is taken. It should be appreciated that the data
windows are removed in time so that the data which is
extracted for each receiver is at a different time relative to
the data of an adjacent receiver. Because the extracted data
window is based on time-removed windows, at step 160, the
Fourier transformed window data is corrected for slowness by
multiplying the data by the assumed slowness So. Then, at step
162, the slowness-corrected extracted data are backpropagated
according to a first dispersion curve Sa(fis(f),s(12),Jruck fflex ) =
It should be appreciated that the correction for slowness So
can be incorporated into the backpropagation procedure if
desired. The backpropagated data are then stacked at step 164,
and the overall semblance is calculated at step 166. It will
be appreciated that the stacking of the backpropagated
extracted data is preferably accomplished in the Fourier
domain as post-backpropagation-windowing is not required; the
windowing having been done prior to backpropagation. Thus, not
only is the computation time significantly decreased due to
the original windowing which results in many fewer data points
being Fourier transformed, but the computation time is
- 44 -
CA 02506E35 20055-09
significantly decreased because a reverse Fourier transform is
not required.
In order to find best-fit dispersion curves as well as
the formation slowness, it is desirable that the
backpropagation step 162 be repeated for a plurality of
different dispersion curves. Thus, a loop is shown, where the
parameters of the dispersion curve are changed at step 168.
For each different dispersion curve, the results of the
backpropagations are stacked and the overall semblances
calculated. In accord with the preferred embodiment of the
invention, the parameters of the dispersion curves are varied
over their ranges utilizing a search algorithm until a maximum
semblance is found. The best-fit dispersion curve(s) is
identified at step 172, and from the identified best
dispersion curve, the formation shear slowness may likewise be
identified at step 172 by taking the slowness of the
dispersion curve at a desired frequency (e.g., 0 Hz). If
desired, a log of shear slowness over borehole depth z such a
seen in FIG. 6a is generated at step 174. Likewise, a
dispersion curve(s) at each depth of interest may be generated
(as seen, e.g., in Figs. 7c, 8c, 9c, 10c, and 11c).
- 45 -
ak 02506835 2005-05-09
While the QSPI embodiment of FIG. 4b preferably conducts
a moving or slfding window search for maximum stacked energy
in the time domain prior to Fourier transform and
backpropagation, it should be appreciated by those skilled in
the art that such a pre-backpropagation windowing is not
necessary if some additional processing is tolerable. In
particular, a wider window which is not based on a moving
search, but which is mot certain to include the desired data
could be utilized. That wider window data could then be
extracted as discussed above. Alternatively, an even wider
window could be utilized which does not include the offsets
for the different receivers, but which still includes
substantially less than the full data signal of typically five
hundred twelve points. The data in this "non-extracted" window
could then be Fourier transformed. Because the "non-extracted"
window data were not extracted in a time offset manner, there
would be no reason to multiply by So prior to backpropagation
according to the different dispersion curves.
Using the techniques of Fig. 4a, synthetic data was
utilized to show the effectiveness of the invention. Figs.
5a-1 and 5b-1 are synthetic waveforms for eighteen receivers
for altered and homogenous formations respectively as
generated by a finite difference code. In the altered
- 46 -
CA 02506835 2005-05-09
formation, the shear slowness at the borehole interface was
chosen to be 10% slower than the deep virgin shear slowness
(e.g., a depth of one diameter of the borehole into the
formation) although the formation density was assumed
constant. As a result of SPI processing (as in Fig. 4a)
according to the invention, dispersion curves characterized by
the parameters s(11), s(10, /ruck ffle, were utilized to
backpropagate the received waveforms for both the altered and
homogenous formation data sets until maximum semblances were
found for each. The dispersion curves of maximum semblance
are shown in Fig. 5c, and the backpropagated waveforms
utilizing the dispersion curves of Fig. 5c are shown in Figs.
5a-2 and 5b-2. The backpropagated waveforms in each of Figs.
5a-2 and 5b-2 show excellent uniformity, confirming that the
dispersion curves are appropriate.
As seen in Fig. 5c, the dispersion curve of the altered
formation is steeper than that of the homogeneous formation.
In addition, the slownesses of the altered and homogenous
formations differ except at zero frequency. Fig. 5c also
shows (utilizing circles as data points) shear slowness
calculations for the modeled altered and homogeneous
formations utilizing the TKO technique as described in Lang,
S.W., Kurkjian, A.L., McClellan, J.H., Morris, C.F., and
- 47 -
CA 02506835 2005-05-09
Parks, T.W., "Estimating Slowness Dispersion from Arrays of
Sonic Logging Waveforms", Geophysics, Vol. 52, No. 4, April
1987 pp. 530-544. At higher frequencies, there is good
agreement between SPI and TKO. At lower frequencies (at or
below 1kHz), TKO fails to produce reliable results (as seen by
the scatter of the circles). Thus, calculations from TKO
result with error as indicated.
Turning now to Figs. 6a-6d, 7a-7c, 8a-8c, 9a-9c, 10a-10c,
and lla-11c, the techniques of the invention were carried out
in a formation using a tool similar to the tool shown in Fig.
1, but having twelve receivers. In particular, using the
borehole tool which was dragged through at least a portion of
a borehole (e.g., from location 3000 feet to location 3050
feet), waveforms were obtained by each receiver every six
inches. Selected examples of the non-rotated x-dipole and y-
dipole waveforms are seen respectively in Figs. 7a and 7b (at
3106.0 ft), 8a and 8b (at 3048.0 ft), 9a and 9b (at 3256.0
ft), 10a and 10b (at 3138.0 ft), and lla and lib (at 3370.0
ft). As will be discussed hereinafter, each depth shown in the
Figures was selected for inclusion herein because the
dispersion curves at that depth illustrate a point of
interest.
- 48 -
CA 02506835 2005-05-09
Using the SPI technique, at each depth, the x-dipole data
and the y-dipole data were separately processed by
backpropagating the waveforms utilizing dispersion curves
parameterized by the four parameters A/0, s(f2), flack, fflex in
order to find best-fit dispersion curves for each set of data.
The best-fit dispersion curves for the x-dipole data and the
y-dipole data (as seen in Figs. 7c, 8c, 9c, 10c and 11c)
(which are discussed in more detail below) were then used at
each depth to find both an x-shear slowness and y-shear
slowness at each investigated depth. The results of slowness
determinations were then plotted as a log as seen in Fig. 6a,
where the shear slownesses plotted are the shear slownesses
taken at 0 Khz of the best-fit x- and y-dispersion curves.
As seen in Fig. 6a, at many depths along the investigated
portion of the borehole, the x-shear slowness and the y-shear
slowness are different; i.e., there is shear anisotropy. This
difference is highlighted in Fig. 6a with the differences
between the logs being filled in. The percent difference
between the x-shear and y-shear slownesses along the
investigated length of the borehole are also plotted in Fig.
6b. There it is seen that the differences can be over 20%
(see, e.g., depth 3048 ft and depth 3380 ft).
- 49 -
CA 02506835 2013-03-26
69897-75
In addition, using techniques such as disclosed in U.S.
Patent #6,614,716 to Plona et al., the
dispersion curves at each depth were used to find indications
of stress anisotropy at each depth. Fig. 6c is a log of the
amount of stress anisotropy calculable from the techniques of
the invention along the indicated depths of the formation.
Further, using techniques such as disclosed in U.S.
Patent #6,526,354 to Bose et al., which is hereby incorporated
by reference herein in its entirety, the dispersion curves at
each depth were used to find an indication of alteration at
each depth. The alteration indicator is calculated by
subtracting the formation slowness at OkHz from the formation
slowness at 2.5kHz and averaging the difference obtained for
the x-dipole data and the y-dipole data. Fig. 6d is a log of
relative alteration of the formation along the indicated
depths of the formation, with the "average alteration"
indicated as a dark line with an index of 50.
Turning now to Fig. 7c, the dispersion curves calculated
according to the invention for the waveforms of Figs. 7a and
7b are shown and overlaid on results from other techniques.
In particular, the arrows in Fig. 7c show the x-shear and y-
- 50 -
_
CA 02506835 2005-05-09
shear slowness determinations at 3106.0 ft using the prior art
DSTC technique, while the circles show results from TKO
processing. As seen in Fig. 7c, the determinations of SPI
indicate that the dispersion curves for the x-shear and y-
shear are substantially identical; i.e., that the formation is
substantially isotropic at 3106.0 feet with a slowness of
approximately 248 s/ft. As indicated, this differs from the
results obtained by DSTC processing for the x-shear slowness
by 5% although it is the same as the results obtained by DSTC
processing for the y-shear slowness.
The dispersions curves of Fig. 8c, representing the depth
of 3048.0 ft, and the overlaid results of other techniques
reveal that SPI works well in the presence of noise. In
particular, the scattered results of TKO show that the noise
level is very high. However, the results of SPI are very
similar to the results of DSTC in this noisy region.
Fig. 9c are dispersion curves calculated according to the
invention for the waveforms of Figs. 9a and 9b at 3256.0 ft.
The dispersion curves show good agreement with TKO results and
provide shear slownesses which differ from DSTC determinations
by 3% and -1% respectively for the x-shear and y-shear. The
dispersion curves of Fig. 9c are of particular interest in
- 51 -
CD, 02506835 2005-05-09
that they are substantially parallel to each other but
displaced by a considerable distance. This is indicative of a
formation which is intrinsically anisotropic. The shear
anisotropy at 3256.0 feet was determined to be over 15% (see
Fig. 6b).
Fig. 10c provides dispersion curves for the formation at
3138.0 ft. The dispersion curves of Fig. 10c are of
particular interest for several reasons. First, while the SPI
results appear to agree with the TKO results, the difference
between SPI and DSTC is large (i.e., 10%) with respect to the
x-shear determination. Second, the shear anisotropy at 3138.0
ft is seen to be large (over 15%). Third, the dispersion
curves of Fig. 10c cross over each other. The cross-over is
indicative of stress-induced anisotropy. An indication of the
magnitude of the stress-induced anisotropy can be taken as the
area between the x-dipole and y-dipole dispersion curves below
the cross-over frequency times the area between the curves
above the cross-over frequency.
The dispersion curves of Fig. 11c at 3370.0 ft are of
particular interest for three reasons. First, the cross-over
of the dispersion curves suggests that the formation at 3370.0
ft has stress anisotropy. Second, the steep slope of the
- 52 -
CA 02506835 2005-05-09
dispersions curves (resulting in a significant difference
between the shear slowness at 0 Hz and 2.5 kHz) suggests
significant alteration of the formation at 3370.0 ft. Thus,
using an indicator of alteration which is calculated by
subtracting the formation slowness at OkHz from the formation
slowness at 2.5kHz and averaging the difference obtained for
the x-dipole data and the y-dipole data, an alteration index
of about 75 is obtained. Third, the difference between SPI
and DSTC is large (i.e., 10%) with respect to the x-shear
determination.
There have been described and illustrated herein methods
and apparatus for processing dispersive wave information in
order to determine the formation shear slowness. While
particular embodiments have been described, it is not intended
that the invention be limited thereby, as it is intended that
the invention be as broad in scope as the art will allow.
Thus, while the invention was described primarily in terms of
utilizing dispersive flexural waves in order to make desired
measurements and determinations, it will be appreciated that
other dispersive or non-dispersive waves could be utilized.
Also, while different details of embodiments for processing
the signals obtained by the receivers were described, and
numerous equations were set forth for describing the
- 53 -
CD, 02506835 2005-05-09
processing, it will be appreciated that other processing
methods and equations could be utilized provided that a
parametric expression for the dispersion curve is utilized.
Further, while particular parameters were described for
parameterizing the dispersion curves, it will be appreciated
that other parameters and different numbers of parameters
could be utilized. For example, instead of using normalized
frequencies, non-normalized frequencies could be utilized.
Also, instead of using a kick frequency and a flexion
frequency, the Bessel function parameters aandr3 could be
utilized. Further, instead of using slownesses at first and
second (normalized) frequencies, depending upon which other
parameters are utilized, fewer or more slownesses could be
utilized. In fact, one or more of the parameters (e.g., a
slowness at a certain frequency) could be set at a fixed
value.
It will also be appreciated by those skilled in the art
that while particular apparatus were described as preferred,
such as a tool utilizing x- and y- dipole sources and a
particular number dipole receivers, it will be appreciated
that other types and different numbers of sources and
receivers could be utilized. In fact, it should be
appreciated that various aspects of the invention can be
- 54 -
CA 02506835 2013-03-26
69897-75
implemented utilizing only x-dipole or only y-dipole sources.
Similarly, it will be appreciated that the processing means
for processing the obtained wave signals can take any of
numerous forms such as a computer, dedicated circuitry, etc.
Therefore, it will be appreciated by those skilled in the art
that yet other modifications could be made to the provided
invention without deviating from its scope as so
claimed.
- 55 -