Note: Descriptions are shown in the official language in which they were submitted.
CA 02510108 2005-06-14
WO 2004/059538 PCT/US2003/039945
METHOD, SYSTEM, AND PROGRAM FOR NETWORK
DESIGN, ANALYSIS, AND OPTIMIZATION
RELATED APPLICATIONS
This application is a non-provisional application claiming priority from the
following applications:
U.S. Provisional Application No. 60/384,807, entitled "A SYSTEM AND
METHOD AND COMPUTER PRODUCT FOR COUPLING A DATA
PROCESSING CENTER TO A LIVE DATA PROCESSING CENTER TO
PROVIDE FOR SPATIALLY VIEWING, ANALYZING, AND SHARING
ENTERPRISE DATA AND GEOSPATIAL DATA ACROSS MULTIPLE USERS,"
by T. von Kaenel et al., filed on March 16, 2002, and which is incorporated by
reference herein in its entirety;
U.S. Provisional Application No. 60/433,597, entitled "SYSTEMS AND
METHODS FOR REAL-TIME EVALUATING AND REPORTING ASSOCIATED
WITH INSURANCE POLICY UNDERWRITING AND RISK MANAGEMENT,"
by S. Kumar et al., filed on December 16, 2002, and which is incorporated by
reference herein in its entirety;
U.S. Provisional Application No. 60/437,990, entitled "SYSTEMS AND
METHODS FOR REAL-TIME EVALUATING AND REPORTING ASSOCIATED
WITH INSURANCE POLICY UNDERWRITING AND RISK MANAGEMENT,"
by S. Kumar et al., filed on January 6, 2003, and which is incorporated by
reference
herein in its entirety;
U.S. Provisional Application No. 60/449,601, entitled "SYSTEMS AND
METHODS FOR NETWORK DESIGN, ANALYSIS, AND OPTIMIZATION," by
Tim A. von Kaenel, filed on February 26, 2003, and which is incorporated by
reference herein in its entirety; and
is a Continuation-In-Part of U.S. Application No. 10/388,666, entitled
METHOD, SYSTEM, AND PROGRAM FOR AN IMPROVED ENTERPRISE
SPATIAL SYSTEM," by T. von Kaenel et al., filed on March 14, 2003, and which
is
incorporated by reference herein in its entirety.
CA 02510108 2005-06-14
WO 2004/059538 PCT/US2003/039945
BACKGROUND OF THE INVENTION
Field of the Invention
[0001] The present invention relates to method, system, and program for
network
design, analysis, and optimization.
2. Description of the Related Art
[0002] Businesses often seek the advice of network designers on ways to
design,
analyze and/or optimize network infrastructure. Such network infrastructure
may
make up any type of network, such as a local-area network (LAN), a home-area
network (HAN), a campus-area network (CAN), a metropolitan-area network (MAN),
and/or a wide area network (WAN), any of which may include of one or more of a
data network, a telecommunications network, a fiber optic network, a wireless
network, as well as any other type of network. Moreover, such design,
analysis,
and/or optimization may involve creating a new network or modifying an
existing
network, such as by adding to and/or replacing a portion of the existing
network.
[0003] In designing, analyzing, and/or optimizing a network, the network
designer
may have to identify the data-handling capacity and the cost of operating the
business's desired (i.e., existing and/or proposed) network, the business's
objectives
and requirements for the desired network, and the network infrastructure and
services
that are available for designing and/or optimizing the desired network. The
network
designer may then design and price a network proposal that meets the network
requirements.
[0004] Particularly challenging for the network designer is the task of
identifying
network service providers (NSPs) that provide network infrastructure and
service
(e.g., fiber optic service, wireless service, data service, telecommunications
service,
etc.) in a region of interest for a desired network. In many instances, a
network
designer may not know which NSPs service a particular region and what network
infrastructure a particular NSP may provide in the region.
[0005] Currently, a business that wants to design, analyze, and/or optimize a
network
will identify the desired network for the network designer. This
identification of the
desired network may include a list of the addresses (e.g., mailing addresses)
for the
business locations on the desired network. The desired network connections may
also
be provided to the network designer, such as in the form of a list identifying
the
-2-
CA 02510108 2005-06-14
WO 2004/059538 PCT/US2003/039945
network connection types (e.g., a T1 or a T3 connection) between identified
pairs of
addresses for the business locations on the network. With this data, the
network
designer may compute the capacity or bandwidth of the desired network, or a
portion
thereof, in any well-known manner.
S [0006] Typically, with no more than this data, a network designer will
contact the
NSPs believed to serve a region encompassing the desired network to identify
those
NSPs that offer the desired network services. The network designer may contact
each
such NSP to describe the desired network and to request a proposal. The
network
designer then obtains the NSP offers, selects the best ones, and reports them
to the
business for further consideration.
BRIEF DESCRIPTION OF THE DRAWINGS
[0007] Referring now to the drawings in which like reference numbers represent
corresponding parts throughout:
FIG. 1 is a block diagram of a system in accordance with the present
invention;
FIG. 2 is a flowchart diagram of a method in accordance with the present
invention;
FIG. 3 illustrates a computing environment in accordance with embodiments
of the invention;
FIGS. 4a, 4b, 4c, Sa, and Sb illustrate information maintained in a network
design database in accordance with embodiments of the invention;
FIGS. 6, 8, 11, 13, 17, and 23 illustrate operations performed by the network
design tool in accordance with embodiments of the invention; and
FIGs. 7, 9, 10, 12, 14-16, 18-22, and 24-26 illustrate examples of a graphical
user interface rendering network information in accordance with embodiments of
the
invention.
DETAILED DESCRIPTION
[0008] In the following description, reference is made to the accompanying
drawings
which form a part hereof and which illustrate several embodiments of the
present
invention. It is understood that other embodiments may be utilized and
structural and
-3-
CA 02510108 2005-06-14
WO 2004/059538 PCT/US2003/039945
operational changes may be made without departing from the scope of the
present
invention.
Identifyin~ a Network Service Provider to use to
Provide Network Services for a Distributed Network
[0009] Systems and methods consistent with the present invention assist a
network
designer in evaluating NSPs according to their ability to cost-effectively
provide
network services in support of a desired network. To this end, the systems and
methods consistent with the present invention may employ an NSP database,
which
may include data to help a network designer in making such evaluations. For
instance, the NSP database may include data representing user-selectable
criteria that
may be utilized by a network designer to evaluate each NSPs' ability to cost-
effectively provide desired network services and to evaluate each NSPs' offer.
[0010] FIG. 1 illustrates an exemplary system 10 consistent with the present
invention. System 10 may include one or more client computers 12 for
connection
through a network 14, such as the Internet, to a server 16, which may be
connected to
a database 18. Client computers 12 may comprise any conventional computer or
other client device that may include software, such as a web browser, for
accessing
server 16. Similarly, server 16 may comprise any conventional server that may
execute any conventional software code for implementing the method depicted in
FIG. 2.
[0011] As further described below, database 18, which may comprise one or more
databases, includes data that may be used by a network designer to evaluate
NSPs
according to their ability to cost-effectively provide desired network
infrastructure
and to evaluate each NSPs' offer. For example, database 18 may include data
for
conventionally displaying with a web browser on client computer 12 images,
such as
maps, which may simultaneously depict one or more of: 1) a business's desired
network (e.g., addresses of business locations and their respective network
connections for an existing network and/or a proposed network); 2) NSP
infrastructure (e.g., fiber optic lines, switches, cell towers, etc.) that may
be used to
provide the business's desired network; and 3) any other images or information
that
may be useful to a network designer in evaluating NSPs according to their
ability to
cost-effectively provide the desired network, such as geospatial data that may
depict
-4-
CA 02510108 2005-06-14
WO 2004/059538 PCT/US2003/039945
images of roads, boundaries, rivers, etc., particularly in and around the area
for the
requested network.
[0012] FIG. 2 illustrates an exemplary method consistent with the present
invention.
In step 20, a network designer may receive a network design request. In one
instance,
S a business may ask the network designer to design a new network.
Alternatively, a
business may ask the network designer to determine whether some part or the
whole
of the business's existing network may be optimized, expanded, and/or
replaced. For
example, a business may ask the network designer to replace (or add to) a
portion of
the business's existing network with fiber optic infrastructure (e.g., fiber
optic lines,
switches, etc.) such that the completed network's system performance is
improved (or
at least not reduced) while operating costs are reduced (or maintained). Any
conventional means of reporting the request to the network designer may be
used,
such as telephone conference, email, facsimile, and the like.
[0013] In step 22, the business may provide the network designer with data
that may
identify the desired network. Such data may include the addresses for business
locations in the desired network, as well as network connections, such as a T1
or a T3
line, between identified pairs of business locations. The desired network may
include
addresses for business locations and network connections for: 1) an existing
network
that may be optimized; 2) an existing network that may be optimized and
integrated
with one or more additional proposed networks; or 3) a newly designed network.
Any
conventional means of reporting the desired network data to the network
designer
may be used, such as telephone conference, email, facsimile, and the like.
Alternatively, the network designer may research to assemble data that
identifies the
business's existing network infrastructure.
[0014] In step 24, the network designer may submit from client computer 12 to
server
16 the network data reported at step 22 to identify the desired network (i.e.,
an
existing network and/or a proposed network). For example, the network designer
may
submit to server 16 the network data in a flat file form or by entering the
network data
into a web form using client computer 12. Network data for submission to
server 16
in a flat file form may be stored in client computer 12 in a CSV format (comma
separated values) or any other suitable format. Network data for submission to
server
16 by entering the data into a web form may be made available to server 16
using any
conventional web hosting technology. In addition to providing the network data
(e.g.,
-5-
CA 02510108 2005-06-14
WO 2004/059538 PCT/US2003/039945
business address locations and network connections for the desired network) to
server
16, the network designer may use client computer 12 to add to, delete, or
otherwise
change the network data, either before or after having been provided to server
16.
[0015] In step 26, server 16 may employ one or more conventional programs to
perform the well-known geographic information system (GIS) processes of
cleansing,
validating, and geocoding the data identifying the desired network. To cleanse
and
geocode the desired network data, the Centrus AddressBroker product from
Sagent
Technology, Inc. of Mountain View, California may be used. Oracle version
9.1Ø4
with Spatial Extensions may be used to validate the desired network data in
any
manner well known to those skilled in the art. However, those skilled in the
art
understand that any other conventional programs may be used to cleanse,
validate,
and geocode the data identifying the desired network. The GIS preparation
(e.g.,
cleansing, validating, and geocoding) of the desired network data for display
on client
computer 12 may be automated in any well-known manner such that the business
locations for the desired network and their network connections may be viewed
in an
image, such as a map, on client computer 12. To facilitate such viewing,
server 16
may also store in a database, such as database 18, at least the data for such
network
infrastructure.
[0016] Geocoding is a well-known GIS process that, among other things, may
permit
displaying objects on a map. The geocoding process may associate with each
business address provided in step 22 a latitude and a longitude value.
Following such
associations, a geocoded (as well as cleansed and validated) business address
location
may be queried using conventional GIS spatial queries to determine the
address's
location relative to the location of any object that may be represented by
other
geocoded data sets that may be accessed by server 16. For example, using
conventional GIS spatial queries, server 16 may determine the relative spatial
positioning between two or more objects (e.g., between an address location and
a
point on an NSP's fiber optic line that may be considered for network service
to the
address location). Having determined the correct relative spatial positions
between a
plurality of objects that may be represented with geocoded data, server 16 may
correctly show the objects in an image, such as a map, on a client computer
display.
[0017] At step 28, the network designer may identify for his further
consideration a
network that is the same as, smaller, or larger than the one specified by data
received
-6-
CA 02510108 2005-06-14
WO 2004/059538 PCT/US2003/039945
in step 24 (i.e., the business address locations and network connections from
step 24).
For example, the network designer may identify a set of building locations,
which
may include all of the building locations submitted at step 24, less than all
of these
locations (if, for example, only a portion of the network was to be
optimized), or more
than all of these locations. In addition to identifying the building locations
for
network designer consideration, the network connections may be identified by
server
16 automatically selecting all of the network connections identified in step
24 that
connect to any of the business locations selected in step 28. The set of
building
locations and network connections identified in step 28 may ultimately be
contained
in a network proposal by the designer such that they are connected in a manner
to
enhance network efficiency, such as by replacing some or all of the prior
network
connections with lines having improved data-handling capacity (e.g., fiber
optic).
[0018] The network data from step 24 (e.g., business locations and network
connections) may be viewed by the network designer on a client computer
display to
facilitate the identification of step 28. Geocoding of the network data may
facilitate
such viewing. Any conventional technique may be employed for this
identification.
For example, using client computer 12 the network designer may send server 16
conventional GIS spatial queries that would retrieve from database 18 the
desired
business locations and network connections. Alternatively, the network
designer may
select from a menu of predefined identification options (e.g., select all of
the business
locations and network connections from step 24). Also, the network designer
may use
a graphical use interface (GUI), such as a mouse-driven pointer, to
conventionally
select one or more regions on the client computer display, the selected
regions
displaying the business locations and network connections that are to be the
network
identified in step 28 for network designer consideration.
[0019] At step 30, server 16 may compute the total bandwidth requirements for
the
desired network identified in step 28. Those skilled in the art understand
that this
computation may be done in any one of several conventional ways that may
utilize, as
a factor, the bandwidth of the desired network, as identified at step 28,
across the
building locations and network connections identified in step 28.
[0020] At step 32, the network designer may select one or more criteria to
identify
NSPs that may be able to provide the infrastructure needed to configure the
desired
network identified in step 28, pursuant to the requirements of the selected
criteria.
CA 02510108 2005-06-14
WO 2004/059538 PCT/US2003/039945
The network designer may use a GUI, such as a mouse-driven pointer, to select
from
a set of predefined criteria shown on the client computer display. Client
computer 12
may send the selected criteria to server 16, which may then access the NSP
database
to retrieve the NSPs that may fulfill the requirements of the selected
criteria. In
retrieving the sought-after NSP data, server 16 may send conventional GIS
spatial
queries to the NSP database.
[0021] One such criteria may be used to identify NSPs that may provide fiber
optic
service, such as one or more fiber optic lines and fiber optic switches, to
one or more
building locations in the desired network of step 28. Alternatively, a
selection criteria
may be used to identify NSPs that provide a predefined network service, such
as fiber
optic service, within a defined distance from one or more building locations
in the
desired network of step 28. For example, although a particular NSP may not
provide
fiber optic service to any building location identified in step 28, the NSP
may provide
fiber optic service within a defined distance of one or more of the identified
building
locations (i.e., the NSP may have a fiber optic line less then a defined
distance from a
building location).
[0022] Those skilled in the art understand that there may be a number of other
criteria
that could be valuable to the network designer in endeavoring to evaluate NSPs
according to their ability to cost-effectively design, analyze, and/or
optimize a
business's desired network and to evaluate each NSPs' offer. For example, the
network designer may find it useful to know: 1) how long specified NSPs have
been
offering a specified service; 2) the size of the customer base in a specified
service for
specified NSPs; 3) the total bandwidth offered by a specified NSP for a
specified
service; 4) the available bandwidth offered by a specified NSP for a specified
service;
and 5) any other criteria that a network designer may find useful to identify
NSPs for
making such evaluations.
(0023] Accordingly, the NSP database, which may be a part of or separate from
database 18, may include any of such criteria, which may be stored as
conventionally
cleansed, validated, and geocoded data. Any commercially available database
with
such data may be used for the NSP database. For example, GeoTel, Inc. of
Orlando,
Florida provides GeoTel Data Sets called GeoTel Fiber, GeoTel Connect, GeoTel
Exchange, GeoTel Networks, GeoTel Wireless, and GeoTel Analyst that include
network infrastructure data for NSPs providing fiber optic, data, voice, and
wireless
_g_
CA 02510108 2005-06-14
WO 2004/059538 PCT/US2003/039945
services. Regardless of whether a commercially available database that may be
used
for the NSP database is available from the manufacturer with cleansed,
validated, and
geocoded data, those skilled in the art understand that one or more
conventional
programs may be used to cleanse, validate, and geocode the NSP data. For
example,
to cleanse and geocode the NSP data, the Centrus AddressBroker product from
Sagent
Technology, Inc. of Mountain View, California may be used. Oracle version
9.1Ø4
with Spatial Extensions may be used to validate the NSP data in any manner
well
known to those skilled in the art. However, those skilled in the art
understand that
any other conventional programs may be used to cleanse, validate, and geocode
the
NSP data.
[0024] At step 34, the network designer may analyze one or more spatial views
depicting network infrastructure for the NSPs identified in step 32 that may
be used to
fulfill the proposed network of step 28. The client computer display may
provide a
series of user-selectable viewing options for the network designer, such as
viewing
network infrastructure for one or more of the NSPs identified in step 32. For
example, a list of NSPs identified in step 32 may be displayed on client
computer 12
from which the network designer may select one or more to view the network
infrastructure available to provide the desired network identified at step 28.
Those
skilled in the art understand that server 16 may use conventional GIS spatial
queries
to retrieve from the NSP database the requested spatial views of NSP
infrastructure,
such as a view that depicts the available Fiber optic network infrastructure
for an NSP
that has fiber optic service available to one or more business locations
identified at
step 28. It will also be apparent to those skilled in the art that the data in
the NSP
database representing available NSP network infrastructure may be geocoded for
displaying purposes.
[0025] At step 36, the network designer may request for the NSPs identified in
step
32 a ranking of their ability to provide cost-effective service for the
desired network.
Client computer 12 may display a list of ranking criteria from which the
network
designer may select with a GUI, such as a mouse-driven pointer. To perform the
requested ranking, server 16 may send conventional GIS spatial queries, as
known to
those skilled in the art, to database 18 to compare the network infrastructure
of the
NSPs identified in step 32 with the desired network of step 28.
-9-
CA 02510108 2005-06-14
WO 2004/059538 PCT/US2003/039945
[0026] For example, one ranking criteria may rate the NSPs identified in step
32 by
determining for each such NSP the number of business locations identified in
step 28
to which the NSP has network service, such as fiber optic service, already
connected
(i.e., the number of "hits"). For this exemplary ranking criteria, server 16
may display
on client computer 12 a list of the NSPs, arranged in order according to their
respective number of "hits." An alternative criteria may be used to rank NSPs
that
provide a predefined network service, such as fiber optic service, within a
defined
distance from one or more building locations in the desired network of step
28.
[0027] Such rankings may be valuable to the network designer in evaluating the
NSPs, because they indicate for each NSP how many business locations in the
desired
network are already connected to, or within a defined distance of, a sought-
after
networking service, such as fiber optic service. For example, if the network
designer
knows that a particular NSP has the most fiber optic service "hits" to or near
business
locations in the desired network, then the designer may conclude that that NSP
should, with all other factors being equal, be able to provide the most cost-
effective
quotation. The network designer may reach such a conclusion because the NSP
that
provides the requested network service, such as fiber optic service, to or
near to the
most business locations does not have to spend as much money (and pass it
along in
their quotation to the network designer) to establish new fiber optic
connections.
[0028] At step 38, the network designer may spatially view on the client
computer
display the network infrastructure available from a specified NSP for
servicing the
desired network identified in step 28. Client computer 12 may display a list
of the
NSPs identified in step 32, such as an NSP ranking list from step 36. Using a
GUI,
such as a mouse-driven pointer, the network designer may select one or more of
the
listed NSPs. Server 16 may then use conventional GIS spatial queries to
database 18
to retrieve for display on client computer 12 the selected network
infrastructure, such
as a particular NSP's fiber optic network infrastructure for servicing the
desired
network identified in step 28.
[0029] In step 38, the network designer may also select with a GUI, such as a
mouse-
driven pointer, an option for server 16 to generate and display one or more
reports that
may contain: 1) a spatial view of the complete set of building locations (from
step
24); 2) a spatial view of the desired network (from step 28); 3) the bandwidth
requirement for the desired network (from step 30); 4) a spatial view of the
building
-10-
CA 02510108 2005-06-14
WO 2004/059538 PCT/US2003/039945
locations with "hits" (whether they be direct "hits" to a building location or
"hits"
within a defined distance of a building location) for a specified NSP, such as
the NSP
capable of providing the most cost-effective service quotation (from step 36);
and 5) a
spatial view of the network infrastructure for the desired network from a
specified
NSP, such as the NSP capable of providing the most cost-effective service
quotation
(from step 38).
[0030] In step 40, the network designer may annotate any of the reports from
step 38.
For example, the network designer may use a client computer GUI, such as a
mouse-
driven pointer and/or a keyboard, to instruct server 16 to incorporate text,
such as a
title and a subtitle for a report, shapes, such as arrows to specified areas
in a spatial
view of a report, or any other information that the network designer wishes to
incorporate into a report.
[0031) In step 42, the network designer may use client computer 12 to direct
server
16 to save on database 18 any of the results from the analysis that was
performed or
any of the reports that were generated for sharing, at step 44, with a
customer, other
consultants, or any other interested party.
[0032) It will be apparent to those skilled in the art that various
modifications and
variations can be made to the system and method of the present invention
without
departing from the spirit or scope of the invention. For example, although
aspects of
the present invention may be described as replacing existing network
infrastructure
with a fiber optic network, one skilled in the art will appreciate that
systems and
methods consistent with the present invention may also be employed to create,
optimize, expand, and/or replace desired network infrastructure using non-
fiber optic
networks, such as wireless networks, traditional data networks,
telecommunications
networks, etc. The present invention covers the modifications and variations
of this
invention provided they come within the scope of the appended claims, or any
subsequently-filed claims, and their equivalents.
Network Design Tool
[0033) FIG. 3 illustrates a computing environment in which embodiments may be
implemented. A client system 100, which may comprise any computing device
known in the art, such as a workstation, desktop computer, laptop computer,
hand
held computer, server, telephony device, etc. The client 100 includes a
network design
-11-
CA 02510108 2005-06-14
WO 2004/059538 PCT/US2003/039945
tool 102 to enable an administrator to design their network infrastructure and
select
NSPs to use to provide the network connections, including entry/exit points in
buildings, protocols to use, fiber connections, etc. The network design tool
102
would render a user interface 104, which may comprise a graphical user
interface
(GUI), to enable a user to interact with a network design database 106 having
information on network infrastructure available through recognized NSPs. The
network design tool 102 may query the network design database 106 to determine
information on NSP network infrastructure within a specified geographical
location
and the location of customer sites that will need to link to the existing NSP
network
infrastructure. The client 100 may access the network design database 106 over
a
network 108, such as a Local Area Network (LAN), Wide Area Network (WAN), the
Internet, and Intranet, etc. Alternatively, the client 100 may be directly
connected to
the system implementing the network design database 106. The network design
database 106 may implement any data store architecture known in the art, such
as a
relational database, non-relational database, etc.
(0034) The client 100 includes a client data manager 110, which is used to
upload
client information for a user to the network design database 106. The network
design
tool 102 may utilize a database client program to submit queries to a database
server
controlling access to the network design database 106 to access and update the
data
therein.
[0035) FIGS. 4a, 4b, and 4c illustrate examples of data structures including
information on NSP network infrastructure maintained in the network design
database
106. FIG. 4a illustrates NSP information 120 maintained for each NSP for which
network infrastructure information is available. The NSP information 120 for
one
NSP includes an NSP identifier 122, a switch list 124 identifying the one or
more
switches deployed by that NSP and a path list 126 providing information on the
geographical location of one or more network routes made available by the NSP
that
are accessible through the switches identified in the switch list 124.
[0036] FIG. 4b illustrates switch information 130 providing information on
each
switch identified in the switch lists 124 in the NSP information records 120.
The
switch information 130 for a switch includes a switch identifier 132, such as
a unique
world wide name or serial number, a switch geographical location 134, e.g.,
latitude
-12-
CA 02510108 2005-06-14
WO 2004/059538 PCT/US2003/039945
and longitude, and switch bandwidth 136 indicating the network bandwidth
available
through that switch.
[0037] FIG. 4c illustrates path information 140 providing information on each
path or
network route identified in the path list 126 of the NSPs. A network path may
comprise cables, wires, optical fiber, copper wire or a wireless network,
e.g., "hot
zone", covering a defined geographic region. The path information 140 for a
switch
includes: a path (route) identifier 142; a list 144 of the switches along the
route of the
path, a geographical route 146 comprising spatial and geographical information
identifying the physical route of the network path or area, which may include
the
multiple points or a radius defining the geographical route or area of the
path; and the
path bandwidth 148 indicating the network bandwidth available through that
path.
[0038] The available infrastructure offered by an NSP would be defined by the
switches and paths provided by that NSP as indicated in the switch 130 and
path 140
information in the network design database 106. Additional information on the
NSP
1 S network infrastructure may also be provided.
[0039] The network design database 106 would further include information on
users
authorized to access the network design database and groups of customer
locations
maintained for that user. FIG. Sa illustrates a user data record 150
including: a user
identifier (ID) 152, which may also include a password to authorize access; a
customer list 154 including multiple customers for that user, where each
customer is a
grouping associated with one or more customer sites potentially needing
network
access; and other user information 156, such as settings or preferences of a
user.
[0040] FIG. Sb illustrates the customer information 160, where there is
customer
information 160 for every customer identified in the customer list 154 for the
users.
The customer information 160 includes: a customer identifier 162, which may
include
descriptive information; customer sites 164 indicating one or more customer
sites
requiring network access, including longitude and latitude information of each
site;
site connections 166 indicating connections between the customer sites; site
information 168 including information on the site, such as network bandwidth,
street
address, users at site, etc.; and location connection information 170
providing
information on the connections between the sites, such as bandwidth, etc.
[0041] FIG. 6 illustrates operations performed by the network design tool 102
program to initiate a user session to access information in the network design
database
-13-
CA 02510108 2005-06-14
WO 2004/059538 PCT/US2003/039945
106. Upon the user initiating a session (at block 200), the network design
tool 102
determines (at block 202) the customer list 154 from the user data 150 for the
user
initiating the session and determines from the customer information 160 for
each
customer identified in the determined customer list 154 all customer site
locations. A
geographical region encompassing all determined customer site locations is
determined (at block 204). A street map including the determined geographical
region is then accessed (at block 206). The network design database 106 may
include
a street map database or the street map may be accessed from another street
mapping
program. The accessed street map region is rendered (at block 208) in a map
section
of the user interface 104, such as the map section 202 shown in the GUI 206 of
FIG.
7. The map section 202 may display all or a portion of the accessed street map
region
accessible through scrolling user interface elements.
[0042] A selection box is then displayed (at block 210) for each customer in
the user
customer list 154 in the user interface 104, such as the displayed section 204
of the
user interface 300 listing each customer in the customer list for the user and
a check
box next to each customer name to enable selection of that customer, where
each
customer is capable of being associated with one or more customer sites. The
network design tool 102 may query (at block 212) the NSP information 120 (FIG.
4a)
for each NSP included in the network design database 106 to determine those
NSPs
having switches in the determined geographic region, based on the switch
location
information 134 in the switch information 130. The name of each NSP having a
switch in the determined geographic region is then rendered along with a check
box
enabling selection of the NSP. The user interface 200 of FIG. 7 shows a
display
region 206 listing NSPs providing fiber or network resources, including
switches and
paths, within the determined geographic region.
[0043] FIG. 8 illustrates operations performed by the network design tool 102
to
render information in the user interface 104 on the customer sites. Upon
receiving (at
block 250) user selection of a customer, which may be made by selecting one of
the
customer check boxes shown in the region 204 of the user interface 200 (FIG.
7), a
determination is made (at block 252) of all customer site locations for the
selected
customer from the customer site 164 information in the customer information
160
(FIG. 5b). A graphic representation of all the determined customer sites is
rendered
(at block 206) at the customer geographic locations shown in the map region.
FIG. 9
-14-
CA 02510108 2005-06-14
WO 2004/059538 PCT/US2003/039945
illustrates a user interface 270 whose map region 272 displays the customer
sites in
the street map as small darkened circles, e.g., 274, thereby allowing
identification of
the customer sites for a selected customer, which in user interface 270 is
"Customer
A" 276.
[0044] Fig. 10 illustrates a user interface 280 showing information that is
displayed
when a user selects a site location in the map region 282 and then selects to
display
information on that site in dialog box 284, such as by selecting an icon or
menu item
from the user interface 280. The rendered site information 284 may be accessed
from
the site information 168 for that customer site in the customer information
160 (FIG.
Sb) in the database 106.
[0045] FIG. 11 illustrates operations performed by the network design tool 102
to
render linkages between the customer sites in the user interface 104. Upon
receiving
(at block 300) user selection of a "show linkages" box for a listed customer,
a
determination is made (at block 302) of the connections between all the
customer sites
of the selected customer and lines are rendered (at block 304) illustrating
the
determined connections between the selected customer sites.
[0046] FIG. 12 illustrates a user interface 310 showing in the map region 312
the
determined connections, e.g., 314, between the customer sites for Customer A,
where
the selection box to cause the display of the sites for customer A and the
linkages of
customer A are shown as elements 314 and 316, respectively.
[0047] FIG. 13 illustrates operations performed by the network design tool 102
to
perform a query related to the customer connections to determine information
thereon.
Upon initiating (at block 350) a query of customer connections, a query box is
rendered (at block 352) including selectable fields in which a user can select
and enter
search criteria on parameters to query. The network design tool 102 would then
initiate a query (at block 354) of the site 164 or connection 166 information
to
determine site locations or connections satisfying the search criteria. The
location or
connections resulting from the query are rendered (at block 356) differently
in the
map region to indicate they are query results.
[0048] FIG. 14 illustrates a user interface 360 showing the display of a query
box 362
in which the user may select parameters and search criteria on which to query.
For
instance, the user may select to query on switch type and/or a specific
geographical
-15-
CA 02510108 2005-06-14
WO 2004/059538 PCT/US2003/039945
location, such as city, zip code, street, etc., and enter or select the search
criteria of the
query parameters in the query box 362.
[0049] FIG. 15 illustrates a user interface 370 showing the rendering of the
connections resulting from the query in a different manner than other
connections.
For instance, in the map region 372, the connections satisfying the query
parameters,
such as connections which would use a certain switch type, e.g., Optical
Carner 3
(OC3), have a certain bandwidth, etc., are rendered with a dashed line, e.g.,
374,
whereas connections that do not satisfy the query are rendered differently,
such as
with a solid line, e.g., 376.
[0050] FIG. 16 illustrates a user interface panel 380 displaying a dialog box
382
including information on a connection, which would be rendered in response to
the
user selecting a displayed connection and then selecting to display
information on the
selected connection, where the information rendered in the dialog box 382
would be
accessed from the connection information 170 (FIG. Sb).
1 S [0051] FIG. 17 illustrates operations the network design tool 102 performs
to allow
the user to obtain information on NSP network infrastructure available at
customer
sites. The user would select (at block 400) one or more displayed customer
sites and
enter information (at block 402) defining a buffer region for the selected
site, where
the buffer specifies a region, such as a radius, around a site location to
consider for
available NSP infrastructure. The network design tool 102 then queries (at
block 404)
the switch information 130 to find all switches whose geographic location 134
(FIG.
4b) falls within the boundaries of the buffer defined around one of the
selected
customer sites. All determined switch locations are rendered (at block 406) in
the
map region in manner different than the customer sites are rendered to
distinguish the
two. All the determined switch locations in a buffer are rendered (at block
408) in the
map region as contained within the buffer region in a manner different than
the switch
locations that do not fall within one buffer region.
[0052] The buffers would identify those NSP switches that the network designer
may
select to use as the network infrastructure for the selected customer sites,
i.e., that
network infrastructure with a defined geographic proximity (within the buffer)
to NSP
network infrastructure..
[0053] FIG. 18 illustrates a user interface 420 having a dialog box 422 in
which the
user enters a buffering distance 424, a unit measurement 426 of the buffer
distance, a
-16-
CA 02510108 2005-06-14
WO 2004/059538 PCT/US2003/039945
color 428 in which to render the buffer region, and a manner in which to
render the
representations of the switches that fall within the buffer region 428, e.g.,
lighted
points, etc.
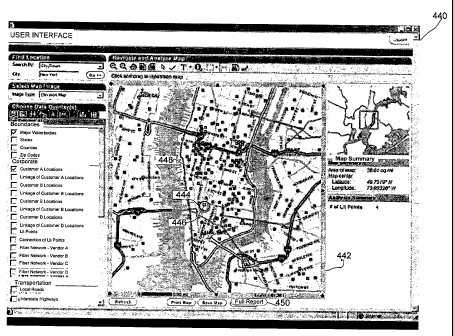
[0054] FIG. 19 illustrates a user interface 440 including a map region 442 in
which is
displayed a buffer region, represented by circle 444, including switch sites
displayed
lit 446, as opposed to switch sites displayed outside of the buffer region 444
shown as
darkened boxes, e.g., 448. The user may select a "full report" button 450 to
generate
a report on all the switches that fall within the buffers around the selected
customer
sites.
[0055] FIG. 20 illustrates an example of the full report rendered in user
interface 460
including information on all the switches that are located within the selected
buffer
regions of the selected customer sites. The report would include information
identifying the switch, such as the NSP 462, the geographical location 464 in
terms of
longitude and latitude, and the distance from the customer site 466. The
network
designer may review this full report to determine a switch and NSP to use to
connect
to from the customer site.
[0056] FIG. 21 illustrates a user interface 470 rendering the network
connections
between the switch sites for a selected vendor, which in user interface 470 is
the
vendor 472. The network connections between NSP switches would be rendered as
overlaid over the rendering of the transportation corridors or other rendered
points-of
interest in the map. Number 472 identifies a rendered connection and number
474
identifies a rendered street in the map region 476. The rendered connections
may be
displayed darker and overlaid over the rendered transportation corridors. This
allows
the network designer to visualize the route of the connections for the
selected NSP
overlaid with respect to the street layout of the map.
[0057] FIG. 22 illustrates a user interface 490 showing a zoom view of a
customer
site, shown as triangle 492, which provides greater detail as to the street
location, and
shows other switches, e.g., 494 and other customer sites, e.g., 496, within
the
displayed buffer region 498. User interface 490 further shows a line 500 the
network
designer would have added from one switch 502 in the buffer 498 and the zoomed
customer site 492, which would further visualize information on such a
proposed
connection, such as the distance.
-17-
CA 02510108 2005-06-14
WO 2004/059538 PCT/US2003/039945
[0058] FIG. 23 shows operations the network design tool 102 may perform to
assist
the user in visualizing different network design options. Upon initiating (at
block
520) the design operations to design a network, such as a Metropolitan Area
Network,
(MAN)/Wide Area Network (WAN), the network design tool 102 receives (at block
522) user selection of customer sites to consider as nodes in the network
being
designed. The user selected customer sites are rendered (at block 524)
differently
than non-selected customer sites. The buffer region definition is further
received (at
block 526), which may be entered through a dialog box such as shown as box 422
in
FIG. 18. The switch information 132 for all switches are queried (at block
528) to
locate all switch locations in the buffer regions for the selected sites. All
determined
switch locations are rendered (at block 530) on the map in a manner different
than the
rendering of the customer sites. The switch locations are further rendered (at
block
532) within the rendered buffer regions in a different manner than the switch
locations
outside of the buffer regions.
[0059) FIG. 24 illustrates a user interface 550 including four selected
customer sites,
e.g., 552, and lines, e.g., 554, drawn between the sites illustrating a
network ring that
may be formed for the selected customer sites.
[0060] Fig. 25 illustrates a user interface 560 including buffers, e.g., 562,
rendered
around each of the selected customer sites.
[0061] FIG. 26 illustrates a user interface 570 showing a report of all the
switches and
their NSPs that fall within the buffer region of each of the selected customer
sites,
including the switch ID 572, the switch NSP 574, and the customer site address
576,
as well as other information that would assist the network designer in
designing a
network.
[0062] The described network design tool enables a network designer to
visualize
customer sites, NSP network infrastructure and the relationship therebetween
to
provide information the network designer may then use to select optimal
network
infrastructure from the determined best possible NSPs. The rendered
information
allows network designers to make a comprehensive assessment and analysis of
network infrastructure available for use with their network nodes.
-18-
CA 02510108 2005-06-14
WO 2004/059538 PCT/US2003/039945
Additional Embodiment Details
[0063] The described network design tool may be implemented as a method,
apparatus or article of manufacture using standard programming and/or
engineering
techniques to produce software, firmware, hardware, or any combination
thereof. The
term "article of manufacture" as used herein refers to code or logic
implemented in
hardware logic (e.g., an integrated circuit chip, Programmable Gate Array
(PGA),
Application Specific Integrated Circuit (ASIC), etc.) or a computer readable
medium,
such as magnetic storage medium (e.g., hard disk drives, floppy disks, tape,
etc.),
optical storage (CD-ROMs, optical disks, etc.), volatile and non-volatile
memory
devices (e.g., EEPROMs, ROMs, PROMS, RAMs, DRAMS, SRAMs, firmware,
programmable logic, etc.). Code in the computer readable medium is accessed
and
executed by a processor. The code in which preferred embodiments are
implemented
may further be accessible through a transmission media or from a file server
over a
network. In such cases, the article of manufacture in which the code is
implemented
may comprise a transmission media, such as a network transmission line,
wireless
transmission media, signals propagating through space, radio waves, infrared
signals,
etc. Thus, the "article of manufacture" may comprise the medium in which the
code
is embodied. Additionally, the "article of manufacture" may comprise a
combination
of hardware and software components in which the code is embodied, processed,
and
executed. Of course, those skilled in the art will recognize that many
modifications
may be made to this configuration without departing from the scope of the
present
invention, and that the article of manufacture may comprise any information
bearing
medium known in the art.
[0064] FIGs. 4a, 4b, 4c and Sa, Sb illustrate examples of data structures that
maintain
information on customer sites and NSP network infrastructure. This information
may
be maintained in a format different than shown. Further, additional
information may
be provided for the customer sites and NSP resources.
[0065] Certain figures, such as FIGS. 7, 9, 10, 12, 14-16, 18-22, 24, 25, and
26, depict
a GUI interface with the map region and selectable customers and vendors in a
particular orientation. In alternative embodiments, the arrangement of the GUI
may
differ and include different, less or more information than shown.
[0066] The described embodiments discussed allowing a network designer to
query
and render information on customer sites, NSP switches, and NSP paths.
Additional
-19-
CA 02510108 2005-06-14
WO 2004/059538 PCT/US2003/039945
information on the NSP resources and customer sites may additionally be
provided
and stored in the network design database.
[0067] The illustrated logic of FIGs. 1, 6, 8, 11, 13, 17, and 23 show certain
events
occurring in a certain order. In alternative embodiments, certain operations
may be
performed in a different order, modified or removed. Moreover, steps may be
added
to the above described logic and still conform to the described embodiments.
Further,
operations described herein may occur sequentially or certain operations may
be
processed in parallel. Yet further, operations may be performed by a single
processing unit or by distributed processing units.
[0068] FIG. 27 illustrates one implementation of a computer architecture 600
of the
network components shown in FIGS. 1 and 3, such as in the clients, server,
database,
etc. The architecture 600 may include a processor 602 (e.g., a
microprocessor), a
memory 604 (e.g., a volatile memory device), and storage 606 (e.g., a non-
volatile
storage, such as magnetic disk drives, optical disk drives, a tape drive,
etc.). The
storage 606 may comprise an internal storage device or an attached or network
accessible storage. Programs in the storage 606 are loaded into the memory 604
and
executed by the processor 602 in a manner known in the art. The architecture
further
includes a network card 608 to enable communication with a network. An input
device 610 is used to provide user input to the processor 602, and may include
a
keyboard, mouse, pen-stylus, microphone, touch sensitive display screen, or
any other
activation or input mechanism known in the art. An output device 612 is
capable of
rendering information transmitted from the processor 602, or other component,
such
as a display monitor, printer, storage, etc.
[0069] The foregoing description of various embodiments of the invention has
been
presented for the purposes of illustration and description. It is not intended
to be
exhaustive or to limit the invention to the precise form disclosed. Many
modifications
and variations are possible in light of the above teaching. It is intended
that the scope
of the invention be limited not by this detailed description, but rather by
the claims
appended hereto. The above specification, examples and data provide a complete
description of the manufacture and use of the composition of the invention.
Since
many embodiments of the invention can be made without departing from the
spirit
and scope of the invention, the invention resides in the claims hereinafter
appended.
- 20 -