Note: Descriptions are shown in the official language in which they were submitted.
CA 02515723 2005-08-10
WO 2004/072291 PCT/US2004/003684
USE OF HOP ACIDS IN FUEL ETHANOL PRODUCTION
BACKGROUND
The present invention relates to an improved process for controlling micro-
organisms in an aqueous process medium by using hop acids. The present
invention
further relates to the manufacture of fuel ethanol. More particularly, it
relates to a
process for the production of fuel ethanol using hop acids.
There exists in the world today an enormous demand for liquid fuels and this
is
being supplied almost entirely by distilled petroleum oils. It is, of course,
well known
that petroleum is a non-renewable resource and that finite supplies of this
fuel source
exist. As a result, there is now a very active search for alternative liquid
fuels or fuel
extenders.
In light of the steadily increasing demand for liquid fuels and the shrinking
resources for petroleum crude oil, researchers have begun to investigate
alternative
liquid fuels to determine the feasibility of commercially producing such
substitutes in
order to fulfill this increasing demand. Recent world events, including the
shortage of
petroleum crude oil, the sharp increase in the cost of oil and gasoline
products, and the
political instability of many oil-producing countries, have demonstrated the
vulnerability
of the present sources of liquid fuels. Even if such supply and economic
instabilities
were acceptable, it is clear that the worldwide production of petroleum
products at
forecasted levels can neither Deep pace with the increasing demand nor
continue
indefinitely. It is becoming evident thafi the time will soon come when there
will have to
be a transition to resources which are plentiful and preferably renewable.
One of the most generally recognized substitutes which could be made available
in significant quantities in the near future is alcohol, and in particular,
ethanol. For
example, there are currently many outlets in the United States and throughout
the world
which sell a blend of gasoline and about 10 percent to 20 percenfi ethanol
(commonly
called "gasohol") which can be used as a fuel in conventional automobile
engines.
Furthermore, ethanol can be blended with additives to produce a liquid ethanol-
based
fuel, with ethanol as the major component, which is suitable for operation in
most types
of engines.
Ethanol can be produced from almost any material which either exists in the
form
of, or can be converted into, a fermentable sugar. There are many natural
sugars
available for fermentation, but carbohydrates such as starch and cellulose can
be
-1 -
CA 02515723 2005-08-10
WO 2004/072291.. PCT/US2004/003684
f i : i !. ~ y 1' [j. ~~,. , ,: ~f '~ ~rr1!1 yuf 1 m'i(~" n
,:~ ,:dn ~~ n' ~ n~ul~- r:e (~~ t[<cil l~ n, ~ , IY~,,tl :v::dt ii~_:tp 1~:~~t
converted into fermentable sugars which then ferment into ethanol. Even today,
throughout most of the world, ethanol is produced through the fermentation
process.
Ethanol can also be produced synthetically from ethylene.
Starch is one of the world's most abundant renewable raw materials. One
answer to the need for alternative reproducible fuels is to convert this very
abundant
material at low cost into fermentable sugars as feedstock for fermentation to
ethanol. A
process medium used in the production of fuel ethanol is intended to be an
inclusive
term encompassing any of the mediums in which lactic acid or acetic acid
bacteria can
live and used in the production of fuel ethanol or spirits and includes, but
is not limited
to, feedstock, any saccharified or hydrolysised starch or sugar medium, any
starch or
sugar medium including yeast, and/or the distillate from any fermentation
process. The
starch for the feedstock process usually comes from crops such as corn, milo,
wheat,
malted barley, potatoes and rice. The fermentable sugars obtained from starch
are
glucose and maltose and these are typically obtained from the sfiarch by
hydrolysis or
saccharification, e.g. acid hydrolysis or enzyme hydrolysis. Most hydrolysis
techniques
~ehich have been available have tended t~ be very expensive in terms of
producing a
feedstoch for large scale alcoh~I production. In terms of maximizing ethanol
production
from a starch raw mafierial source, it is desirable to have the fermentables
as high as
possible in the fermentation substrate.
Experience has taught that it is preferable to add malt enzymes, such as
glucoamylase, ~ehich aid in the hydrolysis of starches and conversion of the
higher
complex; dextrin and dea~~trose sugars which are present in the sugar
solutions of the
prior art fermentation processes. Malt enzymes can be purchased, or in the
case of
whiskey production, extracted naturally from malted barley. While such malt
enzymes
add a desirable flavor to ethanol produced for human consumption, the malt
enzymes
do not make ethanol a more advantageous liquid fuel substitute and, in fact,
could
create problems for such a use.
After the saccharification step is complefied, the fermentable sugars are
added
to yeast where fermentation begins. Alternatively, today many distillers add
the
enzyme to the fermenter with the yeast. This simultaneous saccharification and
fermentation allows for higher concentrations of starch to be fermented. If
the sugar
source comes from crops such as sugar cane, sugar beets, fruit or molasses,
saccharification is not necessary and fermentation can begin with the addition
of yeast
and water.
-2-
CA 02515723 2005-08-10
WO 2004/072291" PCT/US2004/003684
"':: ,:,,
f f 1 " ~~~ ~:: ,~ m u.n. hm ~f, ,
~n~ i ~.::_~ ...~~... ''',.- i~::l~, ~I lE ~~~ ~ it n '~' ~~:~~ ~:.::~',
I~:::r_e ~r_.~; '~~
With the typical known systems for producing ethanol from starch, e.g. using a
dual enzyme system for liquefying and saccharifying the starch to glucose
followed by
batch fermentation, total processing times of 60 to 80 hours are usual.
Fermentation
times of 50 to 70 hours are commonplace. Such long total residence times
result in
enormous tankage requirements within the processing system when large scale
ethanol
production is contemplated.
In the fermentation process, yeast is added to a solution of simple sugars.
Yeast
is a small microorganism which uses the sugar in the solution as food, and in
doing so,
expels ethanol and carbon dioxide as byproducts. The carbon dioxide comes off
as a
gas, bubbling up through the liquid, and the ethanol stays in solution.
Unfortunately,
the yeast stagnate when the concentration of the ethanol in solution
approaches about
15 percent by volume, whether or not there are still fermentable sugars
present.
In order for nearly complete fermentation, and in order to produce large
quantities of efihanol, the common practice has been to use a batch process
wherein
extremely large fermentation vessels capable of holding upwards of 500,000
gallons
are used. pith such large vessels, it is economically unrealistic to provide
an amount
of yeast sufficient to rapidly ferment the sugar solution. Hence, conventional
fermentation processes have required 72 hours and more because such time
periods
are required for the yeast population to build to the necessary concentration.
For
example, a quantity of yeast is added to the fermentation vessel. In
approximately 45-
60 minutes, the yeast population will have doubled; in another 45-50 minutes
that nevi
yeast population v~eill have doubled. It tales many hours of such propagation
to
produce the quantity of yeast necessary to ferment such a large quantity of
sugar
solution.
The sugars used in traditional fermentafiion processes have typically
contained
from about 6 percent to 20 percent of the larger, complex sugars, such as
dextrins and
dextrose, which take a much longer time to undergo fermentation, if they will
undergo
fermentation, than do the simple hexose sugars, such as glucose and fructose.
Thus, it
is common practice to terminate the fermentation process after a specified
period, such
as 72 hours, even though not all of the sugars have been utilized. Viewing the
prior art
processes from an economic standpoint, it is preferable to sacrifice the
remaining
unfermented sugars than to wait for the complete fermentation of all of the
sugars in the
batch.
One of the important concerns with conventional fermentation systems is the
-3-
CA 02515723 2005-08-10
WO 2004/072291" ~ PCT/US2004/003684
~ ~~,~;~ ~ a'~ ~~::~G ;~aa~P ~~,:~' i~,:l~, a~:~~~ ~~..:~i ~?!~~E iiiuiH jø~~i
~ ~"~~~:
difficulty of maintaining a sterile condition free from bacteria in the large-
sized batches
and with the long fermentation period. Unfortunately, the optimum atmosphere
for
fermentation is also extremely conducive to bacterial growth. Should a batch
become
contaminated, not only must the yeast and sugar solution be discarded, but the
entire
fermentation vessel must be emptied, cleaned, and sterilized. Such an
occurrence is
both time-consuming and very costly.
Additionally, many of these bacteria compete with the yeast for sugar, thereby
reducing the amount of ethanol that is produced. Bacteria can grow nearly ten
times
faster than yeast, thus contamination in these areas are inevitable. Upon the
consumption of sugar, these bacteria produce lactic acid and other byproducts.
Further, if the fermentation vessels are not properly disinfected or
sterilized between
batches or uses, bacteria and other undesirable microorganisms can become
attached
to the interior walls of the fermentation vats where they will grow and
flourish. These
undesirable microorganisms may contaminate ethanol co-producfis such as animal
feed, or they may consume valuable quantities of the substrate, or sugar, thus
reducing
the production of efihanol. The economics and efficiency of fermenfiafiion
processes are
frequenfily such fihafi they cannot fiolerafie any such loss of production.
~uring the manufacfiuring of fuel efihanol, bacteria contaminafiion occurs in
nearly
every sfiep of the process v~here water and starch/sugar are presenfi afi
temperafiures
belovd ~~0 °C. Contamination generally originafies from fibs sfiarch
material since these
crops pick-up bacteria from fibs field. !lashing the mafierial helps lower
fibs bacfieria
count, however, bacfieria contaminafiion is unavoidable. An example of fihis
is in the
wet-milling processes where corn is steeped for about 24.-48 hours. Just the
soaking of
dried c orn kernels i n water g enerates I actic a cid I evels a s h igh a s 0
.5%. F or a very
gram of lactic acid formed, nearly two grams of starch is lost. Last~bacillus
brevis and
Last~baeillus fermentum are two heterofermenter bacteria commonly found in
distillery
mashes. These bacteria are able to convert one mole of glucose into one mole
of lacfiic
acid and one mole of acefiic acid respectively in addition to one mole of
ethanol and one
mole of carbon dioxide.
Current methods used to kill these unwanted microorganisms, among others,
often involve introduction of foreign agents, such as antibiotics, heat, and
strong
chemical disinfectants, to the fermentation before or during production of
ethanol.
Commonly, synthetic chemical antibiotics are added to the fermentation vessels
in an
attempt to decrease the growth of lactic acid producing bacteria. The addition
of each
-4-
CA 02515723 2005-08-10
WO 2004/072291.. PCT/US2004/003684
.I,:.,. 1l :-' ~}~,L~ ;~::~lr li:,~l[ il"~f , ,; r'W",~ __~,'(;,
,~_'.°z:. ;yi~~~ ~i"I~"
F
of these foreign agents to the process significantly adds to the time and
costs of ethanol
production. Antibiotics are very expensive and can add greatly to the costs of
a large-
scale production. If no antibiotics are used, a 1 to 5 percent loss in ethanol
yield is
common. A fifty million-gallon fuel ethanol plant operating with a lactic acid
level of 0.3
percent weight/weight in its distiller's beer is loosing roughly 570,000
gallons of ethanol
every year due to bacteria. The use of heat requires substantial energy to
heat the
fermentation vessels as well as possibly requiring the use of special,
pressure-rated
vessels that can withstand the high temperatures and pressures generated in
such heat
sterilizing processes. Chemical treatments can also add to the cost of
production due
primarily to the cost of the chemicals themselves, these chemicals are often
hazardous
materials requiring special handling and environmental and safety precautions,
and are
not "green", i.e., are not organic.
After fermentation, traditional processes have removed the efihanol fr~m fihe
fermentation solution and further concentrafied the efihanol product by
distillation.
Distillation towers capable of such separation and concentration are well-
known in the
art. F~Ilo~ving fermenfiafiion, fihe 5 fio 15 percenfi alcoholic solufiion,
often referred to as
distiller's beer or wine, is concenfirafied fio 50 to 95 percent ethanol via
disfiillafiion. This
efihanol can be used "as is" to make spirits. Alternatively, the 95 percenfi
efihanol,
generally made afi fuel ethanol plants, is passed fihrough molecular sieves
fio remove
the remaining wafier fio make fuel grade efihanol, greater than 99~/~ ethanol,
used for
blending with gasoline.
Fuel ethanol is produced by a dry milling or vaefi milling process. Dry-
milling
starts by grinding dry corn kernels infio nearly a powder, followed by cooking
and
treatment w ith h igh t emperature a nzymes t o b reak d own t he s tarch i
nto fermentable
sugars. This sugary solution containing about 30 percent solids, 70 percent of
which is
sfiarch, is cooled to 30 °C, treated with yeast and fermented into
ethanol via batch or
continuous fermentation. The efihanol is isolated from this solufiion via
distillafiion. The
remaining solids in this solufiion are isolated, dried and sold as catfile
feed.
During wet-milling, dry corn kernels are steeped with water to allow the
kernels
to absorb moisture. The steep water is removed and the soaked kernels get
loosely
ground and processed through a number of steps to separate the germ, the
fiber, the
gluten and the starch. The starch is processed into high fructose corn syrup,
of which
some gets sold to candy, food and soda companies. The remaining high fructose
corn
syrup is treated with yeast and fermented into ethanol.
-5-
CA 02515723 2005-08-10
WO 2004/072291. PCT/US2004/003684
m it . ~ ~y~ li" " ~ t,~~ ~y It,.l,
"' it,ue -t~ o'~~ ~::~j ~~:If !~~ ~~ ,,'~~ l~".~~ "'..~r'.~:~f i~.~i
There is much to be desired in the field of ethanol production for effective
fermentation vessel sterilization that is safe, low cost, and environmentally
sound, yet
which enhances, rather than degrades or limits efficient alcohol producing
microorganism activity. There is a need in the art for a compound and a method
in
which to increase fuel ethanol yields from fermentation.
Hops have been used in brewing for well over one thousand years. This pine-
cone-looking ingredient is known to impart bitterness, aroma, and preservative
properties to beer. Many of the active compounds responsible for bitterness
are also
responsible for the hop's preservative properties. These compounds have been
identified and are organic acid in nature. One major compound within the hop
is an
organic acid known as humulone, also referred to as alpha acids. Alpha acids
make-up
to 15 percent w/w in dry hops and over 50 percent by weight of carbon dioxide
hop
extract. ~uring the brewing of beer, hops are boiled and the alpha acids
undergo
thermal isomerization forming a new compound known as isoalpha acids. Isoalpha
acids are the actual bittering and preserving compounds found in beer.
O~rer the past forty years the hop industry has developed into a high-
technology
ingredients supplier for the bre~eing industry. Today hops are e~;tracted
e~ith CO2 and
much of this C02 hop extract is further processed to separate the alpha acid
fraction
from the remainder of the hop extract. The alpha acids are then thermally
isomerize
into isoalpha acids and formulated to exact specifications for ease of use and
precise
addition to beer. C~erivatives of isoalpha acids are also made by performing
simple
chemical reductions. These reduced isoalpha acids, specifically rho-isoalpha
acids,
tetrahydroisoalpha acids (THIAA) and hexahydroisoalpha acids (HHIAA) are very
stable
toward light and heat.
There is a need in the art for a compound and a method to reduce
microorganism growth in fuel ethanol fermentation in order to increase ethanol
yield.
These and other limitations and problems of the past are solved by the present
invention.
BRIEF SUMMARY OF THE INVENTION
A method and compound for the reduction of lactic acid producing micro-
organisms in a process medium is shown and described.
In one embodiment, when an aqueous alkaline solution of hop acid is added to a
process medium having a pH less than the pH of the alkaline hop acid solution,
the hop
acid is especially effective at controlling micro-organisms. Indeed, the
overall usage of
-6-
CA 02515723 2005-08-10
,.WO 2004/072291 , ,, , PCT/US2004/003684
~~"~'' iL..s II .,: S~~t1 ~u~:it lf,~:~Y .,~ll" L.,'" liy~~i ,~~~t. lii~'~i
;~'~il~ I~~:~,r
hop acid for obtaining the desired effect can be enormously reduced.
Accordingly, a
process is disclosed for controlling micro-organisms in an aqueous process
medium
including adding an aqueous alkaline solution of a hop acid to the process
medium,
wherein the pH of the aqueous alkaline hop solution is higher than the pH of
the
process medium.
As a result of the low dosage quantity of added solution compared to the
process
medium, the solution adapts almost entirely the pH of the process medium when
added
to the process medium and the hop acid passes from the disassociated form
(salt form)
to the associated (free acid), anti-bacterial effective, form. Surprisingly,
hop acid is
especially effective as an anti-bacterial agent when used in this manner. In
addition
different forms of
hop acids can be used which could otherwise not be used or could only be used
at low
effectiveness.
Isomerized hop acids are particularly effective at controlling the bacterial
growth
in the process mediums or streams of distilleries. Indeed, by using a
standardised
solution of isomeri~ed hop acids, one is able to accurately dose the amount of
hop acid
required to control bacterial growth.
The invention will best be understood by reference to the following detailed
descripfiion of the preferred embodiment, taken in conjunction with the
accompanying
drawings. The discussion below is descriptive, illustrative and ea~emplary and
is not to
be taken as limiting the scope defined by any appended claims.
ERIEF ~ES~I~IF~TI~f~ ~F SE~EI~f~L lllE~~ ~F THE ~F~a~911'~~~
Figure 1 shows growth of Lacfvbacillus brevis LTH 5290 (Lb. brevis) at a range
of different concentrations of various hop compounds and derivates of hop
compounds
in modified MRS at 86 °F. MRS medium adjusted to pH 5.2 was inoculated
with Lb.
brevis (106 organism/mL) After 60 hours incubation growth was assessed
photometrically at 578 nm in a cell of 1 cm path length: c~-acids; ~-acids and
essential oils; ~ rho-iso-a-acids; ~ iso-o-acids; a hexahydro-iso-a-acids; 0
tetrahydro-
iso-a-acids.
Figure 2 shows growth of Lactobacillus fermentum LTH 5289 (Lb.fermentum) at
a range of different concentrations of various hop compounds and derivates of
hop
compounds in modified MRS at 96.8 °F. MRS medium adjusted to pH 5.2 was
inoculated with Lb.fermentum (106 organismlmL) After 60 hours incubation
growth was
assessed photometrically at 578 nm in a cell of 1 cm path length: ~a-acids; ~
~3-acids
-7-
CA 02515723 2005-08-10
WO 2004/072291 PCT/US2004/003684
;_,i i j ,' f t
'-, ,; ,. ,' ,t , ~1 a~~. ,
Z ~::.!_ ?! :'' r '~d r~i'~'S' liiii ~in~y s,''~' iI:,:IY Yu~~~t: ~~~i~~. ;
ii~; t~i:~ r
c.
and essential oils; ~ rho-iso-a-acids; D iso-a-acids; o hexahydro-iso-a-acids;
0
tetrahydro-iso-a-acids.
Figure 3 shows the development of ethanol yield at decreasing viable cell
numbers of Lb. brevis correlated with increasing concentrations of tetrahydro-
iso-a-
acids in molasses wont. Molasses wort containing 129.74 g/L of sucrose was
contaminated with initial bacterial cell numbers of 106/mL. Fermentation was
carried
out at pH 5.2 and 86°F for 96 hours.
Figure 4 shows the development of ethanol yield at decreasing viable cell
numbers of Lb. fermentum correlated with increasing concentrations of
tetrahydro-iso-
a-acids in molasses wort. Molasses wort containing 129.74 g/L of sucrose was
contaminated with initial bacterial cell numbers of 106/mL. Fermentation was
carried
out at pH 5.2 and 96.8°F for 72 hours.
Figure 5 shows the development of ethanol yield at decreasing viable cell
numbers of Lb. brevis correlated with increasing concentrations of hexahydro-
iso-a-
acids in molasses wort. Molasses worfi containing 129.74 g/L of sucrose was
contaminated Edith initial bacterial cell numbers of 106/mL. Fermentation was
carried
out at pH 5.2 and 96.8°F for 72 hours.
Figure 6 shows the developmenfi of ethanol yield at decreasing viable cell
numbers of Lb. fermen~um correlated with increasing concentrations of
hexahydro-iso-
a-acids in molasses wore. Molasses wont containing 129.74 g/L of sucrose was
contaminated with initial bacterial cell numbers of 106/mL. Fermentation was
carried
out at pH 5.2 and 98.8°F for 72 hours.
Figure 7 shows the development of ethanol yield at decreasing viable cell
numbers of Lb. brevis correlated with increasing concentrations of iso-a-acids
in
molasses wort. Molasses wort containing 129.74 g/L of sucrose was contaminated
with
initial bacterial cell numbers of 106/mL. Fermentation was carried out at pH
5.2 and
86°F for 96 hours.
Figure 8 shows the development of ethanol yield at decreasing viable cell
numbers of Lb. fermentum correlated with increasing concentrations of iso-a-
acids in
molasses wort. Molasses wort containing 129.74 g/L of sucrose was contaminated
with
initial bacterial cell numbers of 106/mL. Fermentation was carried out at pH
5.2 and
96.8°F for 72 hours.
Figure 9 shows the decrease of bacterial metabolites produced by Lb. brevis at
increasing concentrations of tetrahydro-iso-a-acids in fermented molasses
wont.
_g_
CA 02515723 2005-08-10
WO 2004/072291" I PCT/US2004/003684
~:,;r.1~~.,~ ;~~ ;l,:.l> ;~~,,,i (~.~1 I("~(" _; e'' 1~;;'..L1 ~~.~~~~ !~'u~U
a(:'~~ II"~"
Figure 10 shows the decrease of bacterial metabolites produced by Lb.
fermentum at increasing concentrations of tetrahydro-iso-a-acids in fermented
molasses wort.
Figure 11 shows the decrease of bacterial metabolites produced by Lb, brevis
at
increasing concentrations of hexahydro-iso-a-acids in fermented molasses wort.
Figure 12 shows the decrease of bacterial metabolites produced by Lb.
fermentum at increasing concentrations of hexahydro-iso-a-acids in fermented
molasses wort.
Figure 13 shows the decrease of bacterial metabolites produced by Lb. brevis
at
increasing concentrations of iso-a-acids in fermented molasses wort.
Figure 14 shows the decrease of bacterial metabolites produced by Lb.
fermentum at increasing concentrations of iso-a-acids in fermented molasses
wort.
Figure 15 shows the synchronized decrease of bacfierial metabolites produced
by Lb. brevis and residue sugar at increasing concentrations of tetrahydro-iso-
a-acids in
fermented molasses wort.
Figure 15 shoe~es the synchr~nized decrease of bacterial mefiab~lites produced
by Lb. brevis and residue sugar at increasing concentrations of hexahydr~-iso-
a-acids
in fermented molasses wort.
Figure 17 shows the synchronized decrease of bacterial metabolites produced
by Lb. fermentum and residue sugar at increasing concentrations of hea~ahydro-
iso-a-
acids in fermented molasses wort.
Figure 18 shows the synchronized decrease of bacterial metabolites produced
by Lb. brevis and residue sugar at increasing concentrations of iso-a-acids in
fermented
molasses wort.
Figure 19 shows the synchronized decrease of bacterial metabolites produced
by Lb. fermentum and residue sugar at increasing concentrations of iso-a-acids
in
fermented molasses wort.
Figure 20 shows the development of glucose-fructose-relation in residue sugar
and ethanol yield at increasing concentrations tetrahydro-iso-a-acids in
molasses wort.
Molasses wort containing 129.74 g/L of sucrose was contaminated with initial
bacterial
cell numbers of 106/mL Lb, brevis. Fermentation was carried out at pH 5.2 and
86°F for
96 hours.
Figure 21 shows the development of glucose-fructose-relation in residue sugar
and ethanol yield at increasing concentrations tetrahydro-iso-a-acids in
molasses wort.
_g_
CA 02515723 2005-08-10
WO 2004/072291.. PCT/US2004/003684
r,t I tu, . t p' tt, ~ sir ~, ~~ t ~~ ~ f tIa '~ i f i~ ,~ n
3 ~ N l~mrv 11 G~ it ~~.,:~~ v,y~i I~,:~ a ~ll_ , ~ 3~,.:~t "ar 1~4,~t.'.t~ai
.' ~~
Molasses wort containing 129.74 g/L of sucrose was contaminated with initial
bacterial
cell numbers of 106/mL Lb. fermentum. Fermentation was carried out at pH 5.2
and
96.8°F for 72 hours.
Figure 22 shows the development of glucose-fructose-relation in residue sugar
and ethanol yield at increasing concentrations hexahydro-iso-a-acids in
molasses wort.
Molasses wort containing 129.74 g/L of sucrose was contaminated with initial
bacterial
cell numbers of 106/mL Lb. brevis. Fermentation was carried out at pH 5.2 and
86°F for
96 hours.
Figure 23 shows the development of glucose-fructose-relation in residue sugar
and ethanol yield at increasing concentrations hexadydro-iso-a-acids in
molasses wort.
Molasses wort containing 129.74 g/L of sucrose was contaminated with initial
bacterial
cell numbers of 106/mL Lb. fermenfium. Fermentation was carried out at pH 5.2
and
96.8°F for 72 hours.
Figure 24 shows the development of glucose-fructose-relation in residue sugar
and ethanol yield at increasing concentrations iso-a-acids in molasses wort.
Molasses
wort containing '129.74 g/L ~f sucrose was contaminated with initial bacterial
cell
numbers ~f 106/mL Lb. bret~is. Fermentation was carried out at pH 5.2 and
86°F for 96
hours.
Figure 25 shoes the development of glucose-fructose-relation in residue sugar
and ethanol yield at increasing concentrations iso-a-acids in molasses wort.
liftolasses
wort containing 129.7. g/L of sucrose was contaminated with initial bacterial
cell
numbers ~f 10~/mL Lb. fermen~ur~. Fermentation was carried out at pH 5.2 and
96.8°F
for 72 hours.
Figure 26 shows a comparison of ethanol yield. Molasses wort containing
129.74 g/L of sucrose was contaminated with initial bacterial cell numbers of
106/mL Lb.
brevis. Fermentation was carried out at pH 5.2 and 86°F for 96 hours.
Figure 27 shows a comparison of effectiveness in inhibition of Lb. bre~is.
!liable
cell count by fast streak plate technique on MRS plates anaerobically
incubated at 86°F
for 48 hours.
Figure 28 shows a comparison of ethanol yield. Molasses wort containing
129.74 g/L of sucrose was contaminated with initial bacterial cell number of
106/mL Lb.
fermentum. Fermentation was carried out at pH 5.2 and 86°F for 96
hours.
Figure 29 shows a comparison of the effectiveness in inhibition of Lb.
fermentum. Viable cell count by fast streak plate technique on MRS plates,
anaerobic
-10-
CA 02515723 2005-08-10
WO 2004/072291 PCT/US2004/003684
.,t; i Jj,,_ yi, ss"n
1 ,,~~ ,", ~~,n. n ;",
~F" I ...: ...~r :~li ,",~~ il:~l f,:,~" ; E ,~,~~ ~"~ .y;r. ~ !t a,
altly incubated at 96.8°F~~forl~48~hours.
Figure 30 shows the development of ethanol yield at decreasing viable cell
numbers of Lb. brevis correlated with increasing concentrations of tetrahydro-
iso-a-
acids in wheat mash. Wheat mash containing 59.96 % of fermentable substance
was
contaminated with initial bacterial cell numbers of 10'/mL. Fermentation was
carried
out at pH 5.2 and 86°F for 96 hours.
Figure 31 shows the development of ethanol yield at decreasing viable cell
numbers of Lb. fermentum correlated with increasing concentrations of
tetrahydro-iso-
a-acids in wheat mash. Wheat mash containing 59.96 % of fermentable substance
was
contaminated with initial bacterial cell numbers of 10'/mL. Fermentation was
carried
out at pH 5.2 and 96.8°F for 72 hours.
Figure 32 shows the development of ethanol yield at decreasing viable cell
numbers of Lb. bre~is correlated with increasing concentrations of hexahydro-
iso-a-
acids in wheat mash. Wheat mash containing 59.96 °/~ of fermentable
substance was
contaminated with initial bacterial cell numbers of 10'lmL. Fermentation was
carried
out at pH 5.2 and 86°F for 96 hours.
Figure 83 shows the development of ethanol yield at decreasing viable cell
numbers of Lb. fermenfium correlated with increasing concentrations of
hexahydro-iso-
a-acids in wheat mash. Wheat mash containing 59.98 °/~ of fermentable
substance was
confiaminated with initial bacterial cell numbers of 10'/mL. Fermentation was
carried
out at pH 5.2 a,nd 96.8°F for 72 hours.
Figure 34 shows fihe developmenfi of ethanol yield at decreasing viable cell
numbers of Lb. brevis correlated with increasing concentrations of iso-a-acids
in wheat
mash. Wheat mash containing 59.96 % of fermentable substance was contaminated
with initial bacterial cell numbers of 10'/mL. Fermentation was carried out at
pH 5.2
and 86°F for 96 hours.
Figure 35 shows the development of ethanol yield at decreasing viable cell
numbers of Lb. fermenium correlated with increasing concentrations of iso-a-
acids in
wheat mash. Wheat mash containing 59.96 % of fermentable substance was
contaminated with initial bacterial cell numbers of 10'/mL. Fermentation was
carried
out at pH 5.2 and 96.8°F for 72 hours.
Figure 36 shows the development of ethanol yield, content of residue sugar and
bacteria metabolites at decreasing viable cell numbers of Lb. brevis
correlated with
increasing concentrations of tetrahydro-iso-a-acids in wheat mash.
-11-
CA 02515723 2005-08-10
WO 2004/072291, PCT/US2004/003684
P r Ip . 1 ~ IIu ~ . v I)u, I ~n~ F/ tn FI'IVF lyelf,
f~",l ~~~.t! ~~ .=' ~ ~~.::~~ _:~ It r~~11 '~ o ~,y ya~ s: ;jr 1~.:,~1 P! ;.N
..
Figure 37 shows the development of ethanol yield, content of residue sugar and
bacteria metabolites at decreasing viable cell numbers of Lb. fermentum
correlated with
increasing concentrations of tetrahydro-iso-a-acids in wheat mash.
Figure 38 shows the development of ethanol yield, content of residue sugar and
bacteria metabolites at decreasing viable cell numbers of Lb. brevis
correlated with
increasing concentrations of hexahydro-iso-a-acids in wheat mash.
Figure 39 shows the development of ethanol yield, content of residue sugar and
bacteria metabolites at decreasing viable cell numbers of Lb. fermentum
correlated with
increasing concentrations of tetrahydro-iso-a-acids in wheat mash.
Figure 40 shows the development of ethanol yield, content of residue sugar and
bacteria metabolites at decreasing viable cell numbers of Lb. brevis
correlated with
increasing concentrations of iso-a-acids in wheat mash.
Figure 41 shows the development of ethanol yield, content of residue sugar and
bacteria metabolites at decreasing viable sell numbers of Lb. fermentum
correlated with
increasing concentrations of iso-a-acids in wheat mash.
Figure 42 shows a comparison of ethanol yield. ~d~lheat mash containing 59.9
~/~
fermentable material was contaminated with initial bacterial cell numbers of
10 6/mL Lb.
brevis. Fermentation was carried out at pH 5.2 and 56°F for 95 hours.
Figure 43 shows a comparison of effectiveness in inhibition of Lb. brevis in
wheat mash. Viable cell count by fast streak plate technique on MRS plates
anaerobically incubated at 56°F for 4~ hours.
Figure 4~~ shows a comparison of ethanol yield. l~heat mash containing 59.9
~/~
fermenfiable material was contaminated with initial bacterial cell numbers of
lO~/mL Lb.
fermentum. Fermentation was carried out at pH 5.2 and 96.8°F for 72
hours.
Figure 45 shows a comparison of effectiveness in inhibition of Lb. fermentum
in
wheat mash. Viable cell count by fast streak plate technique on MRS plates
anaerobically incubated at 56°F for 45 hours.
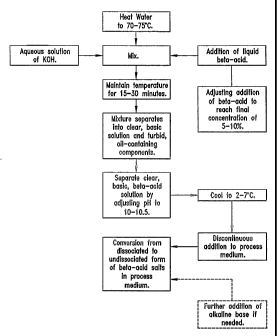
Figure 46 is a diagram of the one embodiment of the process sequence for
preparing an aqueous alkaline beta acid solution.
Figure 47 is a diagram of one embodiment for controlling the bacterial growth
in
a distillery where the fermentable solution is stored as a concentrate and the
isomerized hop acid is dosed into the feed streams going to the yeast growing
tanks
and fermentors immediately after dilution.
Figure 48 is a diagram showing the dilution of concentrated molasses in the
-12-
CA 02515723 2005-08-10
WO 2004/072291. _ PCT/US2004/003684
~~ . ', ~'.~"~i~ ~ ~t 4~"ty; ,~ i ~ ...,~I~ I'[:~~,, a ~~;~~,1!., ~a
flea ~ :~::~1~ ~~ s,~ ~~u~ u~ 1:c~31 !, g r ~::~ m t'~::f} !~~:. iy
distillery treated in accordance with Example 7.
Figure 49 is a diagram demonstrating how the yeast in the yeast growing tanks
were grown in the distillery treated in accordance with Example 7.
DETAILED DESCRIPTION OF THE PREFERRED EMBODIMENT
The invention is directed to a process for controlling micro-organisms in an
aqueous process medium comprising adding an aqueous alkaline solution of a hop
acid
to the process medium, wherein the pH of the aqueous alkaline hop solution is
higher
than the pH of the process medium.
The hop acid is a natural hop acid or a derivative thereof, such as, alpha
acid,
beta acid, tetrahydroalpha acid (THAA), or hexahydrobeta acid (HHBA), or
mixtures
thereof; an isomerized hop acid or a derivative thereof, such as, isoalpha
acid (IAA),
rhoiso alpha acid (RIAA), tetrahydro-isoalpha acid (THIAA) or hecahydro-
isoallpha acid
(HHIAA) or mixtures thereof. Alpha acids contained in the hop acid may be
transformed into isoalpha acids during the preparation of the hop acid
solution and
maintain their anti-bacterial/anti-microbial effect.
Depending on the h~p acid product, the concentration ~f h~p acid in the
aqueous
solution will vary. F.~r e~;ample, the concentration of THIAA in aqueous
solution is
generally 10 wt. °/~ while the concentration of IAA can be as high as
30 wt. °/~.
generally, the final concentrafiion of acid in the solution ranges from about
~ t~ about 40
wt. °/~, in another aspecfi from aboufi 5 to about ~0 wt. °/~,
an in another aspect from
about 10 to about 15 wt. °/~. Higher concentrations may be appropriate
where longer
transport: times arcs required. f~enerally, hop acids in their acid form
ea~hibit low
solubility in water. However, hop acids can be mixed wifih an alkali metal
hydroxide, for
example potassium hydroxide, to make a water soluble alkali metal salt of the
hop
acid. According, it is advantageous to use alkali hydroxides, for example
potassium
hydroxide or sodium hydroxide or a mixture thereof as the alkaline medium to
control
micro-organisms. The concentrations of the alkaline medium ranges from about
~0 °/~
to about 45 wt. %, or in another aspect from about 20 wt. °/~.
As discussed above, the pH of the aqueous alkaline hop solution is higher than
the pH of the process medium. As a result of the low dosage quantity of added
solution
compared to the process medium, the solution adapts almost entirely the pH of
the
process medium when added to the process medium and the hop acid passes from
the
salt form to the free acid, anti-bacterial effective, form. The pH of the
aqueous alkaline
hop acid solution added to the process medium ranges from about 7.5 to about
13.0, in
-13-
CA 02515723 2005-08-10
WOa 2004/072291. PCT/US2004/003684
ri> '~ ": , ta,r
,r< '
> / ~t
' y '~ IY q,u~~ ~I~a,a ~~"~y: ,i'~~ I~ ~ ~~ .crikC ~"rfr t n'p ~" ~~o
ni 3. s' c tus~ ,i v :ut~t~a~~.~in.t
another aspect from about 9.5 to about 11Ø A high bactericidal efficiency is
achieved
by using the solution in this range. The solution can be added without the
danger of
seriously damaging human skin. Furthermore, the solution does not create
unpleasant
or injurious vapors, unlike other chemical agents.
In one embodiment, the aqueous alkaline solution of hop acid is prepared
according as follows:
a) provide an aqueous medium;
b) heat;
c) adding a hop acid, preferably, melted hop acid, such that the final
concentration
of the hop acid is within a predefined range of concentration;
d) adding an aqueous alkaline medium to obtain a pre-defined pH;
e) mixing the alkaline medium with the added hop acid;
f) maintaining the mixture in a raised temperature range within a predefined
time
period;
g) separating the solution of hop acid from the mixture and
h) cooling-down the solution of hop acid.
Figure 4.6 is a diagram of the process sequence for preparing an aqueous
alkaline beta acid solution. In one embodiment, an aqueous solution of
potassium
hydroxide is heated from about 60 to about ~0~C, in another aspect from about
65 to
about ~5~~, in yet another aspect from about ~0 to about ~5~~ and the hop
acid, e.~.,
melted beta acid, is added into to the potassium hydroa:ide solution. The
temperature
of the mi~eture is subsequently maintained for aboufi 15 to ~0 minutes or
until the mia~ture
separates into a clear, alkaline beta acid solution and an oil containing
components.
The clear, alkaline beta acid solution generally having a pH of about 10 to
about 10.5 is
separated from the mixture and is then cooled to a temperature below room
temperature, such as to about 2 to about 7°G. This is subsequently
dosed into the
process medium discontinuously, e.g., by using shock dosage or continuously.
This process of preparing the aqueous alkaline solution of hop acid enables
the
preparation of a solution which can be stored and/or transported at higher
concentrations of hop acids over longer periods. Under these conditions, these
solutions are very stable. Its composition means that the solution can be
dosed by
pouring it in manually through hatches since it will not damage human skin,
nor does
the alkaline solution create unpleasant or injurious vapors unlike other
chemical agents.
Such solution provides appropriate characteristics for transport, the way to
apply the
-14-
CA 02515723 2005-08-10
WO 2004/072291... ' PCT/US2004/003684
~Z~ l ' ~ n~~ ; St.', '°°fi ~rr Su,j
!,k_:, ~e~_.,: ~_ ,~ v ,I:,:t~ ; ~E~ ;~~,_i ~ (h :,.e'' liu(I :_ ~-!t ~;~
y;~u~~ ~k"((;,
solution and storage because of alkaline behavior. Also the pH of the solution
is
selected to ensure the highest possible increase in effect when it is used
directly. The
solution can also be dosed through the closed dosage systems for the emission
free
dosage of common anti-bacterial substances. The procedural steps are able to
be
changed in their sequence in time. The aforementioned sequence provides a very
accurate definition of the pH of the aqueous alkaline hop acid solution.
In the process for controlling micro-organisms, the aqueous alkaline hop acid
solution can be added to the process medium continuously or discontinuously,
e.g.,
using shock dosage. For example, for shock dosage, the aqueous alkaline hop
solution
is periodically added to the process medium, e.g., the dosage is made at
defined times
within very short time intervals at which locally and for a short time
interval high
concentrations can be adapted. The high local concentrations achieved by this
kind of
dosing avoid the adaptation of the micro-organisms. The solution may be
manually
dosed into the process medium. Alternatively, the solution may be added to the
process medium through closed dosing systems. That means that control of micro-
organisms may be done under the use of the process installations (closed
dosing
systems) already available.
Generally, the temperature of the process medium to be treated is below
100°C,
in one aspect below 50°G and in another aspect below 30°~. As
discussed above, in
the process medium the aqueous all.aline hop acid solution mixes wifih the
slightly acid
or at least less alkaline reacting process medium. As a result of the love
dosage
quantities ofi the highly concentrated hop acid solution, e.g., beta acid ~r
alpha acid
solution, it adapts almost enfiirely to pFi of the process medium, where upon
the hop
acid transforms from its salt form into the anti-bacterially and/or
antimicrobially effective
free acid form.
In another embodiment, melted, commercial hop acids, such as beta acids, can
be directly added to the process medium. In such a process the melt is mixed
with
alkaline solution at an increased temperature shortly before a shock dosing.
After the
melt is dissolved, the entire mixture is dosed as a single shock. For short
periods,
strong alkaline conditions, which would lead to a loss of hop acids during
interim
storage, can be chosen.
The process for controlling micro-organisms can be automated by the use of
time controls for the dosing pumps and valves. In this case, too, an increase
of
efficiency occurs. The improved effect means that the overall concentration of
active
-15-
CA 02515723 2005-08-10
WO 2004/072291 PCT/US2004/003684
;~lnyF ~~,~~'..~' - . ,' ilruf°,uii~f ~Lu~~ ~~u~~n .~ f~[ l~s~l' "n~r
~~~Ltf~F~~s~Y'~:,~rt
ingredients can be reduced, which produces a number of advantages. Either
reduced
costs are achieved through lower dosing or the same dosing produces a better
effect.
For hop acids with the same concentration, the transport volume is reduced
because of
the greater efficiency.
The process for controlling micro-organisms can be applied in an advantageous
way in distilleries for the production of non-beer alcoholic drinks,
specifically of spirits or
in the production process of wine and wine containing drinks, further in the
production
of natural ethanol, fuel ethanol, and pharmaceutical drugs. The process can
also be
used in the production of all kinds of dairy products, yeast, fruit juices and
tinned foods
in aqueous solution. Furthermore the process may be used in the formulation of
cosmetic and detergent compositions.
It has also been discovered that isomerized hop acids and derivatives thereof
are particularly effective at controlling the bacterial growth of
distilleries. The
isomerized hop acids are easier to use than traditional hops. Indeed, by using
a
standardized solution of isomerized hop acids, one is able to accurately dose
the exact
amount of hop acid required t~ control bacterial growth.
Accordingly, in another embodiment, a process for controlling the bacterial
growth in a distillery is disclosed including adding an effective
antibacterial amount of
an isomerized hop acid to the process streams, e.g., yeast and/or fermentor
streams of
the distillery. In one embodiment, the process streams are treated with an
alkaline
aqueous solution of isomerized hop acid. Isomerized hop acids at
concentrations as
low as ~ ppm in the process medium can effectively control bacterial growth.
Because
isomerized hop acids are insoluble at concentration at about 100 ppm,
localized high
concentrations should be avoided.
Accordingly, the isomerized hop acid is preferably metered into the process
very
slowly, for example, by the use of small dosing pumps.
Figure 4.7 demonstrates an example where the fermentable solution is stored as
a concentrate and the isomerized hop acid is dosed infix the feed streams
going to the
yeast growing tanks and fermentors immediately after dilution. At very high
concentrations, greater than ~0 brix, no bacterial growth occurs, although the
bacteria
are still present in the feed material. After diluting the feed material to a
fermentable
concentration of about 25 brix, bacterial growth can occur. By adding the
isomerized
hop acid at this point in the process, bacterial growth can be inhibited right
from the
start.
-16-
CA 02515723 2005-08-10
WO 2004/072291 i PCT/US2004/003684
1..:, ~ i ! ~ if.. ,~ ,<< ii"a~ "i 3.~:,. y ~;~ F ff ,
~(; ~'' ~._ ~ rv ~ ~~. ~''._'.'.~J it.., ~ ii ,,~ t t ,".ai ~'".~r il,. ~
°~
An alternative to dosing the isomerized hop acid to both the yeast growing
tanks
as well as the fermentors is to dose a higher concentration of the hop acid
just into the
yeast growing tanks. Following yeast growth, the yeast solution containing the
isomerized hop acid is transferred to an empty fermentor. As the fermentor is
being
filled, fermentation is taking place and the hop acid concentration is being
diluted. If the
correct amount of isomerized hop acid is added to the yeast growing tanks
dilution in
the fermentor will provide a final isomerized hop acid concentration of about
2 to about
4 ppm. At this concentration the isomerized hop acid can still control
bacteria growth.
There are many advantages to using isomerized hop acids as antimicrobial
agents for the distilling industry. First, hop acids are natural products
which are used to
bitter beer consumed by millions of people every day. Clearly, they are safe
for human
consumption. Further, because these hop acids have boiling points over
200°C, there
is little need to be concerned with contaminating the distilled product with
hops and
therefore one can consider the use of hop acids as a processing aid. Finally,
the
dosing of is~merized hop acids is cost effective.
Hop acids are effective at controlling the growth of bacteria commonly found
in
fermentafiion streams. Sy controlling the growth of these bacteria, glucose
can be
converted infio ethanol instead of lactic acid and acetic acid thus increasing
ethanol
yield. Although all hop acids reduced bacteria count, those which controlled
the growth
of microorganisms better because of solubility issues were THIAA, HHIPeA and
I. pH
effects the minimum inhibitory concentrations (MIC) for hop acids. The lower
the pH of
the fermentation stream, the lower the amount of hop acids required to inhibit
bacfieria
growth. Temperafiure also effecfis the antimicrobial properties of hop acids
with the
higher the temperature, the lower the MIC.
Generally, although a range of concentrations are possible, the MICs are about
2
ppm of TIAA, about 3 ppm of HHIAA or about 4 ppm of IAA to control bacteria
growth in
yeast propagators and fermenters. Secause hop acids are insoluble at high
concentrations and low pH's, in one aspect, hop acid concentration should be
kept
below 100 ppm hop acid. This can be accomplished through the use of metering
pumps with a flow rate of 5-30 liters per hour. By adding hop acids at the
beginning of
yeast growth and at the beginning of fermentation, bacteria growth can be
inhibited
from the start of the fermentation process.
Various concentrations of hop acids were tested in MRS broth, molasses wort,
and w heat mash fermentations t o d etermine t he m inimum i nhibitory c
oncentration o f
-17-
CA 02515723 2005-08-10
WO 2004/072291, PCT/US2004/003684
' i. '~ ~ , , , n">
;;; ~e i~'.~' 3i, ~' ~~:lf ~ ..,f ~i:.~ f!"e(e ,,.'''' i~'!f a"!f i i~:~~
,~',~1~ a~"~,
the hop a cid t oward L b. b revis or Lb. fermentum. It w as determined that
hop acids
inhibited the growth of bacteria in both the MRS broth and the fermentations,
thereby
increasing the percent of ethanol produced.
In MRS broth, various concentrations of alpha acids, beta acids, IAA, rho-
isoalpha acids, THIAA, and HHIAA were added to MRS-broth treated with 106
cells/mL
of Lb. brevis or Lb. fermentum. In MRS-broth treated with 106 cells/mL of Lb.
brevis,
pH 5.2, 30 °C, the treated broth was held for 60 hours to determine the
MIC, as shown
in Fig. 1. Although alpha acids and beta acids inhibited the growth of Lb.
brevis, due to
solubility issues, these acids were not further tested in fermentation
experiments. The
MIC of alpha acids assayed at about 14 ppm, beta acids about 10 ppm, rho-
isoalpha
acids about 20 ppm, isoalpha acid about 16 ppm, THIAA about 3 ppm and HHIAA
about 3 ppm.
In another aspect, various concentrations of alpha acids, beta acids, isoalpha
acids, rho-isoalpha acids, THI , and HHIAA were added to MRS-broth treated
with
106 eells/mL of Lb. fermentum. The MRS-broth, pH 5.2, 36 °C was held
for 60 hours to
determine the i~IC as shown in Fig. 2. Although alpha acids and beta acids
inhibited
the growth of Lb. fern~entum, due to solubility issues, these acids v~ere not
further
tested in fermentation experiments. The MIC of alpha acids assayed at about 20
ppm,
beta acids about 'I8 ppm, rho-isoalpha acids about 20 ppm, IAA about 8 ppm,
THIAA
about 2 ppm and HHIAA aboufi 3 ppm.
i~ilC, minimum bactericidal concentration (MBC) and ethanol yields v~ere also
measured in molasses fermentations contaminated vdith 10~ cells/mL bacteria
and
treated with THIAA, HHIAA, and IAA as shown in Table 1. THIAA in molasses wort
had
a MIC of 3 ppm and MBC of 8 ppm for Lb. brevis and a MIC of 3 ppm and MBC of 6
ppm for Lb. fermentum. HHIAA in molasses wort had a MIC of 4 ppm and MBC 10
ppm
for Lb. brevis and a MIC of 4 ppm and MBC of 8 ppm for Lb. fermentum. IAA in
molasses wort had a MIC of 6 ppm and MBC of 12 ppm for Lb. brevis and a MIC of
4~
ppm and MBC of 8 ppm for Lb. fermentum. The ethanol yield for each
fermentation
was compared to the control fermentation. Treating the fermentation streams
with the
MIC of the corresponding hop acids lead to on average a 10% increase in
ethanol yield.
Table 1. MIC, MBC and Ethanol Yield on Molasses Fermentations Treated with Hop
Acids
Lb. Lb. Lb. Lb. % Ethanol
(HPLC)
brevis brevis fermentum fermentum
MIC MBC MIC MBC Lb. Lb.
brevis fermentum
-18-
CA 02515723 2005-08-10
WO 2004/072291 PCT/US2004/003684
ik°7P iii:; ' ,i... s;,=. ~iz.'i! ~!;.'(i I~~,~zx ~~"~(".,~.~ ~~",li
r;~(,~ ~aak ~aJx ii;~!~"
control- - - - 86% 80%
THIAA 3 ppm 8 pm 3 ppm 6 p m 92% 90%
HHIAA 4 ppm 10 ppm 4 ppm 8 ppm 92% 88%
IAA 6 ppm 12 ppm 4 ppm 8 ppm ~ 90% 88%
The
molasses
wort
contained
129.7g/L
sucrose,
pH=5.2
and
inoculated
with
106
bacteria
cells/mL
and
held
for
96
hours.
The
temperatures
were
30
C for
Lb.
brevis
and
36
C for
Lb,
fermentum.
THIAA
- tetrahydroisoalpha
acids,
HHIAA
-
hexahydroisoalpha
acids,
IAA
= isoalpha
acids.
Figures 26 and 28 show that fermentations ran faster when hop acids were used
instead of penicillin G and Virginiamycin.
MICs and ethanol yields were measured in wheat mash fermentations
contaminated with 106 cells/mL bacteria and treated with THIAA, HHIAA, and IAA
as
shown in Table 2. THIAA in wheat mash had a MIC of 6 ppm for Lb. brevis and a
MIC
of 4 ppm for Lb. fermentum. HHIAA in wheat mash had a MIC of 9 ppm for Lb.
brevis
and a MIC of 4 ppm for Lb. fermentum. I in wheat mash had a MIC of 14 ppm for
Lb.
brevis and a MIC of 9 ppm for Lb. fermentum. The efihanol yield for each
fermentation
was compared to the control fermentation. Treating the fermentation streams
with the
i~ilC of the corresponding hop acids resulted in an average 3-5°!~
increase in ethanol
yield.
'fade 2. SIC and Ethan~I ~iel~ ~n wheat dash i=errrnentati~ns Treated pith H~p
~cid~
Lb. brevisLb. /~ Ethanol
f~rn1 ~n~Gln1(HPLC)
MIC I~iIC L~. ~r~~~~L~.
d~~~U~~~~
control - - 86% 90%
THIAA 6 ppm 4 ppm 90% 94%
HHIAA 9 ppm 4 m 88% 93%
IAA 14 ppm 9 ppm 90% ~ 92%
The wheat mash contained 15.7% solids, 60% fermentable substance, pH=5.2 and
inoculated with 107 bacteria cells/mL and held for 96 hours. The temperatures
were 30
°C for Lb. brevis and 36 °C for Lb. fernlentum. . THIAA =
tetrahydroisoalpha acids,
HHIAA = hexahydroisoalpha acids, IAA = isoalpha acids.
In the fermentation experiments discussed below with sugar beet molasses wort
as medium, lactic acid bacteria were inoculated directly in used up MRS-broth.
This
technique was responsible for high initial concentrations of lactic acid and
acetic acid in
the wort and helped to visualize the effect of lactic acid bacteria
contamination of worts
by losses in ethanol yield. Even when bacteria are present in high numbers in
yeast-
mediated fermentations, they must create biomass quickly in order to create
enough
metabolic potential to compete with yeast cells for sugar and create ethanol
yield
-1g-
CA 02515723 2005-08-10
WO 2004/072291' ' " , ,( PCT/US2004/003684
('u F. ~~ ~~ - 'F ,t ,1 alt': I]::'Im t ~~rinil lau j~td i S
(4~~j i "E (, d'i/~ 7Iu:4 ~:::~I ~~.~~ ;f ~'~ r ~~x'!~ ~:~Zf 1~,:'~fa:~f
~f::,~~m
reducing levels of lactic acid prior to termination of fermentation
(Narendranath, N.V., et
al, Appl. & Envir. Microbiol., 63 (11 ):4158-4163, 1997). The specification of
the
amount of organic acids in the following refers to the amount of organic acids
(e.g.
lactic acid and acetic acid) produced during fermentation.
The decrease in viable cell numbers of lactic acid bacteria at increasing
concentrations of hop acids went along with a measurable decrease of bacteria
metabolites in fermented sugar beet molasses wort. In worts fermented with an
undamped contamination of lactic acid bacteria, the content of lactic acid and
acetic
acid produced by the bacteria during fermentation was approximately three
times as
high as in worts in which the bacteria had been successfully inhibited.
Parallel to the decrease of organic acids, the consumption of sugars by yeast
was improved and the content of residue sugar, consisting of raffinose,
sucrose,
glucose and fructose, in the fermented work decreased. The glucose-fructose
relation
in total residue sugar improved, while the unused portion of raffinose and
sucrose was
small and remained constant. The consumption of sugar by yeast is dependent on
the
glucose-frucfiose-relafiion in fibs medium. A glucose-firucfiose relation less
than 0.~
restricts yeast activity. there growth of lactic said bacteria yeas
undampened, glucose
was usually fiotally consumed by yeasfi and bacteria and high contenfis of
fructose
remained, provoking losses in efihanol yield up to about 15 ~/~. In worts, in
which fibs
growth of lactic acid bacteria had been successfully suppressed, residue sugar
contained glucose and fructose in a 1:~ relationship. Further, ethanol yields
improved
to aboufi 90 ~/~ and abo~se.
Yeasfi growth is affected when the bacfierial concentration exceeds 104 CFU/mL
(Essia, N et al., Appl. Microbiol. Biotechnol.; 33: 490 -493, 1990.) In
accordance with
this, best ethanol yields were achieved when the viable number of bacteria was
reduced below 104 CFU/mL and could generally not be improved any further by
continued reduction of bacterial cells afi higher concentrations of hop acids.
The
specific hop acid concentration afi which bacterial numbers are reduced below
10~/mL is
the "effective concentration".
1. Materials and Methods
In conducting the experiments described in the Example 1-5, the following
materials and methods were used. Variations known to one of skill in the art
in the
materials and methods are encompassed herein.
Bacteria used
-20-
CA 02515723 2005-08-10
WO 2004/072291 (( PCT/US2004/003684
r. ff '=.' f... i i tin s i I 1~ " ( r.~s t ~ rin I rt.~ ~f
,~~; h fy, .,.I r,,,.. ,ILK, ::~:~ II:~E .."~. .,>~' ~ I(~ul :>'~,~ I~~'~ar
If°;ti :,~,r
,:~
Two species of the genus Lactobacillus, both isolated from sourdough, were
used: Lactobacillus brevis (LTH 5290) and Lb. fermentum (LTH 5289).
Preliminary
tests showed that both species were capable of growth in sugar beet molasses
wort as
well as in wheat mash and were tolerant to more than 9% (vol/vol) ethanol.
Bacterial
count in stationary phase cultures which had been bred in, respectively, sugar
beet
molasses wort and wheat mash did not differ from bacterial count in stationary
phase
cultures bred in de Man-Rogosa-Sharps (MRS) broth. (107-10$ CFU/mL) Both
strains
belong to the family of heterofermentative lactobacilli, are able to ferment
sucrose and
their glucose-metabolism produces one mole lactic acid (DL-form), one mole
acetic acid
and ethanol, and one mole C02 per mole glucose. The optimal temperature for
growth
is 86°F of for Lb. brevis and 98.6°F of for Lb. fermentum.
Fermentation essays were at
each case carried out at the appropriate optimum temperature for the
contaminant.
Fermentation time was adapted to total consumption of sugar by yeast in an
undisturbed fermentafiion at each temperature condition. U~lorts contaminated
with Lb
brevis were incubated for 96 hours at 86 °F; worts contaminated with
Lb. fermentum
were incubated for ~2 hours at 98.6 °F.
media
De Man Rogosa Sharp Medium (Fa. Merck, Darmstadt) was used for
maintenance of the test organism. After having noticed that the bacteria would
not grow
well, as some of the glucose was made unavailable in I'Viaillard reactions
during
autoclaving, fibs medium yeas enriched with sterile glucose-solution after
sterilization,
adding 5 g/L of glucose to ii~RS-broth and II~iiRS-agar. This medium is
referred to as
M RS.
For estimation of MIC, the pH value of the medium was adjusted to pH 5.2 with
concentrated HCI before sterilization. This modified medium is referred to as
modified
M RS.
(i) Preparation of bacterial inocula for sugar beet molasses wort
The clean breed strains were kept frozen at -101.2°F in MRS-broth
containing
8%-glycerol and were inoculated from there in 10 mL cap tubes containing 2 mL
MRS-
broth. The headspace of each tube was flushed with filter sterilized (0.45 p,m
pore size
membrane filter) C02-gas and the caps were sealed with paraffin wax coated
film. The
tubes were incubated in a controlled environmental shaker at 100 rpm at
86°F (Lb.
brevis) respectively 96.8°F (Lb. fermentum). After 12 hours, 1 mL of
these preparatory
cultures were each transferred into 10 mL cap tubes containing 9 mL MRS-broth
and
-21 -
CA 02515723 2005-08-10
WO 2004/072291 ,~, ' a, ,n,T l~, f;n j f, ~ PCT/US2004/003684
~' ~l."h ~ ~ ~~ 11" . ~ E ~ ,~, ~a~ i.,. I,.~f ,
~r~~ ~..« /..it ~ ~~Gir t.., lC ar ~rw,~t .,~u~ ::,r~ y r
incubated for another 24 hours, afterlnrards transferred to 100 mL screw cap
flasks
containing 90 mL of MRS-broth and again incubated at the appropriate
temperature for
24 hours. After that the bacterial cells were aseptically harvested in sterile
centrifugal
tubes by centrifugation at 10,200x g for 15 minutes at 4 °C. The
pellets were washed
twice with sterile 1 % peptone water and resuspended in 20 mL of sterile 0.85
% saline
solution. These portions were transferred to 1 L screw cap flasks, containing
750 mL
MRS-broth and were again incubated for 24 hours. Cell numbers of the organisms
were estimated using a Beck photometer. An even function describing the
relationship
between the optical density against MRS-broth at 578 nm wavelength and the
number
of colony forming units per mL was established for both strains. The
inoculation of
sugar beet molasses wort with lactobacilli took place directly in MRS-medium
instead of
'adding yeast extract as nutrient supplement for yeast. A filter sterilized
(0.45 ~,m pore
size membrane filter) 5 ~,I aliquot of the MRS-cell suspension for inoculation
was
determined by high performance liquid chromatography using a ProntoSIL 120-3-
C18
AQ column which analyzes sugars, organic acids and alcohol, making sure
glucose in
the SIRS-medium e~ould be totally consumed and determining the amount of
lactic acid
an acetic acid added to fresh wore. f~ppropriate quantities of cell
sraspension were
added to give a total of 500 g mash in laboratory fermentation flasks and
initial viable
bacterial cell nrambers of 106 CFUimL mash. The pH-value of the word was
afterwards
readjusted to pH 5.2 if necessary.
(ii) Preparation of bacterial inocula for wheat mash
The clean breed strains were kept frozen at -109 .2°F in l~"lRS-broth
containing 8
-glycerol and were inoculated from there in 10 mL cap tubes containing 2 mL
MRS-
broth. The headspace of each tube was flushed with filter sterilized (0.45 ~,m
pore size
membrane filter) C02-gas and the caps were sealed with paraffin wax coated
film. The
tubes were incubated in a controlled environmental shaker at 100 rpm at 86
°F (Lb.
b~e~is) and 96.8 °F (Lb. fierrr~enfum). After 12 hours 1 mL of these
preparatory cultures
were each transferred into 10 mL cap tubes containing 9 mL MRS-broth and
incubated
for another 24 hours, afterwards transferred to 100 mL screw cap flasks
containing 90
mL of MRS-broth and again incubated at the appropriate temperature for 24
hours.
These portions were transferred to 1 L screw cap flasks, containing 750 mL MRS-
broth
and were again incubated for 24 hours.
For inoculation of wheat mash the bacterial cells were aseptically harvested
in
sterile centrifugal tubes by centrifugation at 10,200 x g for 15 minutes at 4
°C. The
-22-
CA 02515723 2005-08-10
WO 2004/072291.. PCT/US2004/003684
~~!uf~ I~r.~ ~ u'~~ f;:pi~ ~ml ~I .i1l ~~u~lm.s,'s i~A~i..s~ni~f ~yn ilnZ}
~~,~,i~:,
' _s~ la.t4 3 ' .,,.sll t: ~t it, f
pellets were washed twice with sterile 1 % peptone water and resuspended in 20
mL of
sterile 0.85 % saline solution. Such harvested bacterial cells of each strain
were
reunited to give a concentrated cell suspension and were kept at 39.2
°F until they were
dispensed.
Cell numbers of the organisms were estimated using a Beck photometer. An
even function describing the relationship between the optical density at 578
nm
wavelengths against 0.85 % saline solution and the number of colony forming
units per
mL was established for both strains. Appropriate quantities of the
concentrated cell
suspension were added to 500 g quantities of wheat mash in laboratory
fermentation
flasks to give initial viable cell numbers of 107 CFU/mL.
Preparation of yeast inoculum
The number of viable cells per gram of S. cerevisiae active dry yeast
(Schlien~:mann Brennereihefe forte) was determined by enumeration of yeast
cells on
YP~ medium. 0.1 g, 0.5 g and 1 g of S. eerevisiae active dry yeast were
dispensed into
mL of sterile 0.85 % saline solution and incubated at 86°F for 30
minutes. A dilufiion
series from 10-~ fio 10-~ was made of each suspension and viable cell count
was
defiermined by sfireak plafie fiechnique. liable cell counfis were multiplied
with factor 10
to eliminate the initial dilution by calculafiion. Enumeration resulted in
approximately 10~
viable yeast cells per gram active dry yeasfi.
Fermenfiafiion time was monifiored subject fio osmofiic pressure and confienfi
of
sugars in the v~ort, fermenfiafiion fiemperafiure and yeasfi dosage in order
fio minimise fibs
inifiial viable cell number of yeasfi. This was necessary fio achieve ~sisible
efihanol losses
in laboratory scale fermentations. As has been reported by Hynes S.H. efi al.
(J. Indust.
Microbio. and Biotech. 18 (4): 284-291, 1997) (and various other authors),
even
undamped growth and lactic acid production by bacteria is often not sufficient
to have
an effect on fermentation if the yeast inoculum in the mash is high (107
yeasfi/g mash).
In the tesfis described in fibs examples below, a yeast inoculum of 0.6 g
active dry yeast
for 500 g wort was used, which corresponds to an initial viable cell number of
1.2 x 10⁶.
The effects might have been even bigger with smaller yeast numbers but this
inoculum
was necessary to complete undisturbed fermentation in sugar beet molasses
containing
130 g/L sucrose within 72 hours, as desired.
For each fermentation sample of 500 g wort, 0.6 g of S. cerevisiae active dry
yeast was dispersed into 10 mL of tap water and incubated at 86 °F for
30 minutes.
After manual shaking, the suspension was added to the laboratory fermentation
flask.
-23-
CA 02515723 2005-08-10
WO 2004/072291 PCT/US2004/003684
, .j
~".1 1 " '' IA G,n 1 ~ t ' ' : ~ ~.n 1 u, ~
it ~' 11,:~: 16 ;,~ ~o:~Ei ~~::3s 3[~ ~l li:,l~:, ~:~''' 1~::~~ ,:'~:~ i~;::kr
t~=.l ii, i4,:
Preparation of inhibitory substances
(iii) Preparation of hop extracts
Six differently composed C02 hop extracts available from Haas Hop Products,
Inc., Washington, D.C., were tested for both Lactobacillus strains. The Haas
Hop
Products tested were: (1 ) Alphahop~, a pure standardized highly concentrated
resin
composition of 92% a-acids; (2) Betastab~, a pure standardized composition of
10% ~i-
acids and essential hop oils; (3) Redihop~, a pure, standardized solution of
35 % rho-
iso-a-acids; (4) Isohop, a pure standardized solution of 30 % iso-a-acids; (5)
Hexahop
GoIdT"" a pure standardized solution of greater than 8% hexahydro-iso-a-acids
and (6)
TetrahopTM, a pure standardized solution of 10% tetrahydo-iso-a-acids. The
differently
concentrated C02 hop extracts were diluted in deionized sterile water in a
manner that
all dilutions contained 0.001 % hop acids. Alphahop~ was dissolved 1:1 in 95%
ethanol
before diluting because of its poor solubility in water.
Generally, hop acids exhibit low solubility in water. However, hop acids can
be
mixed with an alkali metal hydroxide, preferably potassium hydroxide, to make
a water
soluble alkali metal salt of the h~p acid. Accordingly, in the process for
contr~Iling
micro-organisms, it is advantageous to use alkali hydroxides, specifically
potassium
hydroxide or sodium hydroxide or a mixture thereof, as the alkaline medium.
The
concentrations of the alkaline medium preferably ranges from about 1 to about
~. wt. °/~,
more preferably from about 2 to about 3 wfi. °/~.
As discussed above, in the method described herein for lowering the
concentration of lactic acid producing taacteria, the pH of the aqueous
alkaline hop
solution added to the process medium is higher than the pH of the process
medium. As
a result of the low dosage quantity of added solution compared to the process
medium,
the solution adapts almost entirely the pH of the process medium when added to
the
process medium and the hop acid passes from the disassociated form (salt form)
to the
associated (free acid), anti-bacterial effective, form. In one aspect, fihe pH
of the
aqueous alkaline hop acid solution added to the process medium ranges from
about 7.5
to about 13.0, in another aspect from about 9.5 to about 11Ø A high
bactericidal
efficiency is achieved by using the solution in this range. The solution can
be added
without the danger of seriously damaging human skin. Furthermore, the solution
does
not create unpleasant or injurious vapors, unlike other chemical agents.
Preliminary testing of the MIC showed that Isohop~, Hexahop GoIdT"~ and
TetrahopT"", because of solubility issues, were the most effective against
bacteria.
-24-
CA 02515723 2005-08-10
WO 2004/072291.,. ; F PCT/US2004/003684
~r ~r f , I tyn t ~~ tr .'' I~ «: 1~ ~ f.; fliu ~~~rt~,.
1~:: E~_,s 1~ t f~:"~. r. .fit ~~.~,~~ "st a~ ' yli , ~~sr~r'~.~~k !(;<,~ '1~
These three products were used for testing the potency as a disinfectant in
molasses
wort and wheat mash. Appropriate quantities of the dilutions described above
were
added to mash to give concentrations in a range from 1 to 28 ppm of prepared
mash.
(iv) Preparation of Virginiamycin
Stafak~ containing 10 % Virginiamycin was the source of Virginiamycin. Hynes
S.H. et al. (J. Indust. Microbio. and Biotech. 18 (4): 284-291, 1997) reported
a
concentration of 0.5 mg Virginiamycin per kg mash is effective against most of
lactic
acid bacteria. 0.125g Stafak~ was dissolved in 50 mL deionized sterile water
to obtain
a dilution containing 0.25 mg Virginiamycin per mL. One milliliter of this
dilution was
added to 500 g wort to give a concentration of 0.5 ppm in the wort.
(v) Preparation of Penicillin G
Penicillin G Sodium for technical use in distilleries, available from Novo
Industri
A/S, ~enmark, was used according to manufacturer's instructions of 1 g
Penicillin G as
sufficient for 4000fwort. 12.5 mg Penicillin G was dissolved in 100 mL
deionized sterile
water to obtain a dilution containing 0.125 mg/mL. .1 mL of this dilution was
added to
500 g wort to give a concentration ~f 0.25 ppm in the wort.
(vi) Preparation of molasses vvort and fermentation
The content of sucrose in beet molasses was determined by polarimeter after
clarification with lead acetate. Beet molasses, about 78 °/~ dry matter
and about 49.9 °/~
sucrose (w/w), were diluted with distilled water to obtain worts containing
129.74 g/L of
sucrose. The vvort was heated to 17C~ °F, adjusted to pH 5.2 with 1 N
H2SOQ. and stirred
at 175° F for 80 minutes in order to paste~ari~e the wore and to invert
a great part of
sucrose to glucose and fructose. Preliminary tesfiing of the biological
fermentation
qualities showed that it would not be necessary to defoam or to filtrate the
wort.
After that the mash was cooled to 86 °F for Lb. brevis and 98.6
°F for Lb.
fermentum. At this point, various concentrations of hop extracts diluted in
deionized
sterile water or conventional antibiotics diluted in deionized sfierile water
were added to
the worfi. Just prior to yeast inoculation, the samples were contaminated with
bacteria
to give initial viable cell numbers of 10' CFU/mL and afterwards transferred
quantitatively to 1 L fermentation flasks, filled up with tap water to 500 g
and closed with
rubber stoppers with fermentation tubes.
Further tests showed that sterilized MRS-broth which had been used up by
Lactobacillus breed could replace yeast-extract solution as yeast nutrient
supplement.
In the following experiments described below, Lactobacilli were directly added
in used
-25-
CA 02515723 2005-08-10
WO 2004/072291 PCT/US2004/003684
T F ['I i !(((( Y
~u~il~,~u~ ~~. a ~~ ~~..~~ y~- ~~i~~.. ~.''~~1' '''' m~~, ~~r~wsy!~y_~ 3~~iyF'
~~ I~;r
4 1'r ~~~~f3:wIF' . .., i F.":C ::.
up MRS -Medium containing no sugars, an aliquot of sterilized used up MRS-
broth was
added to contamination free samples.
Fermentations were carried out at 86 °F for 96 hours when inoculated
with Lb.
brevis and at 98.6 °F of for 72 hours when inoculated with Lb.
fermentum in 1 L
laboratory fermentation flasks containing 500 g wort.
(vii) Mashing of wheat and fermentation
(a) Determination of fermentable substance
Commercial winter wheat was ground at a 0.5 mm setting on a Retsch model
SR2 Haan disk mill, available from Retsch GMBH & Company, Germany. The amount
of fermentable substance, such as maltose, glucose and fructose, was analyzed
by
HPLC method (Senn 1988). .10 g of ground wheat +/- 0.001 g was dispensed in
300
mL tap water. The pH value was adjusted to pH 6.0 - 6.5 with 1 N Na~H, then
0.2 mL
of high temperature o-amylase (~ptimash pH 420, Solvay Enzymes, Hanover) was
added to create a probe. The probes were heated to 203 °F in a model MA-
3E ~/LB-
mash bath (Bender and Hohbein, Munich) and kept at this temperature for 60
minutes.
Then the temperature was cooled to 131 °F, the pH-value eras adjusted
to pH 5.0 -5.3
with 1 ~! H2S~~ and saccharificati~n enzymes were added (0.2 mL Fungal-a-
amylase
L40000, available from Solvay Enzymes, Hanover; 2 mL SAN Super 24~OL,
available
from Nov~, Bagsvaerd, Denmark; 0.1 mL ~ptilase F300, available from Solway
Enzymes, Hanover). Saccharificafiion toole place overnight. Afterwards the
probes were
cooled to 68 °F, transferred quantitatively to 1 L graduated flasks,
filled up with distilled
water to the 1 L marking and first filtered by a Heave filter, then membrane
filfiered by a
0.45 p,m pore size filter. A 10 ~.I aliquot of the filtrate was analyzed by
HPLC using a
ProntoSIL 120-3-C18 AQ column which analyzes sugars, organic acids and alcohol
to
determine the content g/L of maltose, glucose and fructose. For determination
of blank
values, 250 mL tap of water with enzymes but without ground wheat were used.
The
amount of fermentable substance was calculated after subtracting blank values:
[(((Glucose [g/L + Fructose [g/L]] x 0.899) + (Malfiose [g/L x 0.947) / ground
wheat
dosage] x 100
(b) Standard laboratory process for mashing and fermentation of wheat
Commercial winter wheat was ground at a 0.5 mm setting on a Retsch model
SR2 Haan disk mill. For mashing, 80 g ground wheat per sample (59.96 %
fermentable
substance (w/w)) was dispensed in 300 mL tap water. The samples were placed in
a
model MA-3/E mash bath (Bender & Hohbein, Munich) and high temperature
bacterial
-26-
CA 02515723 2005-08-10
WO 2004/072291 f f, PCT/US2004/003684
yt 1uu 'il,r , / ~ ~ ~i iiaF
1tr k 1 ''.-' ny ~r ;r r ltyni' ~~ ~~t ~~~1 ~ s'rs, Ilf..li v~ul l~~s~,l'
~iy~i lif
~TSV~ j~ 4
a-amylase was added. The temperature was raised to 149 °F to gelatinize
the starch.
The mash was held for 30 minutes at this temperature to complete liquefaction.
The
preparation was then cooled to a 125.6 ° F saccharification temperature
and held at
that temperature for another 30 minutes. The pH value was adjusted to pH 5.2
with 1 N
H2SO4. Saccharification of dextrin to glucose was carried out by adding 0.625
mL of
glucoamylase (SAN Super 240 L of Aspergillus niger, (Novo, Bagsvaerd, Denmark)
per
sample. After that the mash was cooled to 86 °F for Lb. brevis and 98.6
°F for Lb.
fermentum. At that point, various concentrations of hop extracts diluted in
sterile
deionized water or conventional antibiotics diluted in sterile deionized water
were added
to the wort. Just prior to yeast inoculation, the samples were contaminated
with
bacteria to give initial viable cell numbers of 10' CFUi mL and afterwards
transferred
quantitatively to 1 L fermentation flasks, filled up with tap water to 500 g
and closed with
rubber stoppers with fermentation tubes. Fermentations were carried oufi at 86
°F for
96 hours when inoculated with Lb. brevis or at 98.6 °F for 72 hours
when inoculated
with Lb. fermentum in 1 L laboratory fermentation flasks containing 500 g
wort.
(viii) Assay methods
(a) , Assay of minimum inhibitory concentration (l~'iIC)
The MICs of o~-acids, ~i-acids, iso-a-acids, rho-iso-ca-acids, hexahydro-iso-o-
acids
and tetrahydo- iso-c~-aside were determined by tube dilution technique. All
tests were
performed at least twice with independently prepared media and test solutions.
The test
inoculum was prepared by aseptically harcsesting bacterial cells of a mid-log-
phase
culture in htiRS broth by centrifugation at 10,200 x g for 15 minutes at 4~
°C. The pellets
were washed twice with sterile 1 % peptone water and resuspended in 20 mL of
sterile
0.85 % saline solution. Such harvested bacterial cells of each strain were
reunited to
give a concentrated cell suspension and were kept at 39.2 °F until they
were
dispensed. After determining cell numbers by measuring the optical density
with a Beck
photometer, appropriate quantities of concentrated cell suspension were added
to 10
mL modified MRS-broth, containing a range of hop compounds and hop derived
compounds, to give initial viable cell numbers of 106/mL and 10'lmL. The tubes
were
incubated anaerobically in anaerobic jars with Anaerocult~ A (available from
Merck,
Darmstadt) at 86 °F for Lb. brevis and 98.6 °F for Lb. fermentum
for 60 hours. Growth
was assessed photometrically at 578 nm against modified MRS-broth in
disposable
plastic microcuvettes in a Beck photometer.
(b) Determination of ethanol yield in fermented wort
-27-
CA 02515723 2005-08-10
WO 2004/072291 PCT/US2004/003684
i j o,t: i " ~~ 4 11 " ll, . It.. :, _'' ti ~~ ~y",. ~
rj~~~ f l~_,:s , ~ ~~'' ~ ~, ~I~~lE ...,~1 ~ :,°' ,t,..<d wa~~
a~.';,'lt. i~s~ j~::~~,
The distillation was carried out with programmable water vapor distillation
equipment with probe distillation model Vapodest (available from Gerhardt,
Bonn). 50 g
of wort was transferred into a distillation flask. 0.25 N NaOH was immediately
added to
adjust pH to 7.0 to keep organic acids from being carried over, and after a
reaction time
of 2 seconds water vapor distillation was started at 85 % performance for 225
seconds.
The distillate was caught in a 100 mL graduated flask, topped up to the 100 mL
marking
with deionized water, and set at a temperature of 68 °F.
For determination of ethanol yield, a digital density meter model DMA 48
(available from Chempro, Hanau) was used. A defined volume of distillate was
introduced in the density meter's u-shaped sampling tube. This sampling tube
has a
bearing, which is able to oscillate. Undamped oscillation is stimulated by the
increased
mass of the tube. At constant temperature, the introduced mass is commensurate
to
the density. The cycle duration of the oscillating system is the computation
base for the
density. The reference temperature is 68 °F. The density values were
translated to
percent by volume with the aid of table 6 of Amtliche Alicoholtafeln' and
multiplied by a
factor of 2 to account for the dilution of the 50 g wort sample in 100 mL
distillate.
The ethanol yield of 100 hg rave material is calculated as follows:
[I A /dt raw material] = alcoholic content of the distillate fvol/vol x weight
of
fermented mash f~l)
initial weight of raw material [g]
The ethanol yield of 100 kg fermentable material is calculated as follows:
[I A / dt term material] _ [I A / dt rae~~ material] x 100] /fermentable
material [°/~]
(c) Viable counts of bacteria cells
Viable cell counts were monitored by a rapid method of streak plate technique
(Baumgart, J.: Mikrobiologische Untersuchungen von Lebensmitteln, Behr's
Verlag,
Hamburg, 1994). MRS-plates were subdivided into six similar pieces, like in a
pie chart.
From each sample of fermented wort a dilution series from 10 to 10-6 was made
in
sterile saline solufiion and a 50 pl drop of each dilution was carefully set
up on the
surface of one piece of the six pieces. Twelve plates at a time were incubated
anaerobically in an anaerobic jar with Anaerocult~ A (available from Merck,
Darmstadt)
and incubated for 48 hours at the appropriate temperature (86 °F for
Lb, brevis
contamination, 98.6 °F. for Lb. Fermentum contamination). Pieces
containing between
and 50 colonies were taken for enumeration. The number of colony forming units
per
mL wort was calculated as weighted average:
_28_
CA 02515723 2005-08-10
WO 2004/072291 j PCT/US2004/003684
n n:l. If Irn , ~ m r f nrn f ni
if;:,~f ix:":= ~.1~~~ ::v'~~ ih~:~ ~:::~ If~..ii tin,~a .''~ 1~,:~~~ .~~;u
~~'u,9U fi'u~s ~~nl ~r
CFU/mL=[~C/(n~x1+n2x0.1)]xd
~ C = number of colonies at lowest numerable dilution + number of colonies at
highest numerable dilution
n~ = number of plates at lowest numerable dilution
n2 = number of plates at highest numerable dilution
d = 1/lowest numerable dilution
(d) HPLC analysis
Residue sugars (raffinose, sucrose, maltose, glucose, fructose), organic acids
(lactic acid, acetic acid) and ethanol in the fermented wont were determined
by HPLC
analysis using a ProntoSIL 120-3-C18 AQ column maintained at 122 °F
after calibration
with standards of analytical grade. A filter sterilized (0.45 pm pore size
membrane
filter) 5 p1 aliquot of the mash was injected. The determination was done in
duplicate
for each sample. 0.01 N H~S04 was used as the mobile phase at flow rate of 0.6
mL/minute. The components were detected with a differential refracting index
detector
RI 16. The data were processed by Bischoff Mc~Aq Software.
(e) Pr~vol.ing resistances and monitoring cross resistances
Survivors of Lb. bre~is and Lb. ~err~enfiur~ were isolated from viable cell
count
plates out of molasses worts with the highest concentration of iso-c~-acids,
hexahydro-
iso-o-acids and tetrahydo-iso-o-acids, which had allowed some few organisms to
survive. These colonies were transferred from I'~iRS-plates info 10 mL
modified MRS-
broth, containing a moderate concentration of the special hop compound, the
organism
had survived. The headspace of each tube was flushed with filter sterilized
(0.~~5 Nm
pore size membrane filter) C02-gas, the caps were sealed with parafFin wax
coated film
and incubated in a controlled environmental shaker at the appropriate
temperature for
the particular bacteria for 48 hours. Control tubes contained no hop acids at
all.
Afterwards 100 ~I of each sample was spread on the surface of MRS-plates using
sfireak plate technique and incubated anaerobically in anaerobic jars with
Anaerocult~
A at the appropriate temperature for 48 hours for regeneration. The plating
was done in
duplicate for each sample. This process was repeated ten times, each time the
concentration of the monitored hop compound in the tubes was raised 1 ppm.
Out of this series, only Lb. brevis colonies survived. They were transferred
into
mL modified MRS- broth, containing a range of the two other hop compounds in
order to test cross resistances. The tubes were treated as described above.
2. Examples
_29_
CA 02515723 2005-08-10
WO 2004/072291 PCT/US2004/003684
",f. . a ! lGu. 1 l ~ .nm "u ~en~ i
"~~~ y% >1~:14 i::::~~' jl:a! ~>n~l:r .r,''~~ Ik4 ~rr.)f. ii~~~:i ~n~ ~o .
: .us.3 la:iF s:
Using the above described materials and methods and their variations, various
tests were performed to find the inhibitory concentration of hop acids,
including tests to
determine the minimum inhibitory concentrations and the effective
concentrations of
hop acids which can be used to reduce or eliminate lactic acid and/or acetic
acid
producing bacteria during the production of fuel ethanol and spirits. The
following
Examples are intended to illustrate, but not limit, the scope of this
invention.
Example 1: The determination of the MIC
Alphahop~, a pure standardized highly concentrated resin composition of 92%
a-acids; Betastab~, a pure standardized composition of 10% [3-acids and
essential hop
oils; Redihop~, a pure, standardized solution of 35% rho-iso-a-acids; Isohop~,
a pure
standardized solution of 30 % iso-a-acids; Hexahop GoIdT"", a pure
standardized
solution of about 8 % or greater than 8 % hexahydro-iso-a- acids and
TetrahopT"", a
pure standardized solution of 10 °/~ tetrahydo-iso-a-acids, all
available from John I
Haas, Inc. Haas Hop Products or Washington, ~.C., USA, were tested to
determine the
concentration which would have an effect to reduce and/or eliminate acetic
acid and/or
lactic acid producing bacteria. Specifically used in the test were Lb. brevis
and Lb.
fern7enfium, although other types of f~a~cteria may also be controlled.
As shown in Figures 1 and 2, Alphahop~, Betastab~ and Redihop~ inhibited
groe~th compared with control tubes containing no hop compound (100°/~
growth), but
had, due to their poor solubility in water, only weak antibacterial effect
compared to
Isohop~, Hexahop G~IdT~' and Tetrahopr°~. The minimum inhibitory
concentrations
(fi~IGs), the concenfirations at ~,vhich some control of microorganism is
seen, for
Alphahop~, Betastab~ and Redihop~ range around 20 ppm or higher. Therefore,
only
Isohop~, Hexahop GoIdTM and TetrahopT"" went into the fermentation tests.
As shown in Figures 1 and 2, Lb. fermentum proved to be more sensitive to the
ionophoric action of hop acids than Lb. brevis. The MIC of Isohop~ for Lb.
brevis was
about 16 ppm and for 8 ppm for Lb. fermenfum. HHIAA proved to have excellent
antibacterial properties with an MIC of between 3-6 ppm for both strains and
THIAA
came out on top with an MIC of 3 ppm for Lb, brevis and 2 ppm for Lb.
fermentum.
Example 2: Determination of Effective Concentration and Optimum concentration
of Hop Acid
The effective concentrations required for THIAA, HHIAA and IAA did not differ
much between Lb. brevis and Lb. fermentum. Lb. fermentum was more sensitive
and at
increased concentration all bacteria were killed, while numbers of Lb,
fermentum could
-30-
CA 02515723 2005-08-10
WO 2004/072291 PCT/US2004/003684
"~ir ~"~',~, "9~w y~~~ ~~~~~ ~(,;;;~ I~,.~~ ~f,;~,._,,~' )~;'f~ "~~~~i 3~,;;~
5~";fr ifi~if'.
....L ,._'_ir:.l!~:tf~ !c
only be extensively reduced to a dimension of approximately 10'-1 OZ mL. The
concentration at which bacterial numbers are minimal or eliminated is the
"optimum
concentration".
As shown in Figure 3, the effective concentration of THIAA for the inhibition
of
Lb. brevis was about 3 ppm. The optimum concentration at which viable cell
numbers
were extensively reduced was about 8 ppm. There was no improvement in
reduction of
viable cell numbers or improvement of ethanol yield with higher concentrations
of
THIAA. Concentrations above 12 ppm might promote resistance of Lb. brevis to
THIAA.
Figure 4 shows the effective concentration of THIAA for inhibition of Lb.
fermentum was
about 3 ppm. The optimum concentration at which all Lb. fermentum were killed
was
about 6 ppm.
Figure 5 shows the effective concentration of HHIAA for inhibition of Lb.
brevis
was about ~~ ppm. The optimum concentration at which viable cell numbers were
extensively reduced was about 10 ppm.
Figure 6 shows the effective concentration of HHIAA for inhibition of Lb.
fermenfc.9m was about 4 ppm. The optimum concentration at which all cells were
killed
was about 8 ppm. There was no improvemenfi in reduction of viable cell numbers
or
improvement of ethanol yield with higher concentrations of HHIAA.
Figure '~ shows the effective concentration of IAA for inhibition of Lb.s
bre~~is was
about G ppm. The opfiimum concentration at which all cells were killed was
about 1 ~
ppm. Figure 8 shoes that the effective concentration of iso-o-acids for
inhibition of Lb.
fermen~um was about 4 ppm. The optimum concentration at which all cells were
killed
was about 8 ppm. Concentrations as high as 20 ppm of IAA showed an improvement
in ethanol yield which might be due to stress of yeast.
In the case of IAA, the effective concentrations from the fermentation tests
and
the IV11C concentrations correlated with the optimum concentrations.
Figures 9-1~~ shows the decrease of bacterial metabolites produced by Lb.
brevis and
Lb. fermentum at increasing concentrations of hop acids.
Lb. brevis and Lb. fermentum are both strains of heterofermentative bacteria
and
produce lactic acid, acetic acid, ethanol and C02. Numbers of Lb. fermentum in
sugar
beet molasses wort contaminated with 106 CFUImL (without disinfectant) reached
109/mL, produced more lactic acid and acetic acid and provoked heavier losses
in
ethanol yield than Lb. brevis. Lb. brevis grew slower and reached cell numbers
of
5x10'. Figures 15- 19 show the run of the decreasing curve of residue sugar
(i.e.
-31 -
CA 02515723 2005-08-10
WO 2004/072291 ,, ,"" ", PCT/US2004/003684
jy;.',1> ;~:,~~ i~ ,°°'' ~I<:,l ;n~~~ ll~ ~i"i,~" _,.~' ~,~(,;
,~.,~; ii ~Ir ii;'~r fi"(y,
raffinose, sucrose, glucose, and fructose) in fermented wort was synchronized
to that of
organic acids.
Figures 20-25 illustrate the influence of the glucose-fructose-relation in
residue sugar at
increasing concentrations of THIAA, HHIAA, and IAA. Good ethanol yields are
generally achieved at a relation greater than 0.2.
Example 3: Properties of Iso-a-acids, hexahydro-iso-a-acids and tetrahydro-iso-
a-acids compared to conventional antibiotics in molasses wort when inoculated
with 106 CFUI mL of Lactobacillus brevis or Lactobacillus fermentum
The results of the fermentation experiments with hop acids were compared to
the results of fermentation experiments using the conventional antibiotics
Penicillin G
and Virginiamycin as disinfectants.
Penicillin is often used over 1.5 ppm in batch fermentations due to the
possibility
of induced enzymatic degradation of this antibiotic by some bacteria and the
rather poor
stability of penicillin G below pH 5 (I<elsall 1995). In this case, 0.25 ppm
penicillin G
was used, according to the manufacturer's instruction.
0.5 ppm of Virginiamycin eras used. Virginiamycin at a concentration of 0.5
ppm
is effective against most lactic acid bacteria (I~yne~ ~.I~. et. ~1., J. Ind.
I~licr~. ~i~tech~
1~ (4): 2~4-291, 1997.) The works were identically inoculated with 106 CFIJ/
mL of L6.
~bre~is or Lb. I'err~tenlum.
Ethanol yields (Figs. 26 and 2~) and viable cell numbers (Figs. 2~ and 29),
which
were achieved with both anfiibiotics, were compared to the ethanol yields in
undisturbed
fermentations without hop acids and to fihe ethanol yields of each effecti~se
and optimum
concentration of IAA and their derivates. both effective and optimum
concentrafiions of
each hop acid gave better ethanol yields than were achieved with penicillin G
or
Virginiamycin. All contaminated worts, where growth of lactic acid bacteria
had been
successfully inhibited achieved better ethanol yields than worts without
deliberate
contamination.
Virginiamycin was most effective against bacteria in all tests, leaving no
viable
cells. The effective concentrations of hop acids reduced bacteria count in a
dimension
similar to Penicillin G. The optimum concentrations were as effective as
Virginiamycin
in case of Lb. fermentum.
Example 4: Properties of Iso-a-acids, hexahydro-iso-a-acids and tetrahydro-iso-
a-acids in wheat mash
In all fermentation experiments with wheat mash medium, lactic acid bacteria
-32-
CA 02515723 2005-08-10
WO 2004/072291
"",. "" _", PCT/US2004/003684
"v i~ i~~ <<,~~'~ui't' 1 il~:~a ,.~t S ,n~ a 'rub ~~n :a
~:;i= lf. ~: ~. << ~,.,_ , :~. ~I;,:.F :~ s. ' i~~l :~::~f ii~,:rr fi:~ (f
were harvested by centrifugation and inoculated as concentrated cell
suspension in
0.85 saline solution after washing twice with sterile 1 % peptone water.
Appropriate
quantities were added to wheat mash to give initial viable cell numbers of
107/mL.
Wheat mash contained 15.7 % solids.
Growth and lactic acid production by the bacteria was not sufficient to have a
vast effect
on ethanol yield. In samples which contained no inhibitory substance at all,
growth and
lactic acid production provoked losses in ethanol yield up to 7 %. The
observed losses
in ethanol yield were greater than expected losses calculated from the amount
of
glucose diverted for the production of lactic acid. Even minimal
concentrations of hop
acids below the MICs stopped growth of bacteria and widely reduced the
production of
organic acids, although the reduction of viable cell numbers below 1041 mL
required
concentrations of hop acids high above the MICs. This is certainly not only
related with
the higher inoculation of bacteria, but also with the higher viscosity of
wheat mash and
the better nutritive situation for lactobacilli in wheat mash. Again Lb.
fermentum grew
faster than Lb. brevis and produced higher amounts of organic acid, but was
more
sensifiive towards hop acids.
hlofi enough lactic acid was produced fio disturb sugar consumpfiion by yeast.
~fiher fihan
in the test series with sugar beet molasses wort, the amounts of residue
sugar,
consisfiing of maltose, glucose and frucfiose remained constant and rafiher
increased
with reduced viable cell numbers. The glucose-frucfiose relation' was nofi
essentially
affected and was 0.5 or higher.
The effecfiie~e concenfirafiion of THIAA, shown in Figures 30 and 3'i, and
FIHIAA,
shown in Figures 32 and 33, for inhibition of Lb. brevis and Lb. fermenfum was
about
14 -16 ppm. As shown in Figures 34 and 35, the effective concentration of IAA
for '
inhibition of Lb. brevis and Lb. fermentum was above 30 ppm.
Figs. 36- 41 shows the development of ethanol yield, content of residue sugar
and bacteria mefiabolifies at decreasing viable cell numbers of Lb. brevis or
Lb.
fermentur~7 correlated with increasing concentrations of hop acids in wheat
mash.
Example 5: Properties of Iso-a-acids, hexahydro-iso-a-acids, and tetrahydro-
iso-
a-acids compared to conventional antibiotics in molasses wont when inoculated
with 10' CFU/ mL of Lactobacillus brevis or Lactobacillus fermentum
The results of the fermentation experiments with hop acids were compared to
the results of fermentation experiments using the conventional antibiotics
Penicillin G
and Virginiamycin as disinfectant.
-33-
CA 02515723 2005-08-10
WO 2004/072291 PCT/US2004/003684
,a
~,"i, il~Y:~, is ,,;:e ~f,all ,yu.~~;. a~:_~l 3~~1~" ;,,'' ,#~,;~ ";;~1~ ~~,;
,y ,,F"~F ~;,j~.
0.25 ppm P~enicnllin~G was used, according to the manufacturer's instruction
and
0.5 ppm of Virginiamycin was used. The worts were identically inoculated with
10~
CFU/mL of Lb. brevis respectively Lb. fermentum.
Ethanol yields (Figs. 42 and 44) and viable cell numbers (Fig. 43), which were
achieved with both antibiotics, were compared to the ethanol yields in
undisturbed
fermentations without disinfectant and to the ethanol yields of each effective
and
optimum concentration of IAA and their derivates. Both minimal and effective
concentrations of each hop acid gave similar or better ethanol yields than
were
achieved with Penicillin G or Virginiamycin. Effective concentrations achieved
similar or
better ethanol yields than worts without deliberate contamination. In worts
contaminated with Lb. brevis Penicillin G and Virginiamycin reduced viable
cell
numbers below 103/mL and below viable cell numbers in worts without
contamination.
The effective concentrations of TetrahopT~' Gold and Hexahop GoIdT"' reduced
viable
cell numbers to 104.
In worts contaminated with Lb. fermentum, Virginiamycin was most effective and
reduced viable sells to 103 cells/mL. The use of Penicillin G showed
practically no
effect. The effective concentrations of TetrahopT°~ Gold Hexahop
GoIdT"~ and Isohop
reduced viable cell numbers to approximately 104 cells/mL.
E~~arnple ~
An all~aline solution of isoalpha acid is dosed to the fermentation stage of a
distillery in a concentration of about 10 to about 20 ppm. The temperature of
the
fermentation stage is belo~e 30°C and the pH is below 6.
Example 7
Two peristaltic pumps were calibrated using deionized water to deliver 20 ppm
of
isoalpha acids to two 28°C molasses streams. ~ne pump dosed IS~H~P~ (a
30 wt.
% aqueous solution of potassium salt isoalpha acid commercially available from
Haas
Hop Product, Inc.) to a dilute molasses stream, 20 brix (20 °/~ solids)
feeding three
yeast growing tanles. The other pump dosed ISDH~P~ to a dilute molasses
stream, 26
brix, feeding the 8 fermentors. These two streams ran constantly and the
distillery ran
essentially semicontinuous. Dip-tubes and valves were welded to the two pipes
which
delivered these two molasses streams.
Figure 48 is a diagram showing how the concentrated molasses is first diluted
to
about 50 to about 55 brix and pH adjusted to about 6.2 at 60°C. The
dilutions tools
about 45-60 minutes and were further diluted downstream and cooled to
30°C prior to
-34-
CA 02515723 2005-08-10
WO 2004/072291 PCT/US2004/003684
t ' _y_r ~ !t ltisi ' a (
n."~ ~ , b n a, rt"~r ,m ~j~m
~~.,:,~ cc 1 ~ :,:, Ik ~~;,.~1 l! h" ,.~' ~'. r~' rr f 'tfrm nr~ ~t~l~:
' ~a.~' c%%.~.~ tta,,tf ii:,3~' ;
ISOHOP~ addition.and introduction into the yeast growing tank and the
fermentor. The
concentrated molasses contains some bacteria, however, at 80 brix there is not
enough
water for the bacteria to grow, therefore, it remains dormant. Once diluted,
however,
the bacteria has an opportunity to grow. Therefore, ISOHOP~ was introduced
into the
diluted molasses solution as soon as possible. Because the dilution tanks were
small,
dilutions were constantly being performed and sent forward to their
appropriate tanks.
It takes about 4 hours to fill each yeast growing tank, about 16 hours to fill
the
fermentation tank with molasses and fermentation took an additional 48 hours.
The yeast growing solution from the yeast growing tank and the "wine" from the
fermentation were loaded with lactobacillus. Analytical analysis showed the
bacteria
count to be 3 million bacteria cells/mL. These two solutions were also
analyzed for
residual sugar, alcohol yield and total organic acids, such as lactic acid,
acetic acid etc.
Figure 49 is a diagram demonstrating the growth of yeast in the yeast growing
tanks. At time zero there were two yeast growing tanks which hold a total
volume of
100 HL each. Each tank contained about 40 HL of yeast and molasses feed and
was
constantly aerated. The molasses feed was constantly added to tvro yeasfi
growing
tanks at a flow rate of 20 HL per hour. It tales flour hours to fill these two
tsfnhs to a
volume of 80 HL each. After each lank reached a total volume of 80 HL, one
tank was
transferred to an empty fermentor while half of the other tank was pumped into
the third
empty yeast growing tank to continue the process of growing more yeast.
After the 80 HL of yeast solufiion was sent to an empty fermentor 120 HL of
molasses ~ 25 brie vas added to this fermentation tanla. The addition of this
molasses
solution took about 16 hours and 48 hours after molasses addition the
fermenfiation was
complete. The combined 200 HL of molasses/yeast/alcohol etc was pumped to the
distillation towers to isolate the ethanol.
After dosing for about 20 hours 15 ppm of ISOHOP~ was added to the molasses
feed going into the fermentor and about 13 ppm of ISOHOP~ was added to the
molasses feeding the yeast growing solution. Microscopic inspection of the
yeast
growing solution and fermentation solutions indicated a lowering of the
bacteria.
40 hours after dosing it was clear that the bacteria count in the yeast
growing
solution was down significantly and the fermenting solution looked about
normal. The
first fermentation with ISOHOP~ was complete. Samples of the wine were
analyzed
which showed that the amount of organic acid was reduced by about 0.4% vs.
before
ISOHOP~ addition. The residual sugar in the wine measured 130 ppm and
distillation
-35-
CA 02515723 2005-08-10
WO 2004/072291 PCT/US2004/003684
~;, I
~' '';.. ,.',i ~L. i ~I~."(! J~~ jln~:n _.'~~f Itu~l ~r ~dl I~i.'~ 3~n.,~~
~~u.~~:
._ t f_ F u~. 1 .: ~..
of this material produced a normal ethanol yield. The yeast cells in the
fermentor
showed no flocculation indicating that bacteria contamination was low.
After three days of dosing 11 ppm of ISOHOP~ into the yeast growing solution
and 15 ppm into the fermentor, microscopic inspection of the yeast growing
solution
showed little to no lactobacillus bacteria and the fermentation solutions
looked normal.
Based on the fact that the antibiotic Virginiamycin reduces the bacteria count
by only
50% it appears that ISOHOP~ works better than Virginiamycin.
On day four dosing of ISOHOP~ into the fermentor stopped and 11 ppm
ofISOHOP~ was dosed into the yeast growing tank for the next 45 hours. This 11
ppm
solution was diluted to 4 ppm once the molasses solution was added to the
fermentor.
Analysis of the yeast growing solution showed little to no lactobacillus and
only few
cocci bacteria and the fermentor solutions showed little to no difference
between those
fermentations which had 15 ppm of ISOHOP~ and those currently receiving 4 ppm
ISOHOP~ via the yeast growing tanks.
The discussion above is descriptive, illustrative and exemplary and is not to
be
talren as limiting the scope defined by any appended claims.
-36-