Note: Descriptions are shown in the official language in which they were submitted.
CA 02517566 2005-05-30
WO 2004/050825 PCT/1L2003/001011
PROTEIN SYNTHESIS MONITORING (PSM)
FIELD OF THE INVENTION
The present invention relates to the monitoring of protein synthesis by
ribbsomes,
and in particular to such monitoring being performed in real time.
BACKGROUND OF THE INVENTION
The study of proteins is a key endeavor of current biological research, as
well as a
focus of pharmaceutical research and development. The information revealed by
sequenced
genomes increases the pace and activity of protein research, for example for
the development
of a cell-based assay, analysis of a pathway, study of a single receptor, or
the application of
proteomics. Current technologies fail at several key points: they can miss
entire protein
families; fail to identify protein pathways; focus on a single protein at a
time; and they are
expensive, difficult and slow. Importantly, no current technology provides
information on
protein dynamics. In fact, results of current large-scale and high-throughput
protein analysis
are often delayed by days or weeks following an experiment, and are usually
restricted to the
form of a catalogue, tabulating those proteins of a database that have been
putatively
identified from the analyzed sample.
Genomics, Proteomics and the Barriers of Biological Knowledge
Proteomics is an emerging technology that attempts to study proteins on a
large scale
in high-throughput. It is not by chance that the term resembles "Genomics". In
the wake of
successful technologies such as whole genome sequencing, DNA chips and SNP
cataloging,
a search started for similar paradigms in the realm of proteins. This search
is worthwhile
since proteins are the main vehicles of life processes: they are the
biochemical enzymes,
form the signal pathways, control the cellular processes, underpin the cell
scaffolding,
transport molecules and so on. They are also potentially more valuable than
DNA in terms of
human benefit, due to their importance in human disease: most known drugs are
either
proteins themselves, or else operate by binding to a protein target.
Unfortunately, proteins
are also so much more complex and difficult to study than DNA. They are more
complex for
a number of reasons. For example, there are many more proteins than there are
genes;
CA 02517566 2005-05-30
WO 2004/050825 PCT/1L2003/001011
2
protein expression is complex and has a high dynamic range ¨ from single
copies to millions
per cell; the proteome of one cell type may be very different than that of
another, even
though their DNA is identical; and proteins may undergo dramatic changes in
their structure
¨ through cleavage, modification, and interaction. Proteins are more difficult
to study than =
DNA, since protein extraction, separation and identification are difficult;
there is no
amplification technique that parallels PCR; three-dimensional protein
structure is hard to
obtain and use; protein expression has high dynamic range; protein
modifications, cleavages
and interactions are to a large extent unknown; and, finally, both as cause
and effect, protein
databases are thin and sparsely populated, encompassing a small fraction of
all theoretical
proteins, especially in higher organisms, such as Homo sapiens.
In one aspect, though, Proteomics and Genomics are similar: both raised high
hopes
of creating a paradigm shift, a breakthrough that will yield a new
understanding of cellular
processes and human disease, and pave the way to a bounty of new drugs and
therapeutics.
Unfortunately, first for genomics and then for proteomics, it became
abundantly clear that
though genomic and proteomic data is extremely valuable, it is far from
sufficient for
achieving the breakthrough that was hoped for (Miklos, G.L. and Maleszka, R.,
Protein
functions and biological contexts. Electrophoresis 22:169-178, 2001). So many
pieces of the
puzzle are still missing that the clear and complete view of cellular
machinery remains
hidden. One important piece of this puzzle is protein synthesis data- which
proteins are
produced at which times, under which conditions, and in which amounts. The
ability to study
and monitor this type of data would be a major breakthrough for all life
science related
research.
Proteomics Practice Today
Mainstream proteomic analysis today includes the processes of protein
purification
from culture, separation with two-dimensional gel or other chromatographic
techniques,
mass-spectrometry, and analysis of the resulting spectra for protein
identification and
characterization.
The extraction of proteins from bacterial or cell culture invariably involves
lysis (and
therefore death) of the cells. The procedure involves several stages and
usually takes hours
(Branca MA, Sannes U. Proteomics: A Key Enabling Tool for Genomics? Cambridge
Healthtech Institute's Genomic Reports. April 1999; Humphery-Smith I.,
Cordwell S.J.,
CA 02517566 2005-05-30
WO 2004/050825 PCT/1L2003/001011
3
Blackstock W.P., Proteome research: complementarily and limitations with
respect to the
RNA and DNA worlds, Electrophoresis 18 (1997) 1217-1242). Protein separation
with two-
dimensional gels requires at least 24 hours and an expert human operator;
their analysis is
often much more difficult, even with modern software (Smilansky, Z. Automatic
registration
for images of two-dimensional protein gels, Electrophoresis 2001, 22, 1616-
1626). Even
worse, two-dimensional gel technology is not applicable to very acidic or very
basic
proteins, to many membranal proteins, and most importantly, to proteins that
are expressed
in low amounts.
It is usually taken for granted that .proteins that are expressed at less than
1000-
10,000 copies per cell cannot be visualized in two-dimensional gels (Gygi,
S.P., Rist, B.,
Gerber, S.A., Turecek, F., Gelb, M.H., Aebersold, R., Quantitative analysis of
complex
protein mixtures using isotope-coded affinity tags. Nat Biotechnol. 1999,
17(10): 994-9).
Almost no protein kinases, phosphatases, transcription factors, GPCRs, ion
channels, or
nuclear hormone receptors are found in standard human proteomic analyses, even
though
more than 5000 of these proteins are encoded by the human genome (Miklos,
G.L.,
Maleszka, R. Protein functions and biological contexts, Electrophoresis 22:169-
178, 2001).
Thus, the proteins that can be analyzed by this method are only the most
common ones.
Besides separating the sample, two-dimensional gel technology can measure
three
important protein parameters: mass, pI, and quantity. However, all three are
hopelessly
inaccurate. As for protein quantity, the most that may be obtained from gel
technology is
relative quantitation, and even that at accuracies worse than 50% error ¨ so
that only proteins
with very strong up- or down-regulation can be identified. Moreover,
quantitation at best
means quantity of protein in the extracted, processed sample, such as in a gel
spot or in a
chromatographic fraction; estimation of protein copies in a cell at any given
time is not even
attempted today.
Following protein separation, MS analysis may be performed, either with a
MALDI-
TOF or with an LC-MS-MS machine (Humphery-Smith I., Cordwell S.J., Blackstock
W.P.,
Proteome research: complenzentarity and limitations with respect to the RNA
and DNA
worlds, Electrophoresis 18 (1997) 1217-1242; Yates J.R., Database searching
using mass
spectrometry data. Electrophoresis 1998, 19(6): 893-900). The main stages are
spot picking
from, the gel followed by destaining, or alternatively chromatographic
prefractionation,
followed by protein digestion with a protease (almost invariably trypsin),
mass-spectrometric
CA 02517566 2005-05-30
WO 2004/050825 PCT/1L2003/001011
4
analysis, and finally database searching, which is performed, surprisingly,
only as a semi-
automatic procedure with expert supervision and decision making ¨ as in the
stages of peak
extraction and candidate selection.
All in all, the standard technique for identifying proteins in a cell culture
takes from
weeks to months, is suitable for only a small part of the proteome, does a bad
job of
quantitating protein amounts, and provides no clue as to proteome dynamics.
Additional and Emerging Proteomics Technologies
An important older method for protein analysis is Edman degradation, a
chemical
analysis method where the C-terminal amino acids of a polypeptide are cleaved
and analyzed
one by one. The procedure requires a full day and provides no quantitative or
dynamic
information.
The shortcomings of two-dimensional gel technology have led many researchers
to
look for alternatives. Two important developments of the last few years are
the techniques of
ICAT (Gygi, S.P., Rist, B., Gerber, S.A., Turecek, F., Gelb, M.H., Aebersold,
R.,
Quantitative analysis of complex protein mixtures using isotope-coded affinity
tags. Nat
Biotechnol. 1999, 17(10): 994-9) and MudPIT (Washburn, M.P., Wolters, D.,
Yates JR 3rd.
Large-scale analysis of the yeast proteome by multidimensional protein
identification
technology. Nat Biotechnol. 2001 Mar 19(3): 242-7), which involve MS analysis
of whole
sample digestion products. The two methods allow better identification of rare
proteins, and
the first one even allows computation of differential expression. However,
they are still
difficult and expensive to carry out, require cell lysis, take days for
complete analysis, and
provide no dynamic information.
Protein chips are being developed in several labs (Jenkins, R.E. and
Pennington, S.R.
Arrays for protein expression profiling: towards a viable alternative to two-
dimensional gel
electrophoresis? Proteomics. 2001 Jan 1(1):13-29). They generally fall into
one of three
classes: surface chemistry chips, antibody chips, or protein chips for
determining protein-
protein interactions. All of these may aid protein analysis in some way, but
none of them
provides the data that the disclosed method provides.
Yeast-two-hybrid technique (Y2H) is a feat of bioengineering that helps
discover
protein-protein interactions (Legrain, P. and Selig, L., Genome-wide protein
interaction
maps using two-hybrid systems. FEBS Lett. 2000 Aug 25; 480(0:32-6). The method
is
CA 02517566 2012-09-07
WO 2004/050825 PCT/1L2003/001011
indirect in that the interactions occur in yeast or in bacteria, rather than
in the original cells
being analyzed. It is known to generate a large number of false-positives and
also cannot
generate dynamic information. Thus, there are clearly a number of significant
differences
between the present invention and the disclosed method.
5
High Throughput Screening and Cell Based Assays
High throughput Screening (HTS) is the standard route for drug discovery in
the
pharmaceutical industry. Traditionally, HTS relies on a simple assay, such as
receptor
binding or enzyme activity. The assay itself measures a single parameter, e.g.
receptor
binding. This measurement is initially the only information available on the
suitability of the
candidate compound as a potential drug. The rest of the required information ¨
ADME-TOX
for example ¨ is either presumed to be known or else its acquisition is
delayed till later
stages in the process (see also next section).
In contrast with simple assays, cell-based assays are newer to the
pharmaceutical
industry. They are usually used for lead optimization and predictive
toxicology. To construct
a cell-based assay, a measurable cell characteristic has to be developed: this
can be a
fluorescent-tagged protein, an antibody based marker, or some measurable
phenotypic
characteristic of the cell. Modern examples include cancer-specific dyes
(http://www.zetiq.com/site/cama.html) and genetically engineered cell lines
(Shen-Orr, S. S.,
Milo, R., Mangan, S., and Alon, U., Network motifs. in the transcriptional
regulation
network of Escherichia coil. Nat Genet 2002, 31(1): 64-8.
Cell based assays have many advantages over receptor binding assays. Cells
offer
better representations of a disease. By screening against disease pathways in
whole cells, no
prior assumptions are made about what makes a good target. However, cell based
screening
suffers from certain disadvantages. These disadvantages include the need to
engineer a
specific cell line with the required reporting capability, and the lack of
information about the
would-be protein target. In both assay types, standard and cell-based assays,
high-throughput
screening provides a minimal amount of information on a large number of
compounds. This
of course limits the scope of information obtainable, and the entire cascade
of events
following administration of the compound under analysis remains hidden from
the
researcher.
CA 02517566 2005-05-30
WO 2004/050825 PCT/1L2003/001011
6
Improved solutions for the above problems are clearly required, for example
for
pharmaceutical research and development. Despite the huge increase in
investment and the
enormous contributions of genomics and related technologies, the main
difference between
the pharmaceutical pipeline today and a decade ago is in the number of
targets, while the
number of successful drugs entering the market has more or less stayed the
same. More
discouraging yet is the fact that while advances in high-throughput screening,
chemical
compound library design and bioinformatics have helped multiply the number of
"hits" in
HTS assays, the number of "leads" has not increased at all. Thus, the
pharmaceutical
pipeline today has an abundance of targets on the one side and an abundance of
candidate
compounds on the other, but attempts to combine this information has yielded
little.
Though there is more than one reason for this failure, one important point is
that
though the numbers of targets and candidates is huge, the complexity of the
cellular
machinery, not to mention tissue and whole organism, is on a grander scale
still. Thus, a
better view of function and context of a protein target in the cell, as well
as the complex
effects, side effects, and after effects of a drug compound on the cell, are
all clearly missing.
In today's paradigm of drug development, once a target is found and a compound
that binds to it is identified, drug development starts to proceed toward
towards regulatory
approval and market acceptance. While the process is long and very expensive,
it is narrow
in the sense that relatively little is known about the target protein, its
function, its isoforms
and look-alikes, its roles in disease and in health. Even less is known about
the drug
candidate, how it affects proteins other than its specified target, how it
affects other tissues,
its immediate effects and its long term effects. Thus, information that may
indicate that a
compound cannot become a suitable drug candidate is revealed only at later
stages and at a
high cost ¨ sometimes only after being distributed on the market. Among the
medications
which had to be recalled after market approval are the nighttime heartburn
drug Propulsid
(removed because of fatal heart rhythm abnormalities), diabetes drug Rezulin
(removed after
causing liver failure), and irritable-bowel-syndrome treatment Lotronex
(removed for
causing fatal constipation and colitis). All three were taken off the market
in 2000.
CA 02517566 2005-05-30
WO 2004/050825 PCT/1L2003/001011
7
SUMMARY OF THE INVENTION
The background art does not teach or suggest an assay for monitoring protein
synthesis as it occurs, in real time. The background art also does not teach
or suggest such
an assay which is sensitive and which is also reliable as a whole-cell assay.
The present invention overcomes these disadvantages of background art by
providing
a system and method for monitoring protein synthesis in a protein synthesis
system,
preferably by determining the identity of the protein being synthesized at the
given instant.
The method of the present invention is also referred to herein as "PSM"
(protein synthesis
monitoring). Protein synthesis is monitored by using a marker or a set of
markers for protein
synthesis in the system, which preferably cause electromagnetic radiation to
be emitted. The
emitted electromagnetic radiation is then detected and can be analyzed to
detect protein
synthesis. The present invention may optionally be performed qualitatively,
but is preferably
performed quantitatively. The marker may optionally include any type of label
or tag, or a
pair of such labels or tags, or a donor/acceptor pair or a set of one donor
and several types of
acceptors (each one with a different emission wavelength), or a set of several
donor types
and one acceptor, or several donors and acceptor types, for example.
The synthesis marker preferably enables the present invention to detect which
tRNA
is currently being processed by a ribosome, which mRNA codon is being read, or
which
amino acid is currently being added to the nascent protein. This signal can
optionally and
preferably be captured and analyzed in seconds to reveal the protein's
identity. The
procedure can optionally be performed for hundreds of ribosomes
sirnuitaneously, and so
provide, for the first time in biology, a tool for dynamic monitoring of
protein synthesis.
With such a tool, the effects of potential drugs can be assayed to determine
the
proteins that are being up- or down-regulated by a compound, as well as to
determine the
sequence of events; protein pathways can be identified by interpretation of
the changing
translation patterns, noting which proteins are just beginning to be
translated and which are
ceasing to be translated; rare, hydrophobic, and heavy proteins can be
identified at the same
efficiency as any other protein; cell-free translation systems can be
monitored in real-time
and protein production processes can be monitored and optimized. These
procedures may
optionally be performed in seconds rather than days, with a single type of
engineered cell
(from a given cell-line) that is as near to a natural, non-engineered cell as
possible, and with
the benefit that performing a PSM assay with this cell-line may provide a huge
amount of
CA 02517566 2005-05-30
WO 2004/050825 PCT/1L2003/001011
8
information on the compound being tested. These capabilities are in strong
contrast with the
multitude of specialty, heavily engineered cell types that are required today.
Indeed, the
present invention may optionally provide a "universal assay" for drug
discovery and
development on the one hand, as well as an indispensable tool for basic and
applied
scientific biological and pharmaceutical research and production.
According to preferred embodiments of the present invention, there is provided
a
method and device for measuring and monitoring protein synthesis by the
ribosome in real
time, preferably in-vivo as well as in in-vitro translation systems. In the
present invention,
the ribosome is engineered to carry a donor fluorophore in a prescribed
configuration, and
tRNA and/or amino acids and/or another part of the ribosome are engineered to
carry
acceptor fluorophores and/or their natural fluorescent properties are
utilized. Donor and
acceptor are selected so that the donor can transfer energy to the acceptor
when the donor is
excited and the acceptor is in close proximity to the donor. As the ribosome
mechanism
reads the mRNA information, processes tRNA molecules and synthesizes a
polypeptide
chain, a light source illuminates the ribosome, exciting the donor
fluorophores and thereby
the acceptor fluorophores which are within sufficient proximity of
corresponding donors.
The resulting signals are detected by appropriate optical apparatus and
collected by a
computerized analysis system as digital data. This digital data is optionally
and preferably
used as a key for database searching and identification of the protein being
synthesized at
that moment.
Protein synthesis information can optionally be tabulated to correlate with
chemical
or environmental effects applied to the cells being studied. In this way the
present invention
is able to decipher the functionality of chemical compounds; elucidate
cellular proteomic
mechanisms; control protein production systems; and help study the factors
affecting protein
synthesis.
The present invention has many advantages, of which only a few are listed
herein.
These advantages include but are not limited to, real-time, optionally in-
vivo, monitoring of
protein synthesis, unprecedented sensitivity, highly accurate quantitation,
the ability to
monitor cellular events through protein synthesis, the ability to complement
other methods
such as protein tagging for monitoring protein localization and degradation,
elucidation of
protein pathways and interactions, and support of protein function analysis.
The present
CA 02517566 2005-05-30
WO 2004/050825 PCT/1L2003/001011
9
invention can also optionally be used to monitor protein production and assist
in process
optimization and control.
The present invention also has the advantage of providing an assay for protein
synthesis which is optionally cell based. As noted above, cell based assays
have many
advantages over receptor binding assays. Cells offer better representations of
a disease. By
screening against disease pathways in whole cells, no prior assumptions are
made about what
makes a good target. However, cell based screening assays, as for other
screening assays,
provide only a binary, or yes/no answer, for a given compound. This type of
answer limits
the scope of information obtainable, and causes the entire cascade of events
following
administration of the compound under analysis to remain hidden from the
researcher. These
limitations are in strong contrast to the PSM assay method of the present
invention that is
disclosed herein, where upon administration of the compound, no special
preparations are
required (besides optionally using cells that were prepared for PSM), no
assumptions are
required, and protein synthesis processes can be followed to gain a more
complete
understanding of the cell's response to the chemical or environmental stimulus
that was
applied.
The present invention has a number of other, additional advantages over
background
art techniques. For example, the present invention provides comprehensive
information
about protein production in the cell, showing precisely how, when, in what
order and in what
amounts does the cell respond to the compound following administration. The
target itself
can be seen in the context of other proteins that are co-synthesized with it,
before it, or after
it; connections with other proteins can be identified. Similarly, the compound
can be seen in
the context of other compounds that elicit a similar response, allowing SAR
and QSAR
analyses to be performed.
Furthermore, apart from the hitherto unavailable information that the present
invention provides, the technique holds the important promise of both widening
and
shortening the drug development process by early removal of compounds from the
pipeline,
by providing a much larger amount of information about a candidate drug much
earlier in the
process, and by allowing more compounds and targets to enter this process.
Thus, the present
invention has the potential to produce many more drugs in shorter time and
with smaller
expenditure.
CA 02517566 2005-05-30
WO 2004/050825 PCT/1L2003/001011
Another important application of the present invention is as a tool for
process
optimization, process control and quality control of protein production,
either in bio-reactors
using bacteria or cell culture, or else in cell free translation systems. In
these situations, the
present invention can provide indispensable information about the amounts of
the target
5 protein being produced, as well as on the precise structure of the
proteome backdrop to this
manufacturing, ensuring that the desired protein is produced in precisely the
required
environment. This level of control, unavailable today, can create a revolution
in the way
= proteins and protein drugs are produced and certified. This can lead to
new protein
production methods that are easier to control than current ones.
10 According to the present invention, there is provided a method for
monitoring protein
synthesis in a protein synthesis system, the method comprising: providing a
marker for
protein synthesis in the system, the marker being detectable through detection
of
electromagnetic radiation; detecting electromagnetic radiation emitted from
the system; and
analyzing the emitted radiation to monitor protein synthesis activity in the
system.
Precei ably, the system comprises a bacterium or bacterial culture. Also
preferably,
the system comprises at least one cell. More preferably, the system comprises
at least one of
a cell-line or a cell culture.
Optionally and preferably, the system comprises a cell-free protein
translation system
(in-vitro translation system). Preferably, one or more of ribosomes, ribosomal
RNA,
ribosomal proteins, tRNAs, or amino acids in the system are artificially
adapted to provide
the marker.
Preferably, the marker comprises at least a portion of one or more of natural
ribosomes, ribosomal RNA, ribosomal proteins, tRNAs, or amino acids.
According to a preferred embodiment of the present invention, the marker
comprises
at least one photo-active component. Preferably, the emitted radiation
comprises radiation
obtained by energy transfer between at least two of a plurality of components
of the system.
More preferably, the marker comprises at least one fluorescent donor-acceptor
pair. Also
more preferably, the emitted radiation comprises a FRET (Fluorescence
resonance energy
transfer) signal.
Preferably, the emitted radiation comprises a fluorescent signal.
CA 02517566 2005-05-30
WO 2004/050825 PCT/1L2003/001011
11
Also preferably, at least a portion of the marker comprises at least one of a
fluorescent protein, a fluorescent dye, a quantum dot or a luminescent
substance. More
preferably, the luminescent substance comprises a luminescent protein or
portion thereof.
Preferably, the marker comprises a first portion being a fluorescent substance
and a
second portion for quenching the fluorescent substance. More preferably, the
detecting
comprises detecting a reduction in emitted radiation.
Preferably, at least a portion of the marker is covalently or non-covalently
bound to a
tRNA. Also preferably, at least a portion of the marker is covalently or non-
covalently
bound to at least a portion of a ribosome. More preferably, the portion of the
ribosome is at
or near at least one of the A site, P site, E site or peptide exit channel
site. Most preferably,
the at least a portion comprises an amino acid.
Optionally and preferably, the detecting comprises irradiating the system with
electromagnetic radiation.
Also optionally and preferably, the emitted radiation is detected with a
microscope.
Also optionally and pi eferably, the method is adapted to measure emitted
radiation
from a single ribosome. More preferably, the marker comprises a donor-acceptor
fluorescent
pair suitable for performing single pair FRET and wherein the emitted
radiation occurs upon
performing single pair FRET.
Preferably, the method is adapted to measure signals from a plurality of
ribosomes.
More preferably, the analyzing the emitted radiation comprises performing
signal analysis of
emitted radiation from the plurality of ribosomes.
Preferably, the method further includes identifying at least one protein being
synthesized through the analyzing the emitted radiation.
Preferably, the detecting is performed in real time.
Also preferably, the detecting further comprises: monitoring protein synthesis
by
detecting a plurality of protein synthetic processes over a period of time.
More preferably,
the plurality of protein synthetic processes comprise a plurality of
interactions between a
ribosome and a plurality of different tRNA molecules.
According to another embodiment of the present invention, there is provided a
apparatus for measuring protein synthesis by a protein synthesis system, the
apparatus
comprising: a container for containing a plurality of components for the
system, wherein at
least one component is capable of emitting electromagnetic radiation due to a
protein
CA 02517566 2005-05-30
WO 2004/050825 PCT/1L2003/001011
12
synthesis activity; a detection system to measure emitted radiation from the
system; and a
computational device to analyze the emitted radiation and determine the
protein synthesis
activity in the system.
Preferably, the system comprises a bacterium or bacterial culture. Preferably,
the
system comprises at least one cell. More preferably, the system comprises at
least one of a
cell-line or a cell culture.
Preferably, the system comprises a cell-free protein translation system (in-
vitro
translation system).
Also preferably, one or more of ribosomes, ribosomal RNA, ribosomal proteins,
tRNAs, or amino acids in the system are artificially adapted to provide the
marker.
Preferably, the marker comprises at least a portion of one or more of natural
ribosomes, ribosomal RNA, ribosomal proteins, tRNAs, or amino acids.
Also preferably, the marker comprises at least one photo-active component.
More
preferably, the emitted radiation comprises radiation obtained by energy
transfer between at
______________________________________________________________________ least
two of a pita ality of components of the system. Most preferably, the
marker comprises
at least one fluorescent donor-acceptor pair. Also most preferably, the
emitted radiation
comprises a FRET (Fluorescence resonance energy transfer) signal.
Preferably, the emitted radiation comprises a fluorescent signal. Also
preferably, at
least a portion of the marker comprises at least one of a fluorescent protein,
a fluorescent
dye, a quantum dot or a luminescent substance. More preferably, the
luminescent substance
comprises a luminescent protein or portion thereof.
Preferably, the marker comprises a first portion being a fluorescent substance
and a
second portion for quenching the fluorescent substance. More preferably, the
detection
system detects a reduction in emitted radiation.
Preferably, at least a portion of the marker is covalently or non-covalently
bound to a
tRNA.
Also preferably, at least a portion of the marker is covalently or non-
covalently bound
to at least a portion of a ribosome. More preferably, the portion of the
ribosome is at or near
at least one of the A site, P site, E site or peptide exit channel site. Also
more preferably, the
at least a portion comprises an amino acid.
Preferably, the detection system irradiates the system with electromagnetic
radiation.
Also preferably, the detection system comprises a microscope.
CA 02517566 2005-05-30
WO 2004/050825 PCT/1L2003/001011
13
Preferably, the detection system measures emitted radiation from a single
ribosome.
More preferably, the marker comprises a donor-acceptor fluorescent pair
suitable for
performing single pair FRET and wherein the emitted radiation occurs upon
performing
single pair FRET.
Preferably, the detection system measures a plurality of signals from a
plurality of
ribosomes. More preferably, the computational device performs signal analysis
of emitted
radiation from the plurality of signals.
Preferably, the apparatus includes equipment, for example in the detection
system, for
identifying at least one protein being synthesized through the analyzing the
emitted radiation.
Preferably, the detection system operates in real time.
Also preferably, the detection system monitors protein synthesis by detecting
a
plurality of protein synthetic processes over a period of time. More
preferably, the plurality
of protein synthetic processes comprise a plurality of interactions of a
single ribosome with a
plurality of different tRNA molecules.
According to a preferred embodiment of the present invention, there is
provided a
method for analyzing a chemical compound library, the method comprising:
administering
each of the compounds to a protein translation system; measuring a response of
the system
according to the method described above; and analyzing the measurement to
provide
information about the compound.
According to another preferred embodiment of the present invention, there is
provided an apparatus for analyzing a chemical compound library, comprising: a
well array
plate comprising a plurality of wells: a robot for placing a protein synthesis
system into the
wells; a robot for administering chemical compounds into the wells; and an
apparatus as
previously described to analyze protein synthesis by the system.
According to still another preferred embodiment of the present invention,
there is
provided a method for determining cellular protein pathways, comprising:
selecting a cellular
or bacterial culture; placing the culture in a plurality of sample containers;
subjecting the
culture to at least one condition in each of the containers; measuring protein
synthesis in each
of the containers as previously described; and analyzing protein expression
patterns in all
containers to determine protein pathways.
According to yet another preferred embodiment of the present invention, there
is
provided a method for ribosome labeling to allow protein synthesis monitoring,
the method
CA 02517566 2005-05-30
WO 2004/050825 PCT/1L2003/001011
14
comprising: selecting a fluorescent probe; selecting a location on at least
one of a ribosomal
RNA or on a ribosomal protein according to at least one of a characteristic of
the probe or a
characteristic of at least one of the ribosomal RNA or the ribosomal protein;
and attaching
the probe to the location. Preferably, the selecting the fluorescent probe is
performed
according to at least one of a suitable excitation or emission property of the
probe.
According to another preferred embodiment of the present invention, there is
provided a method for protein production monitoring, the method comprising:
selecting a
protein synthesis system for PSM analysis; selecting a fluorescent probe;
selecting a location
on at least one of a ribosomal RNA or on a ribosomal protein according to at
least one of a
characteristic of the probe or a characteristic of at least one of the
ribosomal RNA or the
ribosomal protein; attaching the probe to the location to perfolin PSM; and
analyzing signals
from the probe to monitor the protein synthesis system.
According to still another preferred embodiment of the present invention,
there is
provided a method for detecting protein synthesis in a protein synthesis
system, the method
comprising: providing a marker for protein synthesis in the system, the marker
having a
label; attaching the marker to at least one component of the system; and
detecting the label to
determine protein synthesis activity in the system.
According to a preferred embodiment of the present invention, there is
provided use
of a marker for detecting a protein synthetic act in real time. Preferably,
the protein synthetic
act comprises an interaction between a tRNA and a ribosome. More preferably,
at least one
of the ribosome and the tRNA features a marker. Most preferably, both the
ribosome and the
tRNA feature the marker. Also most preferably, the tRNA comprises a naturally
fluorescent
amino acid.
Preferably, the ribosome comprises a label. More preferably, the label
comprises a
quantum dot.
Preferably, each of the ribosome and the tRNA features a portion of a marker.
More
preferably, a first portion comprises a fluorescent acceptor and a second
portion comprises a
fluorescent acceptor.
Preferably, if the ribosome comprises a marker or a portion thereof, the
marker or the
portion thereof is covalently or non-covalently bound to ribosomal protein Ll
, ribosomal
protein S1 or a combination thereof.
CA 02517566 2005-05-30
WO 2004/050825 PCT/1L2003/001011
More preferably, the use is for performing a screening assay according to the
detecting the protein synthetic act. Also more preferably, the screening assay
is for detecting
a pathological condition in a subject.
More preferably, the use is for pathway elucidation through the detecting the
protein
5 synthetic act.
Also more preferably, the use is for cell state analysis through the detecting
the
protein synthetic act.
According to a preferred embodiment of the present invention, there is
provided use
of a marker for identifying a protein being synthesized by a protein synthetic
process in real
10
time. According to a preferred embodiment of the present invention, there is
provided use of
a marker for identifying a tRNA species being used in a protein synthetic
process in real
time.
According to a preferred embodiment of the present invention, there is
provided use
of a marker for identifying an amino acid species being used in a protein
synthetic process in
15 real time.
According to a preferred embodiment of the present invention, there is
provided use
of a marker for identifying a codon species being used in a protein synthetic
process in real
time.
In order to better describe the disclosure, current technologies that the
invention may
optionally use are briefly explained. It should be noted that all references
given in this
application are hereby incorporated by reference as if fully set forth herein.
Fluorescent Resonance Energy Transfer ( FRET)
Fluorescence resonance energy transfer ¨ FRET- has been known for over 50
years
(Ha, T., Single-molecule Fluorescence resonance energy transfer, Methods 25,
78-86
(2001), review; De Angelis, D.A., Why FRET over genomics? Physiol. Genomics
1999, 31;
1(2): 93-9; Selvin, P.R., The renaissance of fluorescence resonance energy
transfer, Nat.
Struct. Biol. 2000 Sep;7(9):730-4; Kenworthy, A.K., Imaging Protein-Protein
Interactions
Using Fluorescence Resonance Energy Transfer Microscopy, Methods. 2001
Jul;24(3):289-
96). The technology allows measurement of distances in the nanometer scale up
to about 10
nanometers. It relies on a quantum-mechanical principle where, under suitable
conditions,
energy is transferred between molecules without photon exchange. For FRET to
occur, a
CA 02517566 2005-05-30
WO 2004/050825 PCT/1L2003/001011
16
donor fluorophore is excited by incident light while an acceptor fluorophore
is nearby. The
emission spectrum of the donor must overlap with the excitation spectrum of
the acceptor. In
this configuration, some of the energy is transferred from donor to acceptor
without
generation of photons. This causes the excitation of the acceptor molecule,
and consequently
the emission of a fluorescent photon in. the natural fluorescent frequency of
the acceptor.
Thus, when FRET occurs, donor emission decreases and acceptor emission
increases as the
distance between them diminishes. The energy transfer efficiency obeys the
relationship
E cc [1+ (R I R0)61-1 , where R is the distance between donor and acceptor and
Ro is a
constant that depends on donor-acceptor configuration and characteristics.
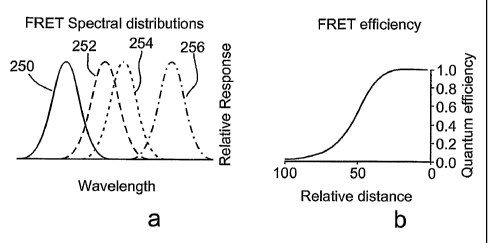
Figure 1 shows a diagram of FRET pair configuration. In Figure 1 A the
spectral
graphs of donor excitation 250, donor emission 252, acceptor excitation 254
and acceptor
emission 256 are shown. Note the overlap between the spectral responses of
donor emission
and acceptor excitation. In Figure 1B the efficiency of energy transfer is
shown as a function
of donor-acceptor normalized distance (R0 is equivalent to 50 in this chart).
FRET has been recently used to sequence DNA (Bralavsky, I., Sequence
information
can be obtained from single DNA molecules, Proc Natl Acad Sci U S A., 2003 Apr
1;100(7):3960-4.), monitor cellular events in live cells (ZIolunik et al.,
Quantitation of
transcription and clonal selection of single living cells with beta-lactamase
as reporter,
science 1998 Jan 2;279(5347):84-8)), create sensitive biochemical sensors (
Medintz et al.,
Self-assembled nanoscale biosensors based on quantum dot FRET donors, Nat
Mater. 2003
Sep;2(9):630-8 ), perform real time sequencing of DNA or RNA (PCT application
WO
01/16375 to Schneider and Rubens) and monitor protein-protein interactions or
protein
kinetics (Jia et al., Nonexponential kinetics of a single tRNA-Phe molecule
under
physiological conditions. Proc Natl Acad Sci U S A. 1997 Jul 22;94(15):7932-
6). Numerous
ingenious variants of the technique have been used successfully both in-vitro
and in-vivo,
both in bulk and in single molecule setting. One common application is the
real-time
monitoring of inter-molecular distances. Indeed, using FRET, it is becoming
common
nowadays to observe dynamics of single molecular events, in real time, in
living cells.
In one preferred embodiment, FRET architecture makes use of a donor-quencher
pair
rather than a donor-acceptor architecture; for this optional embodiment, the
donor-quencher
pair forms the marker. This implementation is a more robust architecture,
allowing the use of
CA 02517566 2005-05-30
WO 2004/050825 PCT/1L2003/001011
17
metal and other particles instead of fluorescent biomolecules. In this
embodiment, the signal
measured is in fact the donor signal, interrupted by periods of quenching.
The ribosome and the mechanism of translation
The structure of the ribosome and the mechanism of translation, as have been
revealed by recent work, are reviewed herein (Alberts, B., Johnson, A., Lewis,
J., Raff. M.,
Roberts, K., and Walter, P., Molecular Biology of the Cell, 4th ed, 2002,
Garland Science,
N.Y.; Ramakrishnan, V., Ribosome Structure and the Mechanism of Translation,
2002, Cell
108 557-572; Schlunzen, F. et al., Structural basis for the interaction of
antibiotics with the
petidyl transferase center in eubacteria, 2001, Nature 413 814-821; Sytnik, A.
et al.,
Peptidyl Transferase Center Activity Observed in Single Ribosomes, 1999, J.
Mol. Biol. 285,
49-54; Nyborg, J., and Liljas, A., Protein biosynthesis: structural studies of
the elongation
cycle, 1998, FEBS letters 430, 95-99).
The ribosome itself is composed of two subunits, termed 30S and 50S (there are
differences between bacterial and eukaryotic ribosomes¨ henceforth in this
discussion the
ribosome is presumed to come from E. coli, although this assumption is made
for the
purposes of description only and without any intention of being limiting in
any way). The
large unit is composed of a pair of large RNA molecules (5S and 23S), the
small subunit of a
single RNA molecule (30S). Each unit has several dozen small proteins attached
to it
(Alberts, B., Johnson, A., Lewis, J., Raff. M., Roberts, K., and Walter, P.,
Molecular Biology
of the Cell, 4t) ed, 2002, Garland Science, N.Y.). The ribosome reads the code
on mRNA
molecules and synthesizes the encoded protein through the mediation of tRNA
molecules.
The process is performed in three stages: initiation, elongation and
termination.
The ribosome uses an adaptor molecule ¨ transfer RNA, or tRNA. These molecules
are a special type of RNA. At one end, they have the anticodon part that binds
to the RNA
codon. At the other end, they carry the amino acid corresponding to that
codon. Figure 2A
shows a tRNA molecule 2, with the anticodon loop 4, the amino acid arm 6, and
a loaded
amino acid 8. The tRNA molecules have a cycle of being charging with amino
acid and
discharging. Charging, or attachment of amino acids to the tRNA molecules, is
performed by
the aminoacyl-synthetase enzyme family. Discharging is performed by the
ribosome, serving
as a ribozyme (RNA enzyme).
When tRNA is tagged (as for example with a fluorescent label), the tRNA should
continue to function normally during the processes of becoming charged with an
amino acid,
CA 02517566 2005-05-30
WO 2004/050825 PCT/1L2003/001011
18
attaching to the elongation factors, and traveling through the ribosome.
Several tagging
schemes have made use of the shoulder 10 of the molecule in order to create
fluorescent
labeling schemes that are efficient on the one hand and result in a fully
functional tRNA
molecule on the other hand. Several studies have shown that E. coli tRNAs
(tRNA
molecules) can be efficiently labeled at position 8, which has. in many cases
a 4-thiouridine
base, and at position 47, which has in several cases an amine-reactive X-base
(see table
below; it should be noted that these position numbers are given according to a
standard
numbering system for tRNA molecules). tRNA functionality requires that the
molecule
interact properly with the aminoacyl synthetases on the one hand, and with the
ribosomal
machinery (including the elongation factors) on the other. tRNA recognition by
aminoacyl
synthetases is known to be particularly dependent on the anticodon part and
the amino acid
arm locus.
There are three important stages in translation: initiation, elongation and
termination.
For monitoring protein synthesis, where protein identification is a preferred
motivation, the
important stage is elongation. Figure 2B shows a schematic description of
bacterial ribosome
structure with the larger (50S) subunit 20, smaller (30S) subunit 25,
aminoacyl (A) site 50
where tRNAs dock initially, peptidyl (P) site 51 where the growing polypeptide
chain is
docked, and exit (E) site 52 from where the deacylated tRNA is removed once
the cycle is
complete. Also shown are tRNAs that are undocked yet 40 and 41 to show that
the cycle
may continue further, mRNA being decoded 30 and the nascent polypeptide chain
being
synthesized 45. The ribosome itself is made up of large folded rRNA chains
with ribosomal
proteins. The larger subunit 20 contains two folded rRNAs, known as 23S and
5S. The
smaller subunit 25 contains one folded rRNA, 30S (not shown). On the folded
rRNA chains
more than 50 ribosomal proteins are docked (not shown). They are customarily
denoted by
Ll , L2 etc for the approximately 36 ribosomal proteins attached to the large
subunit, and by
S 1 , S2 etc for the approximately 21 ribosomal proteins attached to the small
subunit
(numbers given are correct for E. coil ribosomes).
Three docked tRNAs are seen in Figure 2B. The first 42 is in the A (Aminoacyl)
site;
the second 43 in the P (Peptidyl) site, and the amino acid it carries is at
this point connected
to the nascent peptide; the third 44 is in the E (exit) site, it has been
discharged from the
amino acid and will be ejected shortly from the ribosome. The heavy line 30
indicates the
CA 02517566 2005-05-30
WO 2004/050825 PCT/1L2003/001011
19
mRNA being translated, and the dotted line 45 represents the polypeptide being
synthesized,
tied into the Peptidyl position.
The main stages of elongation are as follows. Stage 1: Codon recognition. A
tRNA
molecule carrying an amino acid binds to a vacant A-site, while the nascent
polypeptide is
attached to the P-site. Stage 2: Peptide bond creation. A new peptide bond is
created and the
polypeptide chain is moved to the A-site. Stage 3: Translocation. The ribosome
translocates
a distance of 3 nucleotides with respect to the mRNA, the two tRNA units and
the
polypeptide chain. Stage 4: the cycle repeats itself until a stop codon is
reached.
This cycle is shown as schematic diagrams in Figures 3A-3C. Stage 1 ¨ Codon
recognition- is shown in Figure 3A. A tRNA molecule 800 carrying an amino acid
802 binds
to a vacant A-site 820, while the growing polypeptide chain 810 is attached to
amino acid
806 on tRNA 804 that is docked in the P-site 822. At this stage E site 824 is
shown as
empty. Stage 2, peptide bond formation, is shown in Figure 3B. A new peptide
bond is
created between amino acid 806 and amino acid 802, and the polypeptide chain
810 is
moved to the A-site 820. Stage 3, translocation, is shown in Figure 3C. The
ribosome
translocates 3 nucleotides with respect to the mRNA, the two tRNA units 800
and 804, and
the polypeptide chain 810. Stage 4: the cycle repeats itself until a stop
codon is reached.
Single molecule detection
In recent years, the technology of single molecule detection by fluorescent
spectroscopy has advanced considerably. This has been aided by novel
microscopy methods;
improved radiation sources, cameras and detectors; novel, highly efficient
fluorescent labels
in the visible range; and novel labeling techniques. The achievements of
single molecule
fluorescent spectroscopy are numerous. It has allowed us to measure dynamic
behavior and
reaction kinetics of individual biological molecules inside living cells, and
provided a direct
way to quantify, with a high spatial and temporal resolution, biological
events inside cells at
the single-molecule level. Kinetics of a single molecule have been
demonstrated (Zhuang et
al., Correlating structural dynamics and function in single ribozyme
molecules. Science.
2002 May 24;296(5572):1473-6), individual ion channels have been studied in-
vivo (Harms,
G.S. et al., Single-Molecule Imaging of L-Type Ca2+ Channels in Live Cells,
2001,
Biophysical Journal 81, 2639-2646), DNA sequencing has been performed using
optical
methods with single DNA molecules ( Braslavsky et al., Sequence information
can be
obtained from single DNA molecules, Proc Natl Acad Sci U S A. 2003 Apr
1;100(7):3960-4)
CA 02517566 2012-09-07
WO 2004/050825 PCT/1L2003/001011
translation by single ribosomes has been observed and measured (Vanzi et al.,
Protein
synthesis by single ribosomes, RNA (2003), 9:1174-1179), Ribosome activity was
measured
in single ribosomes (A. Sytnik et al., Peptidyl Transferase Center Activity
Observed in
Single Ribosomes, J. Mol. Biol. 285, 49 (1999), protein denaturation has been
studied
5 (Deniz, A.A., et al., Single-molecule protein folding: Dyfusion
fluorescence resonance
energy transfer studies of the denaturation of chymotrypsin inhibitor 2, 2000,
PNAS 97 (10),
5179-5184). Numerous additional applications have been reported: direct
observation of the
motions of molecular motors, enzymatic reactions, structural dynamics of
proteins and
DNA-protein interactions in-vitro; single lipid molecules in a lipid bilayer
have been
10 visualized, ligand-receptor reactions and lipid molecule movements have
been visualized as
single molecules on the surface of living cells. The technique has been
reviewed extensively,
as, for example, in the following references
Sako, Y., and Yanagida, T, Single-molecule visualization in cell biology, Nat
Rev
Mol Cell Biol. 2003 Sep;Suppl:SS1-5. Review; Schwille, P. and Kettling, U.,
Analyzing
15 single protein molecules using optical methods, 2001, Current Opinion
Biotech., 12:382-
386; Weiss, S., Fluorescence Spectroscopy of Single Biomolecules, 1999,
Science 283,
1676-1683.
Most important for the present invention is the technology of single molecule
FRET
detection (single pair FRET - spFRET). In this technique, FRET pairs are
attached to the
20 biomolecules of interest, whether in-vitro or in-vivo, and observed by a
single-molecule
microscopy system. If the FRET pairs are separated by distances that are
within the
resolution limit of the imaging device, single interactions can be observed.
Thus, FRET
technique combines naturally with single molecule detection methods. A good
practical
review of the technology and its usage can be found in Ha, T, Single-molecule
fluorescence
resonance energy transfer, METHODS 25, 78-86 (2001).
There are several parameters which are important for single molecule detection
in
general, and single pair FRET in particular. One is the reduction of
background noise and
background fluorescence. Both in-vitro and in-vivo, the molecules to be
detected are
surrounded by a complex molecular environment that emits radiation at any
recorded
frequency. The solution to this background noise involves reduction of the
observed volume.
This can be achieved in several ways. Confocal microscopy limits the observed
volume to
CA 02517566 2005-05-30
WO 2004/050825 PCT/1L2003/001011
21
the order of 10-15 L, which is sufficient for many applications. Total
internal reflectance is an
illumination mode that uses the phenomenon of evanescent wave (Toomre D, and
Manstein
DJ, Lighting up the cell surface with evanescent wave microscopy, Trends Cell
Biol. 2001
Jul; 11(7): 298-303). With this illumination mode only a slab whose thickness
is just about a
hundred nanometers above the slide surface is illuminated. Another method that
is becoming.
widespread is two-photon microscopy. With two-photon microscopy, the
illumination
radiation has approximately half the required excitation energy (i.e., half
the frequency or
double the wavelength). Only when the fluorophore interacts simultaneously
with two
photons will it be excited. This reaction requires a very high photon
intensity, which occurs
only in the focus of the illumination beam, thus allowing drastic reduction of
the excitation
volume while bringing the background fluorescence to practically zero.
Another important parameter for our application is the sampling rate, or frame
rate of
the system. In prokaryotes, the ribosome synthesizes polypeptides at the rate
of about 20
amino acids per second. In eukaryotes the rate is about an order of magnitude
lower. If the
FRET signal is assumed to be "on" for about half the synthesis cycle, and if
at least 4-5
samplings are required for reliable detection, then a sampling rate of about
200 frames per
second is required for prokaryotes.
It is preferable that the system be able to monitor a number of active
ribosomes
simultaneously. A ribosome has a diameter of about 20nM, and the distance
between two
ribosomes (on the same mRNA strand) is on the order of 40nM. The resolution of
standard
optical microscopes, at their diffraction limit, is about 180nM, and for
practical resolution of
active PSM signals we should assume a distance at least 4 times larger. Thus,
a realistic
computation assumes one PSM signal per square micron. In a system with pixel
size
.1micron and field of 1000X1000 pixels, the field of view is 100 microns
square, which
typically holds 100 eukaryotic cells and can resolve hundreds and even
thousands of
ribosomes.
Another important point is photobleaching of the fluorophores. When a
fluorescent
dye is excited it is susceptible to oxidation or photobleaching. With standard
fluorophores
such as naturally fluorescent proteins or small organic dyes, bleaching can be
minimized
both by eliminating as far as possible the sample exposure to oxygen, and on
the other hand
employing an enzymatic oxygen scavenger system. Singlet oxygen is presumed to
be the
main culprit in photobleaching, and in some cases oxygen removal has a
considerable effect
CA 02517566 2005-05-30
WO 2004/050825 PCT/1L2003/001011
22
on reducing photobleaching (cf. T. Ha, METHODS 25, 78-86(2001)). If the system
in use is
two-photon microscopy, than photobleaching is reduced considerably compared to
confocal
microscopy, especially because of the significant. or even near complete
reduction in
background excitation. Another configuration that helps lengthen the signal
generation time
is the use of quantum dots, which are practically immune to bleaching. When
quantum dots
are used as donors, and if the excitation radiation is well outside the
excitation spectrum of
the acceptor, very long monitoring times can be expected.
Novel fluorescent technology ¨ natural proteins, organic dyes and quantum dots
Over the last years, important advances have been made in fluorescent marker
technology. First, a large variety of naturally fluorescent proteins have been
found. These
enable a wide variety of in-vivo labeling strategies (cf. Miyawaki, A.,
Sawano, A and
Takako, K. Lighting up cells: labeling proteins with fluorophores. Nat Cell
Biol. 2003 Sep;
Suppl:S1-7. Review.). Fluorescent proteins can be found with excitation peaks
from 382nm
(BFP ¨ blue fluorescent protein)) to 590nm (HcRed1), and emission peaks
between 448 and
618nm for these proteins, respectively. Naturally fluorescent proteins are
particularly useful
for in-vivo labeling in the form of fusion proteins. Fusion proteins are
engineered proteins
whose amino acid sequence includes two parts: the first part contains the
sequence of the
fluorescent marker protein and the second part contains the protein of
interest to which the
fluorescent marker is attached. Fusion proteins with naturally fluorescent
proteins can be
generated using the method of Baubet et al. (Proc. Natl Acad. Sci. USA 97:7260-
5, 2000,
herein incorporated by reference).
Green fluorescent protein (GFP) and its derivatives include a chromophore
built of
amino acids located in the center of the molecule. GFP excels in being
photostable as well
as having numerous variants with a choice of excitation and emission
wavelengths (U.S.
Patents 5,626,058 and 5,777,079; Herzenberg et al., Clin Chem. 2002
Oct;48(10):1819-27;
Hailey et al., Methods Enzymol. 2002;351:34-49). GFP can be attached to a
ribosomal
protein through the method of generation of a fusion protein, by well-known
recombinant
techniques as explained, for example, in Molecular Cloning, A Laboratory
Manual, cold
Spring Harbor Laboratory, Cold Spring Harbor, New York, chapter 17, 1989,
herein
incorporated by reference. A cell that is engineered to produce this fusion
protein can
produce ribosomes that include the engineered ribosomal protein as required. A
CA 02517566 2012-09-07
WO 2004/050825 PCT/1L2003/001011
23
comprehensive treatment of green fluorescent protein is Chalfie, M. & Kain, S.
(1998)
Green fluorescent protein: properties, applications, and protocols, eds.
Chalfie, M. & Kain,
S. (Wiley-Liss, New York)
Another relevant technology is that of semiconductor quantum dots, which has
matured sufficiently to be used routinely to label biomolecules (Jovin, T.M.,
Quantum dots
finally come of age, Nat Biotechnol. 2003 Jan;21(1):32-3 and references
therein, Medintz,
I.L. et al., Self-assembled nanoscale biosensors based on quantum dot FRET
donors, Nat
Mater. 2003 Sep;2(9):630-8). Quantum dots are currently manufactured as
colloidal
inorganic semiconductor nanocrystals consisting of a CdSe core and a ZnS cap.
The
absorption spectra of these dots are very wide, while the emission is very
narrow (20-40nm
FWHM). The emission spectrum can be controlled by the size of the dot, where
larger dots
emit longer wavelengths. Most importantly, quantum dots are practically immune
to
photobleaching, such that monitoring can optionally be performed for minutes
or even hours,
in contrast with traditional probes, that may bleach out after a few seconds.
This is important
for this optional application since a protein synthesis monitoring system
should be able to
monitor protein production over a period of hours.
The application of quantum dots to biomolecules labeling was hampered by
several
technical difficulties which were recently overcome. Powerful applications of
quantum dots
have been recently published. In Jaiswal et al., Nat. Biotechnol. 21, 47-51
(2003), HeLa
cells labeled by endocytosis of quantum dots coated with DHLA retained the
internalized
dots and continued to grow for more than a week. In Wu et al., Nat.
Biotechnol. 21 41-46
(2003), successful targeting of quantum dots to a cell surface receptor,
cytoskeletal
components and nuclear antigens were demonstrated. In Medintz, I.L. et al.,
"Self-assembled
nanoscale biosensors based on quantum dot FRET donors", Nat Mater. 2003
Sep;2(9):630-
8, a hybrid inorganic-bioreceptor sensor has been produced, where the quantum
dot serves as
FRET donor and an organic dye as a quencher. The use of a quantum dot as a
FRET donor is
an important optional application for the present invention, as discussed
below.
Several techniques for In-vivo labeling with quantum dots have been developed,
including endocytic uptake and selective labeling of cell surface proteins
with quantum dots
conjugated to antibodies are described in (Jaiswal et al., ref above). Quantum
dots,
individually encapsulated in phospholipid block-copolymer micelles have been
injected into
Xenopus embryo cells, and the embryo development has been followed for several
days
CA 02517566 2012-09-07
WO 2004/050825 PCT/1L2003/001011
24
(Dubertret et al., "In-vivo imaging of quantum dots encapsulated in
phospholipid micelles",
Science. 2002 Nov 29,298(5599):1759-62).
Quantum dots are commercially available from Quantum Dot Corporation, Hayward,
Ca. These are available ready for use in biological assays, with several
surface treatments ¨
biotinylated, conjugated with strepavidin, or conjugated to Protein A. Several
spectral
profiles are offered for each product. Detailed protocols are available on-
line.
Last, new techniques of in-vivo labeling allow the use not only of naturally
fluorescent proteins, but also of quantum dots and organic dyes (cf . Miyawaki
et al.,
reference above) to study parameters of live cells. One example of a novel
technique for
labeling proteins with small organic fluorophores within live cells uses bi-
arsenic
fluorophore labeling of proteins that have been genetically altered to contain
tetra-cysteine
motifs (Griffin et al., specific covalent labeling of recombinant protein
molecules inside live
cells", Science 281, 269-272 (1998)). The protein to be labeled is genetically
fused to a
short peptide containing a CCXXCC motif. The fluorescent label, FlAsH, is a
derivative of
fluorescein that contains two arsenoxide groups. The FlAsH label is membrane-
permeant
and non-fluorescent, acquiring fluorescence only on binding to the CCXXCC
motif.
There are numerous suppliers, catalogs and on-line resources that help in
selection of
fluorescent probes, FRET pairs, and attachment reagents. Some well known
suppliers are
Molecular Probes, Bio-Rad Corporation, and Pierce, whose handbooks of
fluorescent probes can be found
on-line.
Numerous other methods exist for fluorescent labeling or dyeing a protein for
fluorescent applications, as explained, for example in Allan, V.J. (ed),
Protein Localization
by Fluorescence Microscopy, A Practical Approach, Oxford University Press.
Cell-free translation systems
Cell free translation systems are well known. Recently a synthetic system,
built
entirely from purified recombinant factors, and that has a high protein
synthesis yield, was
described (Shimizu et al., Cell-free translation reconstituted with purified
components. Nat
Biotechnol. 2001 Aug;19(8):751-5). Kits and detailed instructions can be
obtained from
CA 02517566 2005-05-30
WO 2004/050825 PCT/1L2003/001011
vendors such as Promega (Madison, WI). These systems are used for several
applications,
such as ORF validation and functional analysis of gene products. The systems
contain
ribosome-rich media with the required tRNAs and amino acids, and little or no
mRNA.
When mRNA is introduced, the ribosomes begin translation and proteins are
produced.
5 Often the proteins are produced radiolabeled. This enables the researcher
to verify that the
required proteins were in fact produced. The optional, exemplary system
disclosed here is
easier to assemble in-vitro than in-vivo, since labeling techniques are more
readily available
and easier to implement.
Translation of in-vitro transcribed mRNAs: In-vitro translation can be
performed
10 using kits such as the nuclease-treated rabbit reticulocyte lysate
available from Prornega,
(Madison, WI). Before in-vitro translation, cellular mRNAs are heated at 67 C
for 10 min to
unfold secondary structures that would eventually affect the efficiency of
mRNA translation.
Reactions are then assembled as recommended by the supplier in the presence of
20 mCi of
[35s}methionine (ICN Biochemicals). Protein synthesis occurs during incubation
at 30 C.
15 Customarily, the resulting proteins are purified and analyzed by
radiolabeling. The
procedure requires centrifugation, rinsing and immune-precipitation followed
by separation
on SDS-polyacrylamide gels. Following electrophoresis, gels are exposed to
film or
Phosphor B1 screens, and the bands corresponding to the synthesized protein
verified. For
PSM applications, radiolabeling of protein products may optionally be
performed but is not
20 required.
With the present invention, cell-free translation systems could optionally
produce one
protein or many proteins, and their identification and production rates could
be measured,
controlled, and optimized in real time. This can lead to new protein
production methods that
are easier to control than the customary methods of bio-production in reactors
with bacteria,
25 yeast or CHO-cells, for example. Since the in-vitro translation system
is fully controllable,
and since it also allows co- and post-translational modifications, this method
is an attractive
alternative to current technologies.
When single molecule detection is required in in-vitro translation systems,
the
molecules need to be immobilized. There are several approaches to
immobilization of
biomolecules. Biomolecules can be attached specifically or non-specifically,
and in either
case, either ribosomes or mRNA templates can be immobilized.
CA 02517566 2005-05-30
WO 2004/050825 PCT/1L2003/001011
26
For non-specific immobilization, DNA or RNA can be attached to a charged
surface
such as an aminopropylsilane-coated surface via electrostatic interaction, as
described in 8.
Ha, T. et al., (1996) Proc. Natl. Acad. Sci. USA 93, 6264-6268. Even though
this method
avoids DNA aggregation and works in water, this immobilization method may
interfere with
the properties or activity of the ribosome.
Another nonspecific immobilization method successfully used for single-
molecule
fluorescence study is trapping molecules inside polyacrylamide pores (Dickson,
R. M., et al.,
(1996) Science 274, 966-969) or agarose gel (Lu,H. P., et al., (1998) Science
282, 1877-
1882., Dickson, R. M., etal., (1997) Nature 388, 355-358.). While gel
immobilization has
the merit of not requiring any special modification of the biomolecule, it has
some
disadvantages. First, the concentration of other small molecules such as
enzyme substrates
and ions is difficult to change in a short time. Sudden changes in the buffer
conditions are
necessary for a certain type of single-molecule studies. Second, because of
limited molecular
diffusion, it is not easy to study interactions between macromolecules in gel.
Specific immobilization requires a well-defined modification of the biological
molecule. For instance, a biotin or a digoxigenin can be attached to an mRNA,
rRNA or
ribosomal protein, to immobilize them to streptavidin- or antidigoxigenin-
coated surfaces
respectively. Alternatively, histidine tags that are typically introduced to
help the purification
of recombination proteins can be used to immobilize a ribosomal protein on a
Ni-NTA-
coated surface. A detailed procedure for preparing a mini-flow cell to
immobilize
biotinylated nucleic acids is described in Ha, T., Methods 25, 78-86 (2001).
A surface can be densely coated by polyethylene glycol (PEG). PEG is known to
reject protein adsorption to a surface if it forms a dense coating.
Bifunctional PEG can be
used immobilize nucleic acids specifically to a surface while rejecting
protein adsorption.
mRNA can be optionally immobilized on a polyethylene glycol (PEG) coated
surface with
biotin-streptavidin linker, and the ribosomes allowed to process the
immobilized mRNA.
The mRNA preferably features 3'-end biotin labeling. Since protein synthesis
may not end
normally because of the linked 3' end, it is advisable to ensure that the
template mRNA
continues for at least 20 codons beyond the stop codon. In another approach, a
ribosomal
protein can be labeled with biotin and immobilized on a fused glass slide. The
other
ribosomal components can then be reconstituted around the immobilized protein.
CA 02517566 2005-05-30
WO 2004/050825 PCT/1L2003/001011
27
Ribosomal complexes can also be bound to a mica surface, which is transparent
and flat on a
molecular size scale. Ribosomes, either labeled or unlabeled, undergo binding
to mica in a
few seconds, allowing the detection of single fluorescence images in aqueous
buffer. A large
excess of ribosomes and a short incubation period are employed for single
molecule
detection. The mica-bound ribosomes retain their activities, as shown in
Sytnik et al., J. Mol.
Biol. (1999), 285, 49-54, where detailed protocols are provided. Preparation
of the mica cells
and adsorption of ribosomes to these cells is also described in Vanzi et al.,
Protein synthesis
by single ribosomes, RNA (2003), 9:1174-1179.
LIST OF ABBREVIATIONS
ADME-TOX: A set of parameters relevant to drug candidates that should be
measured prior
to clinical trials (Absorption, Distribution, Metabolism, and Excretion) and
TOX (Toxicity)
APD: Avalanche photodiode, a sensitive detector of faint optical energy.
CCD: Charge coupled device, a photo sensitive semiconductor device usually
arranged as a
one- or two-dimensional array of photo sensitive cells.
CHO: Chinese hamster ovary cell line.
CSOM: Confocal scanning optical microscope.
FRET: Fluorescence resonance energy transfer. A method by which molecular
distances of
the order of few nanometers can be determined using appropriate fluorophores.
FWHM: Full width half maximum, a measure of signal resolution in spectrometry.
GPCR: Cell surface receptors that are coupled to heterotrimeric G-proteins
(GTP-binding
proteins).
HTS: High throughput screening, a method used in drug discovery by which a
large library
of chemical compounds is assayed for binding to a specific receptor.
ICAT: a method of sample tagging that allows relative quantitation of proteins
in two
samples using LC-MS-MS.
LC-MS: a mass spectrometer that is directly coupled to a liquid chromatography
column,
and where ionization commonly is achieved with the electrospray method.
LC-MS-MS: a mass spectrometer of the LC-MS type where ions are further
fragmented and
the mass spectrum of the fragments is measured. Often used to identify
sequences of tryptic
peptides.
CA 02517566 2005-05-30
WO 2004/050825 PCT/1L2003/001011
28
MALDI-TOF: mass spectrometer that ionizes the sample with the technique of
matrix-
assisted laser desorption ionization, and measures masses using a time-of-
flight mass
analyzer.
NA: numerical aperture (of a lens).
ORF: Open reading frame. A putative protein-encoding gene.
PCR: Polymerase chain reaction, a method for in-vitro amplification of DNA.
PEG: polyethylene glycol, a surface treatment agent that aids in
immobilization of
biomolecules for optical analysis.
PMT: photomultiplier tube, a sensitive photodetector.
PSM: Protein synthesis monitoring, an acronym for at least some aspects of the
present
invention.
tRNA: transfer RNA, the adaptor molecule that delivers amino acids to the
ribosome.
mRNA: messenger RNA, the template by which proteins are synthesized.
rRNA: ribosomal RNA, one of the RNA strands that are part of the ribosome.
SHIM: Second harmonic imaging microscopy.
TIR: Total internal reflection, a microscopy illumination method that
illuminates a very
volume at the interface of two materials with different refractive indices.
TIR-FM: total internal reflection fluorescent microscopy.
TPE: two photon excitation, an illumination method for special microscopy
applications.
TPM: Two Photon microscopy, a microscopy system that uses TPE illumination.
Y2H: A method for detecting protein-protein interaction in-vivo in
Saccharomyces
cerevisiae.
BRIEF DESCRIPTION OF THE DRAWINGS
The invention is herein described, by way of example only, with reference to
the
accompanying drawings. With specific reference now to the drawings in detail,
it is stressed
that the particulars shown are by way of example and for purposes of
illustrative discussion
of the preferred embodiments of the present invention only, and are presented
in the cause of
providing what is believed to be the most useful and readily understood
description of the
principles and conceptual aspects of the invention. In this regard, no attempt
is made to
show structural details of the invention in more detail than is necessary for
a fundamental
CA 02517566 2005-05-30
WO 2004/050825 PCT/1L2003/001011
29
understanding of the invention, the description taken with the drawings making
apparent to
those skilled in the art how the several forms of the invention may be
embodied in practice.
In the drawings:
FIGURES IA and 1B describe the properties of a FRET pair and the dependence of
the FRET effect on pair distance.
FIGURE 2A describes the tRNA molecule.
FIGURE 2B describes the basic structure of a ribosome and the elongation
cycle.
FIGURES 3A-3C describe the stages of the elongation cycle.
FIGURE 4 describes the embodiment of the R-T tag strategy.
FIGURE 5 describes the embodiment of the R-A tag strategy.
FIGURES 6A-6D describe the embodiment of the R-R tag strategy.
FIGURE 7 shows the principle of total internal reflection (TIR) illumination.
FIGURE 8 describes the general setup of a PSM system.
FIGURE 9 describes the stages of the signal processing channel.
FIGURE 10 describes a confocal microscopy setup for PSM.
FIGURE 11 describes confocal PSM optical setup at the sample scale.
FIGURE 12 describes a wide-field TIR microscopy setup for PSM.
FIGURE 13 describes a two-photon microscopy setup for PSM.
FIGURES 14A-14D describe a simulation of an illustrative method for signal
processing according to the present invention.
FIGURE 15 shows an optional, illustrative strategy suitable for screening of a
chemical compound library with the system and method disclosed herein.
DETAILED DESCRIPTION OF SEVERAL EMBODIMENTS
The present invention is of a system and method for monitoring protein
synthesis in a
protein synthesis system, by using a marker for protein synthesis in the
system, which
preferably causes electromagnetic radiation to be emitted. The protein
synthesis system may
optionally comprise a single ribosome, or alternatively a plurality of
ribosomes. The marker
optionally comprises at least one photo-active component.
The emitted electromagnetic radiation is then detected and can be analyzed to
monitor protein synthesis. The present invention may optionally be performed
qualitatively,
but is preferably performed quantitatively. As used herein, "monitoring" may
also optionally
CA 02517566 2005-05-30
WO 2004/050825 PCT/1L2003/001011
include at least the initial detection of a protein synthetic act or process,
such as an
interaction between a tRNA and a ribosome for example, preferably in real
time. Optionally
and preferably, monitoring includes identification of the tRNA or tRNA
species, amino acid
or amino acid species, codon or codon species that are being processed.
Preferably,
5 monitoring includes detecting a plurality of such synthetic acts, such as
a plurality of
interactions between a ribosome and a plurality of different tRNA molecules
for example.
Monitoring may also optionally and more preferably include identifying the
protein being
synthesized. Such monitoring is optionally and preferably performed with a
protein
synthesis system, optionally and more preferably including a single ribosome
or a plurality
10 of ribosomes, optionally with tRNA or tRNA species and/or other protein
synthetic
components as required, optionally in vivo or in vitro.
The marker preferably enables the present invention to detect which tRNA is
currently being processed by a ribosome, which mRNA codon is being read, or
which amino
acid is currently being added to the nascent protein. This signal can
optionally and preferably
15 be captured and analyzed in seconds to reveal the protein's identity.
The procedure can
optionally be performed simultaneously for hundreds of single ribosomes,
optionally in vitro
or in vivo and so provide, for the first time in biology, a tool for dynamic
monitoring of
protein synthesis.
Optionally, as described in greater detail below, the present invention may be
20 implemented with a cell that is stably engineered, for example through
genetic engineering,
to form a stable cell culture and/or cell line. Alternatively or additionally,
the cell may
optionally be transiently altered or engineered; optionally a combination of
these techniques
may be employed, for a single cell or a plurality of cells.
Optionally and preferably, the present invention is used for performing a
screening
25 assay by detecting or monitoring the protein synthetic act. Optionally,
the screening assay is
for detecting a pathological condition in a subject, such as cancer for
example. The present
invention may also optionally be used for pathway elucidation by detecting or
monitoring
the protein synthetic act. The present invention may also optionally be used
for cell state
analysis by detecting or monitoring protein synthetic act, for example by
identifying the
30 synthesis of proteins related to apoptosis, heat shock, DNA damage
repair, budding, or any
other cell state.
CA 02517566 2005-05-30
WO 2004/050825 PCT/1L2003/001011
31
Illustrative, optional methods for monitoring of protein synthesis are now
described
in detail below. The method will be described in several variants and several
applications by
way of an example, and it should be recognized that the illustrated
embodiments should not
. be taken as a limitation on the scope of the disclosure. The following
sections describe
various aspects and details of the new invention.
SECTION I: ILLUSTRATIVE EMBODIMENTS OF THE PRESENT INVENTION
DD1 Strategies for synthesis monitoring ( R-T, R-A, R-R, and multicolor)
Overview
An optional, exemplary but preferred method of the present invention is now
described for synthesis monitoring. The ribosome of a live bacterium, cell, or
an in-vitro
translation mechanism is tagged with a donor fluorphore. One or more types of
acceptor
fluorophores are placed on some of the tRNAs and/or on some of the amino acids
and/or on
another part of the ribosome. As the ribosome goes through the elongation
cycle, a FRET
signal is generated when labeled tRNAs, labeled amino acids or appropriate
codons are
processed. Since only some and not all species of tRNA or amino acids or
codons are
designed to generate a signal, the resulting signal is a characteristic of the
protein being
translated, and so, with an appropriate method of signal analysis, this
protein may optionally
be identified.
One exemplary flow of operation is now described. An optical apparatus
monitors a
marked protein synthesis system (a system featuring at least one marker
according to the
present invention), optionally by directing electromagnetic radiation of the
required
wavelength and energy onto the marked system, thereby exciting the donor
fluorophores.
The acceptor fluorophores on the tRNAs and/or amino acids and/or on the
ribosome,
whether engineered or natural, respond to this energy with the FRET effect
whenever donor
and acceptor are in sufficient proximity, indicating the progress of the
elongation cycle of
said synthesis system. Fluorescence radiation emitted from the acceptor
fluorophores is
detected by the optical apparatus and the event is recorded by a computerized
analysis unit.
Since only some of the elongation cycles but not all of them generate a
signal, the resulting
sequence of detection events is a characteristic of the protein being
synthesized. In computer
science terminology this signal sequence may optionally be described as a bit
stream with
zeroes and ones. The stream contains some uncertainty as to the number of bits
in each field,
CA 02517566 2005-05-30
WO 2004/050825 PCT/1L2003/001011
32
as well as other elements of uncertainty. The signal is subsequently used to
interrogate a
database of signals computed from a relevant database of protein sequences.
The method
disclosed herein describes how to use this signal to identify the protein that
is most likely to
have produced the signal.
The method is preferably able to consider the precise nature of the
uncertainty in the
detected signal sequence, in order to provide a scoring function that is able
to compute the
measure of likelihood, for each protein in the database, that this protein
species is the one
whose synthesis produced the signal sequence that was detected.
There are a number of optional basic strategies for PSM labeling (for adding a
marker to the protein synthesis system, optionally through covalent or non-
covalent binding,
for example to a tRNA and/or ribosome or portion thereof), a few examples of
which are
described below.
Ribosome-tRNA (R-T) labeling
This optional, exemplary labeling strategy calls for a donor label on the
ribosome and
an acceptor label on tRNA, or vice versa. R-T tagging or labeling may
optionally include a
fluorescent labeling method in which the ribosome and tRNA form a FRET pair
and/or other
type of donor/acceptor pair and/or fluorescent/quencher pair. Figure 4 shows a
specific
example of this strategy.
In this optional embodiment of the present invention, R-T tagging involves
placing a
donor on the ribosome and an acceptor on some of the tRNAs. Methods of tagging
tRNAs
and ribosomes are discussed below. The tag can be placed either near the A,
the P, or the E
site. In one preferable embodiment a ribosomal locus near the E site is
tagged. This ensures
that the tRNA is identified after the proofreading stage. In one preferable
embodiment
ribosomal proteins are tagged. Several ribosomal proteins are known to be near
the E site,
such as ribosomal proteins Li, Si and S21. Experiments have shown that these
proteins can
be efficiently tagged while retaining ribosome functionality. Such experiments
are described,
for example, in Mascarenhas et al., Specific polar localization of ribosomes
in Bacillus
subtilis depends on active transcription. EMBO Rep. 2001 Aug; 2(8):685-9, in
which
ribosomal protein Li was labeled with blue fluorescent protein (BFP) and
proven to retain its
functionality; and in Odom et al., "Relaxation time, intethiol distance, and
mechanism of
CA 02517566 2005-05-30
WO 2004/050825 PCT/1L2003/001011
33
action of ribosomal protein Sl", Archiv. Biochem. Biophys. 1984, 230(1) 178-
193, in which
ribosomal protein Si was labeled through its two cysteines.
Figure 4 shows one exemplary embodiment of the R-T tagging strategy. Ribosome
large subunit 160 and small subunit 164 are attached to an mRNA 162 being
processed.
tRNA 170 (with amino acid 180) is in A site 171, tRNA 172 (with amino acid
182) in P site
173, tRNA 174 in E site 175. tRNA 176 has just been ejected out of the E site
and tRNA 178
is already free of the ribosomal-mRNA complex. The growing polypeptide chain
184 is also
shown. Donor fluorophore 190 is located preferably and optionally on ribosomal
protein Li,
which is attached to large ribosome subunit 160, just outside the mRNA exit
channel (not
shown), in proximity to the E site. tRNA 176 in this Figure is labeled with a
fluorescent label
192 and therefore is in close proximity to the donor fluorophore 190. The
donor fluorophore
emission spectrum overlaps the excitation spectrum of acceptor fluorophore
192. Radiation
energy 194 is made to impinge on donor fluorophore 190 and excite it, causing
part of the
energy to transfer to acceptor fluorophore 192, exciting it and causing
emission of FRET
signal 196 of a lower energy and therefore higher wavelength. When tRNA 192 is
not of a
tRNA species that has been labeled, a FRET signal is not emitted. Thus, as the
ribosome
processes the mRNA, an on-off signal is detected by the system that
corresponds to the
tRNA labeling scheme being used and therefore characterizing the protein being
synthesized,
allowing the identification of the protein being synthesized.
R-A labeling
R-A tagging or labeling is another optional embodiment of the present
invention, in
which the ribosome and an amino acid form a FRET pair and/or other
donor/acceptor pair
and/or fluorescent/quencher pair. In another exemplary, optional embodiment of
the present
invention, the donor tag is placed near the peptide exit channel, and so is
able to excite the
acceptor fluorophores on the amino acids, either natural or engineered. In
this embodiment,
the detected FRET signal correlates with the amino acid sequence of the
protein being
synthesized; however, the proteins include labeled amino acids and are
therefore no longer
completely natural, a fact which may influence the functioning of the cellular
mechanism.
In Figure 5 an example of this type of embodiment is depicted. Ribosome small
subunit 200 and large subunit 202 are attached to mRNA 204 being processed.
tRNA 206 is
docked in the A site and carries amino acid 220. tRNA 208 is docked in P site
and carries
CA 02517566 2005-05-30
WO 2004/050825 PCT/1L2003/001011
34
amino acid 222. tRNA 210 is docked in the E site and its amino acid has
already been
removed. Donor fluorophore 226 is attached to the ribosome in a location near
the exit
location of the peptide channel (not shown). Donor fluorophore 226 is
illuminated with
electromagnetic radiation 230 of a frequency compatible with its excitation
frequency.
Emission frequency of donor fluorophore 226 overlaps the excitation frequency
of acceptor
fluorophore 228. Acceptor fluorophore can be either natural, as in the amino
acids tyrosine,
tryptophan and phenylalanine for example, or else can be artificially labeled
as explained
below. In any case, if the amino acid 224 is appropriately labeled with
acceptor fluorophore
228, then a FRET 232 signal is generated when acceptor fluorophore 228 passes
sufficiently
close to donor fluorophore 226. When unlabeled amino acids are in this
position, a FRET
signal is not generated. Thus, as the ribosome synthesizes the protein, an on-
off signal is
generated that is characteristic of the protein being synthesized, allowing it
to be identified.
R-R labeling
R-R tagging or labeling is another optional embodiment of the present
invention in
which two locations on the ribosome, optionally covalently bound or non-
covalently
associated moieties, form a FRET pair and/or other donor/acceptor pair, and/or
fluorescent/quencher pair.
In another exemplary, optional embodiment of the present invention, both donor
and
acceptor tags are attached to the ribosome; the combination of both tags may
optionally be
described as a marker for the present invention. One tag ("base") is
preferably located on a
fixed part of the ribosome, which makes it static. The other ("lever") is
preferably an
appendage engineered to be attached to the ribosome, covalently or non-
covalently, and is
capable of moving in one prescribed direction ¨ towards or away from the
location of the
mRNA as it exits the ribosome. In one optional embodiment, the lever mimics a
tRNA
molecule in order to recognize exiting mRNA codons. The lever is preferably
constructed to
bind weakly to a specific nucleotide triplet or pair, as in the case of codon-
anticodon
recognition rules. If, for example, the lever is designed to recognize the
nucleotide pair GC,
whenever the mRNA sequence contains a GC in the appropriate position, the
lever goes
"down" and binds to GC, preferably causing a fluorescent signal to be
generated or
quenched (or optionally a combination, if a plurality of fluorescent moieties
is present). For
other pairs, the lever stays "up" and this signal is not generated or quenched
(or the
CA 02517566 2005-05-30
WO 2004/050825 PCT/1L2003/001011
combination is not generated). The FRET or other type of signal thus marks the
advance of
the mRNA with a bimodal response. This embodiment has the important benefits
of leaving
the translation mechanism almost entirely natural ¨ tRNAs and amino acids are
completely
natural, only an external part of the ribosome has been tampered with.
5
Illustrative diagrams of this exemplary embodiment are shown in Figures 6A-6D.
The lever is a preferably a modified tRNA molecule, with a "codon loop" and a
relatively
long and rigid arm, connected to a "hinge". This can be engineered to stem out
of a single
strand rRNA loop. The ribosomal RNA has numerous stretches of single strands,
extending
from a few bases to a few dozen bases. These single strand loops are
convenient for placing
10 an
extension that has the required biochemical and physical characteristics. The
pseudo-
anticodon part of the lever is constructed to bind weakly to a specific
nucleotide pair, such as
GC in the example. In Figure 6A the mechanism is shown in the "non-
recognition"
configuration. 100 and 102 are the small and large ribosome subunits, 110, 111
and 112 are
the A, P and E sites respectively. Only the A site 110 and P site 111 are
occupied in this
15 diagram.
A tRNA-like lever 120, connected in this illustrative example to large
ribosomal
subunit 102, does not bind (binding taken here to signify at least the
creation of Watson-
Crick pairs) to the nucleotides on mRNA 104, which passes between large
subunit 102 and
small subunit 100. This lack of binding is because the corresponding bases on
the mRNA
20 104
and pseudo-anticodon 120 are not complementary pairs (in the Watson-Crick
sense).
Therefore lever 120 stays relatively far removed from an acceptor fluorophore
152. Lever
120 carries a donor fluorophore 151, while the acceptor fluorophore 152 is
attached at an
appropriate location to the ribosome. When lever 120 remains in the "far"
position, a small
or null FRET signal is generated.
25 In
Figure 6B the mechanism is shown in a "recognition" configuration, where the
pseudo-anticodon on tRNA-like lever 120 does match the nucleotides on mRNA
104, in the
sense of Watson-Crick pairing. Therefore lever 120 moves relatively near to
mRNA 104,
causing donor fluorophore 151 and acceptor fluorophore 152 to come into close
proximity
and to emit a large FRET signal. The FRET signal thus marks the advance of the
mRNA
30
with a bimodal response for example, detection of a large signal versus small
signal. Thus,
as the ribosome processes the mRNA, an on-off signal is generated that is
characteristic of
the protein being synthesized, allowing it to be identified.
CA 02517566 2005-05-30
WO 2004/050825 PCT/1L2003/001011
36
In Figures 6C and 6D this mechanism is shown in greater detail. Ribosome 122
has
protruding chains 126 and 128 (shown in grey). The mRNA being translated 124
is shown
with nucleotides spaced on it. Static label 138 is attached to a location on
one of these
protruding chains. Artificially engineered RNA chain ("lever") 130 (shown in
black) is
attached at point 132 to form a movable hinge. The main part of RNA chain 130
has a
helical structure and therefore is physically rigid. The part farthest away
from hinge 132 has
an anticodon nucleotide sequence 134. On the chain 130 a fluorescent label 136
is attached.
Figure 6C shows the lever in recognition configuration, where the anticodon
134 recognizes
a codon on mRNA 124. In this case the lever assumes a position where the
fluorescent labels
136 and 138 are in close proximity, allowing a FRET signal to be emitted. In
Figure 6D, the
lever is in a non-recognition configuration, where the anticodon 134 does not
recognize the
codon on mRNA 124. In this case the lever assumes a position where the
fluorescent labels
136 and 138 are relatively far apart, and a FRET signal is not emitted, or
else a much smaller
FRET signal is emitted than in a recognition configuration.
Multicolor labeling
In the preceding examples it was assumed that the labeling was of the "on/off'
kind,
that is, one type of label was either used or not used. Optionally and
preferably, some
preferred embodiments of the present invention use more than one type of
label. For
example, in the R-T labeling strategy, if each type of tRNA could be labeled
with its own
specific color, the system would have been simpler since database
interrogation would have
become a matter of a trivial search procedure and, indeed, de-novo protein
sequencing would
have been possible in-vivo. Again, such a label optionally forms part or all
of the marker
according to the present invention. Even if this optional scheme is difficult
to achieve,
labeling the tRNA species with more than one color increases the amount of
information
available. For example, if 10 tRNA species are labeled with two label types (5
with each)
(10 \
rather than one, an increase of =252 fold in the amount of information is
obtained. In
\5)
fact, with some of the labeling methods this becomes possible. For example,
when acceptor
fluorophore is a quantum dot, then its excitation spectrum is very wide (see
above), while the
emission spectra is very narrow and can be distinguished easily. In such a
case one donor
fluorophore can excite several acceptors, resulting in additional sequence
information.
CA 02517566 2005-05-30
WO 2004/050825 PCT/1L2003/001011
37
Additional PSM strategies
In one preferred embodiment, a plurality or even all tRNAs, amino acids or
codons
are labeled, and not just a part of them. When this is done with one type of
label, it is not
possible to identify the protein being synthesized. However, this technique is
useful for
measuring synthesis rates, on/off FRET times, and for system calibration. When
the labeling
is done with several types of fluorophores, two, three or more, a large
increase in the amount
of information and confidence of the resulting identification is obtained when
all items are
labeled.
In one preferred embodiment, a quenching strategy is used instead of FRET, as
noted
previously. In this approach, instead of a fluorescent donor and acceptor,
there is a
fluorescent donor and an acceptor quencher that captures the donor energy
without emission.
In this strategy, donor fluorescence is detected as long as the quencher is
not sufficiently
near to the donor. In PSM, this would generate a signal of donor fluorescence
intermitted by
periods of quenching.
In another preferred embodiment, a combination of methods can be used. For
example, some tRNAs may be labeled for R-T tagging strategy, as well as one or
more
amino acids that are labeled for R-A strategy. The ribosome is labeled in a
way that allows
both methods to be used. Preferably, the amino acids are labeled with
fluorescent labels that
are distinct from tRNA labels. The signal analysis system accepts both signals
and uses both
in order to identify more confidently the protein being synthesized. It is
obvious to anyone
skilled in the art of single molecule detection and analysis that this is just
one example of a
wide variety of methods that can be derived from this particular example.
In one optional but preferred embodiment of the present invention, the natural
fluorescence of tRNAs and/or amino acids is utilized. In another optional
embodiment of the
present invention, a fluorophore is attached to some tRNAs and/or amino acids.
It is clear to
anyone skilled in this art that the donor and acceptor configurations could be
switched. It is
also clear to anyone skilled in the art that the embodiments described above
are not mutually
exclusive and any combination thereof can be used, which is another optional
embodiment
CA 02517566 2005-05-30
WO 2004/050825 PCT/1L2003/001011
38
of the present invention. For example, the natural fluorescence of some amino
acids together
with artificially labeled tRNA species can be used in a combination system.
DD2 Fluorescent labeling of ribosome, proteins and tRNA =
Ribosome labeling.
A large body of research details fluorescent labeling techniques of ribosomes;
such
labeling may optionally be used with the present invention as a marker or a
portion thereof.
These include in-vitro and in-vivo labeling, labeling with naturally
fluorescent proteins and
with organic dyes. Other published techniques that are relevant include
labeling with
semiconductor quantum dots. Labeling strategies included labeling ribosomal
proteins such
as ribosomal proteins Ll, Si, S21 and others; In addition, 3' and 5' ends of
5S, 16S and 23S
rRNA have been labeled (Robbins and Hardesty, Comparison of ribosomal entry
and
acceptor transfer ribonucleic acid binding sites on Escherichia coli 70S
ribosomes.
Fluorescence energy transfer measurements from Phe-tRNAPhe to the 3' end of
16S
ribonucleic acid. Biochemistry. 1983 Nov 22; 22(24):5675-9.).
For in-vitro labeling, there are several strategies. Organic dyes can be used
to label
ribosomal proteins using standard protein labeling techniques. Suppliers of
these dyes
publish detailed protocols describing their use. General procedures label
proteins through
their amino groups (lysine). Other procedures target cysteines which are
sometimes available
for precisely located labeling. In this way, ribosomal proteins Si and S8 were
labeled by
coumarin (Bakin et al., Spatial organization of template polynucleotides on
the ribosome
determined by fluorescence methods. J Mol Biol. 1991 Sep 20; 221(2):441-53),
and
ribosomal proteins were tagged with fluorescein attached to a cysteine residue
(Odom et al.,
Movement of tRNA but not the nascent peptide during peptide bond formation on
ribosomes.
Biochemistry. 1990 Dec 4;29(48):10734-44).
A novel labeling strategy uses quantum dots, which are commercially available
pre-
conjugated with biotin or streptavidin. In such cases, proteins can be labeled
with biotin, so
the streptavidin conjugated qdots (commercially available as QdotTm525/ QdotTm
565/
QdotTivi 605/ QdotTm 655 streptavidin conjugated quantum dots, from Quantum
Dot
Corporation, Hayward, Ca, USA; the numbers relate to maximal emission
wavelength, nm)
bind specifically to them. One useful method of generating a biotin-labeled
protein involves
creating a fusion protein between the protein of choice and biotin carboxyl
carrier protein
CA 02517566 2005-05-30
WO 2004/050825 PCT/1L2003/001011
39
(BCCP). In the fusion protein, the original protein sequence is fused
optionally to the last 87
(or 110) codons of the E. coli BCCP. When the fusion protein is translated, it
has the biotin
tag attached to it and binds specifically to streptavidin (cf. Surrey et al.,
Proc. Natl. Acad.
Sci. USA, Vol. 95, pp. 4293-4298, April 1998). This method is also useful in-
vivo, since
both organic dyes and quantum dots can be engineered to be attached to
streptavidin and
have membrane permeable characteristics (see, for example, Miyawaki, et al.,
Nat Cell Biol.
2003 Sep; Suppl:S1-7. Review; and Akerman et al., PNAS, 99:12617-12621,2002.)
Another method that is useful for in-vivo labeling of ribosomal proteins is
the well
known strategy of fusing the protein of choice with a naturally fluorescent
protein, such as
green fluorescent protein, yellow/cyan/blue fluorescent proteins or any other
naturally
fluorescent protein. An example where Li was labeled by fusing it with a
naturally
fluorescent protein is described in (Mascarenhas et al., Specific polar
localization of
ribosomes in Bacillus subtilis depends on active transcription. EMBO Rep. 2001
Aug;
2(8):685-9). Yet another novel method of in-vivo labeling involves the rare
sequence
CCXXCC (C= cystein). The protein to be labeled is genetically fused to a short
peptide
containing a CCXXCC motif. The fluorescent label, FlAsH, a derivative of
fluorescein that
contains two arsenoxide groups, is membrane-permeant and non-fluorescent,
acquiring
fluorescence only on binding to the CCXXCC motif.
Numerous additional strategies for ribosome labeling were tested and others
are
clearly possible.
tRNA labeling
Labeling a tRNA molecule is sensitive, since the molecule is small, and since
it
interacts in intricate ways with the aminoacyl synthetases on the one hand and
with the
ribosomal machinery on the other. As a tRNA molecule docks onto (binds to) the
ribosome-
mRNA complex, it is bound with elongation factor EF-TU and a GTP molecule.
Tagging
should also be compatible with this complex. Further, tRNA tag should have a
high binding
rate, so that preferably above 90% of the labeled tRNA species is actually
labeled.
Experiments have shown that tRNA molecules can be tagged while retaining their
interaction with the aminoacyl synthetases as well as retaining their
functionality with the
ribosome. tRNAs have been tagged with fluorescein (Watson et al.,
Macromolecular
arrangement in the aminoacyl-tRNA. elongation factor Tu.GTP ternary complex. A
CA 02517566 2005-05-30
WO 2004/050825 PCT/1L2003/001011
fluorescence energy transfer study, Biochemistry. 1995 Jun 20; 34(24):7904-12;
Plumbridge
et al., Characterisation of a new, fully active fluorescent derivative of E.
coli tRNA Phe.
Nucleic Acids Res. 1980 Feb 25; 8(4):827-43), tetra methyl rhodamine (Jia et
al.,
Nonexponential kinetics of a single tRNAPhe molecule under physiological
conditions. =
5 Proc Natl Acad Sci U S A. 1997 Jul 22;94(15):7932-6), with the dye
IAEDANS (5-((((2-
iodoacetypamino)ethyl)amino) naphthalene-1-sulfonic acid (1,54AEDANS)) (
Johnson et
al., Distance moved by transfer RNA during translocation from the A site to
the P site on the
ribosome, J. Mol. Biol. (1982) 156, 113-140), with proflavine and ethidium
bromide
(Wintermeyer and Zachau, Replacement of Y base, dihydrouracil, and 7-
methylguanine in
10 tRNA by artificial odd bases. FEBS Lett. 1971 Nov 1; 18(2):214-218).
Numerous other
labeling strategies have been studied.
For the present invention, some optional but preferred embodiments include but
are
not limited to labeling the tRNA with small organic dyes attached to the
"shoulder" region of
the tRNA, such as in positions 8 and 47 of E.Coli tRNAs which have been often
used for this
15 purpose. Note that both the anticodon region and the amino acid carrying
region are
sensitive, both in charging and in discharging. The dyes with which most
experience has
been gained are FITC and TMR. Detailed protocols for tRNA labeling with these
dyes are
presented below.
In numerous published experiments E.Coli tRNAPhe has been labeled by attaching
a
20 small organic dye either to the 4-thiouridine at position 8, where the
sulfur atom offers the
required reactive handle, or to the X-base (3-(3-amino-3-carboxypropyl)uridine
) at position
47, which has a primary reactive amine group coupled to the ribonucleic base
by an aliphatic
handle. Out of the 45 E.Coli tRNA species, 21 species have 4-thiouridine at
position 8, and 7
have an X-base at position 47. Thus, ample opportunities for tRNA tagging
strategies are
25 possible. The list of E.Coli tRNAs with these special bases at positions
8 and 47 is shown in
the table below. Also shown are the amino acids carried by the tRNA molecule
and the 3
base anticodon sequences. The legend for the anticodon base symbols are as
follows:
U-uridine, C-cytidine, A-adenosine, G-guanosine, T-thymine, H-unknown modified
adenosine, I-inosine, M-N4-acetylcytidine, Q-queuosine, 4- 4-thiouridine, V-
uridine 5-
30 oxyacetic acid, X-3-(3-amino-3-carboxypropyl) uridine.
CA 02517566 2012-09-07
WO 2004/050825 PCT/1L2003/001011
41
Table 1: tRNA amino acids
Anticodon Base at Anticodon Base at
Amino acid sequence position 8 Amino acid sequence position 47
Ala VGC 4 Phe GM X
Cys GCA 4 Ile GAU X
Asp QUC 4 Ile }AU X
Phe GM 4 Lys SUU X
Gly CCC 4 Met MAU X
His QUO 4 Arg ICG X
Ile }AU 4 Val GAC X
Leu HM 4
Met MAU 4
Asn QUU 4
Gin CUG 4
Gin NUG 4
Arg ICG 4
Ser GCU 4
Ser GGA 4
Ser VGA 4
Val GAG 4
Val VAC 4
Trp CCA 4
Ini CAU 4
Tyr QUA 4
A complete database of tRNA sequences can be found on-line.
A database of known RNA modifications can be
found on-line.
Another preferred and optional embodiment relies on the natural fluorescence
of
some tRNA species. For example, E.Coli tRNAPhe contains the highly modified Y
base
(wybutosine) in position 37 (Langlois, R., Kim, SH and CRA Cantor. A
Comparison of the
CA 02517566 2005-05-30
WO 2004/050825 PCT/1L2003/001011
42
Fluorescence of the Y Base of Yeast tRNA Phe in Solution and in Crystals,
1975,
Biochemistry 14: 2554-2558; Huang, K.H. and Cantor, C.R., Studies of 30 S
Escherichia
Coll Ribosome Reassembly Using Individual Proteins Labeled with an
Environmentally
Sensitive Fluorescent Probe, 1975, J. Mol. Biology 97, 423-441). In this
particular
embodiment, only the donor fluorophores need to be specially engineered onto
the ribosome.
However, this strategy has the disadvantage that the natural fluorescence of
tRNA molecules
is weaker than that of other specific labels.
AA labeling
There are three general approaches for fluorescent labeling of amino acids.
The first
is to rely on the natural fluorescence of tryptophan, tyrosine and
phenylalanine. Tryptophan
and tyrosine are highly fluorescent and can be used without modifications.
Phenylalanine is
slightly less so. The fluorescence properties of these amino acids are
summarized in the table
below.
Table 2: fluorescent properties of some amino acids
Excitation Emission
Lifetime
amino acid Molar
(Nanoseconds) Wavelength
Wavelength Quantum yield
absorptivity
Tryptophan 2.6 280 5,600 348 0.20
Tyrosine 3.6 274 1,400 303 0.14
Phenylalanine 6.4 257 200 282 0.04
The use of naturally fluorescent biomolecules is attractive as it requires
less
intervention and produces an engineered cell that is similar to a wild-type
cell. The
disadvantages are that the natural fluorescence is not as high as in naturally
fluorescent
proteins or organic dyes, and the excitation and emission peaks are fixed and
cannot be
changed. For the present invention, the fact that the excitation is in the UV
region makes
them more suitable as donors.
The second approach is using prelabled amino acids. Various alternatives exist
for
fluorescent labeling of amino acids. One example is The FluoroTectTm GreenL,
in-vitro
CA 02517566 2005-05-30
WO 2004/050825 PCT/1L2003/001011
43
Translation Labeling System, available from Promega (Italy), which allows the
fluorescent
labeling of in-vitro translation products through the use of a modified
charged lysine transfer
RNA labeled with the fluorophore BODIPYP'-FL. Using this system, fluorescently
labeled
lysine residues are incorporated into nascent proteins during translation.
The third alternative makes use of unnatural amino acids. These are
incorporated into
a protein by clever use of site-specific, unnatural amino acid mutagenesis,
combined with
use of the amber suppressor tRNA (Cornish et al., "Site specific incorporation
of
biophysical probes into proteins", Proc. Natl Acad. Sci. USA, Bol. 91 2910-
2914, 1994). In
this method, a highly fluorescent unnatural amino acid (such as 7-
azatyptophan) is charged
onto an amber suppressor tRNA. In parallel, the gene of interest is mutated to
include one or
more amber codons in predetermined sites. This is loaded into an in-vivo or in-
vitro
translation system, and the protein synthesis system incorporates the
unnatural amino acid
wherever the amber codon is present in the mRNA sequence. This method suffers
from
several drawbacks, including the inability of recharging the suppressor tRNA
and the need
for interfering with the original protein sequence. However, it is useful for
verifying the
proper functionality of a PSM system, both in-vitro and in-vivo, as disclosed
in detail below.
DD3 Optical apparatus, data acquisition, signal generation and analysis
Scanning versus wide-field microscopy
There are two general classes of fluorescence microscopic tools for single-
molecule
fluorescence studies, either of which may optionally be used with the present
invention. The
first class involves point detection with detectors that have single elements
(photomultiplier
tube (PMT) or silicon avalanche photodiode (APD)) used in combination with a
confocal
scanning optical microscope (CSOM) or near-field scanning optical microscope.
The second
class uses wide-field microscopy with two-dimensional detectors such as a CCD
camera.
One advantage of wide-field microscopy is that hundreds of single-molecules
can be
detected simultaneously, effectively performing hundreds of single- molecule
experiments in
parallel. This is especially useful for irreversible reactions or for very
rare biological events.
However, because an arrayed detector has to be used, the time resolution and
the sensitivity
are not as good as those of point detection cases.
CA 02517566 2005-05-30
WO 2004/050825 PCT/1L2003/001011
44
Wide-field microscopy can be done either through epi-illumination or through
prism
type evanescent field excitation. In epi-illumination, the excitation light is
sent through the
epi-illumination port of a conventional fluorescence microscope. Unlike in
CSOM,
autofluorescence generated from the microscope optics and sample cannot be
removed,
resulting in an inferior signal/noise ratio. In contrast, evanescent field
excitation does not
permit excitation light to propagate toward the detector and hence can reduce
the
autofluorescence to an undetectable level. Such an evanescent field excitation
is generated
by total internal reflection of the excitation light at the glass¨water
interface; therefore, we
call this microscope a total internal reflection microscope (TIRM).
Confocal microscopy
Confocal microscopy allows the excitation and measurement of signals from a
localized region with volume of less than 10-15 Liter. With appropriately
labeled proteins
there is a low chance of finding more than one tagged molecule in this volume.
Confocal
microscopes can be equipped with scanning laser illumination. The laser scans
the focal
plane a spot at a time, allowing images to be Ruined. The resulting instrument
is called
confocal scanning optical microscope (CSOM). In CSOM, laser excitation light
is focused to
a diffraction-limited spot using a high-numerical-aperture (NA) objective and
the
fluorescence coming from a single-molecule under the spot is collected using
the same
objective. A pinhole is used to block the out-of-focus autofluorescence signal
to achieve
single-molecule sensitivity. Unlike a commercial CSOM that raster-scans the
laser beam for
high-speed imaging, single-molecule CSOM typically scans the sample because
the imaging
speed is limited by the photon counts rather than by scanning speed. Two
detectors are
needed to detect donor and acceptor emissions simultaneously after their
separation using a
dichroic beam splitter. Computer-controlled data acquisition allows the
accumulation of a
large quantity of single molecule data by identifying individual molecules on
the surface and
taking the time records of single-molecule fluorescence signals.
Total internal reflection fluorescent microscopy (TIR-FM)
TIR-FM is a widely used technique for single molecule detection both in-vitro
and
in-vivo. TIR-FM, originally developed to observe the interface between two
media with
different diffractive indices, uses an electromagnetic field called the
'evanescent field' to
CA 02517566 2005-05-30
WO 2004/050825 PCT/1L2003/001011
excite fluorophores. As the evanescent field diminishes exponentially with
distance from the
interface, the excitation depth in TIR-FM is limited to a very narrow range ¨
typically one
hundred to several hundreds of nanometers. Using such a narrow excitation
depth is an
effective way to overcome the background noise problem.
5 In Figure 7, the principle of total internal reflection fluorescence
microscopy (TIR-
FM) is shown. Light beam 610 passing through a TIR objective or a dove prism
630
illuminates the meniscus of two media, glass slide 600 and cell 620, obliquely
from a high
(n1) to a low (n2) refractive index with an incident angle that is greater
than the critical angle
of total internal reflection for these indices. An electromagnetic field
called the 'evanescent
10 field' (615) rises from the interface into the medium with a lower
diffractive index. The
evanescent field diminishes exponentially with distance from the interface.
The decay length
of the evanescent field is dependent on incident angle. In objective-type TIR-
FM, a laser
beam illuminates the specimen through the objective lens. As the critical
angle of total
internal reflection from glass (n1 = 1.52) to water (n2 = 1.33) is 610, an
objective lens that
15 has a numerical aperture larger than 1.33 should be used for objective-
type TIR-FM.
Specially designed objective lenses that have an NA of 1.45 (for a use with
regular 1.52
glass and oil) or 1.65 (for a use with high refractive index glass and oil)
are now available.
The typical decay length of an evanescent field is one hundred to several
hundreds
nanometers, whereas the thickness of various regions of a typical cell is
between 0.1 m in
20 lamellipodia to ¨10 m at the nucleus. Typical distances between the
ventral cell surface and
the glass surface are ten to a few hundred nanometers. The circles represent
fluorescent
molecules that, in TIR-FM, are visible (640) and invisible (650).
Although TIR-FM provides superior contrast compared with other far-field
microscopy techniques, its application is limited to the proximity of the cell
surface that is,
25 to studying parameters in two dimensions. To observe single molecules
deep inside cells in
three dimensions, the methods of confocal or two-photon microscopy are
applicable.
Only sparsely labeled samples (<10 particles/ m2) can be visualized as single
molecules using TIR-FM or confocal fluorescence microscopy owing to the low
spatial
resolution. Additional information can be found in Sako, Y. & Uyemura, T.,
Total internal
30 reflection fluorescence microscopy for single-molecule imaging in living
cells. Cell Struct.
Funct. 27, 205-213 (2002), and Funatsu, T., Harada, Y., Tokunaga, M., Saito,
K. &
CA 02517566 2005-05-30
WO 2004/050825 PCT/1L2003/001011
46
Yanagida, T., Imaging of single fluorescent molecules and individual ATP
turnover by single
myosin molecules in aqueous solution. Nature 374, 555-559 (1995).
Two-photon microscopy (TPM)
Two-photon microscopy (TPM) is a form of laser-scanning microscopy that uses
excitation that has about half the energy required to excite the fluorescent
label. This type of
excitation is termed two-photon excitation (TPE). The technique relies on the
phenomenon
of near simultaneous absorption of two photons by the same molecule. When this
event
occurs, the fluorophore is excited, and subsequently relaxes while emitting a
photon with its
standard emission characteristics. Obviously, for two photons to be absorbed
simultaneously
(within 10-16 second), the flux of photons must be very high. This special
situation produces
the unique characteristics of two-photon microscopy: the fact that the
excitation depends on
the square of the energy ensures that excitation occurs only in a very small
sample volume,
in the beam's focus, with practically zero background excitation; the long
wavelength
enables deep penetration into cells, tissues and even live organisms (Zipfel
WR, Williams
RM, Webb WW. Nonlinear magic: multiphoton microscopy in the biosciences. Nat
Biotechnol. 2003 Nov; 21(11):1369-77, Heinze, K.G., Koltellnann, A., and
Schwille, P.,
Simultaneous two-photon excitation of distinct labels for dual-color
fluorescence
crosscorrelation analysis, 2000, PNAS 97 (19), 10377-10382). Additionally, the
unique
spectral characteristics of the TPE spectra allow the simultaneous excitation
of several
different fluorophores with the same two-photon illumination.
Since its discovery in 1990 (Denk, W. et al., Two-photon laser scanning
fluorescence
microscopy, science 248, 73-76 (1990)), TPM has been used in a variety of
applications,
from measuring calcium dynamics in brain slices and live animals, to in-vivo
studies of
angiogenesis and metastasis, to studies of hamster embryo development.
The high intensity of photons required for TPE is basically achieved in two
ways.
First, a laser beam is focused through a confocal laser-scanning microscope.
In the focal
plane, this yields the order of 5x1024 photons per cm2 per second. This
creates some TPE,
but coupled with the low detection efficiency it is insufficient for imaging.
The next level of
intensity concentration is achieved by a mode-locked titanium sapphire (Ti:S)
laser, that
produces about 80 million pulses a second, each with about 100f, duration.
Thus, with the
same average intensity, maximal intensity is increased drastically and the
intensity of TPE is
CA 02517566 2005-05-30
WO 2004/050825 PCT/1L2003/001011
47
increased by about 5 orders of magnitude. In view of these properties, the
focal point of a
TPM image is very sharp, and the light impinging on it is well structured. The
emission
photons, on the other hand, are scattered, sometimes considerably. Thus, a
primary
consideration in detector choice is the collection angle, and direct detectors
such as large
area photomultiplier tubes (PMT) close to the objective lens are appropriate.
Most types of fluorophores have been used with TPM, starting from molecules
that
have a relatively small action cross-section such as NADH, and ending with
quantum dots
that allow TPM with a few microwatts of laser power.
The main advantages of TPM are due to localized excitation, expanded
wavelength
accessibility of most fluorophores and the complete alleviation of out-of-
focus
photobleaching and photodamage. In addition, the ability of TPM to
simultaneously excite
different types of fluorophores with the same laser is important in many
applications as well
as in PSM.
Since 1996, TPM instruments are available from several manufacturers: Biorad
Micros-cience (Hemel Hampstead, UK), Zeiss (Oberkochen, Geiniany) and Leica
(Wetzlar,
Germany). Commercial Ti:S lasers for TPM are available from Spectra-Physics
(Mountain
View, CA) and Coherent (Sunnyvale, CA).
Additional microscopy techniques
In this section several additional microscopy techniques are mentioned, that
are
applicable in certain embodiments to the present invention.
Fluorescent lifetime imaging (FLIM) is a technique in which the fluorescent
lifetime,
rather than intensity, is measured. (Emptage, NJ, "Fluorescent imaging in
living systems",
Curr Opin Pharmacol. 2001 Oct; 1(5):521-4, Bastiaens PI, Squire A.,
"Fluorescence lifetime
imaging microscopy: spatial resolution of biochemical processes in the cell",
Trends Cell
Biol. 1999 Feb;9(2):48-52. Review). The fluorescence lifetime is the typical
time that the
fluorophore remains in the excited state. These lifetimes are usually in the
order of
nanoseconds. Microscopes equipped with FLIM can differentiate between
different
fluorophores that have different average lifetimes. Commercial FLIM
microscopes are
available, for example, from PicoQuant GmbH (Berlin, Germany). Model
"MicroTime 200"
is capable of single molecule detection, and can operate also in fluorescence
correlation
(FCS) mode.
CA 02517566 2005-05-30
WO 2004/050825 PCT/1L2003/001011
48
Second harmonic imaging microscopy (SHIM) is a microscopy technique that
relies
on special organic crystals (Campagnola PJ, Loew LM. "Second-harmonic imaging
microscopy for visualizing bionzolecular arrays in cells, tissues and
organisms", Nat
Biotechnol. 2003 Nov;21(11):1356-60. SHIM is based on a nonlinear optical
effect of
frequency doubling. This effect requires intense laser light to pass through a
special material
¨ usually an inorganic crystal. The light emerging from the crystal has
precisely half the
wavelength of the incoming light. In contrast with two-photon microscopy, no
fluorescence
occurs, and the coherence of the laser light is preserved.
There are a vast and growing number of additional microscopy techniques,
including
those using fluorescent labels, techniques with non-fluorescent labels, and
non-imaging
techniques such as atomic force microscopy and photon tunneling microscopy,
any of which
may optionally be used with the present invention.
Cameras and detectors
According to the microscopy system used, a point detector such as PMT may
optionally used, or an area detector such as a camera, for example. When PMTs
are required,
it is recommended to use a large-area PMT with high gain and low readout
noise. Recently
GaAsP photocathode PMTs are commercially available (Hamamatsu H7422P) which
offer
high quantum efficiency in the 400-650 nm range. This makes them well suited
for TPM
fluorescent work and in particular to PSM applications.
When wide-field microscopy is used, an imaging device is preferable for
simultaneous observation of a relatively large area (100x100 microns) with a
large number
of pixels (1000x1000 or more). It is important to use a camera which has a
high signal to
noise ratio simultaneously with high frame rate. In order to achieve the high
signal to noise,
cooled CCD cameras are used such as available from Princeton Instruments,
Vianen,
Netherlands. Recently, intensified CCD cameras have been introduced such as
the
intensified digital CCD camera system IPentaMAX-512EFT, from Roper Scientific,
Trenton, NJ. Such cameras allow the detection of individual fluorophores.
CA 02517566 2005-05-30
WO 2004/050825 PCT/1L2003/001011
49
Signal generation and analysis
In Figure 8, an exemplary overview of one preferred embodiment for signal
generation and analysis is presented. This example describes a general
framework where
each of the elements is described in more detail below. Illumination module
350 illuminates
sample 354 through microscope 352, and the resulting signals are detected by
detection
module 356. The resultant image is then preferably transferred to computerized
analysis
station 360 which analyzes the images, preferably records the FRET donor and
acceptor
signals with their precise timing and coordinates in the image, and optionally
and preferably
correlates the resulting signal sequences with protein data from a database
362, to obtain
protein identification data that is optionally presented on the computer
screen and optionally
stored in database 362 for further analysis.
The optical data from detection module 356 is received by the computerized
analysis
station 360 as a sequence of images, preferably at a rate of 60-300 frames per
second to
ensure that the synthesis cycle, operating at a rate as high as 20 amino acids
per second in
bacteria (and at a much lower rate in eukaryotes) is properly sampled. An
exemplary method
that analyses this image sequence is shown with regard to Figure 9. Image
sequence 400 is
first received by recording module 402. An image 403 is processed by
preprocessing module
404 that identifies putative signals in the single image. These signals are
output as a list of
coordinates 405 to signal sequencer module 406 that tracks the signals and
clusters them into
a list of separated signal sequences 407. In this process random or otherwise
unmatchable
signals are filtered out. A signal sequence is preferably of the form S = (ti,
xl, yi, si), (t2, x2,
y2, s2), = = = , (tn, X.115 Yrb sil),= = = = Where ti denotes a timing value,
xi, yi denote image coordinates,
and si denotes signal type or intensity (of both donor and acceptor). Signal
sequencer
module 406 updates this list of sequences S and each updated sequence is sent
to sequence
analyzer 408 which transforms the sequence S into one or more data-stream 409
of FRET
on/off signals, as further described in detail in the simulation experiment
below (section
entitled "data interpretation simulation").
Data stream 409 is preferably sent to protein identification module 410 that
processes
the data stream 409 and preferably retrieves a list 411 of protein sequences
that putatively
match data stream 409. A scorer module 412 preferably determines, for each
candidate
protein sequence from list 411, the probability that this protein is
responsible for the
observed signal sequence. The scored list 413 of scored protein candidates is
optionally and
CA 02517566 2005-05-30
WO 2004/050825 PCT/1L2003/001011
preferably analyzed, and preferably each protein candidate 415 with a
probability higher
than a predetermined probability threshold is displayed on the screen. Each
such protein
candidate 415 is also preferably recorded in database 420. A more detailed
description of
data analysis is described in the data interpretation simulation detailed
example below.
5
Multiple ribosome monitoring
In yet another preferred embodiment of the present invention, an optional,
exemplary
method is disclosed by which a plurality, tens, hundreds or even thousands of
ribosomes can
be monitored simultaneously. This method is important in order to ensure
detection of rare
10 or rarely synthesized proteins, such as proteins that have a very low
copy number, sometimes
less than one copy number per cell, on average. The size of the ribosome
(along the mRNA)
is approximately 20 nM. Along the mRNA strand, there are usually numerous
ribosomes at
various stages of translation. The distance between these ribosomes is about
40 nM. A
typical mRNA may be attached to dozens of ribosomes, depending on the mRNA
length.
15 This means that it is sufficient to tag only about 10% of ribosomes.
This level of tagging can
be achieved by limiting the tag concentration with respect to the number of
ribosomes in the
assay. There are anywhere from 1000 to 20,000 ribosomes in a single cell, so
that in order to
identify single-copy number proteins it is required to image 10% of that
number, i.e. 100-
2000 ribosomes. This can be done either in one cell or in a cell culture with
tens or hundreds
20 of cells. An imaging device with pixel size of about 100nM2 and
1000X1000 pixels will
have a field of view of 100 square microns, which holds 100 eukaryotic cells.
Thus,
monitoring 20 ribosomes per cell (as a non-limiting example) over a population
of 100 cells
results in 2000 ribosomes being monitored simultaneously. This enables such a
system to
identify single-copy proteins in real-time.
25 There is a tradeoff between the number of ribosomes monitored, the
copy-number
sensitivity, and the temporal response of the system. If only about 1% of
ribosomes are
monitored, then a single-copy protein is detected only once in 10 syntheses,
and would be
expected to require about 10 times longer to detect than when about 10% are
monitored, for
example.
CA 02517566 2005-05-30
WO 2004/050825 PCT/1L2003/001011
51
SECTION II: DETAILED EXPERIMENTAL EXAMPLES
This section provides a number of exemplary, illustrative, non-limiting
examples of
experiments that could optionally be performed with various preferred
embodiments and optional
implementations of the present invention. These examples are provided for the
purpose of
description only and are not intended to be limiting in any way.
El Labeling and wet setup for in-vitro protein synthesis monitoring
ElA Rhodamine-Fluorescein labeling
General description. In this example the tRNA is the FRET donor. It is labeled
with
fluorescein isothiocyanate (FITC), a dye whose excitation and emission peaks
are 494 and
520 nm, respectively. Ribosomal protein Li is the acceptor and is labeled with
TMR (tetra-
methyl rhodamine), a dye whose and excitation and emission peaks are 550 and
573 nm,
respectively. It has been shown (Plumbridge et al., NAR 8, 827-843, 1980) that
tRNA
labeled with this protocol retains its activity both in charging (with
aminoacyl synthetases)
and in the ribosomal synthesis cycle. The example shows labeling of tRNAPhe
but any tRNA
with similar structure (X base) can be similarly labeled (see tRNA base
modification table in
the section entitled "tRNA labeling" above). The labeled tRNA and ribosomal
protein are
constituted into an in-vitro translation system, and used to translate an
appropriate mRNA. In
this system the tRNA species that is introduced is unique since after the salt-
wash stage no
tRNA remains. This enables verification of the system's functionality, by
comparing signals
in a system where all tRNAPhe are labeled, as opposed to a similar system in
which all
tRNAPhe are unlabeled. . A poly-U mRNA is used as the translation template.
Similar
comparisons can be done with poly-U template versus other templates that do
not code for
phenylalanine. Obviously this illustrative system can be used in many
additional forms,
using additional tRNAs and various mRNAs to produce signals that can be
predicted and
compared with observation according to the present invention. Note: Instead of
(or in
addition to) labeling ribosomal protein Li, ribosomal protein Si could also
optionally be
similarly labeled, and there are numerous additional labeling strategies that
could optionally
be adopted.
Donor labeling -tRNAPhe labeling with FITC - Pure E. coli tRNAPhe (Roche
Applied
Science, Mannheim, Germany) is labeled at the X base (position 47) with FITC
(Sigma)
CA 02517566 2005-05-30
WO 2004/050825
PCT/1L2003/001011
52
(see for example Plumbridge et al., NAR 8, 827-843, 1980, and Robbins et al.,
Biochemistry 22, 5674-9, 1983). Approximately lml of tRNA' he (130A260 units)
are
dialyzed for 8h against a solution of 1M NaC1 and 50mM Hepes-KOH (pH 8.0).
After
dialysis of the tRNA, a dimethylformamide solution containing 100mM FITC is
added to
give a final dye concentration of 10mM. The reaction mixture is incubated for
5h at 37 C
and then brought to 100mM KCI, and the tRNA is precipitated by addition of 2
volumes of
ethanol and incubation for 2h at -20 C. The labeled tRNA is further separated
from
unreacted dye by two additional ethanol precipitations.
Unlabeled tRNA is removed by passing the tRNA over a BD-cellulose (Serva)
column equilibrated with a solution containing 400mM NaCl, 50mM Na0Ac (pH
5.0), and
10mM Mg(0Ac)2. The labeled tRNA is loaded in a minimal volume of the same
solution.
Then, a salt gradient of 0.4-2M NaC1 is applied to the column. The unlabeled
tRNA is eluted
first, followed by elution of the tRNAPhe-x-F. The labeled tRNA is
concentrated by ethanol
precipitation in the presence of 2% Na0Ac and subsequently dialyzed versus
buffer
containing 10mM PIPES, 10mM Mg(0Ac)2, 100mM NH4CI, 150mMKC1 and 1mM DTE.
The tRNA that is used in all experiments is nearly 100% labeled. Where
necessary, this is
accomplished by isolation of the specific labeled tRNA species using HPLC, as
described in
[Odom et al., Methods Enzymol. 164, 174-187, 1988].
Acceptor labeling- ribosomal protein labeling with Tetra-methyl rhodamine
(TMR): cf
protocol of supplier, molecular probes FluoReporter, Tetramethylrhodamine
Protein
Labeling Kit (F-6163).
Aminoacylation of labeled tRNAphe ¨ Cell-free translation systems may include
only
the ribosomal machinery and whatever tRNAs are chosen to be introduced, or
else they
may include the entire enzymatic set including the 20 aminoacyl synthetases
and the amino
acids required for recharging the tRNAs. An example for the latter type of
system is
described in Shimizu et al., Nature Biotech. 19, 751-5, 2001. When the
synthetases are not
present, as described in this illustrative example, it is necessary to
separately charge the
labeled tRNA with the appropriate amino acid in order for the tRNA to function
during
protein synthesis. Note that in this illustrative example tRNA species that
are present in the
system are only those which are expressly introduced. Charging the labeled
tRNA with
phenylalanine proceeds according to the following protocol (Plumbridge et al.,
NAR 8,
CA 02517566 2005-05-30
WO 2004/050825 PCT/1L2003/001011
53
827-843, 1980, Johnson et al., J. Mol Biol. 156, 113-40, 1982) (additional,
different
protocols can also be found in Robbins eta! Biochemistry 20, 5301-9, 1981, and
in Janiak
F eta!, Biochem 29, 4268-77 1990.) The reaction mixture contains 20 M
phenylalanin,
2mM ATP, 300 g of S100 enzymes (purified as described in Johnson et al., J.
Mol Biol.
156, 113-40, 1982) and approximately 0.2 M tRNA in final volume of 5m1 buffer
containing 100mM Tris-HC1 (pH 7.5), 10mM Mg(0Ac)2, 20mM KC1 and 1mM DTE.
Following incubation of 30min at 37 C, the Phe-tRNA'he is two times phenol
extracted and
two times ethanol precipitated. The Phe-tRNA'he is further purified by
chromatography on
a Sephadex G25 column (Pharmacia) at 4 C in 1mM potassium acetate (pH 5.0),
and then
reprecipitated. After resuspension in 1mM potassium acetate (pH 5.0), the tRNA
is
dialyzed versus the same buffer before storage at ¨70 C.
Plasmid construction and overexpression of ribosomal proteins Ribosomal
proteins Li
or Si are amplified by PCR from E.Coli genome and cloned into vector pET2 1 a
(Novagen)
to generate His-tagged protein plasmids (see for example Shimizu et al.,
Nature Biotech. 19,
751-5, 2001). The plasmids obtained are transformed into E. coli BL21/DE3
strains. His-
tagged proteins are purified as follows: BL21 cells are grown to an ()Dom of
0.5-0.9 in
Luria-Bertani (LB) broth. Isopropyl-B-D-thiogalactoside (IPTG) is added to a
final
concentration of 0.1mM, and the cells are grown for an additional 4h at 37 C.
Collected cells
are resuspended in a buffer [50mM HEPES-KOH pH 7.6, 1M NH4C1, 10mM MgC12,
0.3mg/m1 lysozyme, 0.1% Triton X-100, 0.2mM phenylmethylsulfonyl fluoride
(PMSF),
and 7mM B-mercaptoethanol] and are lysed by sonication. Cell debris is removed
by
centrifugation at100,000g for lh at 4 C, and the supernatant is applied to a
Ni2+ precharged
Hi-trap chelating column (Amersham-Pharmacia-Biotech). The column is then
washed with
10 volumes HT buffer [50mM HEPES-KOH pH 7.6, 1M NH4C1, 10mM MgC12, and 7mM
B-mercaptoethanol(BME)] containing 10mM imidazole.
Proteins are eluted with a linear gradient from 10mM to 400mM imidazole in HT
buffer. Fraction containing His-tagged proteins are dialyzed against stock
buffer [50mM
HEPES-KOH pH 7.6, 100mM KC1, 10mM MgC12,30% glycerol and 7mM BME] and are
frozen in small aliquots at ¨80 C. A general reference for purification of His-
tag proteins
can be found in Terpe K., Appl Microbiol Biotechnol. 2003 Jan;60(5):523-33.
CA 02517566 2005-05-30
WO 2004/050825 PCT/1L2003/001011
54
Preparation of ribosomes and ribosomal 50S and 30S subunits_(Bakin et al., J.
Mol.
Biol. 221, 441-453 1991)- Frozen E. Coli cells (150g) are resuspended in 150m1
of buffer
containing 20mM Tris-HC1 pH 7.2, 20mM MgC12, 200mM NH4C1, 2mM BME, at 4 C. The
cells are then broken by 3 passes through a French press at 1260kg/cm2. 4010
of DNase I are
added and the tube is centrifuged twice for 20min at 18,000revs/min. The
supernatant is
centrifuged for 3h at 30,000revs/min. The pellet of 70S ribosomes is
resuspended in buffer A
containing 20mM Tris-HC1 pH 7.2, 10mM MgCl2, 500mM NH4C1, 2mM BME, and
centrifuged through 30% (w/v) sucrose for 15h at 38,000revs/min. The 70S
pellet is
resuspended in buffer A and centrifuged for 15min at 18,000revs/min. The
supernatant is
dialyzed against 100 volumes of buffer containing 20mM Tris-HC1 pH 7.2, 1mM
MgC12,
200mM NH4C1, 2mM BME, and centrifuged through a 10% to 30% (w/v) sucrose
gradient
for 16h at 22,000revs/min. Fraction corresponding to the 30S subunit peak are
pooled and
the MgC12 concentration is increased to 20mM and then the 30S subunits are
precipitated
with 0.67 volume ethanol. The 50S subunits are precipitated with 100mg/m1
polyethylenglycol (Mr 6000). The pellets of subunits are resuspended in buffer
containing
20mM Tris-HC1 pH 7.2, 20mM MgC12, 200mM NH4C1, 2mM BME, and dialyzed against
the
same buffer for 3h at 4 C. Subunits are stored in ¨70 C.
Preparation of ribosomes and ribosomal 50S subunits lacking protein Li from E.
Coli
¨ preparation of 50S subunits lacking protein Li (50S-L1) from E.coli mutant
strain, which
does not contain ribosomal protein Li, is performed as described in Odom et
al.,
Biochemistry 29, 10734-44, 1990, Odom et al Biochemistry 19 5947-54, 1980.
Incorporation of labeled Li into SOS ribosomal subunit Labeled Li is
incorporated into
50S in a reaction mixture containing 400pmol of 50S-L1, 440pmol of labeled Li,
10mM
Tris-HC1 pH 7.5, 8mM Mg(0Ac)2, 150mM NH4C1, and 5mM BME, in final volume of
100 1. Incubation is for 10min at 35 C. Subunits isolated by centrifugation at
49,000rpm for
4h (see for example Odom et al., Biochemistry 29, 10734-44, 1990).
Poly(U)-dependent polyphenylalanine synthesis by TMR-labeled ribosomes and
FITC-
labeled Phe-tRNAPhe In total volume of 100 1: 25mM Tris-HC1 pH 7.5, 12-14mM
MgC12,
25mM NH4C1, 100mM KC1, 3mM dithioerythritol, 4mM BME, 0.8mM ATP, 0.05mM GTP,
5mM phosphocreatine, 2.5gg of creatine phosphokinase, 4pg labeled phe-tRNAPhe,
20pg
CA 02517566 2005-05-30
WO 2004/050825 PCT/1L2003/001011
poly(U), ¨60iig of E coli postribosomal supernatant (prepared as described in
Odom et al.
Arch Biochem Biophys 230, 178-193, 1984), 5X10⁻⁵M Phe (5Ci/mol), and 30S and
50S
ribosomal subunits, generally 0.8 A260 units of 50S with optimal amount of
30S, usually
0.45-0.5 A260 units. The reaction mixture is incubated for.30min at 37 C. (see
for example
5 Odom et al Biochemistry 19 5947-54, 1980; alternative protocols can be
found in
Plumbridge et al., NAR 8, 827-843, 1980, and Shimizu et al., Nature Biotech.
19, 751-5,
2001).
10 ElB Quantum dot-Rhodamine labeling
General description. In this example Ribosomal protein Li is the FRET donor.
It is labeled
with a quantum dot whose emission peaks at 525 nm. tRNA is the acceptor and it
is labeled
with TMR (tetra-methyl rhodamine), a dye whose excitation peaks at 550nm and
emission at
573nm. tRNA could also be labeled with FITC as in the previous example, and a
quantum
15 dot with appropriate emission characteristics selected. tRNA labeled
with this protocol
retains its activity both in the aminoacyl synthetases and in the ribosomal
synthesis cycle.
The example shows labeling of tRNAPhe but any tRNA with 4-thiouridine in
position 8 can
optionally be similarly labeled. There are about 20 such tRNAs in E. Coli, see
complete list
in the section entitled "tRNA labeling" above. The labeled tRNA and ribosomal
protein are
20 constituted into an in-vitro translation system, and used to translate
an appropriate mRNA.
Once the setup is ready, system testing can proceed as explained in the
previous example.
Note: Instead of labeling Li, ribosomal protein Si could also be similarly
labeled.
Ribosomal protein Si contains two cysteines, and therefore could be labeled
with an
appropriate protocol. For example, coumarin could be used as donor for a TMR
acceptor.
25 The labeling protocols are described in Odom et al. Arch Biochem Biophys
230, 178-193,
1984, or Bakin et al., J. Mol. Biol. 221, 441-453 1991.
Donor labeling- ribosomal protein Li labeling with quantum dots (QD) Ll
protein
is first biotinylated using FluoReporter Biotin-XX protein labeling kit
(Molecular
30 Probes, cat# F-2610) according to manufacturer protocol. Then, the
biotinylated protein
is linked to QdotTM 525 Streptavidin Conjugate (QuantumDot) according to
manufacturer protocol.
CA 02517566 2005-05-30
WO 2004/050825 PCT/1L2003/001011
56
Acceptor labeling- tRNA' e with TMR [cf. Yiwei et al., PNAS 94, 7932-7936,
1997,
Johnson et al., J. Mol Biol. 156, 113-40, 1982] - Pure E. coli tRNA'e (Roche
Applied
Science, Mannheim, Germany) is labeled at the 4-thiouridine (position 8) with
tetramethylrhodamine-5-iodoacetamide - TMR (Molecular probes) 30 A260 units of
E.Coli
tRNAPhe are dissolved in0.7m1 of 48mM potassium phosphate pH 8.4 and mixed
with 2.8m1
of MeS0 containing 3.1mg of TMR. After stirring in the dark for 7h, the
tRNAPhe is
removed by ethanol precipitation. The non-covalently bound dye is removed by
two phenol
extractions: the first is perfomied at pH 4.6 and a second after heat
denaturation of tRNAP
TMR in 10mM Tris-HC1 pH 7.0, 1mM EDTA at 85 C for 2min. The labeled tRNA is
then
extracted with ether. After ethanol precipitation the labeled tRNA is dialyzed
against 1mM
potassium acetate pH 5Ø The final tRNAPhe-TMR adducts are reactivated at 37
C for
10min prior to the experiment. In order to increase the activity of the TMR
labeled tRNAPhe,
it is sometimes recommended to attach the TMR label via a long tether. This
attachment is
made using bifunctional crosslinkers (Pierce Biotechnology, Rockford, Ill.).
All other processes described herein, including aminoacylation of labeled
tRNAphe;
plasmid construction and overexpression of ribosomal proteins; preparation of
ribosomes
and ribosomal 50S and 30S subunits; preparation of ribosomes and ribosomal 50S
subunits
lacking protein Li from E. cok_incorporation of labeled Li into 50S ribosomal
subunit; and
poly(U)-dependent polyphenylalanine synthesis by TMR-labeled ribosomes and
FITC-
labeled Phe-tRNA'; may optionally be performed as described in the previous
illustrative
example.
E2 Microscopy setup
E2A Bulk in-vitro microscopy setup
Bulk in-vitro monitoring of protein synthesis, confocal microscopy, and PMT
detector for detecting PSM signals.
Figure 10 shows an illustrative apparatus for bulk in-vitro protein synthesis
monitoring, where PSM signals are generated in solution. Scanning laser 300
with
appropriate wavelength and energy impinges a light beam 302 optionally through
dichroic
mirror 304, preferably into an inverted upright confocal microscope 306,
optionally and
preferably focusing on a movable fused silica slide 308 on which sample wells
310 are
located. The laser energy excites the donor fluorophores, which transfer
energy without
CA 02517566 2005-05-30
WO 2004/050825 PCT/1L2003/001011
57
photon transfer to the acceptor fluorophores according to the scheme used.
FRET energy
transfer occurs when an acceptor tag is in sufficient proximity to a donor
tag. When this
FRET excitation occurs, the fluorescence signal emitted from the acceptor
passes back
through microscope 306 and dichroic mirror 304, to be collected by detector
312. An
example of an available commercial system that embodies this type of optical
design is the
Olympus FluoView 500 confocal microscope available from Olympus America Inc.,
Melville, New York. The system enables a choice of laser illumination (Blue
Argon
(488nm), Multi-line Argon (457nm, 488nm, 514nm), Green Helium Neon (543nm),
Red
Helium Neon (633nm), Yellow Krypton (568nm), 442nm Helium Cadmium, 440nrn
Diode,
405nm Diode UV Argon (351m), 750nm IR), a choice of PMTs with an option for
several
PMTs used in parallel, and several scanning modes (XY, XYZ, XYT etc). The PMT
readout
is transferred digitally to computer system 314 for image analysis, signal
processing and
subsequent identification of the proteins being synthesized.
Figure 11 shows a close-up of the exemplary system shown in Figure 10, at the
sample level. Laser illumination passes through objective lens 320, which
typically has a
high numerical aperture such as NA=1.4 or more. The illuminated volume has the
shape of a
pinched cylinder, depicted by hyperbolic section 330. Movable microscope slide
322
supports well 326 in which the sample is enclosed. An imaged pixel lies in the
image plane
328, bringing to a minimum the volume of illuminated sample, and thereby
bringing to a
minimum the number of ribosomes imaged at any one time. The FRET signals (both
donor
and acceptor) to be detected return along the same optical path between lines
324 and into
objective lens 320, as described above.
E2B Single-molecule in-vitro microscopy setup
Single-molecule in-vitro monitoring of protein synthesis, immobilized
ribosomes,
wide-field microscopy, TIR illumination, and ICCD image acquisition for
detecting
PSM signals.
Figure 12 describes one optional but preferred embodiment for an exemplary
optical
apparatus for data acquisition, based on a wide-field microscope equipped with
TIR
illumination and intensified CCD camera. This setup is useful both for in-
vitro single-
molecule protein synthesis monitoring application, where the ribosomes are
immobilized on
CA 02517566 2005-05-30
WO 2004/050825 PCT/1L2003/001011
58
the microscope slide, and for in-vivo PSM, where the ribosomes are monitored
inside living
bacteria or cells. Referring to Figure 12, laser 600 is a diode-pumped doubled
YAG laser
(Crystalaser, Reno, NV) that can excite a wide range of dyes. Laser
illumination 602 travels
through a dichroic mirror 604 (Chroma Technology, Brattleboro, Vermont) and
into a dove
prism 606 such as a small Pellin Broca prism (CVI laser,
http://www.cvilaser.com/) where
the illumination undergoes TIR. The prism is optically coupled to the fused
silica bottom of
the sample chamber 608, so that evanescent waves illuminate up to 150 nm above
the
surface of the fused silica. The emitted fluorescence signals (both donor and
acceptor
fluorescence signals) pass through objective 610 (Olympus, DPLanApo 100UV
1.3oil, or
PLAP060X0, Plan APO 60X oil immersion, NA=1.4 working distance=.15 mm),
through a
fluorescent filter 612 (Chroma Technology, Brattleboro, Vermont) and imaging
lens 614 into
intensified ccd (ICCD) camera 618 such as Cascade:512B available from Roper
Scientific
Photometrics, a camera that has on-chip multiplication gain and a back-
illuminated CCD
with dual amplifiers. In this type of camera, the impact-ionization process
generates low-
noise as multiplication of photon-generated charge takes place on the CCD,
which undergoes
deep thermoelectric cooling. This camera can be operated at 10 MHz for high-
speed image
visualization or more slowly for high-precision photometry. Supravideo frame
rates are
achievable through subregion readout. The camera readout is transferred
digitally to
computer system 620 for image analysis, signal processing and subsequent
identification of
the proteins being synthesized.
For in-vitro single molecule PSM, the synthesizing system must be immobilized
on
the microscope slide. There are two basic options for immobilization. One is
to immobilize
the ribosomes. Ribosomal complexes can be immobilized onto a mica surface,
which is
transparent and flat on a molecular size scale. Ribosomes, either labeled or
unlabeled,
undergo binding to mica in a few seconds, allowing the detection of single
fluorescence
images in aqueous buffer. A large excess of ribosomes and a short incubation
period are
employed for single molecule detection. The mica-bound ribosomes retain their
activities, as
shown in Sytnik et al., J. Mol. Biol. (1999), 285, 49-54, where detailed
protocols are
provided.
Another option is to immobilize the mRNA and allow the ribosomes to process
the
immobilized mRNA. The mRNA can be immobilized on a polyethylene glycol (PEG)
coated
surface with biotin-streptavidin linker. The mRNA should undergo 3'-end biotin
labeling.
CA 02517566 2005-05-30
WO 2004/050825 PCT/1L2003/001011
59
Since protein synthesis will not end normally because of the linked 3' end, it
is advisable to
ensure that the template mRNA continues for at least 90 nucleotides beyond the
stop codon.
E2C Single-molecule in-vivo microscopy setup
Single-molecule in-vivo monitoring of protein synthesis, live cells, confocal
scanning optical microscope (CSOM), two-photon fluorescence illumination, and
GaAsP photocathode PMT detector for PSM signals.
Figure 13 describes one optional but preferred embodiment for an exemplary
optical
apparatus for data acquisition, based on a scanning two-photon microscopy
system. This
setup is useful for monitoring protein synthesis in single ribosomes in-vivo,
in prokaryotic
bacteria or cells of higher organisms. It is also optionally useful for in-
vitro PSM assays
according to the present invention. Referring to Figure 13, laser 650 is a
Nd:YV04 pump
laser producing 10 W power that drives the mode-locked Ti:S pulsed laser 652.
The Ti:S
laser provides up to 1 W at the peak wavelengths of the laser. The pulsed beam
from Ti:S
laser 652 enters a beam scanner 654 that allows control of the beam intensity,
as well as
adjusting the size of the beam at the back aperture of the objective, thereby
controlling the
parameters of two-photon excitation spot geometry. The beam scanner, or beam-
conditioning unit, provides the control of beam alignment, intensity and size
and its main
purpose is to optimize the filling of the objective lens by the scan beam. The
main role of the
beam scanner is to scan the beam over the image area and thereby produce the
sampled
image. The conditioned, scanned beam 656 now travels to microscope 660,
through dichroic
mirror 658 into objective 662 and focused onto the live cell sample in sample
holder 668.
The fluorescent signals are collected again by the objective, passed through
the mirror and
detected by PMT detector 664. The detected digital data is transferred
digitally to computer
system 666 for image analysis, signal processing and subsequent identification
of the
proteins being synthesized. An example of an available commercial system that
embodies
this type of optical design is the Radiance 2100TM MP multiphoton microscopy
system
available from Bio-Rad Laboratories, cell science division, Hercules, CA. In
this instrument,
scanning speeds of 25 to 1800 Lines Per Second (LPS) and frame rates of 45
frames/sec can
be obtained, with a wide choice of lasers, basic microscopes, and detectors,
including true
photon counting of up to 20M photons per second. Various scanning modes (XY,
XYZ,
XYT etc.) are also available.
CA 02517566 2005-05-30
WO 2004/050825 PCT/1L2003/001011
E3 Monitoring of protein synthesis In-vivo
E3A General description of in-vivo PSM.
This illustrative example describes the use of CHO (Chinese hamster ovary)
cells but
5 any other cell line or bacterial cell culture would do equally.
For in-vivo monitoring of protein synthesis, fluorescent tagging according to
R-T, R-
A or R-R strategies is performed. In this illustrative set of examples R-T
tagging strategy is
used and disclosed in detail. For R-T tagging to succeed in-vivo, ribosome
tagging and tRNA
tagging have to be properly handled. There are two preferred choices for tRNA
labeling as
10 FRET acceptor: FITC (excitation and emission peaks are 494 and 520 nm,
respectively) and
TMR (excitation and emission peaks at 550 and 573 nm, respectively). TMR is
attached to
the thiouridine at position 8, while FITC is attached to the X-base at
position 47, as
explained in detail previously. The ribosome is labeled as FRET donor on
ribosomal protein
Li in this illustrative example. The particular choice of labeling fluorophore
for Li depends
15 on the acceptor fluorophore chosen. Four exemplar illustrated
donor/acceptor choices are
shown in the following table:
Table 3
Li Donor fluorophore tRNA acceptor fluorophore
L1-GFP fusion protein TMR
L1-BFP fusion protein FITC
L1-CCPGCC- FlAsH TMR
L1-BCCP-Qdoilm525 TMR
20 It is important to ensure that when a certain tRNA species is labeled,
practically all
tRNAs of this species in an assayed cell are labeled. Each of the two methods
below
achieves this with a different approach. The first uses a unique (suppressor)
tRNA for which
there is no endogenous competition from unlabeled tRNA. In the second approach
the
production of unlabeled tRNA in the cell is actively downregulated.
25 For ribosome tagging, optional but preferred fluorescent labeling of
ribosomal
protein Li as FRET donor is described in detail. Three alternative methods for
in-vivo
CA 02517566 2012-09-07
WO 2004/050825 PCT/1L2003/001011
61
tagging of Li are described. All three require fusing Li to an additional
peptide or protein.
This fusion is preferably performed by insertion of a vector encoding the
fusion protein into
the cells.
In a first exemplary method Li is fused to a naturally fluorescent protein
such as
GFP or BFP, as described in Chalfie, M. & Kain, S. (1998), Preface in: Green
fluorescent
protein: properties, applications, and protocols, eds. Chalfie, M. & Kain, S.
(Wiley-Liss,
New York), pp. vii-ix.
In a second exemplary method Li is fused to a short peptide of 6-20 amino
acids
containing a CCXXCC motif (for example CCPGCC). This motif binds specifically
to a bi-
arsenoxide [coup. Then FlAsH, a dye derivative of fluorescein, is added to the
cells
(Miyawaki et al., Nat Cell Biol. 2003 Sep; Suppl:S1-7, and references
therein). The FlAsH
label is membrane-permeant and non-fluorescent, and acquires fluorescence only
on binding
to the CCXXCC motif.
In a third exemplary method Li is fused to a sequence tag derived from biotin
carboxyl carrier protein (BCCP), thereby becoming biotinylated in-vivo
(Nilsson et al.,
"Affinity Fusion Strategies for Detection, Purification, and Immobilization of
Recombinant
Proteins", Protein expression and purification 11, 1-16 (1997)). This allows
streptavidin
conjugated quantum dots to be attached to the biotinylated protein.
Practically, QdotTm525
Streptavidin Conjugate (Quantum Dot Corporation, Hayward, Ca) is added to the
cells
according to manufacturer protocol. In-vivo labeling with Qdots are described
in Jaiswal JK,
Mattoussi H, Mauro JM, Simon SM, Nat Biotechnol. 2003 Jan;21(1):47-51.
Because of resolution limits of microscopy systems, optionally and preferably
only a
relatively small percentage of ribosomes should be labeled. One exemplary
method that
achieves this goal requires placing the fusion Li protein under the regulation
of a very weak
promoter, to ensure low expression levels. For the other two labeling methods,
other than
GFP-Ll or BFP-Ll fusion, careful control of the externally introduced dye
(FlAsH or Qdots)
amounts is an alternative, optional and simpler mechanism.
tRNAs are preferably labeled in-vitro and then delivered into the cells. tRNAs
can be
inserted into cells by one of at least the following three procedures: 1. by
injection, as
described in Ilegems, E., etal., Nucleic Acids Res. 2002 Dec 1;30(23); 2. by
using
TransMessenger transfection reagent (Qiagen, Hilden, Germany) according to the
CA 02517566 2005-05-30
WO 2004/050825 PCT/1L2003/001011
62
manufacturer protocol. 3. by using TransIT-TKO transfection reagent (Minis
Corporation,
Madison, WI) according to the manufacturer protocol.
It is well known that C. elegans can simply absorb RNAi from solution. This
ability
may imply that tRNA molecules can also be simply absorbed by cells, a strategy
which is
preferably tested individually in each cell-line and labeling strategy.
E3B In-vivo monitoring of protein synthesis using suppressor tRNA and
unnatural
amino acids
General description. In order to verify the proper functioning of the PSM
assay
according to the present invention, suppressor tRNA may optionally be used to
ensure that
native tRNA does not compete with labeled tRNA during the PSM assay. The
suppressor
tRNA is preferably the only tRNA species to be labeled, and therefore the only
one to
generate a PSM FRET signal. The suppressor tRNA introduced into the cells
recognizes a
codon that is usually recognized by the cell as a stop codon. The amber (UAG)
codon is
usually employed for this aim. The suppressor tRNA is preferably not a
substrate for any of
the cellular aminoacyl¨tRNA synthetases.
This suppressor tRNA molecule is preferably subsequently aminoacylated with a
highly fluorescent unnatural amino such as 7-azatryptophan, and a special
template mRNA
is introduced that is engineered to contain amber codons in prespecified
locations. One
optional choice for the template tRNA is based on bacteriophage T4 lyzosyme
protein (T4L),
as explained in Cornish et al., "Site specific incorporation of biophysical
probes into
proteins", Proc. Natl Acad. Sci. USA, Bol. 91 2910-2914, 19. This fluorescent
amino acid is
preferably incorporated in a fluorescent protein wherever an amber codon was
processed
with the suppressor tRNA. Note that in this configuration the charged
suppressor tRNA is
doubly labeled, once as a FRET acceptor and once with the fluorescent amino
acid it is
charged with. In particular, the engineered T4L protein will be indicative of
the functioning
both of the suppressor tRNA and of the PSM assay. In this way it is possible
to obtain
independent verification of the results of the PSM assay. Additionally, the
accuracy of the
PSM method can optionally be correlated with detection of the fluorescent
translation
products. Important parameters such as quantitation accuracy of the PSM assay
can be
measured.
CA 02517566 2005-05-30
WO 2004/050825 PCT/1L2003/001011
63
The suppressor tRNA is preferably constructed on the basis of the E. coil
tRNAPhe , E.
coil tRNA", or E. coil tRNAAsP, as described in the references below. All of
these tRNAs
have a 4-thiouridine in position 8 and so can be labeled with TMR, E.Coli
tRNA' he also has
an X-base in position 47 and can therefore be labeled with FITC. Detailed
labeling protocols
were described previously in the section entitled "Labeling and wet setup for
in-vitro protein
synthesis monitoring".
Preparation of suppressor tRNA - details. A variety of suppressor tRNAs have
been misacylated and tested for their ability to incorporate amino acids into
proteins in
response to an amber nonsense mutation. Chamberlain and coworkers focused
their efforts
on E. coli tRNA' (Bain et al., Biochemistry 1991, 30, 5411-5421). Schultz and
coworkers
determined that suppressor tRNA"" from E. coil and tRNAGin from T. thermophila
showed
the best overall suppression efficiency for amino acid incorporation into
model proteins T4
lysozyme and chlorismate mutase (Cload et al, Chem. & Biol. 1996, 3, 1033-
1038).
In view of the strategies described above, E. coil amber (UAG) suppressor is
optionally and preferably prepared from E. coli tRNAPhe or tRNAAsn according
to the
protocols in the references above. The tRNA amber suppressor has a CUA
anticodon
sequence. Other tRNAs can also serve as a basis for engineering a suppressor
tRNA for the
amber codon for PSM, as long as they contain a 4-thiouridine in position 8 or
an X-base in
position 47, to allow labeling. Other tRNAs that do not have these
modifications may also
optionally be used but an appropriate labeling strategy compliant with amino-
acylation and
translation should be devised.
The stages of the experiment optionally and preferably include: Creation of
the
suppressor tRNAs; Fluorescent labeling of the suppressor tRNAs; Charging the
suppressor
tRNAs with 7-azatryptophan. (cf. Cornish et al., Proc. Nat! Acad. Sci. USA,
Bol. 91 2910-
2914, 19); Insertion of a vector that codes both for the Li fusion protein
(one of 3 choices)
and the template mRNA encoding for the reporter protein (such as the amber-
labeled
bacteriophage T4L); Once the transfected vector undergoes transcription, the
labeled,
charged suppressor tRNAs and any additional dyes (FlAsH or Qdots) are
inserted.
CA 02517566 2005-05-30
WO 2004/050825 PCT/1L2003/001011
64
E3C In-vivo monitoring of native protein synthesis
General description. In this non-limiting, illustrative example natural
protein
synthesis by ribosomes is monitored in-vivo. Labeling of a single tRNA species
(tRNA)he) is
described but multiple labeling is also possible.
Since the cell manufactures its own, unlabeled tRNA, its production is
optionally and
preferably stopped before the labeled tRNA is introduced. This stoppage
ensures that nearly
all tRNAs of the required species are indeed labeled. Thus endogenous
unlabeled tRNAs that
are part of the live cell are optionally and preferably replaced preferably
fully by labeled
tRNAs. Since endogenous tRNAs are necessary for cell viability, the tRNA
species to be
labeled is placed under induction control, so that their production can be
stopped when the
labeled tRNAs are introduced. The turnover rate of tRNAs, whether endogenous
or
externally introduced, is in the order of 1-2 days (Schlegel et al., "The
turnover of tRNAs
microinjected into animal cells", Nucleic Acids Research, Vol 5, Issue 10 3715-
3729), so
that the production of the endogenous tRNAs that have been placed under
control needs to
be stopped a sufficient amount of time before labeled tRNAs are introduced and
the PSM
assay starts operating.
Preparation of cell line
CHO-ind-tRNAPhe cell-line is optionally and preferably established from CHO
cells
in which the endogenous gene coding for tRNAPhe is placed under the control of
inducible
POL III promoter. Such promoters are described in Wolfgang M. et al., (2001)
NAR 29,
1672-1682; Tuschl T. (2002) Nature Biotechnol. 20, 446-448; Van de Wetering,
M., et al,
(2003) EMBO Rep 4,609-15; Hurlstone, A., et al., (2002) EMBO L. 21, 2303-11.
The
replacement of the natural control elements of the required tRNA genes by
inducible control
is performed by gene targeting techniques as described in (Joyner, AL (ed),
"Gene
Targeting: A Practical Approach", Oxford University Press; 2nd edition, 2000).
The stages of the experiment optionally and preferably include: Establishing
the cell-
line CHO-ind-tRNAPhe; Fluorescent labeling of the E.Coli tRNAPhe molecules;
Insertion of a
vector that contains the L1 fusion protein (optionally according to one of
three previously
CA 02517566 2005-05-30
WO 2004/050825 PCT/1L2003/001011
described choices); Down regulation of the POL III promoter driving the
unlabeled tRNAPhe
transcription; and Introduction of Li dyes (if required) and labeled tRNAPhe.
E4 Data interpretation simulation
5 This Example describes a simulation of an illustrative method for signal
processing
according to the present invention. A specific, illustrative algorithm of data
analysis that
permits real-time identification of the protein being synthesized from raw
FRET signals is
described. The data processing proceeds by stages according to the following
diagram
(Figure 14-A). The raw, or double signal 510 is the signal obtained
simultaneously from
10 donor and from acceptor of a single FRET pair, as is customary for FRET
analysis. A typical
graph of the double signal is shown in Figure 14-B, with acceptor signal 520
and donor
signal 521. These graphs were created by a simulation program written in C++
under
Microsoft visual studio development suite. The model assumes that signals are
generated
with parameters as indicated below. Random number generation was used to
create noise
15 according to the prescribed parameters. Donor signal is shown in thin
black line, acceptor
signal in thick grey line. The simulated signal generation model assumes a
sampling rate of
200 samples per second, a synthesis rate of 20 amino acids per second, average
"off" signal
of 1.2/0.1 relative brightness values for donor/acceptor, respectively, and an
average "on"
signal of 0.2/0.9 for donor/acceptor, respectively. The "on" and "off' values
are assumed to
20 have been previously calibrated by experimental measurements. Additional
assumptions that
underlie the simulation experiment model are the following: the FRET signal is
"on" for
50% of the synthesis cycle time of a single amino acid, on average, with an
average
deviation of 10% from this value; the synthesis cycle time changes on average
by 8% from
the average cycle time; the signal noise level is 18% of maximal signal; and
labeling
25 efficiency is 95% (that is, at most 1:20 tRNAs that should have been
labeled turn out to be
unlabeled).
Once the simulated PSM signal is generated, the analysis process can begin its
operation. As shown in Figure 14A, the first stage in the analysis produces
the FRET signal
511 from the double signal 510. This is a binary signal at the original
sampling rate. A
30 sample graph of this signal is shown in graph 530 (Figure 14-C). Only
the "on" periods are
shown. In this example the computation of the FRET signal involves a simple
subtraction of
acceptor signal minus donor signal. If this is positive, an "on" FRET bit is
output, else, an
CA 02517566 2005-05-30
WO 2004/050825 PCT/1L2003/001011
66
"off' bit. Note that the signals are calibrated for their "on" and "off'
values. If the calibration
values are different than the values shown in figure 14B, other decision
schemes such as a
weighted difference of the signals (eacceptor-b*donor, with a and b some fixed
positive
weights) may optionally be required.
The next stage produces the synthesis signal 512, which provides a time
reading for
each "on" period. It is assumed that when a FRET signal is emitted, it takes
place only
during part of the synthesis cycle. Thus, it is easy to separate adjacent FRET
periods. On the
other hand, when the peptide sequence includes a several adjacent non-labeled
sequence
elements, separation of the units is not straightforward and has to be
computed. The
synthesis signal records the time points of the center of each FRET period. To
compute this
synthesis signal 512, the beginning and end points of each FRET period are
recorded first. In
the simulation experiment the initial three periods occurred at times .088-
.1126, .0233-.0258,
.284-.308. The midpoints of these intervals, .1003, .245, .296 are the values
that form the
synthesis signal. All time values are given in seconds.
The next stage produces the label sequence tree 513. Suppose two consecutive
"on"
signals were recorded at times t1 and t2. The average synthesis time is known
to be Ts and
the standard deviation of synthesis cycles has been measured to be a, in
seconds, or Grc=
alTs, in cycles, or intervals. The number Noff of "off' cycles between ti and
t2 can be
computed with an uncertainty that can be evaluated as follows. The average
time required
for N synthesis cycles is TN = N. Ts. The standard deviation of the
accumulated time
required for N cycles is therefore -4\1.- ac, in interval units. The standard
deviation aNc for N
cycles in cycle units is therefore 1N,=4 ae. The distribution of the total
duration of N
cycles can be assumed normal with standard deviation aNc. The conditional
probability that a
sequence of N synthesis cycles will deviate by at least Al intervals from the
expected interval
duration is therefore P(N, AI) = P(x> crNe) and can easily be computed or
found from normal
distribution tables.
For example, for the time difference .245-.1003¨.1447 seconds between first
and
second "on" periods in the simulation experiment, given an average synthesis
cycle time of
1/20=.05 seconds and standard deviation of .27 intervals, the expected number
of cycles is
.1447/.05=2.894. Examination of the probabilities that 2, 3 or 4 cycles would
require .1447
seconds yields the following values:
P(2, .1447): uric = .27. -\P=.38, AI= .1447/.05-2=2.894-2=.894, N(.38, .894) =
.019
CA 02517566 2005-05-30
WO 2004/050825 PCT/1L2003/001011
67
P(3, .1447): aNc = .27. AI= .1447/.05-3=2.894-3= -.106, N(.47, -.106) =
.973
P(4, .1447): aN, = .27. 41=.54, AI= .1447/.05-4=2.894-4= -1.106, N(.54, -
1.106) = .04
Intervals that are shorter than 2 or longer than 4 are discarded since the
probability
for their occurrence is negligible. In order to compute the probability of
each of these
intervals occurring, given the conditional probabilities above, the total
probabilities are
normalized as follows: P
- Tota1=-019+.973+.04=1.036, and the final normalized probabilities
are
P(2)=. 019/1.036¨.018
P(3)=. 973/1.036=.939
P(4)=. 04/1.036¨.043,
with all other probabilities set to zero.
In this way, given the synthesis signal 512, every additional "on" signal
generates
one or more labeled sequences. In the previous example, the label sequences
that were
generated, with their probabilities, are FN (.018), FFN (.939), FFFN(.043),
where "F" stands
for "off' and "N" stands for "on". When the different labeled sequences are
joined together,
a data structure in the form a branched tree with probabilities attached to
the nodes is
obtained. Every newly computed labeled sequence is attached as a suffix to
each one of the
preceding sequences. The probability of the final branch is the product of the
probabilities of
the prefix and the newly added suffix. A branch whose probability falls below
a prescribed
value, such as .001, is discarded. This avoids exponential increase in the
number of
branches. In the simulation experiment, starting from the simulated labeled
peptide
FNFFNNFFFNNNFFFFNNNN, the tree in Figure 14-D is obtained.
Reading each branch from top to bottom and enumerating the resulting sequences
1-
7 from left to right, the following sequences are obtained, as shown in Table
4 below:
Table 4
ID Sequence Probability
1 FNFNNFFFNNNFFFFNNNN 0.011858
2 FNFFNNFFNNNFFFFNNNN 0.02108
3 FNFFNNFFFNNNFFFNNNN 0.050066
4 FNFFNNFFFNNNFFFFNNNN 0.814229
5 FNFFNNFFFNNNFFFFFNNNN 0.035573
6 FNFFNNFFFFNNNFFFFNNNN 0.047431
7 FNFFFNNFFFNNNFFFFNNNN 0.019763
CA 02517566 2005-05-30
WO 2004/050825 PCT/1L2003/001011
68
Note that the sequence with highest probability (sequence 4) is identical to
the
original input sequence. As the process continues, branches can split and re-
split; some
branches are deleted since their probability falls below the acceptable
threshold; and in this
way the measured label sequence tree evolves. At every stage, each candidate
sequence is
=
sent for database interrogation and scoring (see below). Branches that do not
appear in the
database are deleted or otherwise marked for special consideration.
The final stage in the protein identification module is the database
interrogation
stage. For this, the database has to be compiled. Every protein sequence is
simply
transformed to a label sequence by marking each amino acid as "N" of "F"
according to
whether its synthesis will result in a FRET signal or not. Next, all
subsequences of a given
length (say, 100 cycles) that start with an "N" are determined. For an
organism such as E.
Coli that contains under 5000 ORFs with average length of under 1000 bps
yields proteins
with 300 amino acid on average, so that the database for E. Coli will include
less than
5000*(300-100)=1 million entries. This entire set of sequences is now built
into a tree data
structure (cf. Donald E. Knuth, The Art of Computer Programming, Addison-
Wesley). In
this tree, the sequences start from the top (null) node, and split according
to the number of
"F" cycles between every neighboring "N" cycles. In every node, the total
number of
(different) proteins covered by the branches stemming out of the node is
noted. Once this
number becomes lower than a prescribed number (for example 5), the set of
proteins is
retrieved for display or storage, together with the probabilities as discussed
above. This can
be done in real-time, resulting in a dynamic display of proteins as they are
being synthesized.
The database can also take into account labeling efficiency. For example, if a
given
amino acid residue is considered to be labeled with an efficiency of, say,
90%, than every
sequence where this residue appears is used to derive mis-labeled sequences at
a rate of 10%.
All these mislabeled sequences are stored in the database as well. This may
mean that longer
sequences are required to positively identify a protein.
It is possible to further analyze the relationship between the number of
labeled versus
non-labeled units. The R-A labeling scheme is herein analyzed as an example.
The other two
schemes, R-T and R-R labeling can easily be analyzed in a similar way. Suppose
that k of
the 20 amino acids are labeled and 20-k are unlabeled. Assume that a
subsequence of total
length 1 (both labeled and unlabeled) has been read. Assume uniform
distribution of amino
acids. In this case, a = k I 20 of the 1 residues can be expected to be
labeled, so that there
CA 02517566 2005-05-30
WO 2004/050825 PCT/1L2003/001011
69 .
would be p = a/ labeled residues and 1-p unlabeled residues. The number of
possible
( / \
sequences would then be N = =
. This number is maximal when k = 10 (or
p j al j
a =1/ 2). A realistic assumption is that for confident identification of a
protein the random
hit piobability should be better than 1:106, or, in other words,
>106. This is because
al
\ )
there are at most several hundred thousand sequences in the database (see
above). Thus, for
( / \
confident protein identification, the formula
> 106 connects the ratio a of labeled amino
al
i
acids with the length 1 of a polypeptide chain required for confident
identification. The
following table provides example values:
Table 5
Number of Minimal number of Total synthesis time in
labeled residues ( 1 ) required for bacteria (seconds) for
amino acids confident identification confident identification
1 80 4.0
3 42 2.0
5 28 1.4
6 26 1.3
' 10 23 1.06
Thus it is beneficial to partition the amino acids as equally as possible. It
is also
clear that protein identification can be obtained in under 2 seconds in
bacteria (where
synthesis rate is approximately 20 residues a second). Protein synthesis in
eukaryotes is
about an order of magnitude slower.
If codons rather than amino acids are labeled, than with the simplistic
assumption of
uniform codon distribution, the connection between number of labeled codons
and
identification is given in the table below.
CA 02517566 2005-05-30
WO 2004/050825 PCT/1L2003/001011
Table 6
Number of Minimal number of Total synthesis time in
labeled residues ( 1 ) required for bacteria (seconds) for
codons confident identification confident
identification
1 200 10.0
3 90 4.5
5 65 3.25
6 60 3.0
10 40 2.0
If probes with several different colors are used, rather than a single-colored
probe,
5 more information becomes available for identification of the synthesized
protein. For
example, assume that 10 amino acids are labeled with a single color probe, and
the
remaining 10 are unlabeled. For a peptide with N amino acids, there are
( N\
= N1/10!.(N ¨10)! possible PSM signal sequences out of the total of 201 amino
acid
sequences. However, if the 10 labeled amino acids are labeled with 2 types of
fluorescent
10 probes, say 5 of each, than in this case the number of possible PSM
signal sequences
( N\ N ¨ 5\ N! (N ¨ 5)! N!
becomes . The ratio of
information
5 j 5 5!.(N ¨ 5)! 5!.(N¨l0)! 5!.5!.(N-10)!
r10'
content is therefore = 252 fold. This means that multi-labeling can
require
,5!=5!,
considerably less time to identify the protein being synthesized, with a
higher confidence.
E5 APPLICATIONS OF THE PRESENT INVENTION
E5A Applications for high throughput screening assays
This example describes how the methods disclosed herein can optionally be used
for
the screening of a large library of chemical compounds to determine their
efficacy or their
potential for use as drugs. High throughput screening is a method developed
since the late
CA 02517566 2005-05-30
WO 2004/050825 PCT/1L2003/001011
71
1980s. Today systems are available that can screen up to a million compounds
in one day.
High throughput screening requires an assay to be devised that is compatible
with the
screening instrument, an assay that enables quick rejection of most of the
compounds as
irrelevant, and approves only a small fraction for continued research. The
present invention
is suitable for a very thorough and informative assay, as explained above, in
the sense that it
provides information not only concerning binding of the screened compound to a
single
protein target, one that has been suspected to be related to the disease for
which a drug is
sought, but provides, for every compound tested, information about the full
spectrum of
proteins induced by the compound with their expression timing. Thus,
functional activity of
a compound on a specific cell type can be usefully studied by subjecting it to
protein
synthesis monitoring assay as disclosed herein only once for a given organism
or cell-line.
The optional, illustrative strategy suitable for screening of a chemical
compound library with
the system and method disclosed herein is depicted in Figure 15. First, a cell
line with tagged
ribosomes is cultured and placed in a multiwell plate 450. This can have a 96
well plate
format, a 384 well plate format or any other format compatible with automated
screening.
The wells 452 in the plate need to be optically amenable for microscopy as
shown in Figures
7,1011,12 and 13. A robot 454 administers one compound out of the library
being screened
into each well and protein synthesis analysis is performed by a protein
synthesis monitoring
system 456. A suitable sampling regime should be adopted. As an illustrative
example a
protein synthesis monitoring measurement for 30 seconds every 10 minutes for a
total of one
hour. Other regimes may optionally be also used. The list of proteins
synthesized by the cell
together with the synthesis timing during the sampling period for the
particular well are
stored in screening database 458. A sampling regime as described allows
screening of 20
compounds per hour per protein synthesis measurement unit. In this way,
screening of a
library with one million compounds can take one year with five protein
synthesis monitoring
units or one month with 50. Obviously many alternative regimes can also be
used.
The data obtained for each compound through this PSM screening provides a list
of
the proteins induced by the compounds, together with the synthesis timing.
Thus, the
changes of the state of the cellular machine, caused by the administration of
the compound,
can be discerned. As an illustrative example, if the PSM assay of one compound
shows a
significant increase in the production of DNA repair enzymes, this may mean
that the
administered compound may cause DNA damage. This obviously means that the
compound
CA 02517566 2005-05-30
WO 2004/050825 PCT/1L2003/001011
72
can never become a drug candidate. This type of information today is available
only at
toxicity studies stage in the drug development pipeline. Obtaining this kind
of information at
a very early stage of the process can save years of work and very large
expenditures.
Bioinformatics analysis of the PSM data collected for each compound can
further
yield information concerning the main and side effects of a compound, the
states of the
cellular machinery that it creates, and the protein pathways that it triggers.
Though seemingly slow compared to other screening methods, the method
disclosed
here has numerous attractive advantages. First, the library needs to be
screened only once.
Thereafter, focused screening targeted at a specific receptor or disease model
can be done in-
si/ico, with the computer alone, analyzing the protein synthesis data
collected. Second, only
a tiny amount of compound is required since the library is screened only once.
Most
importantly, the data collected is orders of magnitude more informative and
relevant to
further research than single receptor binding assays or even cell-based
assays. Thus, choice
of drug leads and further development of drugs from these leads becomes much
more of a
research program and less of a guesswork. In this way, over a period of
several months, a
hitherto unobtainable amount of critical infonnation is compiled about each of
the
compounds in the library. This is in contrast with the information obtained
after a full run of
customary screening. For example, a customary receptor-binding assay produces
only one
bit of information for each compound - "binds" or "doesn't bind". In fact,
screening with the
present invention is not so much a screening system (that rejects most of the
candidates), as
much as a system for assigning function for entire chemical libraries.
In this embodiment, the cells being monitored can be human cells, bacterial
cultures,
yeast or any other appropriate collection of cells or cell line.
E5B Applications for drug development and manufacturing
Another important application of protein synthesis monitoring is as a tool for
process
optimization, process control and quality control of protein production,
either in bio-reactors
using bacteria or cell culture, or else in cell free translation systems. In
these situations, the
present invention can provide indispensable information about the precise
amounts of the
target protein being produced, as well as on the comprehensive structure of
the proteome
backdrop to this manufacturing, ensuring that the desired protein is produced
in precisely the
required environment and in the right amounts. This level of control,
unavailable today, can
CA 02517566 2005-05-30
WO 2004/050825 PCT/1L2003/001011
73
create a revolution in the way proteins and protein drugs are produced and
certified. This can
lead to new protein production methods that are easier to control than current
ones.
In another optional but preferred embodiment, the present invention is
optionally and
preferably used to monitor proteins being produced by bacteria, yeast, cell
lines, cell-free
translation system protein production systems. or any other protein production
processes.
Numerous biopharmaceuticals are thus produced, including drugs and medical
agents such as
insulin, human growth hormone, erythropoietin, therapeutic antibodies, and
other diagnostics
and medical aids. The system disclosed herein can optionally be integrated
into the
production system, enabling production yields and rates to be measured,
controlled, and
optimized in real time. Moreover, PSM can help monitor precisely the cellular
state and
environment during the production of the target protein. This monitoring can
ensure a
hitherto unavailable level of control for protein production, and can also
lead to new protein
production methods that are easier to control than the customary methods. This
new
monitoring capability can make a large impact on the quality, quantity and
cost of protein
____________________________________________________ production, as well as
allowing tighter regulatory control of protein pi oda cti on.
E5C Applications for basic biological research
This example describes how the methods disclosed herein can be used for basic
biological research. One important field of research is the understanding of
protein and
metabolic pathways in the cell. Numerous methods have been suggested and
several
technologies have been developed to try and decipher the complex net of
protein interactions
and pathways of bacteria and cells. These include protein-protein interaction
mapping from
assays, from computerized analysis of research papers, and from clever setups
as described
in (Shen-Orr, S.S., Milo, R., Mangan, S., and Alon, U., Network motifs' in the
transcriptional
regulation network of Escherichia coli., Nat Genet 2002, 31(1): 64-8). The
present invention
offers important advantages for pathway elucidation. Since the response of the
cell to an
external stimulus is instantly revealed by the monitoring of protein
synthesis, the following
methodology is suitable for discovering the pathways. As described in the
screening
application above and in Figure 15, cells are cultured and placed in a
suitable screening
setup. The cells are then subjected to various external stimuli, such as
temperature changes,
chemical deprivation (such as phosphate starvation), administration of toxic
agents, attack by
phages or viruses and any other stimulus that is thought to be relevant to the
pathway being
CA 02517566 2014-05-26
W02004/050825 74 PCT/1L2003/001011
investigated. The cells or bacteria are studied using the present invention
for an appropriate
duration before, during and after the stimulus, and the response of the
protein synthesis
apparatus of the cell is tabled. A computerized analysis module analyzes the
different
responses, including the timing order of protein synthesis, which proteins
tend to co-
translate, what are their amounts, and what causality relationships occur
between them. By
virtue of having numerous different stimuli generating numerous different
responses,
pathway elements can be determined as explained, for example, in Rosen et al,
FEMS
Microbiol. Ecol. 2001, and Hecker et al, Int. J. Med. Microbiol 2000. The
dynamic information
of cellular response to external stimulus is an extremely important probe of
cellular
behavior, which previously could not be measured.
In another optional but preferred embodiment, protein synthesis monitoring is
used to
identify protein pathways and protein-protein interaction maps. In this
method, different
chemical and environmental conditions are applied to cells or to cell lines,
and protein
synthesis is monitored for each one of these conditions. The protein synthesis
patterns are
indicative of the cellular pathways, and the protein synthesis data for the
entire experiment
is used to map the cells protein interaction, thereby enabling understanding
of the intricate
connections and functions of proteins in the cells.
E5D Other applications
In view of the large number of possible applications and embodiments of the
present
disclosure it should be recognized that the illustrated embodiments are only
particular
examples and should not be taken as a limitation on the scope of the
disclosure. Some of the
possible additional applications which are clearly enabled by the present
invention are
clinical applications, diagnostic applications, production of food, cosmetics,
and other
bioproducts, military applications concerning biological warfare, and many
more.
CA 02517566 2012-09-07
WO 2004/050825 PCT/IL2003/001011
In addition, citation or
identification of any reference in this application shall not be constried as
an admission that
5 such reference is available as prior art to the present invention.
'N===