Note: Descriptions are shown in the official language in which they were submitted.
CA 02519368 2005-09-15
WO 2004/087965 PCT/US2004/009059
STATISTICAL ANALYSIS OF REGULATORY FACTOR BINDING SITES OF
DIFFERENTIALLY EXPRESSED GENES
Background of the Invention
Field of the Invention
The present invention concerns the statistical analysis of regulatory factor
binding sites of
differentially expressed genes. More particularly, the invention concerns
methods for identifying and
characterizing regulatory factor, e.g. transcription factor binding sites in
differentially expressed genes
in order to develop therapeutic strategies for the treatment of diseases which
are accompanied by
differential gene expression.
Description of the Related Art
One of the main approaches to identify novel therapeutic targets is the study
of differential
gene expression, typically comparing normal and diseased biological samples,
or biological samples
representative of different stages of a particular disease or pathologic
condition. In general, methods
used to study differential gene expression can be based on hybridization
analysis and/or sequencing of
polynucleotides. The most commonly used methods known in the art for the
quantification of
differential gene expression in a sample include northern blotting and in situ
hybridization (Parker fir.
Barnes, Methods i~a Molecular Biology 106:247-283 (1999)); polymerase chain
reaction (PCR) (Weis
et cal., T"a~eaads in Caeaaetics 8:263-264 (1992)), such as quantitative real-
time PCR, and microanay
analysis. Alternatively, antibodies may be employed that can recognize
specific duplexes, including
DNA duplexes, RNA duplexes, and DNA-RNA hybrid duplexes or DNA-protein
duplexes.
Representative methods for sequencing-based gene expression analysis include
Serial Analysis of
Gene Expression (SAGE), and gene expression analysis by massively parallel
signature sequencing
(MPSS).
Differential gene expression studies have been conducted on a variety of human
tissues and
biological samples representing a verity of biological processes, such as
various cancers, neuronal
diseases, developmental disorders, aging processes, infectious diseases, and
the like.
Summary of the Invention
The present invention is based on the recognition that the large number of
differentially
expressed genes identiEed in a biological sample, which may be, but need not
be, representative of
CA 02519368 2005-09-15
WO 2004/087965 PCT/US2004/009059
various diseases, disease states and other abnormalities, is the result of
changes in the transcription
functioning of a handful of regulatory factors, such as transcription factors
(TF).
In one aspect, the present invention concerns a method for statistical
analysis of differentially
expressed genes, comprising:
(a) obtaining a set of differentially expressed genes ;
(b) screening genomic sequences including the regulatory regions of the
differentially expressed genes for the presence of regulatory factor binding
sites; and
(c) identifying at least one regulatory factor binding site enriched within
the set
of differentially expressed genes relative to a genome-wide or tissue-wide
background.
The set of differentially expressed genes can be obtained from results of
differential gene or
protein expression studies, and thus can, for example, be generated by
microarray, RT-PCR, or
proteomics approaches.
In step (c) enrichment may, for example, be determined by comparing the
frequencies or
probabilities of the occurrence of the regulatory binding site or binding
sites identified in step (c)
within the gene set.
In a particular embodiment, the set of differentially expressed genes may be
part of a gene
expression profile characteristic of a disease, disorder, or biological
process. X111 diseases, disorders
and biological processes associated with gene transcription are included, such
as, without limitation,
tumor, ontological diseases, neurological diseases, cardiovascular diseases,
renal diseases, infectious
diseases, digestive diseases, metabolic diseases, inflammatory diseases,
autoimmune diseases,
dermatological diseases, and diseases associated with trauma or abnormal
skeletal development.
l~Ietabolic diseases specifically include, without limitation, diabetes, and
diseases of lipid,
carbohydrate and calcium metabolism. I~ermatological diseases specifically
include, without
limitation, diseases requiring wound healing.
In a further specific embodiment, the disease is cancer, which can, for
example, be breast
cancer, renal cancer, leukemia, colon cancer, lung cancer, prostate cancer,
hepatocellular cancer,
gastric cancer, pancreatic cancer, cervical cancer, ovarian cancer, liver
cancer, bladder cancer, cancer
of the urinary tract, thyroid cancer, renal cancer, carcinoma, melanoma, and
brain cancer.
In another embodiment, the disorder is a developmental disorder.
In yet another embodiment, the biological process represented by the
differentially expressed
gene set is associated with aging.
In a further embodiment, the gene set consists of genes that show at least
about two-fold , or
at least about four-fold, or at least about ten-fold differential expression
relative to control.
2
CA 02519368 2005-09-15
WO 2004/087965 PCT/US2004/009059
In a still further embodiment, the regulatory factor binding site is
identified within a 5'
upstream core promoter region, a 5' upstream enhancer region, an intron
region, and/or a 3' regulatory
region.
In another embodiment, the regulatory factor binding site is a transcription
factor binding site.
Without limitation, and merely by way of illustration, the transcription
factor can be selected from the
group consisting of c-Fos, c-Jun, AP-1, Elk, ATF, c-Ets-1, c-Rel, CRF, CTF,
GATA-1, POUlFl, NF-
~eB, POU2F1, POU2F2, p53, Pax-3, Spl, TCF, TAR, TFEB, TCF-1, TFIIF, E2F-l, E2F-
2, E2F-3,
E2F-4, HIF-1, HIF-la, HOXAl, HOXAS, Sp3, Sp4, TCF-4, APC, and STATSA.
In a specific embodiment, the transcription factor is E2F-1, E2F-2, E?F-3, NF-
~cB, Elk, AP-1,
c-Fos, or c-Jun.
Typically, a large number of differentially expressed genes is analyzed. Thus,
the analysis
may extend to at least about 100 differentially expressed genes, or at least
about 500 differentially
expressed genes.
In a further aspect, the invention concerns method for designing a treatment
strategy based
upon the identification of the enriched regulatory factor binding sites) by
the foregoing method.
In a specific embodiment, the enriched regulatory factor binding site is a
transcription factor
binding site binding to at least one transcription factor.
In a further embodiment, a consensus binding site is identified based on the
enriched
transcription factor binding site.
The treatment strategy may, for example, rely on the design of a double-
stranded
oligonucleotide decoy, which competes with said enriched binding site for
binding to the
corresponding transcription factor, or on an anti-sense oligonucleotide
designed to bind to the n~TA
of enriched transcription factor.
In a different aspect, the invention concerns a method of designing a
consensus regulatory
factor binding site, comprising identifying a regulatory factor binding site
enriched within a set of
differentially expressed genes, relative to a genome-wide or tissue-wide
control, and designing a
consensus regulatory factor binding site consisting essentially of nucleotides
shared by the regulatory
factor binding sites enriched within the set of differentially expressed
genes.
In yet another aspect, the invention concerns a method of analyzing the
enrichment of a
regulatory factor binding site in a biological sample comprising a set of
differentially expressed genes,
comprising comparing the frequency or probability of the occurrence of the
regulatory binding site
within the gene set with the frequency or probability of its occurrence in a
reference sample. The
statistical analysis is preferably performed by using a hypergeometric
distribution model.
3
CA 02519368 2005-09-15
WO 2004/087965 PCT/US2004/009059
Brief Description of Drawings
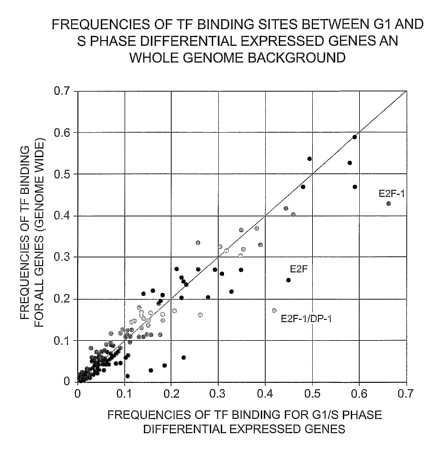
Figure 1 shows the frequencies of TF binding sites between G1 and S phase
differentially
expressed genes and whole genome background.
Figure 2 is a graphical representation of the number of microarray-related
publications
between 1995 and 2002.
Detailed Description of the Preferred Embodiment
A. Definitions
Unless defined otherwise, technical and scientific terms used herein have the
same meaning as
commonly understood by one of ordinary skill in the art to which this
invention belongs. Singleton et
al., Dictionary of Microbiology and Molecular Biology 2nd ed., J. Wiley & Sons
(New York, NY
1994), and March, Advanced Organic Chemistry Reactions, Mechanisms and
Structure 4th ed., John
Wiley fir, Sons (New York, NY 1992), provide one skilled in the art with a
general guide to many of
the terms used in the present application.
For purposes of the present invention, the following terms are defined below.
The term "regulatory factor," is used in the broadest sense, and includes any
factor that is
capable of affecting the mRNA transcription process of genes. Specifically
included within this term
are transcription factors
The terms "gene regulatory sequence," "cis-regulatory element," "cis-acting
regulat~ry
element," "cis-regulatory sequence," and "cis-acting regulatory sequence" are
used interchangeably,
and refer to any regulatory sequence that controls gene expression, including,
without limitation, 5'
regulat~ry regions and 3'-regulat~ry regions, such as, promoters, enhancers,
silencers, transcripti~n
terminati~n signals, and splicing signals; intron regi~ns, and intergenic
regions, and sequences that
regulate translation. Specifically included are DNA recognition sequences with
which transcription
factors associate (also referred to as transcription factor binding sites).
The term "transcription factor binding site" refers t~ short consensus genomic
sequences that
locate immediately before the transcription start sites (TSS) of genes. A
transcription regulatory
region can contain several binding sites, and can therefore be bound by
several transcription factors.
"Trans-factors" are proteins that bind to cis-regulatory sequences.
"Transcription factors" are proteins that bind to DNA near the transcription
initiation site of a
gene, and either assist or inhibit RNA polymerase in initiation and
maintenance of transcription.
"DNA binding domain" is a region within a transcription factor that recognizes
specific bases
in a target gene near the transcription initiation site.
The "transcription starting site (TSS)" is the position where a gene's mRNA
starts to be
transcribed from DNA by RNA polymerase II
4
CA 02519368 2005-09-15
WO 2004/087965 PCT/US2004/009059
The term "transcription factor decoy" or "decoy" is used herein to refer to
short double-
stranded oligonucleotides that specifically bind target transcription factors,
thereby preventing the
transcription factors from initiating the transcription of their target genes.
The term "microarray" , refers to an ordered arrangement of hybridizable array
elements,
preferably polynucleotide probes, on a substrate.
The term "polynucleotide," when used in singular or plural, generally refers
to any
polyribonucleotide or polydeoxribonucleotide, which may be unmodified RNA or
DNA or modified
RNA or DNA. Thus, for instance, polynucleotides as defined herein include,
without limitation,
single- and double-stranded DNA, DNA including single- and double-stranded
regions, single- and
double-stranded RNA, and RNA including single- and double-stranded regions,
hybrid molecules
comprising DNA and RNA that may be single-stranded or, more typically, double-
stranded or include
single- and double-stranded regions. In addition, the term "polynucleotide" as
used herein refers to
triple-stranded regions comprising RNA or DNA or both RNA and DNA. The strands
in such regions
may be from the same molecule or from different molecules. The regions may
include all of one or
more of the molecules, but more typically involve only a region of some of the
molecules. One of the
molecules of a triple-helical region often is an oligonucleotide. The term
"polynucleotide"
specifically includes cDNAs. The term includes DNAs (including cDNAs) and RNAs
that contain
one or more modifted bases. Thus, DNAs or RNAs with backbones modified for
stability or for other
reasons are "polynucleotides" as that term is intended herein. l~Ioreover,
DNAs or RNAs comprising
unusual bases, such as inosine, or modified bases, such as tritiated bases,
are included within the terns
"polynucleotides" as defined herein. In general, the term "polynucleotide"
embraces all chemically,
enzymatically and/or metabolically modified forms of unmodified
polynucleotides, as well as the
chemical forms of DNA and RNA characteristic of viruses and cells, including
simple and complex
cells.
The term "oligonucleotide" refers to a relatively short polynucleotide,
including, without
limitation, single-stranded deoxyribonucleotides, single- or double-stranded
ribonucleotides,
RNA:DNA hybrids and double-stranded DNAs. Oligonucleotides, such as single-
stranded DNA
probe oligonucleotides, are often synthesized by chemical methods, for example
using automated
oligonucleotide synthesizers that are commercially available. However,
oligonucleotides can be
made by a variety of other methods, including in vitro recombinant DNA-
mediated techniques and
by expression of DNAs in cells and organisms.
The terms "differentially expressed gene," "differential gene expression" and
their synonyms,
which are used interchangeably, refer to a gene whose expression is activated
to a higher or lower
level in a sample obtained from a subject suffering from a disease, relative
to its expression in a
normal or control (reference) sample. The terms also include genes whose
expression is activated to a
CA 02519368 2005-09-15
WO 2004/087965 PCT/US2004/009059
higher or lower level at different stages of the same disease. A
differentially expressed gene may be
either activated or inhibited at the nucleic acid level or protein level, or
may be subject to alternative
splicing to result in a different polypeptide product. Such differences may,
for example, be evidenced
by a change in mRNA levels, surface expression, secretion or other
partitioning of a polypeptide.
Differential gene expression may include a comparison of expression between
two or more genes or
their gene products, or a comparison of the ratios of the expression between
two or more genes or their
gene products, or even a comparison of two differently processed products of
the same gene, which
differ between normal subjects and subjects suffering from a disease, or
between various stages of the
same disease. Differential expression includes both quantitative, as well as
qualitative, differences in
the temporal or cellular expression pattern in a gene or its expression
products among, for example,
normal and diseased cells, or among cells which have undergone different
disease events or disease
stages. For the purpose of this invention, "differential gene expression" is
considered to be
"significant" when there is at least an about two-fold, preferably at least
about four-fold, more
preferably at least about six-fold, most preferably at least about ten-fold
difference between the
expression of a given gene in normal and diseased subjects, or in various
stages of disease
development in a diseased subject.
A "set" of differentially expressed genes includes sufficient number of genes
for statistical
analysis. In general, the set will include at least about 20, or at least
about 50, or at least about 100, or
at least about 200, or at least about 500, or at least about 1000 genes.
The term "treatment" refers to both therapeutic treatment and prophylactic or
preventative
measures, wherein the object is to prevent or slow down (lessen) the targeted
pathologic condition or
disorder. Those in need of treatment include those already with the disorder
as well as those prone to
have the disorder or those in whom the disorder is to be prevented. In tumor
(e.,~., cancer) treatment, a
therapeutic agent may directly decrease the pathology of tumor cells, or
render the tumor cells more
susceptible to treatment by other therapeutic agents, e.g.., radiation and/or
chemotherapy.
The term "tumor," as used herein, refers to all neoplastic cell growth and
proliferation,
whether malignant or benign, and all pre-cancerous and cancerous cells and
tissues.
The terms "cancer" and "cancerous" refer to or describe the physiological
condition in
mammals that is typically characterized by unregulated cell growth. Examples
of cancer include but
are not limited to, breast cancer, colon cancer, lung cancer, prostate cancer,
hepatocellular cancer,
gastric cancer, pancreatic cancer, cervical cancer, ovarian cancer, liver
cancer, bladder cancer, cancer
of the urinary tract, thyroid cancer, renal cancer, carcinoma, melanoma, head
and neck cancer, and
brain cancer.
The "pathology" of cancer includes all phenomena that compromise the well-
being of the
patient. This includes, without limitation, abnormal or uncontrollable cell
growth, metastasis,
6
CA 02519368 2005-09-15
WO 2004/087965 PCT/US2004/009059
interference with the normal functioning of neighboring cells, release of
cytokines or other secretory
products at abnormal levels, suppression or aggravation of inflammatory or
immunological response,
neoplasia, premalignancy, malignancy, invasion of surrounding or distant
tissues or organs, such as
lymph nodes, etc.
B. Detailed Descri tion
The practice of the present invention will employ, unless otherwise indicated,
conventional
techniques of molecular biology (including recombinant techniques),
microbiology, cell biology, and
biochemistry, which are within the skill of the art. Such techniques are
explained fully in the
literature, such as, "Molecular Cloning: A Laboratory Manual", 2"d edition
(Sambrook et al., 1989);
"Oligonucleotide Synthesis" (M.J. Gait, ed., 1984); "Animal Cell Culture"
(R.I. Freshney, ed., 1987);
"Methods in Enzymology" (Academic Press, Inc.); "Handbook of Experimental
Immunology", 4th
edition (D.M. Weir ~ C.C. Blackwell, eds., Blackwell Science Inc., 1987);
"Gene Transfer Vectors
for Mammalian Cells" (J.M. Miller & M.P. Calos, eds., 1987); "Current
Protocols in Molecular
Biology" (F.M. Ausubel et al., eds., 1987); and "PCR: The Polymerase Chain
Reaction", (lVlullis et
al., eds., 1994).
The present invention is based on the systematic comparison of the regulatory
regions of
genes identified as being differentially expressed in a particular disease,
disease state, or abnormality.
In particular, the present invention is based on the recognition that a common
link among the
numerous differentially expressed genes is change in the transcription
processes of a handful of
regulatory, e.g. transcription, factors.
As noted before, researchers have a variety of techniques at their disposal to
study differential
gene expression. Although the most frequently used approaches are microarray
and RT-PCR, other
techniques, such as Northern blotting, RNase protection assays, differential
plaque hybridization,
subtractive hybridization, serial analysis of gene expression (SAGE;
Vel.culescu et al., Science
270:484-487 (1995); and Velculescu et al., Cell 88:243-51 (1997)), rapid
analysis of gene expression
(RAGE; Wang et al., Nucleic Acids Reseaf~cla, 27:4609-18, (1999)), and
massively parallel signature
sequencing (MPSS; Brenner et al., Nature Bioteclan~logy 18:630-634 (2000)),
are equally suitable for
the study of differential gene expression. More and more studies have been
conducted about the
differential gene expression. Figure 2 gives an outline about the publications
of microarray technology
based all biomedical researches or cancer specific researches.
In the microarray method, polynucleotide sequences of interest (including
cDNAs and
oligonucleotides) are plated, or arrayed, on a microchip substrate. The
arrayed sequences are then
hybridized with specific DNA probes from cells or tissues of interest. In a
specific embodiment of the
microarray technique, PCR amplified inserts of cDNA clones are applied to a
substrate in a dense
array, typically including at least about 10,000 nucleotide sequences. The
immobilized microarrayed
7
CA 02519368 2005-09-15
WO 2004/087965 PCT/US2004/009059
genes are suitable for hybridization under stringent conditions. Fluorescently
labeled cDNA probes
applied to the chip hybridize with specificity to each spot of DNA on the
array. After stringent
washing to remove non-specifically bound probes, the chip is scanned by
confocal laser microscopy or
by another detection method, such as a CCD camera. Quantitation of
hybridization of each arrayed
element allows for assessment of corresponding mRNA abundance. With dual color
fluorescence,
separately labeled cDNA probes generated from two sources of RNA are
hybridized pairwise to the
array. The relative abundance of the transcripts from the two sources
corresponding to each specified
gene is thus determined simultaneously, thereby providing differential gene
expression data.
Microarray analysis can be performed by commercially available equipment,
following manufacturer's
protocols, such as by using the Affymetrix GenChip technology, or Agilent's
microarray technology.
RT-PCR can also be used to compare mRNA levels in different sample
populations, such as
in normal and diseased (e.g. tumor) tissues to characterize patterns of gene
expression, to discriminate
between closely related mRNAs, and to analyze RNA structure.
The first step is the isolation of mRNA from a target sample. As RNA cannot
serve as a
template for PCR, the first step in gene expression profiling by RT-PCR is the
reverse transcription of
the RNA template into cDNA, followed by its exponential amplification in a PCR
reaction. The two
most commonly used reverse transcriptases are avilo myeloblastosis virus
reverse transcriptase
(AMA-RT) and Moloney murine leukemia virus reverse transcriptase (MMLV-RT).
The reverse
transcription step is typically primed using specific primers, random
hexamers, or oligo-dT primers,
depending on the circumstances and the goal of expression profiling. For
example, extracted RNA
can be reverse-transcribed using a GeneAmp RNA PCR kit (Perkin Elmer, CA,
USA), following the
manufacturer's instructions. The derived cDNA can then be used as a template
in the subsequent PCR
reaction.
A more recent variation of the RT-PCR technique is the real time quantitative
PCR, which
measures PCR product accumulation through a dual-labeled fluorigenic probe
(i.e., TaqMan~ probe).
Real time PCR is compatible both with quantitative competitive PCR, where
internal competitor for
each target sequence is used for normalization, and with quantitative
comparative PCR using a
normalization gene contained within the sample, or a housekeeping gene for RT-
PCR. For further
details see, e.g. Held et al., Genofne Reseas~cla 6:986-994 (1996).
Differential gene expression can also be studied at the protein level, using
proteomics
techniques. The proteome is the totality of the proteins present in a sample
(e.g. tissue, organism, or
cell culture) at a certain point of time. Proteomics includes, among other
things, study of the global
changes of protein expression in a sample (also referred to as "expression
proteomics"). Proteomics
typically includes the following steps: (1) separation of individual proteins
in a sample by 2-D gel
electrophoresis (2-D PAGE); (2) identification of the individual proteins
recovered from the gel, e.g.
8
CA 02519368 2005-09-15
WO 2004/087965 PCT/US2004/009059
mass spectrometry and/or N-terminal sequencing, and (3) analysis of the data
using bioinformatics.
Proteomics methods are valuable supplements to other methods of gene
expression profiling, and can
be used, alone or in combination with other methods, to study differential
gene expression. For
further details see, e.g. Proteomics in Practice: A Laboratory Manual of
Proteome Analysis, R.
Westermeier et al., eds., John Wiley & Sons, 2002.
Typically, gene expression studies identify hundreds to a few thousands of
differentially
expressed genes in the test samples, relative to normal samples. For example,
studies in normal
biological processes, such 'as HeLa cell cycles, and abnormal biological
phenotype, such as rotavirus
infected tissue, have shown that at least about 500 genes exhibit significant
changes relative to their
normal counterparts. Most of the gene expression data have been deposited into
public and
commercial databases, such as Stanford Micoarray Database (SMD), Yale
Microarray Database,
ArrayExpress at the European Bioinformatics Institute IEBI). These, and other
publicly available gene
expression databases are listed in Table 1 below.
Table 1
Name of database Descri tion
ArrayExpress A repository for microarray based
gene
expression data maintained by
European
Bioinformatics Institute.
Chi DB A searchable database of gene
expression.
ExpressDB A relational database containing
yeast and E. coli
RNA expression data.
Gene Expression Atlas A database for gene expression
profile from 91
normal human and mouse samples
across a
diverse array of tissues, organs,
and cell lines.
Gene Expression Database (GDS) A database of Mouse Genome Inforniatics
at the Jackson laboratory.
Gene Expression ~mnibus A database in NCBI for supporting
the
public use and disseminating
of gene
expression data.
GeneX National Center for Genome Resource's
imitative to provide an Internet-available
re ository of ene ex ression
data.
Human Gene Expression Index (HUGEAims to provide a comprehensive
Index) database
to understand the expression
of human
genes in normal human tissues.
M-CHIPS (Mufti-Conditional HybridizationA data warehousing concept and
focuses on
Intensity Processing System) providing a structure suitable
for statistical
analysis of a microarray database's
entire
components including the experiment
annotations.
READ (RII~EN cDNA Expression A database maintained by RIKEN
Array (The institute
Database) of Physical and Chemical Research),
Japan.
RNA Abundance Database (RAD) RNA Abundance Database (RAD)
' is a public
gene expression database designed
to hold data
from array-based and non-array-based
(SAGE)
9
CA 02519368 2005-09-15
WO 2004/087965 PCT/US2004/009059
experiments. The ultimate goal
is to allow
comparative analysis of experiments
performed
by different laboratories using
different platforms
and investigating different biological
systems.
Saccharomyces Genome Database A gene expression database of
Saccharomyces
(SGD):Expression Connection genome at Stanford University;
provides
simultaneous search of the results
of several
microarray studies for gene expression
data for a
given gene or ORF.
Stanford Microarray Database Stores raw and normalized data
(SMD) from microarray
experiments, as well as their
corresponding
image files. In addition, SMD
provides
interfaces for data retrieval,
analysis and
visualization. Data is released
to the public at the
researcher's discretion or upon
publication.
Yale Microarray Database
Yeast Microarray Global Viewer A database for yeast gene expression
data
maintained by Laboratoire de genetique
moleculaire, Ecole Normale Superieure.
3D-Gene Expression Database Preliminary structure for a database
of 3D-
visualization of developmental
ene expression.
BODYMAP A databank of gene expression
information of
human and mouse genes, created
by random
sequencing of clones in 3'-directed
cDNA
libraries.
Gene Resource Locator The goal is to map millions of
ESTs to the human
genome for the study of the axon-intron
structures of genes, the alternative
splicing of
pre-mRNAs, the promoter regions
of full-length-
enriched cDNA sequences, and the
gene-
expression patterns associated
with ESTs.
RNA Abundance Database (RAD) A public gene expression database
designed to
hold data from array-based and
non-array-based
(SAGE) experiments. The ultimate
goal is to
allow comparative analysis of
experiments
performed by different laboratories
using
different platfornzs and investigating
different
biological systems.
TissueInfo An online database which determines
the tissue
expression profile of a sequence
by comparing
the given sequence against the
EST database.
Each EST comes from a library
derived from a
s ecific tissue e.
Despite extensive research in this field and the large volume of accumulated
data, in view of
the complexity of gene expression, differential gene expression data are
difficult to interpret.
It has been well accepted that it is very unlikely that each of the numerous
differentially
expressed genes has mutations or some other defects. On the contrary, it is
possible that the large
number of differentially expressed genes is the result of changes in a few key
phenomena or
CA 02519368 2005-09-15
WO 2004/087965 PCT/US2004/009059
mechanisms, which can affect simultaneously the expression levels of many
genes. The present
invention is based on the recognition that the large number of differentially
expressed genes in various
diseases, disease states or other abnormalities results from changes in a few
regulatory factors, such as
transcription factors (TF).
Transcription factors (TFs) are a class of proteins that control and
initialize the process of
transcribing genetic information coded by DNA into mRNA. All currently known
TFs are classified
into five different subfamilies, named after their functional domains, namely
the Basic Domains, Zinc-
coordinating DNA binding domain, Helix-turn-helix domains, beta-Scaffold
Factors with Minor
Groove Contacts, and Other Transcription Factors. Usually, at least a few
transcription factors are
required to form a transcriptional complex that binds to the regulatory
regions of genes and, as a
result, controls and initializes the mRNA transcription machinery. These
binding processes are
mediated by the DNA binding domains of TF proteins. It is known that only some
of the transcription
factors are capable of binding directly to DNA, while others are required to
form the functional
transcription machinery, without the requirement of direct binding to the
regulatory regions of the
target genes.
At the present time, there are more than 4000 known TF's, about 2000 of which
are from
mammalian species. Exemplary TFs, without limitation, include c-Fos, c-Jun, AP-
1, ATF, c-Ets-1, c-
Rel, CRF, CTF, GATA-1, POU1F1, NF-KB, POU2F1, POU2F2, p53, Pax-3, Spl, TCF,
TAR, TFEB,
TCF-1, TFIIF, E2F-1, E2F-2, E2F-3, E2F-4, HIF-1, H1F-1~,, HOXAI, HOXAS, Sp3,
Sp4~, TCF-4~,
APC, and STATSA.
Of the mammalian TFs, only several hundred have been shown to have the ability
to bind
directly to the regulatory regions (cis-regulatory binding sites) of the
target genes, and only a few
hundred TF binding sites have been characterized up to date. The TF binding
sites of genes are short
stretches of DNA sequences located in the regulatory region of the genes.
These sites are specific for
different DNA binding TFs, and usually are about 6 to about 16 bases in
length. It is known that
within a given binding site there are bases at certain positions that are
absolutely required for binding
by the corresponding TF, while others can tolerate some base-change
variations. For further details
see, for example, Davidson, E.H., Genomic Regulatory Systems: development and
evolution, ISBN 0-
12-205351-6, Academic Press, 2001. and, for example, Michael Caret', Stephen
T. Smale,
Transcriptional Regulation in Eukaryotes, ISBN 0-87969-537-4, Cold Spring
Harbor Laboratory
Press, 2000.
11
CA 02519368 2005-09-15
WO 2004/087965 PCT/US2004/009059
There are several transcription factor related databases, which are listed in
Table 2 below.
Table 2
Database TF Sites Address
TRANSFAC factors sites http://transfac.gbf.de/TRANSFAC/index.html
TRRD factors sites http://wwwmgs.bionet.nsc.ru/mgs/gnw/trrd
TFD factors sites http://kisec.cmb.ki.se/kisac/databases/tfd.html
COMPEL compositorysites http://compel.bbionet.nsc.ru/
EPD N/A promotershttp://www.epd.isb-sib.ch/
IMD factors sites http://bimas.dcrt.nih.giv/molbio/matrixs/
Of the listed databases TRANSFAC collects the most in terms of number of TF
binding sites,
and is updated and cited frequently (Heinemeyer et al., 1998, Heinemeyer et
al., 1999, I~aras et al.,
1997, Knuppel et al., 1994, Matys et al., 2003, Wingender et al., 1996,
Wingender et al., 1997,
Wingender et al., 1997, Wingender et al., 2000., Wingender et al., 2001). The
usage of TF binding
sites for protein-pathway evaluation has been recently reported (Krull et al,
2003).
In the broadest sense, the present invention provides, for the first time, a
method for the
comparative analysis of regulatory regions of a large number of genes in order
to identify common
regulatory mechanisms and/or consensus regulatory factor binding sites shared
by such genes.
Accordingly, the present invention provides new insight into so far
undiscovered relationships
between such genes, and enables the identification of significant regulatory
factors from the large
amount of gene expression data available at the present time or to be
generated in the future.
The idea underlying the present invention is that if one can identify certain
consensus
regulatory factor binding sites, such as, for example, TF binding sites,
shared by most of the
differentially expressed genes identified in various diseases, diseases states
or abnormalities. If the
certain regulatory factor, e.g. TF binding sites are found enriched among such
differentially expressed
genes relative to their tissue-wide or genome-wide existences, the identified
binding sites very likely
play a major role in the resultant differential expression and, in turn, could
be responsible for the
disease or abnormalities, such as the anal cell-fate change seen in cancer or
tumor.
In one particular aspect, the present invention provides a novel approach for
comparative
analysis of regulatory regions of differentially expressed genes in order to
identify consensus
regulatory regions enriched within such genes, which can then be used to
identify one or more
regulatory factors that play a role in the regulation of their expression.
In another aspect, the present invention provides a method for identifying
regulatory factors,
such as transcription factors (TFs), providing a link among the large number
of genes differentially
12
CA 02519368 2005-09-15
WO 2004/087965 PCT/US2004/009059
expressed in a disease, disease state or abnormality, by a systematic
comparison of their regulatory
regions.
As a result of their involvement in an essential regulatory mechanism
associated with a
disease process, the shared regulatory factor binding sites and the
corresponding regulatory factors are
valuable therapeutic-development targets. For example, by altering the TFs
identified, for example,
by antisense oligonucleotide approach (to bind the mRNA of the TF and in turn
to alter the
corresponding protein expression) or by changing the transcription effects of
such TFs, e.g. by using
the transcription decoy method (to competitively bind to corresponding TFs),
new approaches can be
developed for the treatment (including prevention) of a variety of diseases,
disorders, and
abnormalities, or for interfering with certain detrimental or undesired
biological processes, such as
aging. In a more generic sense, the present invention provides a valuable tool
for biomedical studies
and research efforts in general, and provides a unique tool for understanding
such processes. In
general, the information provided by the present invention can be utilized for
a variety of different
purposes and applications including but not limited to, biomedical research,
pre-clinical development,
drug screening applications, target discovering and target validation,
building genome- or tissue-wide
connections between regulatory profiles of different genes, understanding the
genome or tissue
background of various known regulatory factors, understanding the genome or
tissue background of
various known transcription factors, and the like.
Accordingly, the present invention is directed to a method for the statistical
analysis of the
regulatory factor (e.g. TF) binding sites of differentially expressed genes.
In a particular aspect, the
present invention provides new therapeutic targets by identifying regulatory,
e.g. transcription factors
that have been responsible for the differential expressions of a large number
of genes found in a
biological sample representative of a disease, disorder, or a particular
biological process.
In a particular embodiment, the method of the present invention comprises the
following
steps: (1) the generation of a list of genes with significant differential
expression; (2) the identification
of cis-regulatory regions within the differentially expressed genes; (3) the
mapping of transcription
factor binding sites on the cis-regulatory regions identified; and (4) the
statistic analysis of the
identified TF binding profiles.
(1) The getaer~atiott of the list of genes witlz significant differeratial
expression.
The gene expression data can be retrieved from various gene expression related
databases.
These databases are not limited to those generated by microarray techniques.
They can also include
gene expression data obtained by real-time quantitative PCR, Northern blot
hybridization, and other
gene expression related methods, including proteomics. Exemplary databases of
gene expression data
are listed in Table 1 above. In addition to these already available data sets,
the differentially expressed
gene list can also be generated by any project-oriented specific experiments,
using any of the
13
CA 02519368 2005-09-15
WO 2004/087965 PCT/US2004/009059
techniques discussed above, or otherwise known in the art. According to the
invention, the data
retrieved from such databases, or from any other source, are intensively
analyzed, especially when the
data involve a large number of genes or gene sets (e.g., such as SAM
analysis). A list of genes
showing significant differential expression is generated, and assigned the
respective gene identifiers,
based on the international nomenclature committee and other genome databases,
using self generated
scripts. As noted before, differential gene expression is considered to be
"significant" when there is at
least an about two-fold, preferably at least about four-fold, more preferably
at least about six-fold,
most preferably at least about ten-fold difference between the expression of a
given gene in a test and
a reference sample, such as in normal and diseased subjects, or in various
stages of disease
development in a diseased subject.
(2) The idetttificatio~a of cis-f~egulatoty regioiZS of differentially
expressed ge~tes.
Based on the gene list generated in (1), the full-length sequences of these
genes are retrieved
from various full-length gene databases (such as NCBI based refSeq, N1H based
MGC consortium,
Japan DBTSS, and the like) (Pruitt et al., 2001, Strausberg et al., 1999,
Strausberg RL et al., 2002,
Yamashita et al., 2001). These full-length sequences are then compared with
most updated human
genome sequence databases (Lender et al., 2001, McPherson et al., 2001) (such
as ~Iuman Genome
Working Draft, build 31, Nov 2002) for mapping their chromosomal location
using, for example, the
BLAT software (Kent, 2002). Depending on the particular purpose, the cis-
regulatory region, such as,
for example, the 5' upstream core promoter region, the 5' upstream enhancer
region, intron region,
and/or 3' regulatory region, is defined and the corresponding genomic
sequences are retrieved from
the most up-dated genome sequence databases (UCSC genome browser) (Kent et
al., 2002, Karolchik
et al., 2003). If necessary, the sequence-retrieving process can be
facilitated by using self developed
scripts.
(3) Mapping of ~egulat~ty factor binding pf°~files oat the cis-f~eg-
ulat~ry regions idefttified.
The genomic sequences for regulatory regions identified are screened for any
putative
regulatory factor binding sites, such as TF binding sites. For instance, the
core promoter regions of
the differentially expressed genes can be analyzed using known transcription
factor binding sites.
Software available for this kind of analysis is disclosed, for example, in the
following publications:
Grebe, 2002, Kel-Margoulis et al., 2000, Kel et al., 1995, Liebich et al.,
2002, Perier et al., 2000, Praz
et al., 2002, Prestridge, 1996, Quandt et al., 1995, Tsunoda et al., 1999, and
Wingender, 1994. These
genomic sequences of regulatory regions can be further screened for putative
cis-regulatory binding
sites using various motif ending software. This can be instrumental in mapping
unknown
transcription factor binding sites unknown regulatory factor consensus motifs.
14
CA 02519368 2005-09-15
WO 2004/087965 PCT/US2004/009059
(4) Statistic arralysis of the regulatory factor- binding p>"ofiles.
The putative regulatory factor binding sites identified in the differentially
expressed genes are
compared with their genome-wide or tissue-wide occurrence. The number of such
binding sites, the
frequencies of such binding profiles and the distribution and frequencies of
occurrence are calculated,
using statistical analysis. Statistical analysis can be performed, for
example, using the hypergeometric
distribution models, which determine the total number of successes in a fixed
size sample drawn
without replacement from a finite population. In particular, the
hypergeometric distribution analysis
(by using Microsoft Excel building function in combination with self developed
script) can be used to
test if the appearances of certain regulatory factor (e.g. TF) binding sites
are significantly enriched in
the differential expression gene list. Such enrichment may result in
abnormalities, such as tumor, e.g.
cancer, when comparing with the genomic or tissue background. If necessary,
the regulatory factor,
e.g. TF can be identified and its sequence provided, based upon such
statistical analysis. Such
regulatory fact~rs, e.g. TFs are valuable targets for therapeutic intervention
directed to the prevention
or treatment of diseases, disorders, or unwanted biological processes.
It will be apparent to those skilled in the art that other statistical methods
can also be
employed, as long as they are suitable for the c~mparis~n of frequencies or
pr~babilities ~f the
~ccurrences ~f regulatory regi~ns in the genes identified in any two gene
sets.
In a particular embodiment, the cis-regulatory regions, e.g. regulatory factor
binding sites, of
differentially expressed genes are identified by the method disci~sed in c~-
pending applicati~n Serial
No. 10/402,689, filed on March 28, 2003. In brief, according to this approach,
genomic sequences of
gene regulatory regions are retrieved, from public and/or proprietary
databases, DNA sequence
inf~rmati~n f~r each retrieved gene regulat~ny regi~n is screened t~ identify
putative regulat~ry
fact~r binding sites, the putative regulat~ry factor binding sites are
profiled, and probability mapping
is applied t~ the profiled binding sites. The pr~bability mapping involves the
identification of
specific regulatory factor binding sites, such as all the putative E2F-1
transcription factor binding
sites, in the regulatory regions of all genes in a gene set, e.g. a set ~f
differentially expressed genes in
a particular disease, disease state, abnormality, and the like. The
probability mapping tells how many
of the differentially expressed genes are likely to be transcription-regulated
by a specific regulatory
factor. It also indicates how much genome-wide, cell-wide, or tissue-wide,
effect a specific regulator
factor is expected to have.
For each binding site identified, a conservation score can be created. The
conservation score
is selected to cover regions where the regulatory factor (e.g. TF) binding
sites are identified as well as
any other measurements that indicate conservation levels between the two
species including but not
limited to mouse and human. A binding site with higher conservation score or
the corresponding gene
with higher expression level could play a more significant role than those
with lower scores.
CA 02519368 2005-09-15
WO 2004/087965 PCT/US2004/009059
The data generated can be collected and organized in a data bank, which can
facilitate the use
of the information in research and drug development efforts.
It is emphasized, however, that it is not necessary to use this proprietary
approach to practice
the present invention. Databases that including mapping information of gene
regulatory regions can
be developed in many different ways. Accordingly, the present invention is by
no means limited by
the way of mapping and analyzing the regulatory factor binding sites of
differentially expressed genes.
Examples of regulatory factor binding sites that can be identified in
accordance with the
present invention include, but are not limited to, the binding site for
transcription factor NF-~cB
(AGGGGACTTTCCCA ; SEQ ID NO: 1), and for E2F-1 (TTTGGCGG; SEQ ID NO: 2).
If the initial information is a proteomic profile (e.g. a mass spectrum)
showing differential
protein expression levels, the corresponding genes are located and identified,
and the list of genes and
their corresponding protein expression levels are used in the subsequent
analysis.
C. Therapeutic Identification and Transcription Factor Decoy Desig-nn
In one specific application, the statistical analysis of regulatory binding
sites performed in
accordance with the present invention provides a facile way for identifying
targets for therapeutic drug
design, and for developing various therapeutic approaches directed to the
targets identified, including,
but not limited to, the design of oligonucleotide decoys.
It is well possible that all diseases, including human diseases, are somehow
associated with
the gene transcription process. It is well lmown that germline mutations in
genes encoding
transcription factors result in malformation syndromes affecting the
development of multiple body
structures. Somatic mutations in genes encoding transcription factors have
been shown to contribute
tumorigenesis. In addition, prenatal development and postnatal physiology
demonstrate that a single
transcription factor can control the proliferation of progenitor cells during
development, and the
expression within the differentiated cells of genes products that participate
in specific physiological
responses. By way of example, well-studied transcription factors, such as p53,
and the Smad and
STAT proteins are known to play a major role in many cancers. Transcription
factors have also been
identified as being involved in various neuronal, cardiovascular, renal and
infectious diseases, diseases
of bone development, digestive diseases, diseases associated with abnormal
skeletal development, and
the like. For further details see, for example, Gregg L. Semenza,
Transcription Factors and Human
Disease, Oxford Press 1998.
Although the transcription factor protein-DNA interaction is sequence-
specific, the binding
site for one given transcription factor may vary by several base pairs within
different target genes.
The common part, or non-variable part, of the binding sequence for a
particular transcription factor is
referred to as the transcription factor consensus sequence. For example, the
consensus sequence for
transcription factor NF-KB is AGGGGACTTTCCCA (SEQ ID NO: 1); and for E2F-1 is
16
CA 02519368 2005-09-15
WO 2004/087965 PCT/US2004/009059
TTTGGCGG (SEQ ID NO: 2). The AP-1 transcription factor binds to the TGACTCA
(SEQ ID NO:
3) consensus sequence. The consensus sequence for the Smad-3 transcription
factor, which mediates
TGF-(3, activin and BMP-induced changes in gene expression is TGTCTGTCT (SEQ
ID NO: 4).
If any of such consensus sequences are enriched in a biological sample
representing a disease,
disorder or pathologic condition, the corresponding transcription factor is a
promising target of novel
therapeutic approaches directed to such disease, disorder or condition.
According to the transcription factor decoy approach, small double-stranded
oligonucleotides
are introduced into cells to specifically bind to target transcription
factors, thereby, preventing these
factors from transactivating (i.e. "turning on") their target genes. ,
In preclinical studies, pressure mediated ex vivo delivery of E2F Decoy has
shown to prevent
both neointimal hyperplasia and atherosclerosis in vein grafts of an animal
model of vein graft
transplantation. For more information, see, e.g. Ehsan, A., M.J. Mann 2001;
Mann and Dzau 2000;
Mann et al. 1999; and U.S. Patent Nos. 5,766,901 and 5,992,687.
Further details of the invention are illustrated by the following non-limiting
examples.
Example 1
The method of the invention was applied to a set of cell cycle related gene
expression data
(Whitfield et al., 2002). Proper regulation of the cell division cycle is
crucial to the growth and
development of all organisms; understanding this regulation is central to the
study of many diseases,
most notably cancer.
The genome-wide program of gene expression during the cell division cycle in a
human
cancer cell line (HeLa) was characterized using cDNA microarrays. Transcripts
of more than 850
genes showed periodic variation during the cell cycle. Hierarchical clustering
of the expression
patterns revealed coexpressed groups of previously well-characterized genes
involved in essential cell
cycle processes such as DNA replication, chromosome segregation, and cell
adhesion along with
genes of uncharacterized function. Most of the genes whose expression had
previously been reported
to correlate with the proliferative state of tumors were found to be
periodically expressed during the
HeLa cell cycle. The data in this report provide a comprehensive catalog of
cell cycle regulated genes
that can serve as a starting point for the method of the present invention.
The full dataset was
retrieved from http://~enome-www.stanford.edu/Human-CellCycle/HeLa/ site for
further analysis.
In order to identify the key elements involved in above differential expressed
genes in cell
cycles, the full-length sequences of these genes were retrieved, using the
combination of UCSC
genome browser (Karolchik et al., 2003, Kent et al., 2002), MGC gene
collection database and
DBTSS databases. The transcription start site positions were mapped to the
newest human genome
working draft (McPherson et al, 2001, Lander et al., 2001) using the BLAT
program. The sequences
for core promoter regions (which is about 250 by upstream and 50 by downstream
to the transcription
17
CA 02519368 2005-09-15
WO 2004/087965 PCT/US2004/009059
start site, respectively) were retrieved using self generated pert script for
all the genes. The analysis
of putative TF binding profile was performed using the Match program (Matys et
al., 2003) embedded
inside the licensed TRANSFAC database, combined with self generated perl
scripts.
The initial screenings were performed using well-studied known transcription
factors
identified only from mammalian species. A typical cell cycle is composed of
G1, G2, M and S
phases. Among them, the G2 and M phases are very short relative to the G1 and
S phases, which
suggests that the cell phases at G1 and S are easier to define. Therefore, the
focus of the present
analysis has been on those differentially expressed genes (total 198) that
were found in the Gl and S
phases. The frequencies of the known TF binding sites identified from the
above analysis were
scatter-plotted against their corresponding frequencies in the genome
background. The results are
shown in Figure 1. The plotting suggests that if the TF binding sites
identified are normally
distributed in the target gene list, the corresponding spots should locate
around the red line (which is
the theoretic-value if the identified TF binding frequency is the same as the
corresponding genomic
frequency). However, if the enrichments of certain TF-bindings indeed exist in
the differentially
expressed genes, the corresponding spots will be shifted away from the
theoretic red line, and be
moved toward the x-axis that represents the frequencies of TF-bindings in the
targeted gene list. As
shown in Figure 1, the 3 most shifted spots in the target gene list, which
show higher appearances
(higher frequencies, > 0.4) belong to the transcription factors E2F-1, E2F-
1/DP-19 and E2F.
The results v~,~ere subjected to further statistics analysis. The 14 TFs with
highest frequencies
identified in the target gene list are listed in the following Table 3,
together with their P values (the
right tail cumulated) of Hypergeometric Distribution test (see table). The
data set forth in Table 3
suggest that E2F-19 Elk-l, E2F, and E2F-1/DP-1 are the most significant ones
with the smallest f
value. Like E2F-1, transcription factor Elk-1 has also been intensively
studied and shown the
important role in cell cycles and proliferations.
18
CA 02519368 2005-09-15
WO 2004/087965 PCT/US2004/009059
Table 3
Name of TFFreq, ef TF binding in target gene list j Freq, a~f genamie TF
binding P of Hyperge~metrie Distributian
E2F-1 j 0.661616162 0.428784151 0.00000008*
~
Elk-1 0.590800001 0.469247702 0.00036971
Pax-4 0.590909091 0.586430144 0.41923023
;
MAZ 0.580808081 0.526161189 0.06189041
TFII-I 0.494949495 ~ 0.536514308 0.89462549
HNF-4 i 0.41979798 0.468410802 0.40081184
c-Myc~MaX 0.45959596 ~ 0.402563111 0.05840235
~ j
E2F 0.449494949 . 0.244853036 0.00000011
!
~
Xvent-1 0.444444444 ~ 0.417113324 0.24291231
~ t
E2F-IIDP-1 0.419191919 ! 0.111112262 0.00000001*
' ; ~
c-Ets-1 ~ 0.388888889 ~ 0.330182572 0.04665969
(p54)
Sp3 i 0.383838384 j 0.369092322 0.35191823
~
TCF-1 P 0.353535354 ! 0.318205361 0.15923196
~ ..___ _
.
c-feel 0.348484848 0.302214165 0.08983233
~
In conclusion, the key transcription factors E2F-1 and Elk-1 have been
identified as factors
that may play the essential role affecting 850 genes with differential
expression found during the
specific cell cycles processes. The cell cycles have been shown crucial in
many different kinds of
tumor or cancer developments. The immediate benefit from this is that one can
develop therapeutic
strategies based on these key elements. The transcription factor decoy (e.g.,
for E2F-1 Decoy,
Corgentech Inc.) or anti-sense oligonucleotides are the examples for such
novel treatment options.
The role of E2F-1 and Elk-1 in cell proliferations was gradually developed
after numerous
experiments and years studies. However, our invention make this time-consuming
process an easy
and fast task.
All references cited throughout the disclosure, and all references cited
therein are hereby
expressly incorporated by reference in their entirety.
One skilled in the art will recognize many methods and materials similar or
equivalent to
those described herein, which could be used in the practice of the present
invention. Indeed, the
present invention is in no way limited to the methods and materials described.
19
CA 02519368 2005-09-15
WO 2004/087965 PCT/US2004/009059
REFERENCES
Ehsan, A., M.J. Mann, G. DelfAcqua, and V.J. Dzau. (2001). Long-term
stabilization of vein
graft wall architecture and prolonged resistance to experimental
atherosclerosis after E2F decoy
oligonucleotide gene therapy. Journal of Thoracic Cardiovascular Surgery,
121,714-722.
Grabe N. AliBaba2: context specific identification of transcription factor
binding sites.
In Silico Biol. 2002;2(1):51-15.
Heinemeyer T, Chen X, Karas H, Kel AE, Kel OV, Liebich I, Meinhardt T, Reuter
I,
Schacherer F, Wingender E. Expanding the TRANSFAC database towards an expert
system of
regulatory molecular mechanisms. Nucleic Acids Res. 1999 Jan 1;27(1):318-22.
Heinemeyer T, Wingender E, Reuter I, Hernzjakob H, Kel AE, Kel OV, Ignatieva
EV,
Ananko EA, Podkolodnaya OA, Kolpakov FA, Podkolodny NL, Kolchanov NA.
Databases on
transcriptional regulation: TRANSFAC, TRRD and COMPEL. Nucleic Acids Res. 1998
Jan
1;26(1):362-7.
Karas H, Kef E, Kef OV, Kolchanov NA, Wingender E. [Integrating knowledge on
transcriptional regulation of eukaryotic genes based on information from
TRANSFAC, TRRD, and
COMPEL, databases] Mol Biol (Mock). 1997 Jul-Aug;31(4):637-46.
Kel-Margoulis OV, Romashchenko AG, Kolchanov NA, Wingender E, Kel AE. COMPEL:
a
database on composite regulatory elements providing combinatorial
transcriptional regulation.
Nucleic Acids Res. 2000 Jan 1;28(1):311-5.
Knuppel R, Dietze P, Lehnberg W, Frech K, Wingender E. TRANSFAC retrieval
program: a
network model database of eukaryotic transcription regulating sequences and
proteins. J Comput
Biol. 1994 Fall;l(3):191-8.
Karolchik D, Baertsch R, Diekhans M, Furey TS, Hinrichs A, Lu YT, Roskin KM,
Schwartz
M, Sugnet CW, Thomas DJ, Weber RJ, Haussler D, Kent WJ. The UCSC Genome
Browser
Database. Nucleic Acids Res. 2003 Jan 1;31(1):51-4.
Kent WJ, Sugnet CW, Furey TS, Roskin KM, Pringle TH, Zahler AM, Haussler D.
The
human genome browser at UCSC. Genome Res. 2002 Jun;12(6):996-1006.
CA 02519368 2005-09-15
WO 2004/087965 PCT/US2004/009059
Kent WJ. BLAT--the BLAST-like alignment tool. Genome Res. 2002 Apr;12(4):656-
64.
Kel AE, Kondrakhin YV, Kolpakov PhA, Kel OV, Romashenko AG, Wingender E,
Milanesi
L, Kolchanov NA. Computer tool FUNSITE for analysis of eukaryotic regulatory
genomic
sequences. Proc Int Conf Intell Syst Mol Biol. 1995;3:197-205.
Krull M, Voss N, Choi C, Pistor S, Potapov A, Wingender E. TRANSPATH((R)): an
integrated database on signal transduction and a tool for array analysis.
Nucleic Acids Res. 2003 Jan
1;31(1):97-100.
Lander et al., 2001. Initial sequencing and analysis of the human genome.
Nature. 2001 Feb
15;409(6822):860-921.
Levy S, Hannenhalli S. Identification of transcription factor binding sites in
the human
genome sequence. Mamm Genome. 2002 Sep;l3(9):510-4.
Liebich I, Bode J, Frisch M, Wingender E. S/M~Rt DB: a database on
scaffold/matrix
attached regions. Nucleic Acids Res. 2002 Jan 1;30(1):372-4~.
Mann, M.J., A.D. Whittemore, M.C. Donaldson, M. Belkin, M.S. Conte,J.F. Polak,
E.J. Orav,
A. Ehsan, G. DelfAcqua, and V.J. Dzau. (1999). Ex-vivo gene therapy of human
vascular bypass
grafts with E2F decoy: the PREVENT single-centre, randomised, controlled
trial. Lancet, 354., 1493-
1498.
Mann, M.J., and V.J. Dzau. (2000). Therapeutic applications of transcription
factor decoy
oligonucleotides. Journal of Clinical Investigation, 106, 1071-1075.
Matys V, et al. TRANSFAC: transcriptional regulation, from patterns to
profiles. Nucleic
Acids Res. 2003 Jan 1;31(1):374-8.
McPherson et al, 2001. A physical map of the human genome. Nature. 2001 Feb
15;409(6822):934-41.
Perier RC, Praz V, Junier T, Bonnard C, Bucher P. The eukaryotic promoter
database (EPD).
Nucleic Acids Res. 2000 Jan 1;28(1):302-3.
21
CA 02519368 2005-09-15
WO 2004/087965 PCT/US2004/009059
Praz V, Perier R, Bonnard C, Bucher P. The Eukaryotic Promoter Database, EPD:
new entry
types and links to gene expression data. Nucleic Acids Res. 2002 Jan
1;30(1):322-4.
Prestridge DS. SIGNAL SCAN 4.0: additional databases and sequence formats.
Comput
Appl Biosci. 1996 Apr;12(2):157-60.
Pruitt KD, Maglott DR. RefSeq and LocusLink: NCBI gene-centered resources.
Nucleic
Acids Res. 2001 Jan 1;29(1):137-40.
Quandt K, Frech K, Karas H, Wingender E, Werner T. MatInd and MatInspector:
new fast
and versatile tools for detection of consensus matches in nucleotide sequence
data. Nucleic Acids
Res. 1995 Dec 11;23(23):4878-84.
Schacherer F, Choi C, Gotze U, Krull M, Pistor S, Wingender E. The TRANSPATH
signal
transduction database: a knowledge base on signal transduction networks.
Bioinformatics. 2001
Nov;17(11):1053-7.
Strausberg RL, Feingold EA, Klausner RD, Collins FS. The mammalian gene
collection.
Science. 1999 Oct 15;286(5439):455-7.
Strausberg RL et al. Generation and initial analysis of more than 15,000 full-
length human
and mouse cDNA sequences. Pros Natl Acad Sci U S A. 2002 Dec 24;99(26):16899-
903.
Tsunoda T, Takagi T. Estimating transcription factor bindability on DNA.
Bioinformatics. 1999 Jul-Aug;lS(7-8):622-30.
Whitfield ML, Sherlock G, Saldanha AJ, MmTay JI, Ball CA, Alexander KE, Matese
JC,
Perou CM, Hurt MM, Brown PO, Botstein D. Identification of genes periodically
expressed in the
human cell cycle and their expression in tumors. Mol Biol Cell. 2002
Jun;13(6):1977-2000.
Wingender E, Chen X, Fricke E, Geffers R, Hehl R, Liebich I, Krull M, Matys V,
Michael H,
Ohnhauser R, Pruss M, Schacherer F, Thiele S, Urbach S. The TRANSFAC system on
gene
expression regulation. Nucleic Acids Res. 2001 Jan 1;29(1):281-3.
22
CA 02519368 2005-09-15
WO 2004/087965 PCT/US2004/009059
Wingender E, Chen X, Hehl R, Karas H, Liebich I, Matys V, Meinhardt T, Pruss
M, Reuter I,
Schacherer F. TRANSFAC: an integrated system for gene expression regulation.
Nucleic Acids Res.
2000 Jan 1;28(1):316-9.
Wingender E, Karas H, Knuppel R. TRANSFAC database as a bridge between
sequence data
libraries and biological function. Pac Symp Biocomput. 1997;:477-85.
Wingender E, Kel AE, Kel OV, Karas H, Heinemeyer T, Dietze P, Knuppel R,
Romaschenko
AG, Kolchanov NA. TRANSFAC, TRRD and COMPEL: towards a federated database
system on
transcriptional regulation. Nucleic Acids Res. 1997 Jan 1;25(1):265-8.
Wingender E, Dietze P, Karas H, Knuppel R. TRANSFAC: a database on
transcription
factors and their DNA binding sites. Nucleic Acids Res. 1996 Jan 1;24(1):238-
41.
Wingender E. Recognition of regulatory regions in genomic sequences. J
Biotechnol. 1994
Jun 30;35(2-3):273-80.
Suzuki Y, Yamashita R, Nakai K, Sugano S. DBTSS: DataBase of human
Transcriptional
Start Sites and full-length cDNAs.
23
CA 02519368 2005-09-15
WO 2004/087965 PCT/US2004/009059
<110> CORGENTECH, INC.
SEQUENCE LISTING
Zhang; lie
Wei, Hsiu-Ying
McEVOy, Leslie M.
<120> Statistical Analysis of Regulatory
Factor Binding sites Of Differentially Expressed Genes
<130> 39753-0002 PCT
<140> Unassigned
<141> Herewith
<150> US 10/401,830
<151> 2003-03-28
<160> 4
<170> "~astSEQ for Windows version 4.0
<210> 1
<211> 14
<212> DNA
<213> Homo Sapiens
<400> 1
aggggacttt ccca 14~
<210> 2
<211> 8
<212> DNA
<213a Homo Sapiens
<400> 2
tttggcgg 8
<210a 3
<211> 7
<212> DNA
<Z13> Homo Sapiens
<400> 3
tgactca 7
<~10> 4
<211> 9
<Z12> DNA
<213> Homo Sapiens
<400> 4
tgtctgtct 9
Page 1