Note: Descriptions are shown in the official language in which they were submitted.
CA 02524993 2005-10-31
Title
Methods and Apparatus for Measuring Capillary
Pressure in a Sample
Field of the Invention
The present invention relates to methods and
apparatus for measuring parameters in samples, and in
particular, but not limited to measuring capillary pressure
or other parameters in porous media, such as rock samples.
Background of the Invention
Capillary pressure curves are widely used in
material, soil and environmental sciences, and especially in
the petroleum industry. Capillary pressure curves provide
critical information frequently used in the assessment of
the economic viability of oil reservoir development.
The two most important characteristics of a
reservoir core are the porosity and permeability. These are
closely followed by the in situ oil saturation, and the
capillary pressure. While a slightly more esoteric quantity
than the first three, the capillary pressure is fundamental
to reservoir evaluation, and fundamental to many reservoir
properties measured in other ways. Capillary pressure
results from the pore level interaction between a wetting
fluid (often water), a non-wetting fluid (often oil) and the
rock matrix. Capillary processes critically affect the
initial reservoir fluid distribution and petroleum recovery
during primary or enhanced production. The distribution of
multiple fluids in the reservoir pores are a function of
capillary forces, which in turn are related to the
wettability, fluid density and pore geometry, as described
1
CA 02524993 2005-31
in F. A. L. Dullien, Porous Media: fluid transport and pore
structure, New York, Academic Press, 1979.
In evaluating hydrocarbon reservoirs, laboratory
capillary pressure curve measurements on extracted cores are
directly applied to determine many petrophysical qualities,
for example: pore size distribution, irreducible water
saturation and residual oil saturation, wettability of the
reservoir rock, seal capacity, depth of free water level in
the reservoir, and thickness of the transition zone. The
initial water and oil saturation as a function of height
above the free water level, an approximation of the recovery
efficiency during primary or secondary recovery, and
calculation of permeability and relative permeability may
also be determined by laboratory measurements of the
capillary pressure, as described in the reference above and
W. R. Purcell, Trans. AIME 186, 39 (1949) and I. Fat and H.
Dyksta, Trans AIME 192, 41 (1951).
Capillary pressure may be obtained by either
mercury intrusion, porous plate, or centrifuge methods. The
mercury intrusion method is rapid, but it is destructive,
and the mercury/vacuum system does not represent the
wettability of reservoir system. The porous plate method is
a direct and accurate technique, but is extremely time-
consuming, since the equilibrium time can range from a week
to months per pressure point.
The centrifugal capillary pressure curve technique
was introduced by Hassler and Brunner in 1945, as described
in Hassler, G. L., Brunner, E., "Measurement of Capillary
Pressure in Small Core Samples", Trans. AIME, 1945, 160,
114-123 and N. T. Burdine, Trans. AIME 198, 71 (1953). This
technique, which involves rotating fluid bearing rock cores
2
CA 02524993 2005-31
at variable speeds in a specially modified centrifuge, has
been extensively investigated, and is commonly used in the
petroleum industry. Sample rotation yields a centrifugal
force which will empty pores with matching capillary forces.
Collecting the expelled fluid as a function of increasing
rotational speed permits a quantification of the capillary
pressure as a function of fluid content or saturation. It
is however well known that many problems exist with the
traditional method, ranging from fundamental concerns about
the validity of the underlying theory to uncertainty over
how to treat the experimental data.
The traditional interpretation of centrifugal
capillary pressure data is based on several assumptions:
(1) Nonlinearity of the centrifugal field is not
significant; (2) Gravity has no effect on fluid
distribution; and (3) The capillary pressure is zero at the
bottom (outlet end-face) of the core plug. These
assumptions are known to lead to significant errors in the
measurement of the capillary pressure curve. In addition,
these three conditions can not be simultaneously satisfied.
The first assumption requires a short sample and large
rotational radius. For low capillary pressures, the
experiment requires a very low rotational speed. In this
case, the effect of gravity can not be neglected. For high
capillary pressures, the experiment requires a very high
rotation speed, which is likely to lead to a violation of
the third assumption (capillary pressure is zero at the
outlet). In addition, the rock pore structure in
unconsolidated or friable samples (for example marginal
reservoirs) will change due to the high centrifugal forces,
thereby altering the capillary pressure curve.
3
CA 02524993 2005-10-31
Traditional centrifuge methods for capillary
pressure determination are time consuming and special
instrumentation is required for the experiment. Measurement
of the full capillary pressure curve requires approximately
15 different centrifuge speeds, thus requiring one day to
several days for measurement. In addition, some friable and
unconsolidated rock samples may be broken during
ultracentrifugation, as described in D. Ruth and Z. Chen,
The Log Analyst 36, 21 (1995). The experiment requires a
very expensive ultracentrifuge with precise speed control
over a wide range of speeds. A special core holder and
stroboscope for collecting and measuring expelled liquid are
also necessary for the experiment.
Magnetic Resonance Imaging (MRI) is a powerful,
non-destructive, measurement method, which, with techniques
developed by the inventors described in Balcom, B. J.,
MacGregor, R. P., Beyea, S. D., Green, D. P., Armstrong, R.
L. and Bremner, T. W. "Single Point Ramped Imaging with Ti
Enhancement (SPRITE)", J. Magn. Res. A (1996) 123, 131-134,
offer unique advantages in the measurement of spatially
resolved fluid saturation in porous media , discussed in
Chen, Q., Gingras, M. and Balcom, B. J., "A magnetic
resonance study of pore filling processes during spontaneous
imbibition in Berea sandstone", J. Chem. Phys., 119, 9609-
9616 (2003) and Balcom, B. J., Barrita, J. C., Choi, C.,
Beyea, S. D., Goodyear, D. J. and Bremner, T. W. "Single-
point magnetic resonance imaging (MRI) of cement based
materials", Materials and Structures (2003) 36, 166-182.
When two immiscible fluids (wetting phase and non-
wetting phase) are in contact in the interstices of a porous
medium, a discontinuity in pressure exists across the
interface. The difference in pressure is called the
4
CA 02524993 2005-10-31
capillary pressure, Pc, which is defined as the pressure in
the non-wetting phase minus the pressure in the wetting
phase.
Pc=P non-wetting -Pwetting (1)
The hydrostatic pressure (P) of a liquid with
density p is dependent on the elevation z as follows
dP
= pg
dZ
where g is the acceleration due to gravity.
For an oil-water porous media system in a
reservoir, if water is the wetting phase and oil is the non-
wetting phase, the capillary pressure is related to the
height of the fluid above the free water level (where water
saturation is 100%, above this level, the water saturation
is less than 100%) as
dp,
dz ______________ = (Po ¨ Põ)g (3)
If fluid columns are continuous in the reservoir,
the following relationship holds
Pc(zo)-E g %(po - pw)dz (4)
where g is the acceleration due to gravity, zo is the free
water level in the reservoir, Pc(z) is the capillary pressure
at height z above zo , and low and pa are the densities of
water and oil, respectively.
5
CA 02524993 2005-10-31
If the water saturation at zo is 100% and, thus,
Pc(z0)=0. Equation (4) can be expressed as
Pc(z)= g(P0 P,v)(z z 0) (5)
The capillary pressure is a result of the
curvature of fluid interfaces, according to the well-known
Young-Laplace equation
1 1
P -a
(6)
R1 R21
\
where a is interfacial tension between the two fluids and R1
and R2 are principle radii of curvature.
If the pore throat shape of the rock can be
described as a cylindrical capillary tube, equation (6)
becomes
=2acosOIR (7)
where R is the pore throat radius, and 0 is the contact
angle.
The capillary pressure can be converted directly
into a pore throat size using equation (7).
Laboratory measurements of the capillary pressure
curve can be converted into capillary pressure curves under
reservoir conditions. The condition for capillary forces to
exist is a curvature of the fluid-fluid interface. The
relation between fluid saturation and capillary pressure in
the reservoir is a function of the pore sizes, wettability,
6
CA 02524993 2005-10-31
. ,
interfacial tension and fluid saturation history (drainage
and imbibition). Based on laboratory measurements of the
capillary pressure, it is possible to convert these into
reservoir capillary pressure with equation (7-2).
PR (acos 0)R
c __ _____________________ (7 ¨ 2)
PeL (a cos 0)L
Where PR and PcL are the capillary pressure under reservoir
and laboratory conditions, respectively; (acose)R and
(acose)L are the products of interfacial tension and cosine
of contact angle under reservoir and laboratory conditions,
respectively.
Equation (7-2) can also be applied to convert
capillary pressure curves under other, different conditions.
As described in Hassler, G. L., Brunner, E.,
"Measurement of Capillary Pressure in Small Core Samples",
Trans. AIME, 1945, 160, 114-123, Hassler and Brunner
proposed a centrifuge method to obtain capillary pressure-
saturation data from small core plugs. They also proposed
an approximate solution to the basic equation relating
capillary pressure and average saturation by neglecting the
gravity gradient across the core and assuming the length of
the core was negligible compared to the radius of rotation.
The rock sample for centrifuge capillary pressure
curve measurements is assumed to be homogeneous, isotropic,
and rigid. The mineral grains are taken to be
incompressible. Thus, the pore structure of the rock is
independent of the magnitude of the capillary pressure
imposed. Similarly, the density of either fluid (wetting or
7
CA 02524993 2005-10-31
nonwetting, if a liquid), is assumed to be independent of
capillary pressure. If the non-wetting phase is a gas, the
density is assumed to be negligible.
The surface or interfacial tension between the
wetting fluid and non-wetting fluid is assumed to be
constant, implying isothermal conditions. The wetting
characteristics of the three-phase system are considered to
be independent of the magnitude of the capillary pressure.
Thermodynamic equilibrium is assumed to exist throughout the
sample.
A conventional centrifuge capillary pressure
experiment is illustrated in Figures lA and 1B. The
experimental apparatus comprises a centrifuge which includes
a motor 1, a driveshaft 3 having a rotational axis 5, an
arm 7 extending radially from the driveshaft 5 and a sample
holder 9 pivotally mounted to the end 11 of the arm 7 so
that the sample holder is free to swing up and down. The
sample holder includes a removable, sealed end part 13 at
the inner end 15 and a porous plate core holder 17 which
divides the volume of the sample holder into a first
volume 19 for accommodating a reservoir rock core sample and
a second volume 21 for receiving liquid expelled from the
rock core.
Initially, the sample core is saturated with a
fluid, for example water, and the sample holder contains
another fluid, for example air, which replaces the fluid
displaced from the core as the sample is spun.
As illustrated in Figures 1A and 1B, r1 is the
distance from the axis of rotation 5 to the inlet end-
face 23 of the sample core, r2 is the distance from the axis
of rotation 5 to the outlet end-face 25 of the sample core,
8
CA 02524993 2005-10-31
while r is the distance from the axis of rotation to any
point along the core length.
To measure the capillary pressure curve, the
relative saturation of the sample core is measured as a
function of capillary pressure which varies as a function of
angular velocity of the centrifuge. Thus, a series of
measurements are made at different rotational speeds to
provide a series of data points of relative core saturation
and capillary pressure. For each measurement, the
centrifuge is spun at a particular speed and fluid is
expelled from the outlet end-face of the sample into the end
volume 21 and at the same time replacement fluid in the
sample holder is drawn into the sample core. After reaching
equilibrium fluid displacement at each speed, the amount of
liquid expelled from the core is measured with a stroboscope
while the centrifuge is in motion, as described in Rajan, R.
R., "Theoretically Correct Analytical Solution for
Calculating Capillary Pressure-Saturation from Centrifuge
Experiments," SPWLA 27th Annual Logging Symposium, Houston,
Texas, June 9-13, 1986. By knowing the pore volume and
initial fluid saturation in the core, the average volume
remaining in the core at each different speed can be
calculated from observation of the liquid produced, i.e. the
liquid in the end volume 21. The rotational speed of the
centrifuge is increased in steps and the measurement process
repeated at each different speed. Typical experimental data
points are depicted in Figure 2. A complete capillary
pressure curve usually requires about 15 speeds(15 data
points) and may take one to several days to acquire, and
therefore obtaining a capillary pressure curve is a
relatively slow process. Another drawback of this
conventional method is that it requires a special centrifuge
which is capable of providing a wide range of angular
9
CA 02524993 2005-10-31
velocities and therefore the centrifuge is relatively
expensive.
The basic concepts for capillary pressure
measurement with a centrifuge are outlined below for an
assumed small core rotating at high angular velocity.
If the cylindrical core of length L is subjected
to an acceleration a, = - w2r, where w is the angular
velocity of the centrifuge and r is the distance from the
axis of rotation, then from equation (3) where the
gravitational acceleration, g, is replaced by centrifugation
acceleration, a,, the capillary pressure is related to r, as
dP
=Apa, (8)
dr
where Ap is the density difference between the wetting fluid
and the non-wetting fluid. The differential equation can be
solved by simple integration
dP=f12 rApacdr=¨Lr2Apco2rdr (9)
2 C
Pc(r) = ¨1 Apco2 (r22 ¨ r 2 ) 0)
2
If the Hassler-Brunner boundary condition is
adopted for the outlet end-face, i.e., the capillary
pressure at the outlet end-face of the core is assumed to be
zero, i.e., Pc2 = 0, then
CA 02524993 2005-10-31
pc (r) 1 = Apc02 (,22 r 2 ) (11)
2
and for a continuous phase, the capillary pressure at the
inlet face of the core is
1
PeL(r) = Pc(ri) = Apo 2 (r22 r12 (12)
2
The next step of the method is to establish the
relationship between the capillary pressure and fluid
saturation S for a given core in the equilibrium state,
i.e., S = S(P). The capillary pressure thus calculated
corresponds to the fluid saturation at the inlet end-face.
This saturation should be calculated from the capillary
pressure and the measured average fluid saturation.
The conventional method measures the rotational
speed, co, and the average fluid saturation, S.
within the core.
However, the average fluid saturation, i.e., the
ratio of liquid volume remaining after centrifugation to
pore volume can be written as
1 fr2S(r)dr
S= ____________________________________________________________________ (13)
r2 ¨ r1
A relationship of saturation as a function of
capillary pressure, S = S(13,) can be defined, so Eq. (13) can
be expressed as follows by changing the integration variable
11
CA 02524993 2005-10-31
Pc. (1-2) = 0 and Pc (ri) = PL
1 so S(P)
S ____________________ dP (14)
r2¨ri ¨ A pco2 r c
An expression for r is obtained from Eq. (9)
r = r2 1 _____________________________________________________________ (15)
\ y2 Apco2 r22
and we obtain
1 __________________ JPrLS(Pc)
____________________________________ dP (16)
(r2¨ r,)Apco2r2
1 _________________________________
Ay2 Apco2r22
with additional mathematical manipulation, this yields the
Hassler-Brunner integral equation
S(.13,,)
of, = COS 2 (a 12) ______________ dP, (17)
PC
1 sin2 a
A Pri,
where
cos a = ¨r
r2
r1+ r2
cos 2 (a/2) = + COS a) 12=
2r2
and
12
CA 02524993 2005-10-31
r2
sin2 a =1- cos2 a =1-
r2
Equation 17 cannot be directly solved for the
unknown function S. As pointed out by Hassler and Brunner,
for small values of ce (short core) , the acceleration
gradient along the core can be neglected. Assuming ri/r2
1, then
cos2(al2) =1 and sin2 a =0
It should be emphasised that this assumption
conflicts with other two assumptions from section 1Ø
Equation 17 is then reduced to
SP, =J S(Pe)dp, (18)
whose differential form is
d -
S = _______ (SPõ) (19)
dPeL
The value of Pc/ for each centrifuge speed is then
computed from Eq. (12), and the average saturation for each
core is obtained from the dry and saturated weights and the
corresponding stroboscope reading.
Fig. 3A shows a typical apc, as a function of
Pci and points indicated on the curve are the first, second
and third speed etc. The value of saturation that
corresponds to each value of Pci, which now represents the
13
CA 02524993 2005-10-31
capillary pressure, is obtained from this curve by graphical
differentiation according to Eq. (19). A typical plot of Pc
as a function of S is shown in Figure 3B.
Equation (19) is an approximate solution
introduced by Hassler and Brunner. Based on Equation (17),
a number of other approximate solutions have been developed
and used to determined capillary pressure curves. These
methods have been reviewed by Ruth and Chen in D. Ruth and
Z. Chen, The Log Analyst 36, 21 (1995), as well as Forbes in
P. L. Forbes, Proceedings of the International Symposium of
the Society of Core Analysts, Calgary, Sept. 8-10, (1997).
However, in 1993, a survey on centrifuge capillary
pressure measurements was conducted by the Society of Core
Analysts to evaluate how the different methods of
implementing the centrifuge technique impact the results.
The results of the survey were analyzed and discussed by
Ruth and Chen. This survey revealed many problems with
respect to designing and performing a centrifuge experiment
and interpreting the experimental data.
As indicated above, a complete capillary pressure
curve usually requires about 15 speeds and may take one to
several days to acquire. Several samples are generally run
simultaneously. A very low rotational speed is required to
determine the entry pressure, especially, for high
permeability samples, since wetting-phase saturation may
drop dramatically at the first rotational speed. The
minimum rotational speed is limited by the cut-off speed of
the centrifuge. The SCA survey showed that wetting-phase
saturation at the first rotational speed dropped
dramatically from 100% to 50%, or even less than 30% for
capillary pressure measurements. For low permeability
14
CA 02524993 2005-10-31
samples, the limit on the highest rotational speed of
centrifuge rotor may result in the loss of data on residual
wetting phase saturation. This was a common occurrence in
the SCA survey reports. Unfortunately, the requirement for
minimum and maximum rotational speed results in a serious
gravity effect and the violation of the outlet boundary
condition, respectively, as discussed above. Therefore, the
traditional centrifuge technique has a number of problems
which would be desirable to solve.
Summary of the Invention
According to the present invention, there is
provided a method of measuring a parameter in a sample,
comprising: mounting a sample for rotation about an axis
such that different portions of the sample are spaced at
different distances from said axis; rotating the sample
about said axis; measuring a first parameter in said
different portions of said sample, and determining the value
of a second parameter related to the force to which each
portion is subjected due to said rotating of said sample.
Also according to the present invention, there is
also provided an apparatus for measuring a parameter in a
sample, comprising: a sample holder for rotating a sample
about an axis such that different portions of said sample
are spaced at different distances from said axis; measuring
means for measuring a first parameter in said different
portions of said sample, and generating means for generating
data comprising the values of said first parameter and
associated with each value, the value of a second parameter
relating to the force to which each portion is subjected due
to rotation of said sample about said axis.
CA 02524993 2005-10-31
The present invention is predicated on the
recognition that the force to which a rotating body or
sample is subjected varies as a function of distance from
the rotational axis, and exploits this principle to measure
one or more parameters in a sample such as fluid
distribution as a function of a parameter related to
centrifugal force, such as capillary pressure. Therefore,
rather than varying the angular velocity to obtain a
variable force, embodiments of the present invention
maintain the angular velocity constant and "vary" the force
by varying the distance from the rotational axis at which
the desired parameter(s) is/are measured.
In some embodiments, the sample comprises solid
material and a material capable of movement relative to the
solid material when subjected to a force. For example, the
sample may comprise a porous material and the movable
material may comprise a fluid.
In some embodiments, the step of measuring the
first parameter comprises measuring the parameter by imaging
the portions of the sample. The imaging may comprise
magnetic resonance imaging, for example single-point
magnetic resonance imaging, single-point ramped magnetic
imaging, single-point ramped magnetic imaging with Tl
enhancement, centric scan single-point ramped magnetic
imaging, spiral scan single-point ramped magnetic imaging or
any other suitable technique.
In some embodiments, the first parameter is
indicative of the fluid content, i.e. the amount of fluid in
the portions of the sample.
16
CA 02524993 2005-10-31
,
In some embodiments, the second parameter
comprises any one of capillary pressure, acceleration, force
and the distance of each portion relative to the axis.
In some embodiments, the sample contains a first
fluid prior to the measuring step, and the method further
comprises exposing the sample to a second fluid for
introduction into the sample during the rotating step. The
first fluid may be different from the second fluid, and in
some embodiments, the technique for measuring the first
parameter and/or the fluids are selected so that the
measurements discriminate between the fluids allowing the
first parameter of one of the fluids to be measured. In one
embodiment, the fluids may comprise heavy water and oil,
respectively, and the measuring technique chosen so that the
oil distribution in the sample can be measured as distinct
from the heavy water distribution. This technique is
particularly useful when conducting primary drainage,
imbibition and secondary drainage measurements, for example
on reservoir rock.
In some embodiments, the step of mounting the
sample for rotation comprises mounting the sample such that
a portion of the sample extends either side of the
rotational axis. For example, the sample may be disk-shaped
with the axis of the disk coaxial with the axis of rotation.
Advantageously, this arrangement allows the sample and
centrifuge to be more compact along the radial direction
than the rotor components and sample holder assembly of a
conventional centrifuge. This also allows the centrifuge to
be mounted in an MRI instrument obviating the need to remove
the sample from the centrifuge in order to make MRI
measurements. As the radius of the rotating parts can be
less, vibration and frictional heating can also be reduced.
17
CA 02524993 2005-10-31
In addition, the use of a disk-shaped sample allows 2D MRI
measurements to be made increasing the signal-to-noise
ratio. Furthermore, the use of a circular disk eliminates
radial effects on the measurement.
Embodiments of the present invention provide a
simple methodology which requires only a single moderate
centrifuge speed, readily achievable on a low cost desktop
centrifuge. Unlike the conventional methods, the present
methodology does not require measuring the fluid expelled
from a core. Embodiments of the method recognize that the
centrifugal pressure varies longitudinally along the core,
which leads to a variable longitudinal fluid saturation.
Embodiments of the method measure the fluid remaining inside
the core, spatially resolved along the length of the core
(or radius for a disk-shaped sample), after centrifugation.
The spatially resolved fluid saturation measurement can be
rapid and, in some embodiments, uses MRI technology
developed by the University of New Brunswick MRI Centre.
The measurement may be implemented on a low cost, low field,
permanent magnet based desktop MRI instrument.
Advantageously, the method of embodiments of the
present invention allow the capillary pressure curve to be
measured using a single-speed centrifuge experiment and one
dimensional magnetic resonance imaging for porous media,
such as rock core samples. Embodiments of the method are
rapid, accurate, and relatively inexpensive. The method can
be rapid because centrifugation is required at only one
centrifuge speed. With a one dimensional saturation
profile determined by MRI, a complete capillary pressure
curve, with approximately 40 data points can obtained. The
process can be approximately 15 times faster than a
traditional measurement with 15 data points, corresponding
18
CA 02524993 2005-10-31
=
to 15 centrifuge speeds. The measurement is accurate,
because there are no assumptions of linearity for the
centrifugal field over the length of a core plug. Since a
single, moderate centrifuge speed can be employed, the speed
can be set so that the effect of gravity will be very small
and the outlet boundary condition of the core plug (or disk)
can be satisfied. In addition, friable and unconsolidated
rock samples may be used with embodiments of the method,
since extreme rotational speeds are not required. The
measurements may be performed using only a small and
inexpensive desktop centrifuge and a desktop permanent
magnet based one dimensional MRI system, although any other
suitable MRI instrument and measuring technique could be
used, including 2D and 3D imaging.
According to an aspect of the present invention,
there is provided an apparatus comprising a magnetic imaging
system and a sample holder rotatably mounted in said
magnetic imaging system.
Also according to this aspect of the invention,
there is provided a method comprising rotatably mounting a
sample in a magnetic imaging system, rotating said sample to
subject the sample to a centrifugal force, and measuring a
parameter in said sample.
Advantageously, this arrangement allows a sample
to be conditioned in a centrifuge and then measured using
MRI, while the sample is situ in the centrifuge.
Brief Description of the Drawings
Examples of embodiments of the present invention
will now be described with reference to the drawings, in
which:
19
CA 02524993 2005-10-31
,
Figure la shows a side view of a centrifuge
apparatus;
Figure lb shows a top view of the centrifuge
apparatus shown in Figure la;
Figure 2 shows a set of experimental data points
of rotational speed and production volume for a traditional
method;
_
Figure 3a shows an example of a SPõ_,L curve from
a conventional measurement technique.
Figure 3b shows an example of a S-P, curve derived
from Figure 3a.
Figure 4a shows a capillary pressure distribution
along the length of a sample;
Figure 4b shows a graph of the water saturation
distribution along the length of a sample;
Figure 5 shows a schematic diagram of an MRI
measurement system;
Figure 6 shows a data structure according to an
embodiment of the present invention;
Figure 7 shows a representation of RF pulses and
field gradients used to perform double half k-space SPRITE
imaging;
CA 02524993 2005-10-31
Figure 8 shows a semi-logarithmical plot of free
induction decay (FID) for a fully water saturated Berea
sandstone;
Figure 9 shows a one dimensional water content
distribution along the length of the Berea sandstone for
100% saturated state;
Figure 10 shows a one dimensional water content
distribution along the length of a Berea sandstone sample
after centrifugation;
Figure 11 shows a one dimensional saturation
distribution along the length of a Berea sandstone sample
after centrifugation;
Figure 12 shows an example of a capillary pressure
curve of a Berea sandstone sample obtained by a single-speed
centrifuge and MRI;
Figure 13 shows a comparison of capillary pressure
curves of a Berea sandstone sample obtained by a single-
speed centrifuge and MRI, and by mercury intrusion;
Figure 14 shows a one dimensional water content
distribution along the length of a Berea sandstone sample
with 100% saturated state;
Figure 15 shows a one dimensional water content
distribution along the length of a sandstone sample (#125)
after centrifugation;
Figure 16 shows a one dimensional saturation
distribution along the length of the sandstone sample of
Figure 15;
21
CA 02524993 2005-10-31
Figure 17 shows a capillary pressure curve for the
sandstone sample of Figures 15 and 16 obtained by a single
speed centrifuge and MRI;
Figure 18 shows three capillary pressure
distributions along the length of a core corresponding to
different rotational speeds;
Figure 19a shows a schematic diagram of a disk
sample;
Figure 19b shows an embodiment of a sample holder
and centrifuge according to an embodiment of the present
invention;
Figure 20 shows a cross-sectional view of the
sample holder shown in Figure 19b incorporated within an MRI
apparatus according to an embodiment of the present
invention;
Figure 21 shows a two-dimensional MRI image for a
fully water saturated rock disk sample using a spiral SPRITE
MRI technique;
Figure 22 shows a two-dimensional MRI image for
the rock disk sample of Figure 19A after centrifugation at
1920 RPM in air;
Figure 23 shows a graph of the water saturation
distribution along the radii of the sample disk core after
centrifugation at 1920 RPM in air;
Figure 24 shows a capillary pressure curve derived
from the data of Figure 23 for the disk sample obtained by
single speed centrifuge and SPRITE MRI;
22
CA 02524993 2005-31
Figure 25 shows a graph of the water saturation
distribution along the length (z) of a core #126 after
centrifugation at 3000 RPM in oil for 24 hours for a primary
drainage capillary pressure measurement;
Figure 26 shows the water saturation distribution
along the length (z) of the core #126 after centrifugation
at 3000 RPM in water for 48 hours for imbibition capillary
pressure measurement;
Figure 27 shows the water saturation distribution
along the length (z) of the core sample #126 after
centrifugation at 3000 RPM in oil for 48 hours for secondary
drainage capillary pressure measurement; and
Figure 28 shows a graph of the capillary pressure
curves obtained by single speed (3000 RPM) centrifugation
and sprite MRI for primary drainage (circle), imbibition
(square) and secondary drainage (triangle).
Description of Embodiments
Figures la and lb show a schematic diagram of a
centrifuge for use in spinning a sample as part a capillary
pressure measurement, as described above, and which may be
used in apparatus and methods of embodiments of the
invention. The centrifuge comprises a motor 1 having a
shaft 3 which rotates about a rotational axis 5, an arm 7
extending from the shaft 3 and a sample holder 9 pivotally
connected to the arm 7 about a pivotal connection point 10
at the end 15 of the arm, so that the sample holder is free
to swing up and down. The sample holder comprises a
removable sealed end part or closure 13 at the inner end 15
and a porous plate 17 which divides the interior of the
sample holder into a first chamber 19 for containing a
23
CA 02524993 2005-10-31
,
porous sample and a second chamber 21 at the distal end
thereof for collecting liquid 22 expelled from the sample
through the porous plate 17.
The sample has an inlet face 23 spaced at a
distance r1 from the rotational axis 5 and an outlet face 25
spaced at a distance r2 from the axis 5. r is the distance
of any point in the sample from the rotational axis.
Figure 4a shows a graph of the capillary pressure
distribution along the length of the sample between r1 and r2
(i.e. the inlet and outlet faces of the sample) after the
sample has been spun in the centrifuge, and Figure 4b shows
a graph of the water saturation distribution along the
length of the sample.
In a conventional centrifuge experiment, a liquid
saturated core plug, confined in the holder, is spun at
different rotational speeds. The core holder contains
another fluid which replaces the fluid displaced from the
core. In the simplest case this fluid is air and it
displaces water from an initially saturated core. The fluid
saturation S is written as Sw in Figure 4b.
The longitudinal water saturation of the core,
varies from a low level at the inlet end-face, where the
capillary pressure is a maximum, to a maximum water
saturation of 100% at the outlet end-face, where the
capillary pressure is zero, as shown in Figures 4a and 4h,
respectively. The longitudinal fluid saturation
distribution can not be directly determined with traditional
measurements, which must assume a model saturation function,
as described above.
24
CA 02524993 2005-10-31
The method of the present invention does not need
to assume a model saturation function. If a cylindrical
core of length L is subjected to an acceleration ac = w2r,
where w is the angular velocity of the centrifuge and r is
the distance from the axis of rotation, then the gradient of
capillary pressure is determined by Eq. 8, where Ap is the
density difference between the wetting and non-wetting
fluids. Integration over distance r, with the capillary
pressure assumed to be zero at the outlet end, P2 = 0,
yields a simple prediction of the variation of the capillary
pressure as a function of distance r, according to Eq. 11.
The fluids involved determine the density
difference, and the centrifuge determines w and r.
Embodiments of the present invention provide a method of
determining the saturation S as a function of r and provide
the capability to directly determine Pc(r) as a function of
S(r) which is the capillary pressure curve.
The fluid saturation, S, may be measured by using
any suitable technique, for example imaging techniques such
as magnetic resonance imaging. Any suitable, conventional
MRI imaging system may be used, for example a commercially
available MRI system having superconducting magnets which
are capable of generating relatively large static magnetic
fields, or a smaller MRI instrument, for example a desktop
mounted instrument which uses non-superconducting magnets to
generate the static magnetic field, an example of which is
shown in Figure 5.
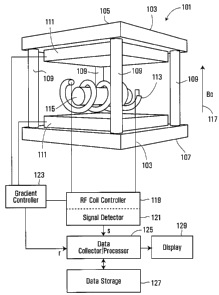
Figure 5 shows a schematic diagram of an imaging
system comprising a low field permanent magnet and gradient
set, as well as an RF coil system for MRI measurements. The
imaging system 101 comprises a permanent magnet having
CA 02524993 2005-10-31
spaced apart magnetic pole pieces 105, 107, spacers (e.g.,
pillars) 109 separating the magnetic pole pieces 105, 107, a
gradient set 111, and an RF coil 113 which surrounds a
sample (for example, a rock core sample) 115. The arrow 117
shows the direction of the magnetic field, Bo. The RF coil
and gradient set 111 are connected to external control
circuits.
The imaging system further comprises an RF coil
controller 119 for generating and delivering RF pulses to
the coil, and a signal detector 121 for detecting the
magnetic induction signal from the coil. A gradient
controller is provided for controlling the field gradient
and supplies gradient control signals to each coil of the
gradient set for scanning. The gradient set may include
coils for scanning in any one or more of the x, y and z
directions. The imaging system includes a data
collector/processor 125 for receiving data from the signal
detector 121 and gradient controller 123, a memory 127 for
data storage, and an optional display 129.
The gradient controller provides data to the data
collector/processor unit 125 which is indicative of the scan
position along the sample core, e.g. the value of r or data
from which the value of r can be determined. Using this
information, the data processor can determine the values of
capillary pressure from equation 11.
The signal detector provides a signal or data to
the data collector indicative of a parameter of the detected
magnetic induction signal from the RF coil and from this
information determines the relative saturation of the
sample. It has been found through experiment that the
intensity of the free induction decay signal is substantial
26
CA 02524993 2005-10-31
proportional to the local water content and therefore a
measurement of the ratio of the intensity of the signal
after centrifugation to the intensity of the signal when the
sample is saturated provides a measurement of the relative
fluid saturation. An example of an MRI measurement
technique which may be used to measure the relative fluid
saturation is described in detail below.
Generally, values of the measured parameter, such
as fluid content, in different portions of the sample may be
acquired and processed using any suitable technique, and the
data acquisition system shown in Figure 5 is just one
example. Data collected and/or processed by the data
collector/processor 125 such as values of capillary pressure
and relative fluid content may be stored in the memory. A
visual representation of the data, for example a
two-dimensional plot may optionally be generated and
presented on the display 129 or a printer (not shown).
An example of a data structure containing
correlated values of the first and second parameters which
may be stored in a memory such as the memory 129 shown in
Figure 5, or another storage device, is shown in Figure 6.
In this data structure 151, the first parameter 153
comprises, for example a parameter related to fluid content
in the sample measured at different distances from the axis
of rotation, and the second parameter 155 is related to the
force to which each portion of the sample at which the first
parameter is measured is subjected due to rotation about the
rotational axis and may comprise, for example, capillary
pressure.
In one embodiment, a quantitative pure phase
encode MRI methodology developed by University of New
27
CA 02524993 2013-12-05
Brunswick is used to measure the local fluid content in a core
prior to centrifugation, and then immediately following
centrifugation.
The standard SPRITE (single-point ramped imaging with
T1 enhancement) imaging technique has proven to be a very
robust and flexible method for the study of a wide range of
systems with short relaxation times. This method is described in
Balcom, B. J., MacGregor, R. P., Beyea, S. D., Green, D. P.,
Armstrong, R. L. and Bremner, T. W. "Single Point Ramped Imaging
with Ti Enhancement (SPRITE)", J. Magn. Res. A (1996) 123, 131-
134. As a pure phase encoding technique, SPRITE is largely
immune to image distortions generated by susceptibility induced
magnetic field variation, chemical shift, and paramagnetic
impurities. Repetitive excitation and acquisition are performed
in the presence of ramped or stepped phase encoding gradients,
which enable systems with T2* lifetimes as short as tens of
microseconds to be successfully visualized.
The standard SPRITE technique is however a
longitudinal steady state imaging method, the image intensity.is
related to the longitudinal steady state, which not only
decreases the signal-to-noise ratio, but also introduces many
parameters into the image signal equation, such as the
repetition time, spin-lattice relaxation time, RF flip angle, as
well as the phase encoding time, effective spin-spin relaxation
time, and spin density.
A centric scan strategy for SPRITE imaging removes the
longitudinal steady state from the image intensity equation, and
increases the inherent image intensity, as described in
28
CA 02524993 2013-12-05
Mastikhin, I. V., Balcom, B. J., Prado, P. J. and Kennedy, C. B.
"SPRITE MRI with Prepared Magnetization and Centric k Space
Sampling", J. Magn. Res. (1999) 136, 159-168. The image signal
intensity, with appropriate conditions, no longer depends on the
spin lattice relaxation time and the repetition time. These
features of centric scan SPRITE make it an ideal method for
quantitative imaging of short relaxation time species in porous
media.
Double Half k-Space 1D MRI
For a conventional full k-space SPRITE method, data
acquisition starts from one extremity of k-space (Gmax) then
increments to the other extremity of k-space (-Gmax). The center
of k-space is sampled when the longitudinal magnetization
approaches the steady state, with the signal intensity given by
1-E . (20)
S = M exp(¨ sin a
1-CE 7;
Where Mo is the equilibrium magnetization, C= cos ,
is the RF
flip angle, E = exp (-TR/T,), tp is the phase encoding time, T,*
is the effective spin-spin relaxation time, and
is the flip
angle.
In order to remove the effect of the longitudinal
steady state, second term of Eq. (20), from the signal
intensity, a double half k-space technique is introduced. In
this technique as shown in Figure 7, the k-space data are
collected sequentially from '0 to --lc, corresponding to a
gradient change from 0 to minus maximum gradient (-Gmax), after
a delay, for example of about 5 times T1 or longer, the
29
CA 02524993 2005-10-31
other of half k-space data is sampled from 10' to 14-k,',
corresponding to a gradient change from 0 to a maximum
gradient (Gmax). In the centric
scan SPRITE method, the observable local sample
magnetization (S) is given by:
S =Mo exp(-4)sin a (21)
where Mo is the equilibrium magnetization, tp is the phase
encoding time, T2* is the effective spin-spin relaxation
time, and ce is the flip angle. Mo is proportional to local
fluid content. Centric scan SPRITE methods are naturally
spin-density weighted.
In a 1D centric scan SPRITE profile, the local
image intensity (Simage) is given by Eq. 20, where F40(r) is
the equilibrium magnetization which is proportional to local
fluid content, tp is the phase encoding time, T2* is the
effective spin-spin relaxation time, and c is the RF flip
angle. The trigonometric term is a constant; if tp is T2*
the local image intensity is directly proportional to the
local fluid content. If the phase encode time tp is not
T2* (typically hundreds of usec in realistic porous
materials) the local image intensity is still proportional
to the local fluid content since it has been observed that
T2* is usually single exponential in realistic porous media
(unlike the time constant T2), and invariant with the local
fluid content. The local saturation in the core S(r) is
thus determined by taking the ratio of the MRI image of the
core after centrifugation, and before centrifugation, S(r) =
Simage (r) after / Simage (r) before =
CA 02524993 2005-10-31
For the double half k-space SPRITE imaging pulse
sequence, repetitive RF excitation and data acquisition is
performed in the presence of a ramped phase encoding
gradient, in this case, G. A single short duration RF pulse
is applied after the magnetic field gradient has been
switched and allowed to stabilize for each step. As the RF
pulse is applied in the presence of a magnetic field
gradient, its duration must be short enough to irridate the
overall distribution of frequencies introduced by the
gradient. After a fixed duration phase encoding time, tp, a
single complex datum point is acquired on the NMR free
induction decay signal. The gradient changes from 0 to
minus maximum gradient (-Gzmax) , after a delay of five times
of T1, the gradient changes from 0 to maximum gradient
(Gzmax). After each repitition time TR, the value of the
applied gradient, Gz, is incremented for one-dimensional
sampling. Sixty four steps, each on the order of 1 ms
duration of TR may typically employed, although any other
number of steps may be used. The image is reconstructed
with Fourier transformation of the spatially encoded
experimental data.
A single exponential of FID
For rocks, experimental results show the NMR line
broadening is frequently dominated by the effect of internal
magnetic field distortions induced by susceptibility
differences between the pore fluid and the solid matrix. The
free induction decay (FID) is frequently observed to be
single exponential, with the spin-spin relaxation time (T2)
decay usually multi-exponential. Proton-density imaging is
readily obtained with equation (22) by single exponential
fitting the FID data from a series of Centric Scan SPRITE
images with variable encoding times, t = tp.
31
CA 02524993 2005-10-31
Figure 8 shows an example of a semi-logarithmical
decay curve of the NMR signal, observed after a 90 degrees
RF pulse. The data was fitted to the equation:
S = Mo exp(-t/T2*) (22)
Where S is the NMR signal intensity, Mo is the
equilibrium sample magnetization, t is the acquisition time,
and T2* is the effective spin-spin relaxation time. The fit
T2* was 127 As. The FID has a single exponential decay over
2 orders of signal intensity. In experiments carried out by
the inventors, the value of T2* of the Berea sandstone
samples examined varied from 114 As to 127 As when the water
saturation was varied from 9.1% to 100%. For Centric Scan
SPRITE images with a tp of 30 As, assuming the term exp(-
t/T2*) is constant in Equation (22) with water saturation
changes, causes a relative error of less than 2%. Under
these experimental conditions, Centric Scan SPRITE images
are essentially proton-density images. The single
exponential decay of the FID at different water and air
saturation, with T2* largely insensitive to water and air
saturation, has been observed for many sedimentary rocks.
This feature makes it easy for centric scan SPRITE
to obtain spin density imaging two ways: (1) ensure the
phase encoding time is much shorter than T2* for longer T2*
samples; (2) acquire multiple FID data points and fit the
data sets with a single exponential with equation (22) for a
range of phase encoding times to reconstruct spin density
images with extrapolated data.
For the measurement of water saturation of rocks
after centrifugation, 1D double half k-space SPRITE image
intensity before and after centrifuge can be expressed as
32
CA 02524993 2005-10-31
M = Mo exp(¨ P ) sin a (23)
T;
M =M00 exp( P ) sin a (24)
T2*,,
where M and Ma are the observable local sample magnetization
before and after centrifugation, respectively. Mo and Moa
are the equilibrium sample magnetizations before and after
centrifugation, respectively. T2* and T2a* are the effective
spin-spin relaxation times before and after centrifugation,
respectively.
The water saturation after centrifuge can be
calculated from equation (24) divided by equation (23). The
calculated water saturation (Sw) is therefore
Ma M t
O
Sw= = a eXp(P tP ) (25)
M Mo T'2* 7'2µ,
As T2* is approximately independent of changes of
water saturation in sedimentary rocks, the exponential term
in equation (25) is approximately equal to 1. So, the
direct ratio of the water content profiles can be used to
calculate the spatially resolved water saturation along the
length of the core.
The range of capillary pressure distribution in a
sample may be increased either by increasing the length of
the sample and/or increasing the rotational speed of the
sample in the centrifuge.
33
CA 02524993 2005-10-31
In measuring the capillary pressure curve using a
single speed, the rotational speed should be selected to be
sufficiently large to ensure that an irreducible water
saturation is reached at the inlet face of the sample core.
The inventors have found that an estimate of the capillary
pressure for irreducible water saturation may be obtained as
follows.
The Leverett J function provides an approximation
for the behaviour of rock samples based on numerous
measurements and is given by the equation:
J= _________
o-cos9 \
where k is permeability, and (1) is porosity.
Based on this function, the rotational speed, w,
for reaching the irreducible water saturation (Swi) may be
estimated by the equation
P,(r1)= ¨1Apco2 (r22 ¨ r,2 ) J(S wi)cr cos BIAlk10 (27)
2
or
2J (S wi)o- cos 0
w2 > (28)
Ap(r22 ¨ r12).Nik I (15
Reasonable Leverett J values at irreducible water
saturation, J(S) are in the range of 3-4, as described in
34
CA 02524993 2005-10-31
Brown H. W., Capillary pressure investigations, Trans. AIME,
192, 67 (1951).
The capillary pressure required to reach
irreducible water saturation can be estimated using
formula 27. Thus, for example, in a water and air system,
the fluid contact angle 0 = 0 degrees, a = 72 Mn/m,
permeability k = 0.18 m2, porosity 0 = 0.186, and assuming
J(S1) = 3, the required capillary pressure to reach the
irreducible water saturation at the inlet face of the
sample, Pc(r1)>32.9 Psi.
The rock sample for centrifuge capillary
measurements is generally required to be homogenous, and
magnetic resonance imaging can advantageously be employed to
check the homogeneity of the sample.
The above method for determining the minimum speed
for the centrifuge can be used in any application where it
is desirable to determine this parameter.
Capillary Pressure Curve by Centrifuge and MRI
Specific examples of capillary pressure curve
measurements for two rock samples using embodiments of the
present method and apparatus are described below.
A cylindrical Berea sandstone and an oilfield
sandstone rock core #125 were water saturated under vacuum
conditions. For the Berea sandstone core, its porosity (the
ratio of pore volume to bulk volume of rock) was 18.6%, with
a permeability of 0.18 m2. The sample length was 52 mm with
a diameter of 25 mm. For the sandstone core #125, the
porosity was 27.6%, with a permeability of 0.372 m2. The
sample length was 51.5 mm with a diameter of 25 mm.
CA 02524993 2005-10-31
The Berea sandstone samples employed in these MRI
centrifugation experiments, and complementary mercury
intrusion experiments, were extracted from the host rock in
close proximity to one another. We thus assume they have a
similar pore structure due to the homogeneity of the
respective Berea sandstone formations.
The centrifugation experiments were carried out
with a Beckman TJ6R tabletop centrifuge at 4 C in air and at
1500 RPM for 2 hours for Berea sandstone and at 750 RPM for
35 minutes for rock #125. The centrifuge radius to the
bottom of rock was 13.8 cm. The cylindrical surface of the
core sample was wrapped with Teflon tape to ensure
longitudinal fluid flow within the core.
All NMR experiments were performed in a 2.4T
horizontal bore superconducting magnet (Nalorac Cryogenics
Inc., Martinez, CA) with an Apollo console (Tecmag Inc.,
Houston, TX). For all NMR experiments, a proton-free 47 mm
inner diameter eight-rung quadrature birdcage probe (Morris
Instruments, Ottawa, ON) was employed. The core samples
were wrapped with Teflon tape to decrease the evaporation of
water within the samples during MRI measurements.
1D water content profiles of the rock before and
after centrifugation were obtained by 1D double half k-space
SPRITE MRI with a phase encoding time of 30 s, flip angle a
of 6 degrees, for a field of view of 9 cm, with an image
matrix size of 64 points, nominal resolution 1.4 mm. Four
signal averages were collected for a total scan time of 25
seconds.
Figures 9 and 10 show the 1D water content
distribution along the length of the sample before and after
centrifugation of the Berea sandstone core, respectively.
36
CA 02524993 2005-10-31
*
,
The Berea sample was spun at a single speed of 1500 RPM for
2 hours. After centrifugation, the average water saturation
(Sw) was 46.31% measured gravimetrically. After
centrifugation, the water content gradient along the length
of the core shows the effect of the centrifugation force
distribution along the core. Figures 9 and 10 were
calculated according to equation (25), yielding 1D water
saturation distributions along the length of the Berea core,
as shown in Figure 11. The water saturation at the outlet
surface is equal to 1, which shows that the outlet boundary
condition is satisfied. Thus, MRI can be used to check the
boundary condition for centrifugation experiments.
The capillary pressure distribution along the
length of the core can be calculated through equation (11).
Thus, the relationship between capillary pressure and the
corresponding water saturation can be established very
straightforwardly. The capillary pressure curve is obtained
as, for example, shown in Figure 12. In this example, the
curve contains 37 data points. It may be smoothed through
fitting to a polynomial for further data processing.
The capillary pressure curve obtained with water
and air can be converted to a capillary pressure curve under
mercury intrusion. For a water and air system, a = 72 Mn/m
and 0 = 0 degree; for mercury intrusion, a = 480 Mn/m and 0
= 140 degree. A comparison of the capillary pressure curves
obtained by the new method and by mercury intrusion
porosimetry are shown in Figure 13, and the data indicates
that the two methods are remarkably consistent.
For the sandstone core #125, the water content
distribution along the length of the sample before and after
centrifugation is shown in Figures 14 and 15, respectively.
37
CA 02524993 2005-10-31
During centrifugation, the sample was spun at a single speed
of 750 RPM for 35 minutes. After centrifugation, the bulk
water saturation (Sw) was 49.42% determined gravimetrically.
The 1D water saturation distribution along the length of the
core is depicted in Figure 16. The water saturation at the
outlet surface of the core is 1, indicating that the outlet
boundary condition is maintained. The corresponding
capillary pressure curve is illustrated in Figure 17.
Figure 18 shows three capillary pressure (Ps)
distributions along the length of the core corresponding to
different rotational speeds of 750 RPM, 1000 RPM, and 1500
RPM. The centrifuge radius to the bottom of the core (r2) was
13.8cm. The capillary pressure (Pa) distribution was
calculated according to Equation (11). There are two ways
to increase the range of capillary pressure distribution,
i.e., increase the length of the sample or increase the
rotational speed. The proposed method employed a long
sample and a single moderate rotational speed to create a
large range of capillary pressure distribution and water
saturation distributions.
The rotational speed is required to be
sufficiently large to ensure that an irreducible water
saturation condition is reached at the inner-surface of the
core. An estimate of the capillary pressure for irreducible
water may be obtained by the Leverett J function, as
described in Leverett M. C., Trans. AIME, 142, 152 (1941).
The selected speed will generally be dramatically less than
the maximum speeds employed in the traditional measurement.
The gravity effect on the traditional centrifuge
method has been discussed by Ruth and Chen in D. Ruth and Z.
Chen, The Log Analyst 36, 21 (1995). When running the
38
CA 02524993 2005-10-31
centrifuge, the direction of centrifugal acceleration, a,, at
any point r along the rational distance within the core plug
is perpendicular to the rotational axis, the value of the
centrifugal acceleration is w2r. However, gravity will
result in an inclined acceleration field, and the capillary
pressure inside the core plug is actually counterbalanced by
this inclined acceleration, a,g, which includes both
centrifugation acceleration and gravity acceleration
effects. The angle (0) between acg and a, is given by 0 =
arctan(g/w2r). At low rotational speed during traditional
centrifuge capillary pressure measurement, the effect of
gravity on the centrifugal field can not be neglected.
In addition, the traditional centrifuge method is
time consuming and special instrumentation is required for
the experiment. These disadvantages can all be avoided
through the new methodology.
The rock sample for centrifuge capillary pressure
measurement is assumed to be homogeneous, MRI can be
employed to check the inhomogeneity of core.
The capillary pressure curve, for the same
sandstone reservoir core, is readily determined by plotting
the saturation as a function of the capillary pressure,
determined from Eq. 11, where both are known or determined
functions of r. The MRI centrifuge results agree well with
mercury intrusion porosimetry results.
Advantageously, in this methodology, minimal or no
assumptions are required, unlike the traditional
measurement. Note that the method allows the sample to be
spun at a very moderate rate, for a reasonably short time,
and that implicitly a check (through the MRI measurements)
is available of the outlet boundary condition according to
39
CA 02524993 2005-10-31
which Pc(r2)= 0; and the saturation S(r2) is unity (i.e.
full).
The method allows a wide range of cores with a
wide range of porosity and permeability to be tested,
including challenging cores from marginal reservoirs.
Samples may include water wet and oil wet samples. A sample
diameter of 1 inch may be chosen in keeping with industry
standard core diameters, or samples of any other diameters
may be used.
A determination of optimum and realistic core
rotation speeds, and core lengths, for a wide range of
samples can be made.
A determination of the time to saturation
equilibration can be made for a wide range of samples.
Equilibration is faster for moderate centrifugation speeds
and may be directly checked by MRI measurements. Also a
determination of the maximum permissible measurement time
interval after centrifugation can be made. Centrifugation
creates a non-equilibrium fluid distribution which will
change due to capillarity, diffusion and inlet/outlet drying
once the sample is removed from the centrifuge. These
effects will alter S(r) but may be measured directly by MRI
- as a function of time after centrifugation. The MR
relaxation time behavior of a range of samples as a function
of saturation may also be determined and that T2* is single
exponential at low field with minimal variation with
saturation, may be verified.
Irrespective of the detection strategy chosen, the
image acquisition time may be optimized to permit rapid
sample throughput and multiplexed sample analysis.
Measurements may be performed rapidly with centrifugation
CA 02524993 2005-10-31
times of under one hour, and with four (or any other number
of) samples simultaneously. MRI detection times can be
under 10 minutes each. MRI measurement times, in the
simplest case, can be under one minute.
In embodiments of the invention, rotation speeds
of under 2000 rpm would be sufficient for cores of 5 to 6 cm
in length. Higher rotation speeds compensate for shorter
sample length. The MRI measurements permit controlled
measurements of S(r).
Measurements can be performed on a high field (2.4
Tesla) magnet, or on a low field desktop magnet.
Embodiments of the method may use IH MRI measurements, and/or
may also employ RE probes for 2D and 19F experiments.
Embodiments of the apparatus may comprise a
commercial desktop centrifuge adjacent to the low field MRI
system. Sample holders which collect the expelled fluid at
the outlet can be used, and/or sample holders which permit
adding an additional fluid to the inlet end.
In one embodiment, measurement involves a side by
side table top centrifuge and table top MRI instrument.
In other embodiments of the present invention, the
sample holder may be adapted for mounting the sample such
that a portion of the sample extends either side of the
rotational axis. In one embodiment, the sample may comprise
a disk and the sample holder is adapted to hold the disk so
that the centre of the disk is coaxial with the rotational
axis of the centrifuge. Figure 19a shows a schematic
diagram of a disk-shaped sample 201 whose fluid distribution
as a function of capillary pressure is to be measured.
Initially, the disk is saturated with fluid and the fluid
41
CA 02524993 2005-10-31
content is measured along a radius, r, for example from the
centre, x, of the disk to its circumferential edge, c, or
along any portion of the radius. The fluid distribution may
be measured using MRI techniques, described above.
In one embodiment, the disk sample may have an
optional hole or aperture (e.g. aperture 203) formed in the
centre of the disk and which extends partially or completely
through the disk between its opposed flat faces. This may
assist in enabling the disk to draw in fluid during
centrifugation or otherwise. In this case the inner wall of
the aperture effectively becomes the `inlet face' of the
sample, the `outlet face' being the circumferential surface.
The same disk is then mounted in a centrifuge
sample holder, an example of which is shown in Figure 19b.
Referring to Figure 19b, the centrifuge comprises a
motor 401, a drive shaft 403 which rotates about a
rotational axis 405, a sample disk holder 407, which in this
embodiment is cylindrical, (but could be any other shape) a
removable end closure 409 at one end of the disk holder and
fastening means 411, for example an arrangement of bolts
and/or nuts (or other fastening mechanism), for securing the
sample in the holder.
Using a sample which extends across the axis of
rotation, such as a disk-shaped sample allows the rotary
elements of the centrifuge, such as the sample holder to be
more compact. As data points can be measured along a number
of different radii of the sample, a better signal-to-noise
ratio can be obtained. Furthermore, with a circular disk,
the value of r2 for the outlet boundary is constant and
precise, in comparison to a longitudinal sample having a
flat outlet end, where r2 is an approximation. Accordingly,
42
CA 02524993 2005-10-31
using a circular disk eliminates these 'radial' effects,
thereby increasing the accuracy of the measurement. In
addition, as the rotary components of the centrifuge can be
radially more compact, and the sample lighter, the moment of
inertia is reduced, causing less vibration and frictional
heating, and also enabling the sample to be spun at higher
speeds. In some embodiments, the diameter of the disk may
be 10 to 12 cm, whereas the rotor and sample holder assembly
of a conventional centrifuge typically has a diameter of 30
to 50 cm.
In practice, the sample is treated, e.g. saturated
with a fluid such as water before being mounted in the
sample holder and is then spun in the centrifuge.
Saturation may be achieved by immersing the sample in fluid
(liquid) and applying a negative pressure e.g. vacuum to the
liquid (surface) to draw the fluid into the sample and
displace air or other fluid from the sample.
In embodiments of the present invention, the
sample holder may be mounted either externally of an MRI
system or within an MRI system. Advantageously, this latter
arrangement eliminates the need for removing the sample from
the centrifuge and mounting a sample in the MRI instrument,
and therefore simplifies the measurement procedure and saves
time.
An example of an arrangement in which a sample
holder is mounted within an MRI system is shown in
Figure 20. In Figure 20, the sample holder is the same as
that shown in Figure 19b, and is shown in cross-section.
The MRI system comprises a permanent magnet 423, a gradient
set 424 and an RF coil 425. The sample holder 407 has upper
and lower shafts 402, 403 extending therefrom and comprises
43
CA 02524993 2005-10-31
a chamber 408, the lower portion 410 of which serves as a
liquid collector for collecting liquid 406 expelled from the
sample during centrifugation. The sample holder has an
upper sample disk holder plate and closure 409 (which is
coupled to the upper shaft 402) and a lower sample disk
holder plate 413, between which is mounted a sample disk
413. Advantageously, this configuration allows the sample
to be held in place by clamping which obviates the need to
make holes in the sample or otherwise modify the sample for
fastening to the holder.
An aperture 416 may be formed in a central region
of the lower disk 414 to assist in allowing the disk to draw
in fluid (e.g. air, water or oil) to replace fluid expelled
from the sample. The aperture may permit fluid
communication with an aperture (e.g. 203 in Figure 19A) if
one is provided. The sample disk may have a typical
diameter of 10 to 12 centimetres and a thickness of about 1
centimetre, for example, although any other suitable
dimensions may be used. The sample is clamped between the
upper and lower plates by means of bolts and nuts 411, 412
or other suitable means. A platform 415 is provided to
support the permanent magnet. In this embodiment, the lower
portion of the sample holder extends below the bottom of the
RF coil 425 so that expelled liquid from the sample disk
resides outside the RE coil.
An arrow 417 shows the direction of the magnetic
field Bo. A circular arrow 419 shows the spin direction of
the rock disk holder, although in other embodiments the spin
direction may be reversed. The amount of liquid within the
spinning rock disk can be monitored by NMR bulk
measurements, such as free induction decay and CPMG (Carr-
Purcell-Meiboom-Gill). After a hydrostatic equilibrium
44
CA 02524993 2005-10-31
,
state is reached, the spin is ceased, and 2D MRI imaging is
carried out along the YZ plane (with reference to
Figure 19A) to obtain the 2D liquid distribution within the
rock disk. This distribution is analyzed to determine S(r),
the saturation radially. It is to be noted that the
components of the apparatus shown in Figure 20 are not
necessarily to scale, and the magnet is rotated 900 from
Figure 5.
Examples of Capillary Pressure Curve Measurements Using a
Disk Sample
An example of a procedure for measuring the
primary drainage capillary pressure curve of a rock disk
sample in a rock disk centrifuge is as follows.
1. The rock disk sample is dried at an elevated
temperature of for example 80 C, until a constant weight is
reached, and the weight of the dried sample is determined.
2. The rock disk sample is kept under vacuum
conditions for a period of time, for example 24 hours, and
then saturated with distilled water (H20) under vacuum
conditions, until no bubbles are released from the rock disk
sample. The weight of the saturated sample is then
determined. The difference between the weight of the
saturated sample and the dried weight provides the total
weight and total volume of water in the saturated sample.
3. A proton (HI) Spiral SPRITE MRI measurement is
carried out on the rock sample which may be wrapped with a
fluid impervious tape such as Teflon, to decrease the
evaporation of water from the sample during MRI
measurements. A water distribution along the radii of the
CA 02524993 2005-10-31
,
sample is obtained and normalized with total volume of water
in the rock disk sample.
4. The rock disk sample is placed in a rock disk
sample holder (which may be non-magnetic) for centrifugation
at a selected speed for a predetermined time. In a specific
example, the sample was spun at 1920 RPM for one hour for
the primary drainage capillary pressure curve measurement.
5. The MRI measurement of step 3 is then repeated to
provide the water saturation distribution along the radii of
the rock disk sample after centrifugation. The total volume
of water in the rock disk sample after centrifugation is
also determined.
6. A water distribution along the radii of the sample
is obtained and normalized with the total volume of water in
the rock disk sample after centrifugation.
7. The water saturation (Sw) distribution along the
radii of the rock disk sample after centrifugation was
determined from the volume normalized water distribution
after centrifugation divided by the volume normalized water
distribution before centrifugation. The capillary pressure
curve is determined with saturation distribution and
capillary pressure distributions along the radii of the rock
disk sample.
Experimental Results
In one specific experiment, a Berea sandstone disk
was used having a diameter of 4 inches and a thickness of
half an inch. The capillary pressure measurements were
conducted according to the experimental procedure described
above.
46
CA 02524993 2005-10-31
Centrifugation of the sample was performed using a
spinning rock disk non-magnetic sample holder and centrifuge
as shown in Figures 19 and 20. The sample was spun at a
speed of 1920 RPM for one hour. The temperature of the
centrifuge was controlled and maintained at a temperature of
4 C to reduce or avoid evaporation of water within the rock
disk sample during the centrifugation process.
The water distribution was determined using a
SPRITE MRI measurement performed in a 2.4 Tesla horizontal
bore superconducting magnet available from Nalorac
Cryogenics Inc., Martinez, CA, with an Apollo console from
Tecmag Inc., Houston, TX. A 14 cm inner diameter eight-rung
quadrature birdcage probe, from Morris Instruments, Ottawa,
ON, was employed. As indicated above, the core samples were
wrapped with Teflon tape to decrease the evaporation of
water from the samples during MRI measurements.
A two-dimensional image of the sample in the x, y
plane was measured for a predetermined value of z, the
position of the plane along the sample axis. The two-
dimensional images before and after centrifugation were
obtained using a Spiral SPRITE MRI technique, which involves
increasing the x and y gradients in a progressive manner
which avoids both field gradients having a maximum value at
the same time to increase the signal-to-noise ratio of the
measurement. In one example of the measuring scheme, the
phase encoding time was 50 microseconds, the flip angle a
was 6 degrees, the field of view was 17 cm and the image
matrix size was 64*64 points. For each of 64 points, 64
signal averages were acquired and the total acquisition time
was 3 minutes. It is to be noted that more data points
along the length of the core can easily be obtained by
increasing the image matrix size and/or decreasing the field
47
CA 02524993 2013-12-05
of view of the image, which results in more data points on the
capillary pressure curve.
Figure 21 shows a two-dimensional image of a fully
water saturated rock disk sample using Spiral SPRITE MRI
measurement. Figure 22 shows a two-dimensional image of the
water saturated rock disk sample after centrifugation at a speed
of 1920 RPM in air, again using Spiral SPRITE MRI. After
centrifugation, the average water distribution was 44%.
Figure 23 shows a graph of the water .saturation
distribution along the radii (r) of the rock disk.
The relationship between capillary pressure and the
corresponding water saturation can be determined very
straightforwardly from the data shown in Figure 23 and the
corresponding capillary pressure curve is shown in Figure 24.
The Spiral SPRITE MRI methodology is described in Halse,
M., Goodyear, D. J., MacMillan, B., Szomolanyi, P., Matheson, D.
and Balcom, B. J., Journal of Magnetic Resonance 165, 219 (2003)
and Chen Q., Halse M. and Balcom B. J., Magnetic Resonance
Imaging, 23, 263 (2005). In this imaging technique, the 2D
scanning gradients (e.g. G. and Gy) are ramped sinusoidally
yielding a spiral k-space trajectory. This technique helps
reduce the occurrence of simultaneously high values of the
gradients, thereby improving the signal-to-noise ratio of the
measurement. In other embodiments, any other imaging technique
may be used (either 1D, 2D or 3D).
48
CA 02524993 2005-10-31
The conventional measurement is not used to full
potential because of concerns over its validity, its high
unit measurement cost, and the long measurement time. The
present methodology greatly improves upon indirect
measurements of pore fluid reservoir interactions, such as
core flooding and mercury intrusion porosimetry.
The measurement methods of the present embodiments
can be faster, cheaper and better than traditional
centrifuge measurements. The measurement technique is
particularly suitable in the current exploration climate,
with a renewed focus on difficult or marginal reservoirs, in
difficult and expensive locales.
Embodiments, where centrifugation is performed
within the MRI magnet, may involve spinning a disk like (or
other shaped) sample, whose diameter may be in the range of
2 to 4 inches or any other value, in a turntable-like
fashion. In this case the centrifugal force varies
radially, and either a 1D or 2D MRI analysis of the
capillary pressure and fluid saturation distribution can be
performed. A 2D MRI analysis would be straight forward.
A low field permanent magnet for MRI may be used.
Field drift of the magnet may not be a significant problem
and in an end use instrument the problem is easy to correct
through active temperature control. The desktop centrifuge
may be a completely standard turn-key instrument associated
with a 2D disk-like centrifugation within the magnet. The
entire centrifuge apparatus is preferably both non-magnetic
and non-conducting with the motor, driving the axial spin,
removed from the magnet by at least one meter.
A new method to measure the capillary pressure
curve using a single speed centrifuge experiment and
49
CA 02524993 2005-10-31
magnetic resonance imaging has been described. The
advantages of the method for determining capillary pressure
curve are vastly increased speed of measurement,
dramatically increased precision, and decreased cost through
a more rapid process with an inexpensive desktop centrifuge
and desktop MRI. The new method may use a long core to
directly measure a large range of saturation distribution
along the length of the core at a single moderate speed of
centrifuge, without any assumptions. The capillary pressure
curve can be obtained straightforwardly with 40 to 50
spatial data points, for example. The duration of the
experiment is reduced by a factor of 15 compared to the
traditional method. Since only one moderate centrifuge
speed is employed, the boundary conditions can be maintained
and the centrifuge speed selected to be sufficient so that
the effect of gravity is very small.
The methodology of capillary pressure curve
measurement using a single-speed centrifuge with air
displacing water may be extended to a water/oil system, in
which water displaces oil or vice versa, for primary
drainage, imbibition, and secondary drainage capillary
pressure curve measurements.
Embodiments of the method may be used to perform
drainage capillary pressure curve and imbibition capillary
pressure curve measurements where oil and water phase
displacement occurs during centrifugation. The MRI analysis
allows oil and water phases to be distinguished. This may
be done at least four different ways, (1) water saturation
determination with D20 CD MR), (2) oil saturation
determination with a fluorinated oil (19F MR),
(3) discrimination of 1H containing oil and water by T2
relaxation time analysis combined with MRI, and (4) addition
CA 02524993 2005-10-31
of either oil or water soluble paramagnetic contrast agents
to eliminate signal from either soluble phase. All four
approaches are compatible with MRI.
For a water/oil system, the 1st drainage,
imbibition, and 2'd drainage capillary pressure curves can be
obtained by centrifuge and MRI through the following three
steps.
(1) A reservoir rock core (typical length 5-8 cm), is
saturated with water under vacuum conditions. The core is
positioned in the centrifuge core holder which is oil
filled, a moderate rotation speed is selected to ensure that
the irreducible water saturation can be reached at the inlet
face of the core. This moderate rotation speed may be
estimated by the Leverett J function, as described above.
After the hydrodynamic equilibrium state is
reached, the rotation is ceased. The rock core is taken out
of the holder and sealed with the Teflon tape. A 1D MRI
image is taken along the length of the rock core to
determine the water saturation distribution (S(r)).
Interpretation of S(r) yields the 1st drainage capillary
pressure curve.
(2) The centrifuge core holder is filled with water,
and the core is returned to the core holder with an inverted
direction. The sample is rotated in the centrifuge with a
moderate speed until the hydrodynamic equilibrium state is
reached again. A similar process to procedure (1) is
performed to obtain the water saturation distribution (S(r))
and the imbibition capillary pressure curve determined.
(3) The centrifuge core holder is filled with water
once more, and the core is returned to the core holder with
51
CA 02524993 2005-10-31
an inverted direction. The sample is rotated in the
centrifuge with the moderate speed until hydrodynamic
equilibrium state is reached again. A similar process to
procedure (1) is performed to obtain the saturation
distribution (S(r)) and the 2'd drainage capillary pressure
curve determined.
In order to measure drainage and imbibition
capillary pressure curves where oil and water phase
displacement occurs during centrifugation by MRI, it is
necessary that the MRI measurements distinguish between oil
and water phases, and this may be done at least four
different ways as indicated above.
In some embodiments of the method, any one or more
of primary drainage, imbibition and secondary drainage
measurements may be made using D20 (heavy water) and oil.
Advantageously, a proton (HI) resonance frequency is chosen
so that the MRI measurements do not contain a D20 signal. In
this case, MRI measurements on a sample containing both oil
and D20 will yield the oil distribution only. (Essentially,
the MRI measurements are sensitive to the hydrogen in oil,
but not to the deuterium in heavy water.) The corresponding
water distribution in the sample can be deduced by
subtracting the measured oil distribution from a measured
total volume of fluid within the sample. Examples of
methods for measuring primary drainage, imbibition and
secondary drainage capillary pressure curves or capillary
pressure scanning curves are described in more detail below.
Specifically, embodiments of the method may comprise the
following steps.
1. The cylindrical core sample is dried at an
elevated temperature of, for example 80 C, until a constant
52
CA 02524993 2005-10-31
,
weight is reached, and the weight of the dried sample is
determined.
2. The core sample is kept under vacuum conditions
for a predetermined period of time, for example 24 hours,
and thereafter, the sample is saturated with distilled water
(H20) under vacuum conditions until no bubbles are released
from the core, and the weight of the saturated sample is
determined.
3. The quantity (e.g. weight and total volume) of
water drawn into the sample is determined by subtracting the
weight of the saturated sample from the weight of the dried
sample.
4. The sample is wrapped in a fluid impervious tape
(e.g. Teflon tape) to decrease evaporation of liquid, and an
MRI measurement is carried out on the sample. The MRI
measurement may for example comprise a proton (H1) double
half k-space SPRITE MRI measurement. The measurement
provides a water distribution along the length of the
saturated sample. The saturated water distribution is then
normalized with the total volume of water in the core
sample, as determined in step 3.
5. Distilled water is removed from the sample, and
the sample is saturated with heavy water (D20) instead. This
may be achieved by repeating steps 1 and 2, where in step 2,
the sample is saturated with D20 instead of H20. The
quantity (e.g. weight and volume) of D20 present in the
saturated sample is determined.
6. The saturated core sample is placed in an oil
filled sample holder of a centrifuge for centrifugation to
condition the sample for a primary drainage capillary
53
CA 02524993 2005-10-31
'
pressure curve measurement. The sample is subjected to
centrifugation at a predetermined speed for a predetermined
length of time which is sufficient for the distribution of
oil and D20 in the sample to reach equilibrium. Any suitable
speed may be selected. The time to reach equilibrium
depends on the sample and may be estimated, (e.g. from known
or measured parameters of the sample such as porosity) or
MRI measurements of the fluid distribution may be made at
intervals of time during the centrifugation process and the
equilibrium condition measured. In one specific example,
the centrifugation speed is 3000 RPM and the duration is 24
hours.
7. After centrifugation, the core sample is removed
from the centrifuge and its weight determined. The quantity
of oil drawn into the sample can be determined from the
weight of the oil/D20 saturated sample, and the determined
pore volume of the sample.
8. The sample is wrapped with a fluid impervious tape
(e.g. Teflon) to decrease the evaporation of liquid within
the core sample during MRI measurements, and an MRI
measurement, for example proton double half k-space SPRITE
MRI, is made on the sample. The MRI measurements yield an
oil distribution along the length of the sample, and the oil
distribution is normalized with total volume of oil in the
sample, as determined in step 7.
9. The D20 distribution along the length of the sample
is obtained by subtracting the volume normalized oil
distribution along the length of the sample, found in step 8
from the volume normalized water distribution found in
step 3.
54
CA 02524993 2005-10-31
µ
10. The water saturation (Sw) distribution along the
length of the core sample (after centrifugation) is
determined from the volume normalized D20 distribution after
centrifugation (found in step 9) divided by the volume
normalized H20 distribution before centrifugation (found in
step 3). An example is shown in Figure 25. The capillary
pressure curve for primary drainage is determined from the
saturation and capillary pressure distributions along the
length of the sample.
11. To prepare the sample for an imbibition capillary
pressure curve measurement, the sample is placed in the oil
filled sample holder of the centrifuge in the reverse
direction, i.e. flipped so that the inlet face becomes the
outlet face and vice versa, and the core sample is spun for
a period of time and then stopped. The sample may be
flipped and spun again several times to reach a relatively
uniform irreducible water (D20) saturation (Swi) distribution
along the length of the core sample. The sample will also
contain a relatively uniform oil saturation.
12. The core sample, which now contains oil and an
irreducible D20 saturation distribution along its length, is
placed in a centrifuge sample holder containing D20, for
centrifugation for the imbibition capillary pressure curve
measurement. (For consistency, the sample may be placed in
the same inlet/outlet face orientation as for the primary
drainage measurements.) Centrifugation is carried out at a
predetermined speed for a length of time that is sufficient
for the fluid distribution to reach equilibrium. This time
may be estimated and/or measured, as indicated above. In
one example, centrifugation is performed at 3000 RPM, and a
time period of 48 hours was considered sufficient to reach
equilibrium.
CA 02524993 2005-10-31
,
13. Steps 7-10 are then repeated. Thus, the core
sample is removed from the centrifuge after centrifugation
and its weight is determined. An MR' measurement is carried
out on the sample, which may be wrapped in a fluid
impervious tape to decrease evaporation of the liquid within
the core during the measurement. An oil distribution along
the length of the sample is obtained and normalized with the
total volume of oil in the sample.
The D20 distribution along the length of the sample
is obtained by subtracting the volume normalized oil
distribution along the length of the sample from the volume
normalized water distribution (found in step 3). The water
saturation distribution along the length of the core sample
is then determined by step 10. (An example of a measurement
is shown in Figure 26.) The capillary pressure curve for
imbibition is determined from the saturation and capillary
pressure distributions along the length of the core sample.
14. The core sample is then prepared for a measurement
of the secondary drainage capillary pressure curve. The
core sample is placed in a centrifuge sample holder
containing D20 in the reverse direction (i.e. flipped) from
the previous centrifugation process and is spun in the
centrifuge. The sample is flipped and spun again one or
more times to take up as much D20 as possible and to reach a
relative uniform residual oil saturation (S00 distribution
along the length of the core sample.
15. The core sample is placed into a centrifuge sample
holder containing oil for centrifugation at a predetermined
speed for a period of time for the secondary drainage
capillary curve measurement. The length of time of
centrifugation should be sufficient for the fluid
56
CA 02524993 2005-10-31
distribution in the sample to reach equilibrium. For
example, the centrifugation process may be carried out a
speed of 3000 RPM for a period of time of 48 hours.
16. Steps 7-10 are repeated again. Thus, after
centrifugation, the core sample is removed from the
centrifuge and its weight is determined. An MRI measurement
is performed on the sample, which may be wrapped in a fluid
impervious tape to decrease evaporation of liquid within the
core during the MRI measurements. An oil distribution along
the length of the sample is obtained and normalized with
total volume of oil in the sample. The D20 distribution
along the length of the sample is obtained by subtracting
the volume normalized oil distribution along the sample from
the volume normalized water distribution (found in step 3).
The water saturation distribution along the length of the
core sample is then obtained using the procedure of step 10.
An example of a measurement is shown in Figure 27. The
secondary drainage capillary pressure curve is obtained from
the saturation and capillary pressure distributions along
the length of the core sample.
Experimental Results
In an example of a specific measurement, a
cylindrical sandstone sample #126 was employed. The
dimensions of the sample core were measured to determine the
bulk volume of the rock sample. The capillary pressure
measurements were conducted for primary drainage, imbibition
and secondary drainage according to the experimental
procedures described above.
The centrifuge measurements were made using a
table top centrifuge, specifically model Z513K available
from Hermle Labortechnick, Germany. Each centrifuge
57
CA 02524993 2005-10-31
measurement was carried out at a speed of 3000 RPM for 24 or
48 hours.
MRI measurements were made using a 0.2 Tesla
permanent magnet with an Apollo console available from
Tecmag Inc., Houston, TX. A 3 cm inner diameter solenoid
probe was used. The core sample was wrapped with Teflon
tape to decrease the evaporation of a liquid from the sample
during MRI measurements. The advantages of using a low-
field MRI instrument are that (1) the instrument is cheap
and (2) effective spin-spin relaxation time (T2*) is much
longer than the phase encoding time (tp) for SPRITE MRI, to
ensure that a spin density image is obtained.
In the measurements, decane, which has a
relatively high hydrogen content, was employed as the oil
phase. Other types of oil may also be used, such as crude
oil to simulate reservoir conditions. The fluid content
profiles along the length of the core before and after
centrifugation were obtained by one-dimensional centric scan
SPRITE MRI, with a phase encoding time of 50 s, a flip
angle a of 6 degrees, with an image matrix size of 64
points. 16 signal averages were required for a total
acquisition time of one minute. More data points along the
length of the core can easily be obtained by increasing the
image matrix size and/or decreasing the field of view of the
image, which results in more data points on the capillary
pressure curve.
Figures 25, 26 and 27 show the 1D water saturation
distribution along the length of the core after primary
drainage, imbibition and secondary drainage, respectively.
In particular, Figure 25 shows the water saturation
distribution along the length (z) of a core #126 after
58
CA 02524993 2005-31
centrifugation at 3000 RPM in oil for 24 hours for a primary
drainage capillary pressure measurement. Figure 26 shows
the water saturation distribution along the length (z) of
the sample after centrifugation at 3000 RPM in water for
48 hours for an imbibition capillary pressure measurement.
Figure 27 shows the water saturation distribution along the
length (z) of the sample after centrifugation at 3000 RPM in
oil for 48 hours for a secondary drainage capillary pressure
curve measurement. From these curves, the relationship
between the capillary pressure and corresponding water
saturation can be determined very straightforwardly. The
primary drainage (circles), imbibition (squares) and
secondary drainage (triangles) capillary pressure curves are
shown in Figure 28. The curves of Figure 28 are physically
sensible and closely approximate similar curves described in
the literature, for example, Donaldon E.C., Thomas R. D. and
Lorenz P. B., SPE Journal, 9(1), 13 (1969). However, the
difficulty of conventional measurement methods where a
single curve takes 15 times longer than the present method,
means that such curves are rarely determined in practice.
The present methodology according to embodiments of the
present invention allows these curves to be determined much
quicker and with relative ease.
The data presented in Figure 28 provides important
information about an oil reservoir.
The primary drainage curve indicated by the
circles provides information about the process that takes
place when oil displaces water in the rock. The primary
drainage capillary pressure curve can also provide
information on the pore size.
59
CA 02524993 2005-10-31
The imbibition measurement provides the
irreducible water saturation value which in Figure 28 is
about 28%. The secondary drainage curve provides a value of
residual (irreducible) oil saturation, which in Figure 28 is
about 18% (determined from the difference between 100%
saturation and the measured water saturation at the outlet
face of about 82%, also shown in Figure 27. This value
indicates that once oil saturation in the rock reaches this
level, no more oil can be produced.
The irreducible water saturation indicates how
much oil is present in the reserve. A low irreducible water
saturation indicates that the oil saturation is high, and
vice versa.
The area under the curves indicates how much
energy is required to take up a particular fluid, and
therefore the wettability of the rock for a particular
fluid. In particular, the area under the imbibition
(square) curve indicates how much energy is required for
water to displace oil and the area under the secondary
drainage capillary pressure curve (triangles) indicates how
much energy is required for oil to displace water. The area
under each curve can be compared, and provides an indication
of whether the rock is more wettable by one fluid than
another. In the particular example of Figure 28, the
results show that the area under the secondary drainage
capillary pressure curve is greater than that of the
imbibition capillary pressure curve so that it is easier for
water to displace oil than for oil to displace water and
therefore the rock is more water wettable than oil wettable.
CA 02524993 2005-10-31
Modifications and changes to the embodiments
described above may be made and will be apparent to those
skilled in the art.
The methods and apparatus described herein may be
used to measure any other desired parameters in any desired
sample and for any application. For example, the methods
and apparatus may be used to measure characteristics of any
material including the interaction between any porous media
and one or more fluids. These materials may include but are
not limited to any types of rock, mineral, soil, coal, wood
or any form of synthetic material. The fluids used in the
methods and apparatus may comprise any gas or liquid.
In any of these methods described herein, any one
or more steps may be omitted altogether, as required, or
replaced by one or more different method steps, and
otherwise modified to suit the particular application.
Embodiments of the method and apparatus may
include any one or more features disclosed herein in
combination with any one or more other features to the
exclusion of any one or more other features disclosed
herein.
61