Note: Descriptions are shown in the official language in which they were submitted.
CA 02539015 2006-03-10
Method for Designing Formation Tester for a Well
CROSS-REFERENCE TO RELATED APPLICATIONS
None.
STATEMENT REGARDING FEDERALLY SPONSORED
RESEARCH OR DEVELOPMENT
Not applicable.
REFERENCE TO A MICROFICHE APPENDIX
Not applicable.
FIELD OF THE INVENTION
The present invention relates to testing hydrocarbon producing formations
and more particularly to a method for designing a formation test system for
use in a
well.
BACKGROUND OF THE INVENTION
During drilling of oil and gas wells, it is desirable to test earth formations
to
determine their productive characteristics, e.g. how much oil and/or gas may
be in the
formation and how fast it can be produced. It is desirable to learn this
information as
soon as possible, e.g. before decisions are made to spend the money needed to
complete a well for permanent production. One type of testing before
completion is
referred to as drillstem testing, since the primary work string available
during drilling is
the drillstring itself, although the equivalent testing may be done with other
work strings
or with a wireline supported tool.
One conventional drillstem test allows fluids produced from the formation to
flow up the drillstring for a period of time. The drillstring is typically
provided with a
packer that is set in the annulus between the drillstem and the borehole above
the
formation of interest. A valve in the drillstring may then be closed shutting
in the well so
that the pressure below the packer may stabilize at natural formation
pressure. The test
CA 02539015 2006-03-10
equipment normally includes pressure and temperature sensors to measure and
record
and/or transmit to the surface bottomhole pressure data and temperature data.
After
the downhole conditions have stabilized, the valve in the drillstring is
opened allowing
formation fluids to flow up the drillstring while downhole pressure and
temperature are
measured. After a quantity of fluids is produced, the valve is usually closed
again and
pressure and temperature are measured as the downhole pressure returns to its
natural
formation pressure. Various characteristics of the formation may be derived
from the
produced fluids and from the pressure and temperature data collected.
The conventional open flow drillstem tests often result in production of large
quantities of hydrocarbons when facilities have not yet been installed for
handling such
quantities. To avoid this and other problems, the closed-chamber drillstem
test was
developed. In closed-chamber testing, a portion of a drillstring or other
tubing is
provided with a pair of valves allowing flow through the tubing to be
controlled at two
spaced apart locations in the tubing. The space in the tubing between the
valves forms
a test chamber. A packer is typically used to seal the annulus above the
formation to
be tested and the lower valve is closed to allow pressure in the borehole
below the
packer to stabilize at natural formation pressure. Pressure and temperature
sensors
monitor conditions in the borehole. While the lower valve is closed, the test
chamber is
initially filled, at least partly, with a gas and the upper valve is closed.
Some liquid may
also be placed in the chamber, but the pressure in the chamber at the lower
valve is set
below the natural formation pressure. After borehole conditions stabilize, the
lower
valve is opened allowing formation pressure to flow formation fluids into the
test
chamber compressing the gas in the test chamber. Flow reduces as chamber
pressure
increases and stops when the pressure at the bottom of the test chamber
reaches the
natural formation pressure. Pressure and temperature data is recorded as the
test is
2
CA 02539015 2006-03-10
performed. In a properly designed closed-chamber drillstem test, the data
covers a
continuous range of flow rates extending from an initial high value to
essentially no flow
at the end of the test. Data from such a properly designed test may be
analyzed by
known methods to determine the formation characteristics. The closed-chamber
test
results in less produced fluids that need to be disposed of, may take less
time than
open flow testing, and has other advantages. However, if the closed-chamber
system
is not properly designed, the chamber may fill too quickly, resulting in
insufficient data
for good analysis, or too slowly, resulting in either an incomplete test if it
is terminated
too soon or an undesirably long test period.
SUMMARY OF THE INVENTION
The present disclosure provides a method for designing a closed-chamber
test system that allows collection of desirable data while limiting the
testing time to a
desirable length. Information on the physical sizes of available tubing, the
well, and the
formation to be tested and information on formation fluids, i.e. oil, gas,
water, etc., and
natural pressure and temperature are collected. A proposed chamber size and
chamber pressurizing fluids are then selected. A simulation of a closed-
chamber
drillstem test is then performed using the known parameters and the proposed
test
chamber parameters. The simulation is performed in time increments, by
assuming
constant pressure to exist in the well adjacent the formation during each time
increment.
Calculated flow volume from the formation during the first time increment is
used to
adjust pressure in the well adjacent the formation based on assumed flow into
the
chamber. Flow volume during a second time increment is then calculated based
on the
new assumed constant pressure differential. The process is continued until the
test
would be considered complete, e.g. based on pressure differential dropping to
a low
value. If the simulated total time to complete the test is considered too
short or too long,
3
CA 02539015 2014-09-23
the proposed chamber parameters are adjusted and another simulation is run.
The
process is repeated until the simulated test time reaches a desirable range.
The final
proposed design may then be used to build a real closed-chamber test system
and
perform an optimized closed-chamber drillstem test.
In one embodiment, the test chamber is at least partly filled with a gas
cushion that remains in the chamber during the test. Pressure in the gas
cushion is
adjusted at each time increment based on compression that would result from
the
calculated flow of formation fluids into the chamber. In an alternate
embodiment, the
initial gas cushion pressure may be maintained at a substantially constant
value during
In another embodiment, the test chamber may be an open chamber test.
The simulation of the present invention may be used to determine performance
of an
open chamber test system by assuming that gas cushion pressure is essentially
atmospheric pressure and does not change during the test.
In accordance with a first broad aspect, there is provided a method for
designing a closed-chamber formation test system, comprising a. collecting
data
identifying physical and fluid properties of an earth formation and a well
drilled through
the formation; b. estimating initial parameters of the closed-chamber
formation test
system for testing the earth formation, comprising an initial pressure in a
test chamber
of the test system and the test chamber volume; c. simulating a closed-chamber
formation test over a period of time by: cl. calculating a first volume of
fluids that would
flow into the test chamber during a first time increment based on a pressure
in the well
adjacent the formation remaining constant during the first time increment, and
the
collected data, c2. calculating a new pressure in the well adjacent the
formation based
on the first volume of fluids calculated for the first time increment, c3.
repeating cl and
4
CA 02539015 2014-09-23
c2 for a plurality of additional time increments; d. comparing the simulated
time to
complete the test to a preselected testing time range; e. adjusting initial
estimated
parameters of the closed-chamber formation test system and repeating cl , c2,
and c3
using the data and adjusted parameters, if the simulated time to complete the
test is not
within the preselected testing time range; f. outputting to a storage medium a
final set of
parameters for designing the closed-chamber formation test system when the
simulated
time to complete the test is within the preselected testing time range and g.
using the
final set of parameters to build an actual closed-chamber drillstem test
system when the
simulated time to complete the test is within the preselected testing time
range.
In accordance with a second broad aspect, there is provided a method for
optimizing the design of a closed-chamber formation test system, comprising
producing
an initial model of a closed-chamber drillstem test system for testing an
earth formation,
the model comprising model parameters of a pressure in the test chamber and
chamber
volume; simulating the operation of the test system model over a period of
time, the
simulating comprising dividing the period of time into a plurality of time
increments;
calculating the flow of fluids into the test chamber during each time
increment based on
the test chamber pressure and volume remaining constant during each time
increment
and the flow rate of fluids from the formation; comparing the time at which
the simulated
operation would be considered completed to a preselected range of test times;
adjusting the initial model parameters and repeating the simulating the
operation of the
test system model, if the simulated time is not within the preselected range;
outputting
to a storage medium a final set of parameters that optimizes the design of the
closed-
chamber formation test system when the simulated time to complete the test is
within
the preselected testing time range; and using the final set of parameters to
build an
4a
CA 02539015 2014-09-23
=
actual closed-chamber drillstem test system when the simulated time to
complete the
test is within the preselected testing time range.
In accordance with a third broad aspect, there is provided a method for
optimizing the design of an open chamber formation test system, comprising
producing
an initial model of an open chamber drillstem test system for testing an earth
formation,
the model comprising a chamber having an upper end open to atmospheric
pressure
and a liquid cushion establishing initial pressure adjacent the formation;
simulating the
operation of the test system model over a period of time, the simulating
comprising
dividing the period of time into a plurality of time increments; calculating
the flow of
fluids into the test chamber during each time increment assuming that one of
the well
pressure at the beginning of each time increment and the flow rate of fluids
from the
formation remain constant during each time increment; comparing test chamber
parameters to one or more optimization parameters and determining whether the
simulated operation would be considered completed at the end of each time
increment;
outputting to a storage medium the simulated time at which the simulated
operation
would be considered completed; and using the test chamber parameters to build
an
actual test system when the simulated time to complete the test is within a
preselected
testing time range.
BRIEF DESCRIPTION OF THE DRAWINGS
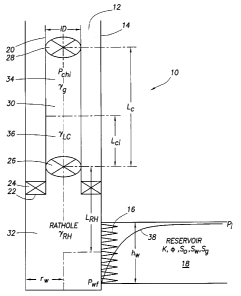
Fig. 1 is a diagram of a closed-chamber drillstem test system identifying
various parameters used in an embodiment of the present invention.
Fig. 2 is a flow chart illustrating a method of designing a closed-chamber
drillstem test system according to an embodiment of the present invention.
Fig. 3 is a flow chart illustrating a method of simulating a closed-chamber
drillstem test according to an embodiment of the present invention.
4b
CA 02539015 2014-09-23
, . = =
DETAILED DESCRIPTION OF THE PREFERRED EMBODIMENTS
In the description of the embodiments, various elements may be described
as being above or below, or up-hole or down-hole from, other elements. Such
references are made with reference to the normal positioning of elements in a
vertical
borehole.
4c
CA 02539015 2006-03-10
However, the embodiments may also be used in deviated or horizontal boreholes,
in
which case above or up-hole means closer to the surface location of a well and
below
or down-hole means closer to the end of the well opposite the surface
location, even
though the two elements may be at the same vertical elevation.
Fig. 1 provides an illustration, not to scale, of a model of a closed-chamber
drillstem test system 10 and various parameters used in an embodiment of the
present
invention. The system 10 is shown positioned in a well 12, which in this
embodiment
includes a casing 14. Perforations 16 have been formed through casing 14 and
into an
earth formation 18 to permit production of fluids from the formation 18. The
well 12 has
been drilled through the formation 18 and usually to a distance below the
formation 18.
The lower end 32 of the well 12, especially that part below casing 14 is
usually referred
to as the rathole. In this embodiment, the rathole portion 32 also includes
that part of
the well below the test system 10. The present invention may also be used in
open
hole wells, that is, wells that do not include a casing 14. In open hole
wells, the
perforations 16 are normally not needed.
The test system 10 is formed in part of a length of tubing 20 which may be
drill pipe, coiled tubing, or other oilfield tubular goods. In this
embodiment, the tubing 20
extends from the surface location of the well, not shown, to a depth location
22 above
the formation 18. The length of the tubing 20 is therefore about equal to the
length of
the well 12 as measured from the surface location to the formation 18, and may
be
many thousands of feet. At the depth location 22, a packer 24 has been
deployed to
seal the annulus between the tubing 20 and the casing 14. A lower valve 26 and
an
upper valve 28 are carried in the tubing 20 and each can be opened or closed
to allow
or block flow of fluids through the tubing 20. The space between valves 26 and
28
within the tubing 20 defines a closed well testing chamber 30, which may be
hundreds
5
CA 02539015 2006-03-10
or thousands of feet long. When lower valve 26 is closed and the packer 24 has
been
deployed, the lower part 32 of the well 12 is exposed to the natural or
initial pressure
present in the formation 18, but flow of fluids up-hole is blocked by the
packer 24 and
valve 26.
In normal operation of the system 10, the test chamber 30 is filled with
pressurizing fluids including a gas cushion 34 in the upper portion and, if
desired, a
liquid cushion 36 in the lower portion. These fluids may be selected to
establish a
desired starting test pressure in the chamber 30 in the wellbore 32 adjacent
the center
of the perforations 16. When valve 26 is open, the wellbore pressure adjacent
perforations 16 is the sum of the pressure at valve 26 plus the pressure head
generated
by borehole fluids between the perforations 16 and the valve 26. When an
actual test is
performed, the valve 26 is opened lowering pressure in the wellbore adjacent
the
perforations 16 to the starting test pressure and allowing fluids to flow from
reservoir 18
into the chamber 30 due to the pressure difference between initial pressure in
the
formation 18 and the pressure in the portion 32 of well 12 adjacent the
perforations 16.
As fluid flows into the chamber 30, gas portion 34 is compressed and the
column of
liquid 36 in the chamber 30 increases until pressure in the well adjacent the
formation
18 equals the natural pressure of formation 18 and flow from the formation
stops. A
typical pressure curve inside the formation 18 as a function of radial
distance into the
formation is illustrated at 38, showing that the pressure at perforations 16
drops when
valve 26 is opened and showing the pressure gradient between the perforations
16 and
the natural or initial formation pressure that drives formation fluids into
the borehole 32.
As noted above, pressure and temperature in the well is recorded as the test
is
performed and the recorded data may then be used to calculate important
6
CA 02539015 2006-03-10
characteristics of the formation 18. At the end of the test, the produced
fluids in the
chamber 30 may be lifted to the surface for further testing.
The size, i.e. volume, of the test chamber 30, and in particular the volume
and pressure of the gas portion 34, determines to a great extent whether a
closed-
chamber drillstem test will be considered to be successful. There are several
desirable
characteristics of a successful test. The test should last long enough that
good
pressure and temperature data may be collected. If a chamber 30 is too small,
it will fill
quickly and the analysis methods for the collected data will not work well. If
the
chamber is too small, the depth of investigation in the formation may be less
than
desired. If the chamber is too large, it may take a long time for the pressure
in the test
chamber to approximate the initial formation pressure resulting in increased
operating
costs without substantially improving the quality of data collected. An over
sized
chamber 30 will also collect more fluids and increase disposal costs. In the
present
embodiment, a test chamber is designed with the goal of completing an actual
test in a
preselected time range. In one embodiment, the preselected time range is from
about
one hour to about two hours. This range is considered a good balance between
collecting good data and minimizing operating costs.
Fig. 1 illustrates a number of parameters that are used in an embodiment of
the invention. As indicated above, the volume of chamber 30 and, in
particular, the
volume of the gas portion 34 are important in achieving a desirable test
result. These
volumes may be specified in terms of the tubing 20 inner diameter, ID, 40, the
total
chamber length, Lc, and the initial liquid cushion length, Lci, from which
dimensions the
volumes of the gas cushion 34, the liquid cushion 36 and the total test
chamber 30 may
be calculated. In determining the formation to borehole pressure differential,
it is also
important to know the distance from the middle of the perforations 16 to the
bottom of
7
CA 02539015 2006-03-10
chamber 30, i.e. to the valve 26, Lrh, since borehole fluids in the rathole
portion 32
provide a hydrostatic head proportional to the fluid density and the length
Lrh. The initial
gas pressure in the chamber portion 34 is labeled Pchi and the temperature of
this gas at
the top of the chamber 30 is Tchi. The density of the gas in the upper chamber
portion
34, or gas cushion gravity relative to air, is referred to a Ggc. In the
preferred
embodiment, the gas is nitrogen with a gravity of 0.967. The density or
gravity of the
liquid cushion is referred to as G10. The density or gravity of the fluid in
the rathole
portion 32 of the well, i.e. below the valve 24, is referred to as Girt,. The
wellbore radius
is indicated as rw, and may generally be assumed to be the radius of the drill
bit used to
drill the well 12. Each of these values is either known at the time it is
desired to design
a closed-chamber test system or a value that may be specified as part of the
design of
a closed-chamber test system.
Other parameters used in the embodiments concern the formation 18 itself
and may be measured from well logs, core samples, or other means known in the
art or
may be inferred from data from other wells, e.g. nearby wells in the same
geological
formation. While these parameters are not controllable, they are usually known
within a
certain degree of error. The initial formation pressure, P, is the natural
pressure in
formation 18 when no fluids are being produced from, or injected into, the
formation. A
skin damage value, s, may be estimated based on the drilling fluids used, the
drilling
overbalance pressure, etc. Since skin damage is generally estimated over a
range,
simulations are desirably run at both extremes of the range. The formation
thickness,
hw, is the measured or estimated thickness from the top to the bottom of
formation 18
and not the distance between top and bottom perforations 16, if perforations
are used.
The formation porosity is referred to as phi. The formation permeability, Kr,
is important
8
CA 02539015 2006-03-10
in simulating the flow of fluids from formation 18. To the extent that a range
of
permeability is estimated, simulations are desirably run at the extremes of
the range.
Certain characteristics of fluids in the formation 18 are also usually known
based on collected samples or correlations to nearby wells and are important
in
designing a closed-chamber drillstem test. The formation gas gravity is
referred to as
Gg and is usually specified relative to air, with air being one. The oil API
gravity at
standard conditions is usually known. Initial ratio of gas dissolved in the
oil at initial
reservoir conditions is referred to as R5i. Reservoir or bottomhole
temperature is
referred to as BHT. The bubble point pressure, Pbp, is the pressure below
which gas
dissolved in the formation oil will come out of solution in the oil.
Fig. 2 is a flow chart illustrating a closed-chamber test design method
according to one embodiment. At step 100, the various data listed above is
collected.
As noted above, some of the parameters may be specified or assumed for
purposes of
this embodiment.
At step 102, a model or proposed chamber design is selected based on the
known parameters, certain assumptions, and based on certain limitations that
may be
specified by the owner of the well to be tested. The diameter, ID, of the
tubing 20 is
normally fixed based on the diameter of casing 14. The volume of chamber 30 is
therefore determined primarily from the length, Lc, of the chamber 30. The
maximum
volume is limited to the length of the tubing 20. An initial proposed length
of chamber
may be made based in part on the maximum sample volume that may be desirable
and the radius of investigation into the formation that is desired. The length
of chamber
30 is also affected by the pressurizing fluids 34, 36 in chamber 30.
The pressurizing fluids 34, 36 are selected to provide a starting test
pressure
25 in the borehole adjacent perforations 16 based on several factors. The
starting
9
CA 02539015 2006-03-10
pressure at the perforations 16 will be the sum of the pressure at the bottom
of gas
cushion 34, the hydrostatic head produced by the liquid cushion 36, if used,
and the
hydrostatic head of borehole fluid between the valve 26 and the perforations
16.
Normally, the starting pressure at perforations 16 should be above the bubble
point of the oil in formation 18. If gas comes out of solution during the
test, the analysis
of the pressure data collected may be adversely affected. If the formation 18
is poorly
consolidated, it may be preferred to limit the maximum pressure drop between
the
formation 18 initial pressure and the borehole starting pressure to prevent
erosion and
other damage to the well 12. The starting pressure should normally be at or
above the
higher of the pressures required to be above bubble point and to avoid
formation
damage. However, it is desirable that the starting pressure not be
substantially above
the higher of these lower limits.
When the starting pressure at the perforations 16 is selected, the starting
pressure at the bottom of chamber 30, i.e. at valve 26, may be estimated. The
hydrostatic head of the borehole fluid in rathole 32 between the perforations
16 and the
assumed position of lower valve 26 may be calculated and subtracted from the
desired
starting pressure at the perforations 16 to determine the starting pressure
desired at the
valve 26.
The liquid cushion 36 is not essential in closed-chamber drillstem test
systems. In some cases, e.g. in high pressure formations, liquid cushion 36
may be
desirable for increasing the starting pressure at valve 26 without increasing
the pressure
of gas cushion 34. The lower gas cushion pressure may provide a safer
operation. If a
liquid cushion is desired, its length may be selected based on the amount of
pressure
the liquid cushion is to provide at the bottom of chamber 30. From this
pressure and
CA 02539015 2006-03-10
the gravity, Gic, of the liquid cushion, the vertical length of the liquid
cushion portion Lci
may be calculated.
The length of the gas cushion 30 may initially be estimated based on the
required starting pressure at the valve 26 less the hydrostatic head of the
liquid cushion
36 and the desired volume of a bulk sample of formation fluids that it is
desired to
produce. In this embodiment, the volume of produced fluids is limited to the
volume
change of the gas cushion 34 that occurs during the test when the formation
fluid flows
into chamber 30 and compresses the gas cushion 34. For example, if it is
desired to
produce twenty barrels of formation fluids and the starting pressure of the
gas cushion
is half the natural formation pressure, the initial volume of the gas cushion
34 may be
roughly about forty barrels. From this volume, the length of the gas cushion
34 may be
calculated and added to the length of the liquid cushion to provide an initial
estimated
total test chamber length, Lc.
As noted above, it is preferred to design a closed-chamber drillstem test
system to perform an actual test in a well in a time of from about one hour to
about two
hours. The above described process for making an initial estimate of the test
system 10
provides only a rough estimate of the volume of the test chamber 30, the
volumes of the
cushion fluids 34, 36, and the initial pressure in the gas cushion 34. If only
these initial
estimates are used to build an actual system and perform a test, there is a
significant
chance that the chamber will fill too quickly to obtain good data or will be
terminated
before the chamber has filled sufficiently to obtain good data. A prior art
solution has
been to provide an oversized chamber and operate the test system for a long
time, e.g.
eight hours, to be sure the chamber is filled. In this embodiment, the initial
estimate for
the system is used as only a model in a simulation of a test to determine
whether the
model can be used to build an actual test system that is likely to result in
an optimized
11
CA 02539015 2006-03-10
real test. It is apparent that other methods of providing an initial estimate
may be used
if desired. Regardless of what method is used to create an initial estimate or
model, the
present invention provides a method for evaluating the model based on all the
physical
parameters of the reservoir, wellbore, and the chamber and iteratively
adjusting the
model until an optimized system design is found.
In Fig. 2, at step 104, the above described initial estimate or model of the
test
system 10 and the other above described parameters are input into a simulation
system
in order to evaluate the performance of the initial estimate. At step 106, a
closed-
chamber drillstem test simulation is performed. A preferred simulation method
is shown
in Fig. 3.
Fig. 3 provides a flow chart of a method for simulating a closed-chamber
drillstem test according to an embodiment of the present invention. At step
200, the
parameters discussed above with reference to Fig. 2, step 104, including the
initial
estimate or model of the test system 10 are provided as inputs to a simulator.
At step
202 it is assumed that valve 26 has been opened and the pressure in the
rathole 32
adjacent perforations 16 has been reduced to the starting value estimated
above. In
this embodiment, the pressure in the borehole adjacent perforations 16 is
assumed to
remain constant during a first time increment and the flow of fluids from the
formation
into the borehole is calculated based on the pressure differential between the
initial
formation pressure, Pi, and the borehole pressure, the permeability of the
formation 18,
the skin damage, produced fluid gravity, and other parameters discussed above.
In one
embodiment, the first time increment is one quarter second. At step 204, the
parameters of the chamber 30, in particular the pressure and volume of gas
cushion 34
are adjusted, i.e. recalculated. The volume of fluid calculated from step 202
is added to
the liquid cushion 36, the volume of the gas cushion is reduced by the
produced fluid
12
CA 02539015 2006-03-10
volume, a new gas cushion pressure is calculated, and a new borehole pressure
at the
perforations 16 is calculated. At step 206, the new values are compared to one
or more
optimization parameters and if an optimization parameter has been reached, the
total of
the time increments that have been simulated is recorded at step 208. As
indicated by
arrow 210, the process returns to step 202 and another flow volume is again
calculated
for the next time increment based on the new borehole pressure at the middle
of
perforations 16, again assumed to be constant during the time increment, and
formation
18 parameters. This process is preferably repeated until a preselected
simulation time
has been reached and the simulation is then stopped at step 212. In an
alternate
method, the simulation may be stopped when one or more or all of the
optimization
parameters in step 206 have been reached.
As noted above, the initial time increment in this embodiment is about one
quarter second. In this embodiment, steps 202, 204 and 206 are repeated in one
quarter second increments for a first simulated time period of about fifty
seconds, then
the increments are increased to about one half second for a second simulated
time
period of about fifty seconds, and then the increments are increased to one
second for
a third time period that may be the remainder of the simulated time, i.e. for
simulated
time greater than 100 seconds.
In a preferred embodiment, the results calculated for each time increment are
quality checked against certain limitations before the process continues to
the next time
increment. For example, if the initial system model has a very small chamber
30, it is
possible that the calculated flow volume in the first increment, or a later
increment, will
exceed the available volume in the gas cushion 34 by compression and/or the
resulting
calculated pressure in the wellbore 32 adjacent the perforations 16 would be
increased
above the initial formation pressure. Neither of these results is physically
possible. If
13
CA 02539015 2006-03-10
the calculated results are not possible, the simulation is stopped, the
results are
discarded, and the simulation is restarted with a smaller first increment,
e.g. one half the
increment previously used. As noted above, the simulation may normally be
started
with increments of one quarter second. If the quality check detects an
impossible result,
the simulation may be restarted with an initial time increment of one eighth
second. If
the second try also results in an impossible result, the initial time
increment may again
be cut in half to one sixteenth second and the process started again. If the
simulation
does not provide a realistic result starting with an initial one-sixteenth
second increment,
it is preferred to stop the simulation and reevaluate the initial model for
some basic
physical misapplication before retrying.
If the simulation is restarted with a reduced first time increment of one
eighth
second, then the simulation may be continued with increments of one eighth
second for
the remainder of the first simulated time period of fifty seconds, then with
increments of
one quarter second for the second simulated time period of fifty seconds,
increments of
one half second for a third simulated time period from one hundred seconds to
five
hundred seconds and increments of one second for a fourth simulated time
period
extending beyond five hundred seconds.
If the simulation is restarted with a reduced first time increment of one
sixteenth second, then the simulation may be continued with increments of one
sixteenth second for the remainder of the first simulated time period of fifty
seconds,
then increments of one eighth second for the second simulated time period of
fifty
seconds, increments of one quarter second for the third simulated time from
one
hundred seconds to five hundred seconds, increments of one half second for the
fourth
simulated time period from five hundred to one thousand seconds, and
increments of
one second for a fifth simulated time period extending beyond one thousand
seconds.
14
CA 02539015 2006-03-10
In alternative embodiments, the simulation increments may be kept constant
throughout the entire simulation. That is, the initial one quarter second
increment size
may be used for a complete simulation of five thousands seconds or more.
Likewise,
initial increments of one eighth or one sixteenth second could be used for the
entire
simulation. The preferred embodiments increase the increment size as suggested
above to reduce the number of calculations and therefore reduce the actual
time
required to perform simulations. In similar fashion, the particular simulated
time periods
during which various increments are used may be changed if desired.
The data calculated in step 204, i.e. pressures and volumes in the test
system 10, are preferably recorded for generation of various curves that allow
visual
analysis of the results. For simulated time increments of less than one second
it is
generally preferred to record the calculated data for each increment. For
simulated time
increments of one second, data may be recorded at progressively longer
intervals
throughout the simulation.
In a preferred simulation starting with one quarter second increments, the
data is preferably recorded at intervals of one quarter second for the first
fifty simulated
seconds, at intervals of one half second for the second fifty simulated
seconds, at
intervals of one second for simulated time from one hundred to five hundred
seconds, at
intervals of two seconds for simulated time from five hundred seconds to one
thousand
seconds, at intervals of five seconds for simulated time from one thousand
seconds to
two thousand seconds, at intervals of ten seconds for simulated time from two
thousand
seconds to three thousand seconds, at intervals of fifty seconds for simulated
time from
three thousand seconds to five thousand seconds, and at intervals of one
hundred
seconds for simulated time beyond five thousand seconds, if any.
CA 02539015 2006-03-10
In a preferred simulation starting with one eighth second increments, the data
is preferably recorded at intervals of one eighth second for the first fifty
simulated
seconds, at intervals of one quarter second for the second fifty simulated
seconds, at
intervals of one half second for simulated time from one hundred to five
hundred
seconds, at intervals of one second for simulated time from five hundred
seconds to
one thousand seconds, at intervals of three seconds for simulated time from
one
thousand seconds to two thousand seconds, at intervals of five seconds for
simulated
time from two thousand seconds to three thousand seconds, at intervals of
twenty-five
seconds for simulated time from three thousand seconds to five thousand
seconds, and
at intervals of fifty seconds for simulated time beyond five thousand seconds,
if any.
In a preferred simulation starting with one sixteenth second increments, the
data is preferably recorded at intervals of one sixteenth second for the first
fifty
simulated seconds, at intervals of one eighth second for the second fifty
simulated
seconds, at intervals of one quarter second for simulated time from one
hundred to five
hundred seconds, at intervals of one-half second for simulated time from five
hundred
seconds to one thousand seconds, at intervals of two seconds for simulated
time from
one thousand seconds to two thousand seconds, at intervals of three seconds
for
simulated time from two thousand seconds to three thousand seconds, at
intervals of
thirteen seconds for simulated time from three thousand seconds to five
thousand
seconds, and at intervals of twenty-five seconds for simulated time beyond
five
thousand seconds, if any.
Returning to Fig. 2, after running the simulation in step 106, the results of
the
simulation are displayed at step 108. As a minimum, these results should
include the
times to reach the optimization parameters recorded in step 208 of Fig. 3.
Other data,
such as a pressure in the borehole versus time curve may also be displayed.
Based on
16
CA 02539015 2006-03-10
the displayed data, an operator at step 110 may determine whether the
simulation
indicated that the test would have been performed in a desirable time interval
of from
one to two hours, or other time interval that may be determined to be
desirable and
whether the data collected would be of good quality. If the simulated time
interval is too
short or too long, then at step 112, the proposed chamber model may be
adjusted, i.e.
changed, and input to step 102 for repeating the process. This adjustment step
may be
repeated until the simulation process indicates that the test will be
performed in a
desirable time period. When a desirable time period is indicated, then at step
114 the
final test chamber model may be used to build an actual closed-chamber
drillstem test
system 10 and operate it in the well for which the design process has been
performed.
In Fig. 2, the model adjustments in step 112 may be made in various ways.
Simple stepwise adjustments of test system 10 parameters may be made until an
acceptable simulation result is achieved. Alternatively two or more
simulations may be
run for models with relatively large variations in parameters, and an
interpolation may
be made based on the simulation results. For example, if simulation of a first
model
indicates test completion in one hour and simulation of a second model
indicates test
completion in two hours, a model with parameters half way between the first
two is likely
to provide a simulated test completion in about one and one-half hours hour,
i.e. in the
middle of the desirable range. Interpolation may be done mathematically,
graphically or
automatically. In actual testing, it has been found that a reservoir engineer
can design
an optimized model in relatively few iterations and a short time due to the
speed of the
simulations.
The above described simulation process is quite simple primarily because of
the incremental method used to simulate the performance of the model test
chambers.
The assumption of constant pressure over each time increment reduces the
number of
17
CA 02539015 2006-03-10
variables making it possible to calculate flow volumes using partial
differential equations
in Laplace space and to use the available correlations for the pressure-volume-
temperature, PVT, calculations needed to determine conditions at each
simulated time
increment. If desired, Darcy equations may be used to calculate flow volumes.
In a
preferred embodiment, partial differential equations in Laplace space are used
to
calculate flow volumes unless and until instability is found in the
calculations, which may
occur late in a simulation when pressure changes occur slowly. In the event
such
instabilities are detected, it is preferred to complete the remainder of the
simulation
using Darcy equations. A single simulation can be run in only a few seconds of
time on
a typical personal computer and the simulated results can be provided to a
reservoir
engineer essentially in real time. The engineer can therefore make adjustments
and
quickly arrive at an optimized design.
As noted above, the assumption of constant pressure during each increment
reduces the number of variables and allows the desired flow calculations to be
made. A
feature of the present invention is that by assuming one variable is constant
over small
time increments, it becomes possible to solve the equations needed to simulate
a
formation flow test. In the preferred embodiment, borehole pressure is the
variable that
is assumed to be constant. It is apparent that the number of variables can be
reduced
by assuming another variable to be constant during each time increment and the
necessary calculations would also be facilitated. For example, it may be
possible to
reduce the number of variables by assuming that flow rate is constant during
each time
increment to achieve the same ability to calculate the incremental changes in
volumes
and pressures as described herein.
As noted above, some of the well parameters that strongly affect flow of
formation fluids may not be known precisely, but may instead be indicated in
terms of
18
CA 02539015 2006-03-10
ranges of possible values. For example, formation permeability is one of the
main
parameters affecting the fluid flow rate. When such parameters are only
estimated in
terms of ranges, it is preferred to run multiple simulations at various
combinations of the
parameters, covering the extremes of the unknown parameters. In such a case,
the
model with the longest test completion time may be chosen for building an
actual
drillstem test system 10.
As suggested above, a test time of from one to two hours may be considered
acceptable to most reservoir engineers. A preferred design approach may be to
run
simulations in an effort to identify a design that will provide a one hour
test period at
best case conditions. If actual conditions are not best case, the test may be
extended
and will likely be completed within two hours. It is also preferred to use
downhole data
systems that transmit pressure and other parameters to the surface in real
time during
the actual well test. A reservoir engineer may then monitor the data, e.g.
pressure
adjacent the perforations 16, and can determine whether the test is actually
completed,
e.g. in one hour, or should be extended, e.g. to two hours or more. Such
systems
reduce the likelihood of a premature ending of a test that is taking longer
than expected.
In Fig. 3, step 206, one or more optimization parameters are detected. An
optimization parameter is a value that indicates that a test has been
substantially
completed so that there is little value in continuing the test. During the
design process
of this embodiment, the simulation is preferably continued beyond the selected
optimization values so that simulated time to reach each of the optimization
values may
be determined and displayed. In an actual test, the test may be terminated
when a
selected optimization value has been reached.
A preferred optimization value is the difference between initial or natural
reservoir pressure and the pressure in the well at the perforations, APw. When
this
19
CA 02539015 2006-03-10
pressure difference reaches a small value, produced fluid flow will have
essentially
stopped and it can be assumed that enough data has been collected to perform
desired
analyses. A preferred pressure differential value is seven psi, but other
values, for
example from five to ten psi, may be used to indicate test completion if
desired. In
general, any value below twenty-five psi may be suitable to indicate
substantial
completion of a test.
An alternative, or additional, optimization parameter may be the productivity
index, which is the ratio of flow rate over the draw-down pressure. A value of
about
0.07 barrels per day per psi may be used to indicate test completion, but
other values,
for example from 0.05 to 0.10 barrels per day per psi, may be used to indicate
test
completion if desired. In general, any value below 0.25 barrels per day per
psi may be
suitable to indicate substantial completion of a test.
Another alternative, or additional, optimization parameter may be the
pressure derivative. In conventional well testing, radial flow starts
approximately one to
1.5 log cycles after the end of the initial unit-slope wellbore storage line
in the log-log
pressure and derivative plot versus time. The time of the maximum point on the
pressure derivative plot is used as a reference point, which occurs later than
the end of
the unit-slope line. A test duration of about 1.3 log cycles after this
reference point may
be used to indicate test completion, but other values, for example from 1.0 to
1.5 log
cycles, may be used to indicate test completion if desired. In general, any
value below
2.0 log cycles may be suitable to indicate substantial completion of a test.
Before performing an actual closed-chamber drillstem test, it is often
desirable to remove drilling fluids from the rathole area 32 and from the skin
damage
zone of the formation 18. This can be done in various ways. For example it is
possible
to open both valves 26 and 28 and allow formation fluid to flow through tubing
20 until it
CA 02539015 2006-03-10
has flushed out the damage zone and the borehole. In other cases, a junk
chamber is
used to flush out the rathole area 32 and the formation. A junk chamber may be
essentially another closed- chamber test system just like system 10 shown in
Fig. 1. It
may be positioned below the reservoir 18 or may be positioned above the
reservoir 18,
but below the actual closed- chamber test system 10. In either case, the
methods
taught herein may be used to simulate the performance of a junk chamber and
allow
iterative adjustment of the junk chamber parameters to assure that it performs
properly.
The present invention provides a method for designing a closed-chamber
drillstem test system with a high level of confidence that it will operate as
desired. Once
the design process has been completed, the final design may be used to
actually build
a closed-chamber drillstem test system and operate it in a well. If a junk
chamber is
desired, the system may be used to design the junk chamber. The junk chamber
and
test chamber 10 may be run into a well as a single work string. If the well is
cased and
has not been perforated, a perforating gun may also be run in as part of the
same work
string. After such a work string is in place, and packer 24 has been deployed,
the
perforating charges may be fired. The junk chamber may then be opened to flush
the
perforations and rathole of drilling fluids. The junk chamber valve would then
normally
be closed and the well would be shut in until conditions in the well
stabilize. When the
well pressure has stabilized at the natural formation pressure, the test
chamber valve
26 may be opened to perform the closed-chamber test. When the main chamber 30
test is completed, the valve 28 may be opened to allow the formation to flow
into the
entire wellbore and conduct a standard pressure drawdown followed by a
pressure
buildup test. Pressure and other data collected during the perforation event,
the junk
chamber operation, and the main chamber test may then be analyzed by known
methods to closely evaluate formation parameters. The produced fluids in the
chamber
21
CA 02539015 2006-03-10
30 may be flowed to the surface by opening valves 26 and 28 or the tubing 20
may be
removed from the well with the produced fluid sample in place.
In the above described embodiments, the formation test system is a closed
chamber test system in which an initial gas cushion 34 remains in the test
chamber
throughout the test and is compressed and pressure increases as produced
fluids flow
into the chamber. In an alternate embodiment, the pressure of the initial gas
cushion 34
may be maintained substantially constant during the test. Constant pressure
may be
achieved by adding a pressure relief valve at the location of the upper valve
28 in Fig. 1,
or making the valve 28 function as a pressure relief valve. As well known in
the art, a
pressure relief valve will establish a maximum pressure in the gas cushion as
the gas
cushion is displaced by produced fluids. The gas cushion pressure may be
considered
constant even though in practice the initial gas cushion pressure may be
somewhat
below the relief valve release pressure for safety and other reasons. By use
of a
constant pressure in the gas cushion 34, the chamber 30 may be made smaller
and/or
a larger sample of produced fluids may be collected with a given size of
chamber 30.
The same simulator described above may be used to simulate performance of a
formation tester with constant pressure in gas cushion 34. This may be done by
specifying the volume of gas cushion 34 to be very large or essentially
infinite at the
start of the simulation. As fluids flow into the chamber 30, there will be no
increase in
pressure in the gas cushion 34 and the only pressure increase in the wellbore
32
adjacent the formation will result from the increase in fluid head of fluid
cushion 36. The
total length of fluid cushion 36 at the end of a simulated test may then be
used as the
minimum length of chamber 30 for purposes of building an actual tester. An
additional
length may then be added to chamber 30 to accommodate a small gas cushion 34
at
the end of the test and to account for possible variations in produced fluid
density.
22
CA 02539015 2006-03-10
In another embodiment, the simulator described herein may be used to
simulate an open chamber formation test system. In such a system, the valve 28
may
be open or omitted and the tubing 20 may be filled with gas at atmospheric
pressure
from the top of fluid cushion 36 to the surface location of the well 12. Such
a system
may be simulated as described in the previous paragraph by specifying the
volume of
gas cushion 34 as very large or infinite and starting pressure as atmospheric.
The
starting pressure at lower valve 26 would be specified primarily by the length
and
density of fluid cushion 36. In this open chamber test, simulations according
to the
present invention may be used in several ways.
If the available length of the tubing 20 is sufficient to accomodate a fluid
head, including initial fluid cushion 36, with pressure at least equal to
initial formation
pressure, then the simulation will estimate the total time required to
complete a
formation test to the end points described above. Gas cushion pressure is
assumed to
not be adjustable in this open chamber case. Fluid cushion 36 initial pressure
is
adjustable by adjusting its length and density. The diameter of the chamber 30
may
also be adjusted to optimize the total volume that would be produced and the
total test
time. The simulation results may indicate that an open chamber test is not
recommended, because it may take too long or require excessive produced fluids
as
compared to a closed chamber test.
If the available length of the tubing 20 is not sufficient to accomodate a
fluid
head, including initial fluid cushion 36, with pressure at least equal to
initial formation
pressure, then the simulation may estimate the total time required to fill the
tubing 20
with produced fluids and the maximum bottomhole pressure that would result.
The
model may be optimized based on density of fluid cushion 36. The diameter of
the
chamber 30 may also be adjusted to optimize the total volume that would be
produced
23
CA 02539015 2006-03-10
and the total test time. The simulation results may indicate that an open
chamber test is
not recommended, because it may not be possible to collect a desired range of
data or
it may take too long or require excessive produced fluids as compared to a
closed
chamber test.
While the formation testers in the above described embodiments are part of a
work string, e.g. a drill string, extending from a surface location of a well
to the formation
to be tested, it is apparent that other systems may be designed and optimized
according to the present invention. For example, the test system shown in Fig.
1, may
be carried into a well on a wireline or slickline and operated without a
tubing or other
work string in the well. The design optimization process described herein will
work
equally well for such a test system. While such systems have been described
with
respect to use for testing hydrocarbon producing formations, it is apparent
that they
may be used for testing the productive capacities of formations that produce
water or
other fluids.
While the present invention has been described with reference to particular
systems and methods of operation, it is apparent that various modifications
thereof may
be made within the scope of the present invention as defined by the appended
claims.
24