Note: Descriptions are shown in the official language in which they were submitted.
CA 02539894 2006-03-16
-1-
Title: Systems and Methods for Marketing Programs Segmentation
Continuity
[0001] This application is a continuation of U.S. patent application no.
60/740,287 filed November 29, 2005 which is incorporated by reference
herein in its entirety.
Field of the invention
[0002] The present invention relates generally to the field of marketing,
with common but by no means exclusive application to evaluating the
efficiency of marketing programs. As used herein, the term "marketing
program" and as will be understood should be interpreted broadly and
includes the advertising or promotional medium or methods like direct mail,
telemarketing, space advertising, radio and television commercials, price
reduction, gifts, awards, prizes or commemoratives.
Background of the invention
[0003] There is a growing need for businesses to justify their marketing
expenditures. Businesses must evaluate the responses to different
marketing programs, in order to determine if their marketing dollars are
being spent wisely. Businesses need to know which elements of their
advertising plan helped achieve their goals in the most efficient manner and
which did not, in order to be able to allocate their budgets on an ongoing
basis.
[0004] Typically, marketing "success" has been measured in the
context of the following types of analyses:
A. Existence: Proof of Advertising Performance, which tracks the
delivery of advertising;
B. Effectiveness: Return on Objective (ROO), which examines
marketplace response to advertising; and
C. Efficiency: Return on Investment (ROI) or Return on Marketing
Investment (ROMI), which measures the relative efficiency of
CA 02539894 2006-03-16
-2-
various marketing tactics (such as advertising/promotion mix,
media mix, etc.).
[0005] Advances in technology have allowed more complex data to be
analyzed. Techniques such as marketing mix modeling were introduced in
the 1990s and have expanded in scope to meet the increased ROI
measurement demand for marketers. Marketing mix modeling is a
statistical technique based primarily on pattern recognition. This analysis
compares week-by-week, market-by-market patterns in advertising and
marketing elements to patterns in sales. When matching patterns are
located, conclusions are drawn about the positive (or negative) effect the
advertising elements had on their corresponding sales. Marketing mix
modeling techniques include, but are not limited to, multiple regression
analysis, logistic regression, neural net analysis, and genetic algorithm
analysis. A marketing mix model is a specialized version of an econometric
model.
[0006] The inventors have recognized a need for alternative systems
and methods for evaluating the efficiency of marketing programs.
Summary of the invention
[0007] In a first aspect, the present invention is directed towards a
method of measuring the efficiency of a plurality of marketing programs for
a campaign involving a plurality of saleables and at least one distribution
channel. The steps of the method include: determining a plurality of
marketing program segments, wherein each segment corresponds to a
unique combination of marketing programs; uniquely correlating each
combination of a saleable and distribution channel to a corresponding
segment; determining the quantity of at least one measureable for each
saleable; and calculating an efficiency value for at least one segment.
[0008] In another aspect, the present invention is directed towards a
system for measuring the efficiency of marketing programs. The system
includes a data storage configured to store: marketing programs data
comprising data corresponding to a plurality of marketing programs;
CA 02539894 2006-03-16
-3-
saleables data correlated to a plurality of saleables, wherein at least one
saleable is correlated to at least one marketing program; and
measureables data correlated to the value of sales for each saleable. The
system also includes a segmentor, a correlator and an efficiency calculator.
The segmentor is operatively coupled to the data storage and configured to
determine a plurality of marketing program segments, wherein each
segment corresponds to a unique combination of marketing programs and
wherein the data storage is configured to store marketing program segment
data correlated to the marketing program segments. The correlator is
operatively coupled to the data storage and configured to correlate each
saleable to one marketing program segment. The efficiency calculator is
configured to calculate an efficiency value for at least one segment.
Brief description of the drawings
[0009] The present invention will now be described, by way of example
only, with reference to the following drawings, in which like reference
numerals refer to like parts and in which:
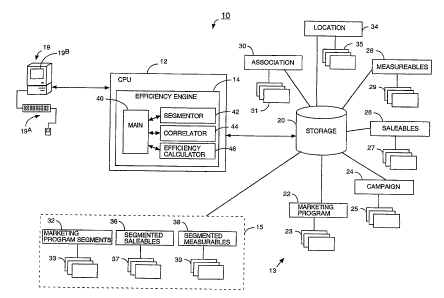
[0010] FIGURE 1 is a schematic diagram of a marketing programs
efficiency system made in accordance with the present invention.
[0011] FIGURE 2 is a schematic diagram of example marketing
program records data as may be stored in the marketing program data
storage entity of the system of Figure 1;
[0012] FIGURE 3 is a schematic diagram of example campaign data 25
as may be stored in the campaign data storage entity of the system of
Figure 1,
[0013] FIGURE 4 is a schematic diagram of example saleables data as
may be stored in the saleables data storage entity of the system of Figure
1;
[0014] FIGURE 5 is a schematic diagram of example location data
which may be stored in the location data storage entity of the system of
Figure 1 ;
CA 02539894 2006-03-16
-4-
[0015] FIGURE 6 is a schematic diagram of example association data
as may be stored in the association data storage entity of the system of
Figure 1;
[0016] FIGURE 7 is a schematic diagram of example measureables
data typically stored in the measureables data storage entity of the system
of Figure 1;
[0017] FIGURE 8 is a schematic diagram of example marketing
program segment data records as may be determined and stored in the
program segment data storage entity by the system of Figure 1;
[0018] FIGURE 9 is a schematic diagram of example segmented
saleables data records as may be generated and stored in the segmented
saleables data storage entity by the system of Figure 1;
[0019] FIGURE 10 is a schematic diagram of example segmented
measureables data as may be generated and stored in the segmented
measureables data storage entity by the system of Figure 1;
[0020] FIGURE 11 is a flow diagram illustrating the steps of a method
of the present invention.
[0021] FIGURE 12 is a schematic diagram illustrating the potential
plurality of relationships between saleables and marketing programs in raw
data.
[0022] FIGURE 13 is a schematic diagram illustrating the unique
relationship between each saleables and a corresponding segmented
marketing program once the marketing program segments have been
determined and associated with the raw data in accordance with the
method of the present invention.
[0023] FIGURE 14A is a schematic diagram illustrating a ROMI
efficiency calculation report as may be generated by the system of Figure
1.
CA 02539894 2006-03-16
-5-
[0024] FIGURE 14B is a schematic diagram illustrating an alternate
efficiency calculation report as may be generated by the system of Figure
1.
Detailed description of the invention
[0025] Referring to Figure 1, illustrated therein is a marketing programs
efficiency system, referred to generally as 10, made in accordance with the
present invention. The system 10 comprises a processor or central
processing unit (CPU) 12 such as a standard personal computer (PC)
running on a WINDOWS'A" operating system and having a suitably
programmed efficiency engine 14. As will of course be understood, other
types of suitable hardware and operating systems may be used.
[0026] An input/output device 19 (typically including an input
component 19A such as a keyboard, and output components such as a
display 19B) is also operatively coupled to the CPU 12.
[0027] Data storage 20 is also provided, although as will be
understood, the storage 20 may be local to or remote from the CPU 12 and
portions of the data stored may be stored in different physical or electronic
storage locations. The data storage 20 will preferably include a marketing
program data storage entity 22 storing marketing program data records 23,
a campaign data storage entity 24 storing campaign data 25, a saleables
data storage entity 26 storing saleables data 27, a measureables data
storage entity 28 storing measureables data 29, an association data
storage entity 30 storing association data 31. If the company or other entity
utilizing the system 10 has multiple stores or other centres of operation, the
data storage 20 may also include a location data storage entity 34 storing
location data 35. As will be understood, much of the sales and campaign
data 23, 25, 27, 29, 31, 35 may be previously generated or collected by
marketing or other systems and communicated to or extracted by the
system 10 (such communicated or extracted data referred to generally
herein as raw data 13).
CA 02539894 2006-03-16
-6-
[0028] The data storage 20 will also preferably include a marketing
program segment data storage entity 32 storing marketing program
segment data 33, a segmented saleables data storage entity 36 storing
segmented saleables data records 37, and also a segmented measurables
data storage entity 38 storing segmented measurables data records 39
(collectively referred to herein as segmented data 15).
[0029] The efficiency engine 14 may include several modules. A main
executable module 40 is preferably provided for controlling the operation of
the various sub-modules: a segmentor module 42, a correlator module 44,
and an efficiency calculator module 46. As will be discussed in greater
detail below, the segmented measureables data records 39 and segmented
marketing program data records 37 will typically be generated by the
segmentor module 42 and the correlator module 44 using the raw data 13.
[0030] Referring now to Figure 2, illustrated therein is an example of
the type of marketing program records 23 data typically stored in the
marketing program data storage entity 22. While the sample data in Figure
2 for simplicity only illustrates three marketing program records 23,
typically
the system 10 will be capable of handling complex data involving dozens or
more of different marketing programs 23. The marketing program records
23 data may be input into the marketing program data storage entity 22 by
a system 10 user, and updated as new marketing programs are
implemented or old marketing programs are discontinued.
[0031] Each marketing program record 23 will typically include a unique
marketing program identifier 60, as well as a marketing program name 62
corresponding to the different marketing programs which may have been
implemented in the various marketing campaigns. The marketing program
records may also store costing data 64. Typically the costing data 64
corresponds to the cost per saleable 27 of the marketing program 60. In
the example data, marketing programs such as a store display (with a per
saleable cost 64 of $15), a loyalty card points promotion (with a per
saleable cost 64 of $10) or a gift promotion (with a per saleable cost 64 of
CA 02539894 2006-03-16
-7-
$12.50) are illustrated, but as will be understood, other types of marketing
programs may be used such as media advertising, promotional events, etc.
[0032] It should also be understood that the example marketing
program records 23 illustrate simplified data for illustrative purposes. As
will be understood, the costing data 64 may vary by campaign 25 (for
example, a more expensive gift may be provided through a gift promotion
23 during some campaigns 25 than others). Accordingly, a more
complicated marketing program record 23 may also include a campaign
identifier.
[0033] As well, depending on the number and hence complexity of the
various marketing programs, it should be understood that a marketing
program record 23 may represent a collection of subsidiary promotions -
for example, the store display program record 23 may represent a
collection of specific display programs such as shelf displays, aisle displays
and store-front window displays etc. Similarly, while separate marketing
program records may be created for a radio advertisement promotion and a
newspaper advertisement promotion, in appropriate circumstances (such
as the size of the respective promotions) it may be helpful to combine such
promotions into a single marketing program record 23 for "advertisements"
generally.
[0034] Referring now to Figure 3, illustrated therein is an example of
the type of campaign data 25 typically stored in the campaign data storage
entity 24. In the example data shown in Figure 3, only ten different
campaign records 25 are illustrated. However, the system 10 will
preferably be configured to implement and track a more expansive data set
involving dozens or hundreds or more such campaigns 25. The campaign
records 25 data may be input into the campaign data storage entity 24 by a
system 10 user, and updated as new campaigns are implemented.
[0035] Each campaign record 25 will typically include a unique
campaign identifier 70, as well as data corresponding to the campaign
name 72, such as "Mother's Day" or "Easter". Typically, the campaign
CA 02539894 2006-03-16
-8-
records 25 will also include other data relating to the implementation of
each campaign, such as the campaign start 74 and end 76 dates.
Typically, no two campaigns will overlap.
[0036] Referring now to Figure 4, illustrated therein is an example of
the type of saleables data 27 typically stored in the saleables data storage
entity 26. While the sample data in Figure 4 illustrates fourteen different
saleables 27, the system 10 will preferably be configured to handle and
store a more complicated data set involving hundreds or thousands or
more of saleables 27. The saleables records 27 data may be input into the
saleable storage entity 26 by a system 10 user, and updated for each new
saleable. Typically the saleables data 27 includes a unique saleables
identifier 80 together with data corresponding to the saleable name 82. As
will be understood, the term "saleables" as used herein is intended to refer
broadly to goods or services or other intangibles that a company may sell
or provide. Preferably, the saleables data 27 will include an entry for each
saleable in the company's entire inventory or eligible for promotion. The
saleables identifier 80 will preferably correspond to the company's saleable
identifier such as a stock keeping unit number (SKU#).
[0037] Turning to Figure 5, illustrated therein is an example of the type
of location data 35 which may be stored in the location data storage entity
34. The example data in Figure 5 illustrates two different location data
records 35. As will be understood, the system 10 will preferably be
configured to handle and store a more expansive data set involving
hundreds or thousands or more of locations 35 or other distribution
channels (including without limitation such as the Internet, or direct
mailing). The location records 35 data may be input into the location data
storage entity 34 by a system 10 user, and updated for each new location.
A unique location identifier 84 will preferably be provided, together with
data corresponding to the location name 86.
[0038] Referring now to Figure 6, illustrated therein is an example of
the type of association data 31 typically stored in the association data
CA 02539894 2006-03-16
-9-
storage entity 30. The association records 31 data may be input into the
association storage entity 30 by a system 10 user, and updated for each
new campaign. Typically the association data 31 includes a campaign
identifier 100 corresponding to the campaign identifiers 70 in the campaign
records 25. The association data 31 will typically also include saleables
identifiers 102 corresponding to the saleables identifiers 80 stored in the
saleables data records 27.
[0039] For marketing programs involving multiple locations, the
association data 31 may also include location identifier data 103
corresponding to the location identifiers 84 in the locations data records 35
together with a marketing program identifier 104 corresponding to the
marketing program identifiers 60 in the marketing programs records 23. As
will be understood, if the marketing programs 23 in a campaign 25 do not
apply at the distribution channel level (eg. location 35), then the user may
elect not to include distribution channel data such as the location identifier
data 103 in the association data 31. For example, if all of the marketing
programs 23 apply to all of the locations 35 in a campaign 25, then it may
not required to include a location identifier data 103 in the association data
records 31.
[0040] As shown in the example data record 31' in Figure 6 (while
simultaneously cross-referencing the data in Figures 2, 3 and 4), for the
Halloween campaign (campaign identifier 70, 100 = "C200509"), the
covering stick (saleable identifier 80, 102 = "S2") was sold in the Toronto
store (location identifier 84, 103 ="L1") in association with the store
display
and gift marketing program (marketing program identifiers 62, 104 = "SD"
and "GF"), and also in the Ottawa store (location identifier 84, 103 ="L2")
in association with just the gift marketing program (marketing program
identifier 62, 104 = "GF").
[0041] As will be understood, typically, for every campaign 70, 100, an
association record 31 is created for each marketing program 104 (and
CA 02539894 2006-03-16
-10-
location 103 combination, if applicable) that a saleable 102 is marketed in
association with.
[0042] As will be understood, marketing programs may be selectively
applied to saleables 102 through different locations 103 or other saleable
distribution channels. Accordingly, if a saleable 102 is marketed with two
different marketing programs 104 (in only one location 103) during a
particular campaign 100, then two association records 31 will preferably be
created.
[0043] Referring now to Figure 7, illustrated therein is an example of
the type of measureables data 29 typically stored in the measureables data
storage entity 28. The measurables records 29 data may be input into the
measurable storage entity 28 by system 10 user, and updated for each new
campaign, The measureables data 29 preferably includes a campaign
identifier 90 corresponding to the campaign identifiers 70 in the campaign
data storage entity 24. The measureables data 29 will typically also include
a saleables identifier 92 corresponding to the saleables identifier 80 stored
in the saleables data records 27.
[0044] As noted previously, for corporations or other entities distributing
and tracking saleables from multiple locations, the measureables data 29
may also include location identifier data 93 corresponding to the location
identifiers 84 in the locations data records 35. The measureables data 29
will also include quantity data 94 typically referred to as "sales" correlated
to the value or quantity of each saleable 92 sold or charitable funds
received (eg. for a charity application) during the corresponding campaign
90. Typically, the quantity data 94 will be represented in currency, such as
dollars, but it should be understood that for some applications, the quantity
data 94 may correspond to other measurements, such as number of units
sold, cost, price, inventory etc.
[0045] The measureables data 29 will preferably also include growth
margin data 96 correlated to the increase (or lack thereof) in value or
quantity of saleables 92 sold during the campaign 90 relative to pre-
CA 02539894 2006-03-16
-11-
campaign sales. As will be understood, the growth margin data 96 is
intended to reflect the improvement to "sales" which may be attributed to
the campaign 90. Preferably the measurables data 29 will include
marketing program investment data 98. The marketing program
investment data 98 reflects the total of the marketing program costs 64 of
all the marketing programs 104 for a saleable 92 at a particular location 86.
[0046] Referring to the example measurables data record 29' in Figure
7 (in conjunction with the data in Figures 2, 4 & 6), it can be seen that
during the Halloween campaign (campaign identifier 70, 90 = "C200509"),
the covering stick (saleable identifier 80, 92 = "S2") was sold in the Toronto
store (location identifier 93, 103 ="L1") in association with the store
display
and gift marketing program (marketing program identifiers 62, 104 = "SD"
and "GF"), with a quantity value (representing sales) 94 of $500.33. The
example marketing investment data 98 for the example record 29' indicates
a marketing program investment of $27.50, which was determined by
adding the store display per saleable cost 64 of $15 to the gift marketing
program per saleable cost 64 of $12.50 ($15 + $12.50 = $27.50). As will
be understood the marketing program investment data 98 may either be
calculated by the system 10 by adding the appropriate cost data 64
together, or may be previously compiled by marketing or other systems and
communicated to or extracted by the system 10.
[0047] While the example measureables data records 29 indicate that
each saleable 27/92 is sold through each distribution channel 35/93, it
should be understood that in some implementations, it may not be the case
that a saleable 27 is sold through every distribution channel 35. In such
instance, the measurables data storage 28 may only include a
measurables data record 29 corresponding to each combination of a
saleable 27/92 and a distribution channel 35/93 in which the saleable 27 is
distributed through such distribution channel 35.
[0048] Referring now to Figure 8, illustrated therein is an example of
the type of marketing program segment data records 33 typically stored in
CA 02539894 2006-03-16
-12-
the program segment data storage entity 32. Typically, the program
segment data 33 includes a unique program segment identifier 110
together with Boolean data 112A, 112B, 112C corresponding to each
marketing program 60.
[0049] As will be understood, a marketing program segment data
record 33 has been created for each possible combination of marketing
programs 60, including a"None" record 33' in which the segment 110
includes none of the marketing programs 60. As can be seen, the Boolean
data 112A, 112B, 112C indicates whether the corresponding marketing
program 60 is present in the marketing program segment 110.
[0050] Referring now to Figure 9, illustrated therein is an example of
the type of segmented saleables data records 39 typically stored in the
segmented saleables data storage entity 38. Typically, the segmented
saleables data 39 includes a campaign identifier 120 corresponding to
campaign identifiers 70 in the campaign records 25. The segmented
saleables data 39 will typically also include saleables identifiers 122
corresponding to the saleables identifiers 80 stored in the saleables data
records 27, together with a location identifier 123 corresponding to the
location identifiers 84 in the locations data records 35. A marketing
program segment identifier 124 corresponding to the marketing program
segment identifiers 110 in the marketing program segment data records 33
is also provided.
[0051] One segmented saleables data record 39 is preferably created
for each saleable 92 /location 93 combination in the measureables data
storage entity 28. Each such saleable 122, 92/location (or other distribution
channel) 123, 93 combination is uniquely associated with a corresponding
marketing program segment 124, 110, correlated to all of the marketing
programs 60 applied to the saleable 122 at that location 103 as will be
discussed in greater detail below.
[0052] Referring now to Figure 10, illustrated therein is an example of
the type of segmented measureables data 39 typically stored in the
CA 02539894 2006-03-16
-13-
segmented measureables data storage entity 38. The segmented
measureables data 39 typically corresponds to the measureables data 29
and as a result may include campaign identifier 190, saleables identifier
192, location identifier data 193, quantity data 194, growth margin data
196, and marketing investment data 198 corresponding to the similarly
named data 90, 92, 93, 94, 96, 98 in the measurables data records 29,
respectively. In addition, the segmented measureables data 39 preferably
includes a marketing program segment identifier 199 corresponding to the
marketing program segment identifiers 110 in the marketing program
segment data records 33.
[0053] Referring to the example segmented measurables data record
39' in Figure 10 (in conjunction with the data in Figures 2, 4, 6 & 8), it can
be seen that during the Halloween campaign (campaign identifier 70, 190 =
"C200509"), the hair gel (saleable identifier 192, 80 ="S7") was sold in the
Toronto store (location identifier 193, 103 ="L1 ") in association with the
store display and loyalty card marketing programs (marketing program
segment identifier 199, 110 ="SD_LC"), with a quantity value (representing
sales) 194 of $183.41. The example marketing program investment data
198 for the example record 29' indicates a marketing program investment
of $25.00, together with a growth margin 196 of $75.6.
[0054] Another example segmented measurables data record 39"
indicates that during the Halloween campaign (campaign identifier 70, 190
= "C200509"), the lipstick (saleable identifier 192, 80 ="S10") was sold in
the Ottawa store (location identifier 193, 103 ="L2") without the use of any
marketing program (marketing program segment identifier 199, 110 =
"none"), with a quantity value (representing sales) 194 of $13.82. The
example data 39" also indicates that the sales of the lipstick had a growth
margin of $2.1, with no marketing program investment 198 (which is
consistent with the absence of marketing programs 199).
[0055] Referring now to Figure 11, this figure is a flow chart setting out
the process 200 carried out by the system 10. Initially, the system 10
CA 02539894 2006-03-16
-14-
receives the raw data 13 and stores it in the data storage (Block 202). As
previously noted, the raw data 13 which comprises the majority of the sales
and campaign data 23, 25, 27, 29, 31, 35 may be previously generated or
collected by marketing or other systems and communicated to or extracted
by the system 10. However, it should be understood that the system 10
may comprise part of a larger sales system, in which case the system 10
may not require the step 202 of duplicating such data.
[0056] The segmentor 42 determines the marketing program segments
110 (Block 204). The segmentor 42 may do this by accessing the
marketing program data records 23 to determine the number, N, of
marketing programs 60 utilized by the various marketing campaigns 70.
The segmentor 42 may then determine the number of different
combinations of marketing programs 60. As will be understood, the
number of different possible combinations of marketing programs 60 (and
hence marketing program segments 110) is 2N
[0057] Thus, in the example marketing program data 23 illustrated in
Figure 2, three different marketing programs 60 are illustrated ("Store
Display", "Loyalty Card" and "Gift"). Accordingly, based on the example
data 23 the segmentor 42 would determine there are 23=8 potential
combinations of marketing programs 60 (including an empty combination,
"None", with no marketing program 60), and may create the program
segment data records 33. As will be understood, each marketing program
segment 33 may be determined by utilizing Boolean vector data
representing values from 0 to 2N-1 (in binary) and illustrating each possible
combination with "1"s and "O"s. In the example provided by Figure 8 the
Boolean vector data 113A, 113B, 113C, 113D, 113E, 113F, 113G, 113H
have the values: "000", "001", "010", "011 ", "100", "101", "110", and "111",
respectively.
[0058] Each column of Boolean data 112A, 112B, 112C corresponds to
each marketing program 60, and each "1" is a flag indicating that the
corresponding marketing program 60 is present in the program segment 33
CA 02539894 2006-03-16
-15-
(and conversely, each "0" is a flag indicating that the corresponding
marketing program 60 is not present in the particular program segment 33).
With the exception of "None", each segment identifier 110 preferably
corresponds to a concatenation of marketing program identifiers 60 present
in the segment 33, but other appropriate identifiers 110 may also be used.
[0059] Once the program segments 33 have been determined, the
correlator 44 will create an association between the segments 33 and the
saleables (Block 206). Effectively, this provides an association between
the marketing program segments 33 and the raw data 13 and particularly
the measurables data 29.
[0060] One approach the correlator 44 may be programmed to perform
this task is by utilizing the association data 31 in the association data
storage entity 32 (together with the saleables data 23 and the location data
35, if applicable) to generate and store the segmented saleables data 37 in
the segmented saleables data storage entity 36. For each saleable 27 (or
saleable 27/location 35 combination) for a campaign 100, the correlator 44
may create a segmented saleables data record 37. By scanning the
marketing program identifiers 104 in the association data 31 for each
saleable 27, 102 (or saleable 27, 102/location 35, 123 combination) the
correlator 44 may determine the unique marketing program segment
identifier 110 which correlates to each of the marketing programs 104
applied to the saleable 27, 102 (or saleable 27, 102/location 35, 123
combination) and save the marketing program segment identifier 110, 124
in the corresponding segmented saleables data record 37. If no marketing
program 104 exists for a saleable 27, 102 (or saleable 27, 102/location 35,
123 combination), then the marketing program segment identifier 110, 124
is determined to be "None", as will be understood (referred to herein as a
"non-marketing program segment").
[0061] Referring briefly to the sample association data 31 in Figure 6, it
can be seen that the saleable 102 and location 103 combination "S7" and
"L1" respectively has two corresponding association records 31, each
CA 02539894 2006-03-16
-16-
indicating a marketing program identifier 104 "SD" and "LC", respectively.
A corresponding segmented saleables record 37' for the saleable 102 and
location 103 combination "S7" and "L1" has been created in which the
marketing program segment identifier 124 has been saved as "SD_LC".
[0062] The correlator 44 may be programmed to then generate and
store the segmented measurables data 39 in the segmented measurables
data storage entity 38. By matching each saleable 122 and location 123
combination in the segmented saleables data records 37 to corresponding
saleable 92 and location 93 combinations in the measurables data records
29, corresponding segmented measurables data. records 39 may be
created and stored, each including the corresponding segment identifier
124, 199.
[0063] Turning briefly now to Figures 12 and 13, illustrated therein are
schematic diagrams contrasting the potential one-to-many relationships
between each of a plurality of saleables 27 and three unsegmented
marketing programs 23 (Figure 12) which have been used in a campaign
as may exist in raw data 13 supplied to the system 10, and the one-to-
one relationship between each saleable 27 and the segmented marketing
programs 110 (Figure 13) once the marketing program segments 110 have
20 been determined and associated with the saleables 27 following Blocks
204 and 206.
[0064] For the sake of simplicity in the illustrations, the saleables data
27 illustrated in Figures 12 and 13 represents data for a company having a
single "location" (or possibly for which the measurables data 29 has not
25 been separated by location), and hence does not include location data 35.
Alternatively, as noted, each saleable in the schematic diagrams (Figures
12 & 13) may represent a unique combination of a saleable 27 and location
(or other distribution channel).
[0065] As can be seen in Figure 12, the saleable 27 identified as "SAl"
30 has a plurality of relationships to marketing programs 23 as it is
illustrated
as having links to both the "SD" and "LC" marketing programs 23,
CA 02539894 2006-03-16
-17-
indicating that it has been marketed under both programs 23. Figure 13
illustrates the same "SA1" saleable 27 following the segmentation and
association steps of blocks 204 and 206, having a single relationship to a
marketing program segment 110, "SD_LC". .
[0066] Referring again to Figure 11, once the marketing program
segments 33 have been determined and associated with the measurables
data 29 as set out in Blocks 204 and 206, the system 10 calculates the
efficiency of the marketing program segments 33 (Block 208).
[0067] To determine the efficiency of the segments 33, the efficiency
calculator module 46 may be programmed to determine the quantity of
sales for each saleable 27 (or saleable 27 and location 35 (or other
distribution channel) combination), which data can be retrieved from the
sales data 194 of the segmented measurables records 39.
[0068] Figure 14A illustrates an example efficiency report 300 for a
campaign 25 containing line entries 300A based on ROMI as may be
generated by the efficiency engine 14. Such a report 300 will preferably
include a campaign identifier 301 which may include a campaign code
301A and/or a campaign name 301B corresponding to a campaign
identifier 70 and campaign name 72, respectively, in the campaign data
records 25.
[0069] The report 300 will also preferably be provided with a segment
identifier 302. Typically, the segment identifiers 302 will correspond to the
segment identifiers 110, in the marketing program data records 33. The
report 300 may also include an entry 300A' having a"TotaP' segment
identifier 302 corresponding to efficiency calculations for all saleables 27
sold in association with at least one marketing program 23 (ie. for all
saleables 27, 192 (or saleable 27, 102/location 35, 123 combination) other
than those indicating a "None" segment identifier 199 in the segmented
measureables data records 39). As will be understood, typically the report
300 will include one entry 300A corresponding to each marketing program
CA 02539894 2006-03-16
-18-
segment 33, 199 listed on the segmented measureables data storage entity
32 (other than the "None" segment 33').
[0070] Each entry 300A will also preferably include a growth margin
value 304 typically determined by summing the growth margin data 196
from each segmented measurables data record 39 for the campaign 190,
401A in which the segment identifier 199 corresponds to the segment
identifier 302 for the entry 300A. Similarly, a marketing investment value
306 will preferably be provided and typically determine by summing the
marketing investment data 198 from each segmented measureables data
record 39 for the campaign 190, 401A in which the segment identifier 199
corresponds to the segment identifier 302 for the entry 300A.
[0071] A ROMI efficiency value 308 for each entry 300A is also
preferably determined and provided. To calculate the ROMI values 308 for
the example ROMI efficiency report 300 entries 300A, the efficiency engine
14 may utilize the following equation (EQ. 1) in which GM represents
growth margin 304 and MPI represents marketing investment 306:
EQ 1. ROMI = GM - MPI
MPI
[0072] Figure 14B illustrates an alternate style of efficiency report 400
for a campaign 25 containing line entries 400A as may be generated by the
efficiency engine 14. Such a report 400 will preferably include a campaign
identifier 401 which may include a campaign code 401A and/or a campaign
name 301 B corresponding to a campaign identifier 70 and campaign name
72, respectively, in the campaign data records 25.
[0073] If applicable, the report entries 400A may include a location
identifier 402 corresponding to a location identifier 84 in the location data
records 35.
[0074] The report entries 400A will also preferably be provided with a
segment identifier 404. Typically, the segment identifiers 404 will
CA 02539894 2006-03-16
-19-
correspond to the segment identifiers 110, in the marketing program data
records 33.
[0075] For each location 402, the report 400 may also include an entry
400A' having a"AII Products in Promotion" segment identifier 404
corresponding to efficiency calculations for all saleables 27 sold in
association with at least one marketing program 23 (ie. for all saleables 27,
192 (or saleable 27, 102/location 35, 123 (or other distribution channel)
combination) other than those indicating a "None" segment identifier 199 in
the segmented measureables data records 39).
[0076] For each location 402, the report 400 may also include an entry
400A" having an "All Products Not in Promotion" segment identifier 404
corresponding to efficiency calculations for all saleables 27 for which no
marketing program 23 was used (ie. for all saleables 27, 192 (or saleable
27, 102/location 35, 123 combination) indicating a "None" segment
identifier 199 in the segmented measureables data records 39).
[0077] As will be understood, for each different location 402, typically
the report 400 will include one entry 400A corresponding to each marketing
program segment 33, 199 listed on the segmented measureables data
storage entity 32 (including the "None" segment 33' and an "All Products in
Promotion" segment).
[0078] Each entry 400A will preferably include sales data 406
corresponding to the segment 404 for the particular location 402. The
sales data 406 is calculated by summing the sales data 194 for the
campaign 190, 401A from each segmented measurables data record 39 in
which the segment identifier 199 corresponds to the segment identifier 404
for the entry 400A ("None" in the case of "All Products Not in Promotion").
As will be understood, in the case of the "All Products in Promotion" entry
400A', the sales data 406 is calculated by summing the sales data 194 for
the campaign 190, 401A from each segmented measurables data record
39 in which the segment identifier 199 is not "None".
CA 02539894 2006-03-16
-20-
[0079] Each entry 400A will preferably also include number of
saleables data 408 corresponding to the segment 404 for the particular
location 402. The number of saleables data 408 is calculated by totaling
the number of different saleables 192 coresponding to the location 402,
193 for the campaign 190, 401A from each segmented measurables data
record 39 in which the segment identifier 199 corresponds to the segment
identifier 404 for the entry 400A ("None" in the case of "All Products Not in
Promotion"). As will be understood, in the case of the "All Products in
Promotion" entry 400A', the number of saleables data 408 is calculated by
totaling the number of different saleables 192 coresponding to the location
402, 193 for the campaign 190, 401A from each segmented measurables
data record 39 in which the segment identifier 199 is not "None".
[0080] Each entry 400A will preferably also be provided with sales %
data 410 for the location 402 corresponding to the ratio of the sales value
406 of the segment 404 relative to the total of all sales 194 corresponding
to the location 192, 402 in the segmented measurables data records 39 for
the campaign 190, 401A. Alternatively, the total of all sales 194 may be
calculated by adding the sales 406 values in the "All Products Not in
Promotion" 400A" and "All Products in Promotion" 400A' entries.
[0081] Each entry 400A will preferably also be provided with number of
saleables % data 412 for the location 402 corresponding to the ratio of the
number of saleables 408 of the segment 404 relative to the total number of
all saleables 27. In the example entry 400A", it can be seen that since
there was a total of "5" saleables 408 in the "All Products Not in Promotion"
segment 404, and there were "14" saleables 27 in total, the number of
saleables % data 412 is illustrated as "36%" (5/14 = 36%).
[0082] An efficiency value 414 is also provided. The efficiency value
414 for each entry 400A is calculated as the ratio of the sales % value 410
relative to the number of saleables % value 412 for that entry 400A. For
example, referring to entry 400A', the efficiency value 414 is listed as 121 %
(78%/64% = 121%)
CA 02539894 2006-03-16
-21 -
[0083] While the ROMI efficiency report 300 and alternate efficiency
report 400 illustrate two different types of efficiency analyses which can be
conducted on raw data 13 once the marketing programs have been
segmented as described herein, it should be understood that other types of
efficiency analyses can be performed. Furthermore, while various data
entities and data have been illustrated and described herein, it should be
understood that other structures for the entities and data may be created
and used in accordance with the present invention.
[0084] Thus, while what is shown and described herein constitute
preferred embodiments of the subject invention, it should be understood
that various changes can be made without departing from the subject
invention, the scope of which is defined in the appended claims.