Note: Descriptions are shown in the official language in which they were submitted.
CA 02545391 2006-05-10
WO 2005/047488 PCT/AU2004/001577
- 1 -
SELECTIVE ENRICHMENT OF MICROORGANISMS FOR DESIRED METABOLIC PROPERTIES.
RELATED APPLICATIONS
The present application claims priority from AU
2003906290, the entire contents of which are incorporated
by reference.
FIELD OF THE INVENTION
The present invention relates to a method for microbe
and/or enzyme discovery. In particular, the present
invention relates to a method for selectively enriching
and thereby discovering a microorganism which can
metabolise a test substrate. The present invention also
enables the discovery of enzymes produced by a
microorganism involved in the metabolism of a test
substrate.
BACKGROUND OF THE INVENTION
Techniques such as passaging in batch culture are
still used today for the discovery of microorganisms which
can metabolise a test substrate. These techniques are
often labour intensive, slow and the expected outcome is
not known until the enriched microbial population is
plated onto selective media. Traditional methods for
monitoring the activity or growth of a microbial
population include measurement of biomass concentration
and/or measurement of substrate consumption. These
analytical techniques do not provide an assessment of the
status of a microbial population in real-time to enable
the status of the microbial culture to be determined, and
intervention to occur if necessary.
The chemostat provides continuous culture and has
been used for enrichment to facilitate the discovery of
microorganisms with useful properties and the study of
evolutionary pathways. The effectiveness of conventional
continuous culture is limited because the status of the
discovery process cannot be evaluated rapidly. In a
CA 02545391 2006-05-10
WO 2005/047488 PCT/AU2004/001577
_ 2 -
limited number of cases carbon dioxide production and
oxygen consumption have been used to monitor a continuous
culture. However these techniques have been subject to a
range of limitations imposed by the small number of
applications to which the techniques have been considered
applicable, and/or limitations based on deficiencies in
the apparatus. For one example, off-line analysis of
biomass concentration or residual substrate concentration
is commonly required to evaluate the status of an
enrichment process. Off-line analysis is time consuming
in terms of the slow analytical techniques involved, and
indeed the delays in developing an appropriate analytical.
procedure for determining analyte concentration.
Furthermore, a significant level of infrastructure and
staff trained in the use of the analytical equipment are
also required. .
Therefore, the applicants have identified a need for
faster methods for microbial discovery.
SUMMARY OF THE INVENTION
Accordingly, the present invention provides a method
of selectively enriching for a microorganism able to
metabolise a test substrate, and/or the enrichment of an
enzyme involved in the metabolism of the test substrate,
the method comprising the steps of
a) providing a population of microorganisms in a
vessel,
b) feeding fluid into the vessel at a controlled
flow rate commencing with an initial flow rate, the fluid
comprising a nutrient medium and, for at least part of the
feed period, the test substrate,
c) producing a signal indicative of the level of a
metabolism indicator over the time-frame of the
enrichment, and
d) providing an output based on the signal to
enable assessment of selective enrichment of~a
microorganism that metabolises the test substrate, and/or
CA 02545391 2006-05-10
WO 2005/047488 PCT/AU2004/001577
- 3 -
the enrichment of an enzyme produced by the microorganism
that is involved in the metabolism of the first substrate.
Where the microorganism produces an enzyme, or
enzymes, that are involved in the metabolism of the test
substrate, the method enables the selective enrichment of
a microorganism that produces such enzyme or enzymes.
The present inventors have found that the above
method for "on-line" determination of a change in the
level of a metabolism indicator, such as Oz, as an
indicator of cellular activity enables indirect
measurement of biomass or substrate utilisation and have
identified that this can be used to evaluate the~status of
a population of microorganisms in real-time. The
inventors have further tailored this technique fog
enriching microorganisms that are capable of metabolising
a test substrate, such as a hydrocarbon compound for which
a microorganism is desired to be found to convert the
compound (test substrate) into a different hydrocarbons)
and/or break the compound down with water as a byproduct.
Such metabolism may be accompanied by the production, or
up-regulation of,an enzyme or enzymes that are involved ins
the metabolism of the test substrate. Thus, the
metabolism of the microorganism also reflects an increase
in the population or amount of enzyme in the vessel
(compared to the relative amount of that enzyme in the
vessel at the outset of the procedure) that has the
desired function of catalysing the reaction of the test
substrate.
The technique developed by the inventors has further
advantages in terms of its flexibility in discovering
microorganisms capable of metabolising a test substrate in
conditions selected by the operator (i.e. a selective
pressure), and potentially modified by the operator over
time. The modification of conditions can be used to
identify microorganisms that have the capability of
producing an enzyme or enzymes that assist in the
metabolism of the test substrate under such conditions.
CA 02545391 2006-05-10
WO 2005/047488 PCT/AU2004/001577
- 4 -
This is of particular assistance in the identification of
microorganisms (and consequently, optionally, enzymes)
that are involved in the metabolism of substrates in harsh
r
or challenging conditions. All of this is evaluated in
real-time without the need to separately measure substrate
levels or determine biomass concentration.
In a preferred embodiment, the method further
comprises presetting conditions to be met by the signal
output to result in a change in the fluid flow rate, and
changing the flow rate at which fluid is fed into the
vessel when the conditions are met, wherein the preset
conditions are a combination of a predetermined period of
time and a preset value range within which the signal must
remain for the predetermined period~of time.
The flow rate of the fluid fed into the vessel is
suitably increased from the initial flow rate on meeting
the preset conditions to reduce the hydraulic retention
time, and thereby increase selectivity for a microorganism
that metabolises the test substrate. Increasing the flow
rate of the fluid fed into the vessel will facilitate the
selective enrichment of microorganisms which metabolise
the test substrate more quickly and therefore reproduce
more quickly. In effect, the preset conditions should be
set to define the maintenance of steady state in the
culture over the predetermined time period. The
predetermined time period may be in a time unit of
measurement (eg a number of minutes or hours), or may be
set by reference to a predetermined multiple (including
fractions) of the hydraulic retention time of the vessel.
Consequently it will be understood that the reference to a
predetermined time period need not be an exact, repeated
number of hours, especially if the fluid flow rate is
changed over time.
The flow rate of the fluid fed into the vessel may be
increased by increasing the flow rate of the test
substrate. Further, the fluid flow rate may be increased
by increasing the flow rate of the nutrient medium in
CA 02545391 2006-05-10
WO 2005/047488 PCT/AU2004/001577
- 5 -
addition to the test substrate. If the level of test
substrate in the vessel is sufficiently high it is
possible for the flow rate to be increased by increasing
the flow rate of the nutrient medium alone, although this
is not preferred. Where the flow rate of both the test
substrate and the nutrient medium is increased, it is
convenient for the flow rates to be increased
proportionally such that the concentration of the test
substrate in the fluid fed into the vessel remains
substantially constant.
The metabolism indicator used in the method of the
invention may be the uptake or release of a molecule
involved in metabolism of the test substrate. Generally,
such molecules are electron acceptors. These are
described in further detail in the Examples. Examples of
the metabolism indicator are oxygen, carbon dioxide,
carbonate, sulphur, sulphate, nitrate, fumarate and iron.
Others are also known. According to one specific
embodiment, the metabolism indicator is selected from
oxygen, sulphate, sulphur, nitrate, fumarate and iron.
The signal of the level of the metabolism indicator
is preferably provided as a visual output, such as a plot
of points which represent the level of the metabolism
indicator against time. The signal output will be an
electrical signal, and therefore the plot may be of the
electrical output (eg current) against time. Otherwise, in
the example of the metabolism indicator being oxygen
uptake, the electrical signal may be converted into oxygen
concentration or oxygen uptake rate, and this may be
plotted against time. The output could also be a numerical
digital or liquid crystal display. The visual output may
conveniently be updated in periods of less than 20
minutes. Ideally, the visual output is updated in periods
of 10 mins or less.
As a consequence.of this, in ,the embodiment where
conditions are pre-set to result in a change in the fluid
flow rate, the values set may be in units of the direct
CA 02545391 2006-05-10
WO 2005/047488 PCT/AU2004/001577
- 6 -
signal value, or indirectly by reference to the level of
the metabolism indicator, or any other related unit of
measurement.
In most situations, a controller will be set to
increase the flow of nutrient medium and/or test substrate
into the vessel in response to the signal meeting the
preset conditions. This particularly enables the
selecting of microorganisms that metabolise the test
substrate and reproduce quickly, as microorganisms not
able to reproduce quickly enough will be washed out of the
apparatus. Thus, according to one embodiment, the supply
mechanism operates to supply the nutrient medium and the
test substrate to the vessel at an initial flow rate, and
the controller is set to increase the flow rate from the
initial flow rate in response to the signal meeting the
preset conditions. However, it is appreciated by the
applicants that decreases could be set, especially i:n a
later s age of an operation being conducted on the
apparatus.
Generally, the intention of pre-setting the range
(upper and lower signal ranges) of the signal is to
identify when the culture has reached a steady-state.
Once a steady state has been identified, it is possible to
change the flow of fluid (nutrient medium and/or test
substrate) into the vessel.
The fluids fed into the vessel are most conveniently
fed in through separate feed or supply mechanisms.' Being
able to supply the two fluids separately offers more
control to the user in terms of modifying the conditions
under which the microorganisms are required to metabolise
and reproduce. Secondly, this offers advantages in terms
of switching from one test substrate to the next without
changing the nutrient medium fed into the vessel.
Preferably the preset range of.the signal is set by
the user. In the case where the signal is representative
of the level of oxygen in the vessel, the user preferably
selects the maximum and minimum levels in any appropriate
CA 02545391 2006-05-10
WO 2005/047488 PCT/AU2004/001577
unit of measurement, such as mg of oxygen per ml of liquid
in the vessel, biological oxygen demand (BOD), oxygen
uptake rate (OUR) or similar. Of course, where the
metabolism indicator being detected is another indicator
such as carbon dioxide, nitrate, iron or so forth, the
user suitably selects the maximum and minimum levels in
the unit of measurement relevant to those signals.
Preferably, the user also sets the predetermined time
period.
Preferably, the user also sets the pH level and
temperature of the vessel. As will be understood, this
then enables user to modify the conditions to select a
microorganism able to metabolise the test substrate in
specific conditions (eg high or low pH; high or low
temperature etc), or an associated enzyme. These
conditions can be set at levels that impose a selective
pressure (in addition to the pressure of the test
substrate) on the contents of the vessel to select for a
microorganism andlor enzyme that tolerates or utilises the
selective pressure. Possible selective pressures are an
increase or decrease in temperature, pH, aeration,
dissolved gas content, salt concentration, and the
presence or absence of a chemical compound such as a toxin
or nutrient component.
The user may further be able to set other conditions
that impact on the metabolism, such as the oxygen level or
aeration rate.
The population of microorganisms used in the method
of the invention may be a heterogeneous population, such
as activated sludge, or may be a homogeneous population.
Preferably the population of microorganisms is a
heterogeneous population. It may in this case be a
heterogeneous population containing at least 10,
preferably 100 different strains or species of
microorganism. This is explained further in the detailed
description.
CA 02545391 2006-05-10
WO 2005/047488 PCT/AU2004/001577
_ g _
The method of the invention may further comprise the
step of subjecting the population of microorganisms to a
mutagen, such as a chemical mutagen or ultra-violet light.
The method of the invention may further comprise the
step of isolating the enriched microorganism.
- The present invention further provides a
microorganism when enriched or isolated by the method
described above.
The invention also provides for a corresponding
method for assessing the selective enrichment over the
timeframe of the enrichment process, which includes steps
(a) to (d) as outlined above.
BRIEF DESCRIPTION OF THE DRAWINGS
Figure 1 is a schematic illustration of the apparatus
of one embodiment of the invention.
Figure 2 is a schematic illustration of the apparatus
of Figure 1 with further apparatus components.
Figure 3 shows the correlation between OUR and
microbial activity as determined by conventional
analytical techniques, as well as the correlation between.
different conventional analyses, using acetic acid as the~,-
test substrate.
Figure 4 shows the correlation between OUR and
microbial activity as determined by conventional
analytical techniques, as well as the correlation between
different conventional analyses, using sodium acetate as
the test substrate.
Figure 5 shows the correlation between OUR and
microbial activity as determined by conventional
analytical techniques, as well as the correlation between
different conventional analyses, using benzyl alcohol as
the test substrate.
Figure 6 demonstrates the correlation between a
population change and BOD - the BOD and residual substrate
concentration.
CA 02545391 2006-05-10
WO 2005/047488 PCT/AU2004/001577
Figure 7 demonstrates the correlation between a
population change and BOD - the changes to the population
as measured using viable cell counts and optical density.
Figure 8 shows the increase in BOD after the addition
of 1-methyl-2-pyrrolidinone to a culture.
Figure 9 shows BOD during growth of microorganisms
from activated sludge on 1-methyl-2-pyrrolidinone.
Figure 10 shows BOD output during growth of
microorganisms from activated sludge using dodecane as the
test substrate.
Figure 11 shows the effect of flow rate on the BOD of
a 1,3-propanediol-degrading microbial population.
Figure 12 shows the optical density (OD) readings of
samples taken from the vessel in Example 7 at different
feed flow rates.
Figure 13 is a graph of dilution rate against enzyme
activity for the isolates described in Example 7.
Figure 14 is a graph of the biological oxygen demand
reading taken from the vessel over time in Example 8.1.
Figure 15 is a micrograph of a sample taken at a late
stage of operation of the method of the invention at 80°C
in accordance with Example 8.2.
Figure 16 is a graph of relative nitrate
concentration over time and pH over time for the contents
of the vessel during population development in Example 9.
Figure 17 is a graph of relative nitrate
concentration over time and pH over time for the contents
of the vessel over the full operation of Example 9.
Figure 18 is a micrograph of a sample taken at a late
stage of operation of the invention in accordance with
Example 9.
DETAILED DESCRIPTION OF PREFERRED EMBODIMENTS
The present invention provides a method for the
selective enrichment of a microorganism able to metabolise
a test substrate. It will be understood that a
"microorganism'° means any microorganism, for example,
CA 02545391 2006-05-10
WO 2005/047488 PCT/AU2004/001577
- 10 -
bacteria, fungi, yeast, protozoans, algae or viruses. Any
of these microorganisms can be selectively enriched by
designing the enrichment conditions to favour the growth
of a microorganism with a particular characteristic. The
microorganism may be an aerobic or anaerobic
microorganism. Specific microorganisms in one or the
other of these classes can be enriched by imposing the
appropriate conditions for either aerobic respiration or
anaerobic respiration to select for a microorganism in the
chosen class.
An enzyme is a protein which catalyses a chemical
reaction, such as a metabolic reaction. The enzyme may be
directly or indirectly associated with the microorganism
which produces the enzyme. For example, the enzyme may be
non-covalently bound to the cell membrane of the
microorganism, may be located in the cytoplasm of the
microorganism, or may be one secreted from the cell into
the surrounding medium.
Where the chemical reaction is a metabolic reaction,
the enzyme is involved in the metabolism of a test
substrate. As used herein, "involved" means that the
enzyme catalyses a reaction which is part of a metabolic
pathway. The enzyme may catalyse more than one reaction
in the metabolic pathway, and may catalyse anabolic or
catabolic reactions. Typically, the enzyme will catalyse
at,least the first reaction in a metabolic pathway.
It must be noted that as used herein, the singular
forms "a", "an", and "the" include plural reference unless
the context clearly dictates otherwise. Thus, for
example, reference to a microorganism includes a plurality
of microorganisms.
As used herein, the term "enrichment'° means an
increase in the number (or relative concentration) of
" microorganisms in a population which are able to
metabolise the test substrate compared to microorganisms
that do not metabolise the test substrate, or an increase
in the number of molecules (or relative concentration) of
CA 02545391 2006-05-10
WO 2005/047488 PCT/AU2004/001577
- 11 -
the enzyme involved in metabolism of the test substrate
compared with the starting enzyme population of the
population of microorganisms.
In the case of enzymes, in addition to increasing the
number of molecules of the enzyme in the vessel, the
enzyme may be mutated over the time period of the
enrichment to improve its properties in the conditions to
which it is exposed in the vessel. Examples of the
improved properties are increased catalytic rate,
tolerance to a selective pressure (such as high
temperature - i.e. thermal tolerance) or utilisation of
the condition. Indeed, the method of the invention
provides an excellent environment and feedback information
to drive the enzymes towards such mutations.
In step (b) of the. method, the feeding of fluid into
the vessel drives or results in the selective enrichment
of the microorganism (and/or enzyme) that metabolises the
test substrate.
"Metabolise" means to use the test substrate in a
chemical reaction within the~microorganism by either
catabolism or anabolism. Therefore a test substrate may
be used in a chemical reaction that combines the test
substrate into a more complex molecule, or may be used in
a chemical reaction which breaks down the test substrate
into a simple molecule.
The "test substrate" is any substrate for which it is
desired to screen for a microorganism able to metabolise
the test substrate and does not include substrates which
are commonly metabolised, such as glucose and acetate.
The purpose of the method of the invention is to arrive at
a microorganism population that is able to metabolise the
test substrate, and/or an enzyme associated with the
metabolism. Generally the method is suited for the
situation where a microorganism or enzyme is desired to be
formed which has the ability to metabolise a new (test)
substrate which no suitable microorganism is known to
metabolise. Such test substrates may be environmental
CA 02545391 2006-05-10
WO 2005/047488 PCT/AU2004/001577
- 12 -
toxins, waste materials, undesired byproducts of a
reaction.
The technique and the controls required are very
different to techniques where the substrate is known to be
a substrate for certain microorganisms, or is a common
substrate for a large range of microorganisms. Typically,
the method of the invention will be used to selectively
enrich microorganisms which can metabolise an organic
carbon-containing molecule. The term "organic carbon-
containing molecule" refers to aliphatic and aromatic
hydrocarbons and derivatives thereof, including
carbohydrates other than commonly metabolised substrates
such as glucose. Alternatively, the test substrate may be
a sulphur-containing test substrate and/or a nitrogen-
containing test substrate.
The method comprises the step of providing a
population of microorganisms in a vessel.
It will be clearly understood that the population of
microorganisms may be a homogeneous population. of
microorganisms or may be a heterogeneous population of
microorganisms. A homogeneous population may be useful to
selectively enrich for a microorganism by evolution.
A homogeneous population is one which contains a single
species, but which may be a phenotypically heterogeneous
population before, during and/or after enrichment.
Where the population of microorganisms is a
heterogeneous population this may be, for example, a
microbial library or a heterogeneous population, such as
activated sludge. A good diversity of the starting
population of microorganisms, gives very good results in
the method of the invention. Therefore, the heterogeneous
population preferably comprises at least 10, preferably at
least 100 different strains of microorganism. The
heterogeneous population more preferably comprises at
least 10, preferably at least 100 different species of
microorganism, for increased diversity. The greater the
CA 02545391 2006-05-10
WO 2005/047488 PCT/AU2004/001577
- 13 -
diversity of the population, the better the anticipated
results.
Activated sludge is the product that results when
primary effluent of raw sewage is mixed with bacteria-
laden sludge and then agitated and aerated to provide
biological treatment in order to accelerate the breakdown
of organic matter in the raw sewage undergoing secondary
waste treatment. The present inventors have successfully
used activated sludge as the starting microbial population
in the method of the invention to enrich for
microorganisms able to metabolise diverse test substrates
under a diverse range of conditions. This population has
over 100 different species (and over 100 strains) of
microorganisms.
The fluid comprises a nutrient medium and the test
substrate. A "nutrient medium" is a growth medium which
comprises all of the nutrients required for growth of a
microorganism but essentially no amount of the test
substrate or substrates similar to (eg in the same class
as) the test substrate. The concept of "similar
substrates" to the test substrate is described below. The
nutrient medium will depend upon the microbial population
being enriched and the substrate being tested. However it
is generally a nitrogen (ammonium), phosphorus, sulphur,
salt (eg Na, Mg, Ca) and trace metal-containing solution.
For example, when the method of the invention is used to
enrich for microorganisms able to metabolise acetic acid
(an organic carbon-containing substrate), the nutrient
medium may be that set out in the Examples below. The
nutrient medium may contain a trace amount of the similar
substrate provided that the amount does not interfere with
the detection of the enrichment process. The amount of
the similar substrate must be such that it does not
interfere with detection of the enrichment process.
Ideally, the nutrient medium contains no similar
substrates. For example, where the test substrate is an
organic carbon-containing test substrate the nutrient
CA 02545391 2006-05-10
WO 2005/047488 PCT/AU2004/001577
- 14 -
medium contains substantially no organic carbon-containing
material. There is also the possibility that the test
substrate could be used as the sole source of another
nutrient other than carbon, for example nitrogen or
sulphur. In this case the nitrogen or sulphur would need
to be eliminated from the nutrient medium or kept at a
concentration that does not interfere with enrichment
process.
"Similar substrate" means a substrate which the
microorganism can metabolise as an alternative to the test
substrate. For example, where the method is used to
selectively enrich a microorganism able to catabolise a
particular organic carbon-containing substrate, a similar
substrate is an alternative carbon-containing substrate
which the microorganism is able to catabolise. Where the
test substrate is a small hydrocarbon molecule, "similar
substrates" to be avoided in the nutrient medium are other
small hydrocarbon (including carbohydrate) molecules, such
as glucose and acetate.
The test substrate may be fed into the vessel as part
of the nutrient medium or separately to the nutrient
medium. For better control, these fluids can be fed into
the vessel independently.
The initial flow rate at which the nutrient medium
and test substrate are fed into the vessel, or hydraulic
retention time, is chosen by reference to factors such as
the starting population of microorganisms, the nutrient
medium, the temperature of the vessel and the fluid, the
pH of the fluid, and the stage of enrichment, and the
vessel volume. Hydraulic retention time is a measure of
the length of time that~liquid remains in the vessel. It
equals V/Q (V = vessel volume, Q = flow rate). Typically
the initial hydraulic retention time will be relatively
long in order to establish a steady state within the
vessel. During feeding of the fluid into the vessel,
there is also an outflow (or overflow) of fluid exiting
CA 02545391 2006-05-10
WO 2005/047488 PCT/AU2004/001577
_ 15 _
the vessel, such that the fluid volume in the vessel
remains constant.
The selective enrichment of a microorganism and/or
enzyme is made possible through the on-line monitoring a
signal representative of the level of metabolism
indicator, and the real-time output based on the signal.
As used herein, "on-line" means that a reading of the
level of metabolism indicator is taken directly from the
contents of the 'vessel, be that the fluid in the vessel or.
gas in the headspace of the vessel, and is electronically
converted into the output. Generally this means that the
signal is taken and the output produced without direction
or human involvement. The reading may be taken in the
vessel itself or in a conduit through which contents of
the vessel may flow.
The signal may be produced by a probe positioned to
take readings from the contents of the vessel.
The purpose of this arrangement is to enable signal
readings to be taken without removal of fluid from the
apparatus, including the vessel and any associated
conduits. Monitoring the level of a metabolism indicator ,
on-line alleviates the need for off-line analyses in order
to monitor enrichment and therefore facilitates the real-
time determination of enrichment.
As used herein, "real-time" means that the output of
the level of the metabolism indicator is provided fast
enough to enable the status of the microbial culture in
response to a change in conditions to be determined, and
intervention to occur if necessary. An example of
intervention provided by real-time monitoring is that
which prevents the loss of a microbial population in
response to a change in the conditions of the population
that does not enable metabolism of the test substrate by a
microorganism in the population. The frequency required
to provide the output of the level of the metabolism
indicator will depend upon the status of the enrichment
process and the growth rate of the microorganism being
CA 02545391 2006-05-10
WO 2005/047488 PCT/AU2004/001577
- 16 -
enriched. The output of the level of the metabolism
indicator should be updated in periods of 20 minutes or
less, most suitably around 10 minutes or less.
The metabolism indicator may be any indicator of
metabolism, for example a molecule consumed during
metabolism such as oxygen, or a molecule produced by
metabolism, provided only that the level of the metabolism
indicator is able to be monitored on-line and used to
provide an output of the level of the metabolism
indicator. Examples of metabolism indicators identified
as being capable of being monitored on-line with a probe
are oxygen, carbon dioxide, carbonate, sulphate, sulphur,
nitrate, fumarate and iron. These molecules act as
terminal electron acceptors in the metabolism and the
level of their presence in solution can be detected by a
probe.
According to one embodiment, the oxygen uptake rate
(OUR) of the microbial culture may be used as the
metabolism indicator, particularly for the identification.
of aerobes. This can be determined by adding oxygen to the
culture followed by the determination of a change in the
oxygen level after a specific time period. The OUR gives
a real-time measure of both substrate utilisation and
growth of the population. By using this value to calculate
the biological oxygen demand (BOD) of the test substrate
in the fluid fed into the vessel, the level of substrate
utilised can be determined. This is described further
below in the examples.
Similar calculations can be used for any other
metabolism indicator and signal or probe combination. For
example, in the situation where the microbe is an anaerobe
and does not use oxygen to respire during metabolism of
the target molecule, but instead uses nitrate as the
terminal electron acceptor, a nitrate probe can be used to
monitor levels of nitrate.
The method of the invention may further comprise
subjecting the microorganism population to a mutagen. As
CA 02545391 2006-05-10
WO 2005/047488 PCT/AU2004/001577
- 17 -
used herein, a mutagen is an agent which induces a change
in the phenotype of a microorganism. A person skilled in
the art will be readily able to determine a suitable
mutagen, for example a chemical mutagen or an ultra-violet
light with a wave length of 10 nm to 400 nm may be used.
The method of the invention may further comprise the
step of discovering the enriched microorganism and/or
enzyme. Discovery refers to isolation of the enriched
microorganism and/or enzyme. This step may be readily
performed by the person skilled in the art using standard
microbiological techniques.
For example, where the enrichedamicroorganism is a
bacteria, a sample of the enriched culture may be plated
onto solid nutrient medium which contains the test
substrate, and the plate incubated under the conditions
which enable enriched bacteria to metabolise the test
substrate. Individual colonies formed by the enriched
bacteria can then be isolated, and subjected to further
characterisation steps if required.
Methods of isolating enzymes from microorganisms are
known in the art. The method used will depend upon the
source of the enzyme, the enzyme to be isolated, and the
purity in which the enzyme is required to be isolated.
A typical method of isolating an enzyme would
include:
1) Preparation of crude extract, such as by cell
lysis or membrane solubilisation;
2) An optional step of removal of nucleic acids,
and/or ribosomes;
3) Precipitation with a precipitating agent such as
(NH4)2504;
4) Purification, usually by chromatography such as
one or more of affinity, gel filtration, ion-exchange, and
hydroxyapatite chromatography; and
5) Removal of salt from the enzyme,,for example by
filtration.
CA 02545391 2006-05-10
WO 2005/047488 PCT/AU2004/001577
- 18 -
This is one example of a method of isolating an
enzyme from a microorganism, and it will be understood
that any other methods known in the art could be used.
Where not otherwise described herein, the techniques
employed in putting the invention.into practice are
conventional microbiological and chemical techniques known
within the art. Such techniques are well known to the
skilled worker, and are fully explained in the literature.
See, eg., Bergey's Manual of Systematic Bacteriology;
Bergey's Manual of Determinative Bacteriology; The
Prokaryotes,, Starr, Stolp, Truper, Balows, Schlegel,
editors; Handbook of Microbiological Media, Atlas; Biology
of Microorganisms, Brock, Madigan, Martinko and Parker;
Methods for General and Molecular Bacteriology, Gerhardt,
Murray, Wood, Krieg, editors.
The invention will now be described by way of the
following non-limiting 'examples and drawings. Although any
materials and methods similar or equivalent to those
described herein can be used to practice or test the
invention, the preferred materials and methods are now
described.
EXAMPLES
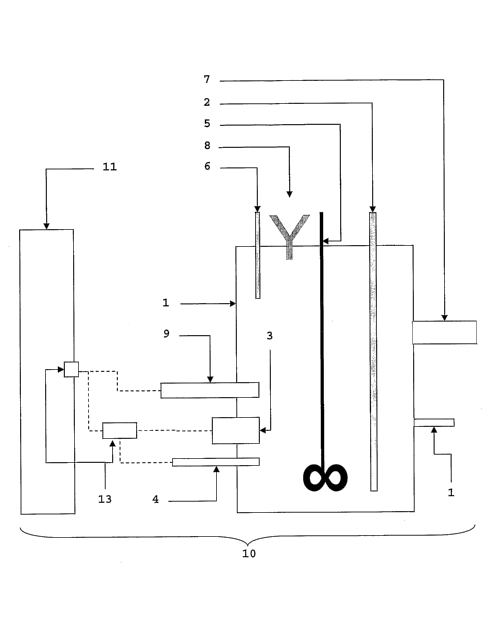
Figures 1 and 2 illustrate an example of the
apparatus upon which the method of the present invention
can be performed when the metabolism indicator is oxygen.
Variations on the device for other metabolism indicators
are set out in following Examples. The apparatus
comprises a vessel or bioreactor 1 with an oxygen (air)
injection means 2 and a dissolved oxygen measuring probe
3. The vessel is also associated with a temperature
control means, including a temperature probe 4. The
vessel also includes a stirrer 5 for stirring the contents
of the vessel.
Fluid is fed into the vessel through inlet 6. The
embodiment illustrated contains one inlet for feeding a
combination of nutrient medium and test substrate, however
CA 02545391 2006-05-10
WO 2005/047488 PCT/AU2004/001577
- 19 -
separate inlets for each may be provided. A supply
mechanism (not illustrated) controls flow of fluid into
the vessel via inlet 6. The supply mechanism is connected
to a nutrient medium supply well and a test substrate
supply well (also not shown) to enable the control of the
ratio of. the two fluids, and the flow rate into the vessel
1. Overflow fluid is removed from the vessel via fluid
outlet 7.
The,apparatus further comprises an inlet 3 for the
supply of acid and alkali for the control of pH in the
vessel. Two inlets, are each for acid.and base, can
alternatively be used. The pH of the fluid in the vessel
is measured by a pH probe 9.
Further components of the apparatus illustrated
include electronics plugs 13 and a sample line/drain 14.
The apparatus may be provided as a unit 10 containing
the elements described above, together with a control unit
11. The control unit 11 is under the control of a
computer 12, which includes a monitor and a keyboard. The
computer is programmed to provide a graphical user
interface with the control program which allows the user
to control the parameters described in the Examples that
follow. The computer interacts with the control unit so
that they together operate to control the supply mechanism
to control the supply of fluids into the vessel in
response to the probe signal.
The apparatus illustrated provides a series of visual
outputs. This output shows the settings entered by the
user for defining the pH, temperature, aeration level,
upper and lower limits of the probe signal range (measured
in this case in terms of the level of oxygen, measured in
mg 1-1) , the initial flow rate of inlet fluid, the flow
increment (positive value represents increase), and the
predetermined time period (which can be set as a number of
vessel volumes).
CA 02545391 2006-05-10
WO 2005/047488 PCT/AU2004/001577
- 20 -
The screen can be switched to an output of one of a
number of graphs including those illustrated (with
entries) in Figures 6 to 11.
The mechanical and program components of the
apparatus will be well understood to those skilled in the
relevant arts, in the light of the functional description
provided herein.
In the following examples, unless otherwise
specified, the nutrient medium used was a defined medium
(DM) prepared as outlined in the first section of Appendix
1.
EXAMPLE 1: CORRELATION BETWEEN OXYGEN UPTAKE RATE
(OUR) AND MICROBIAL ACTIVITY
To determine whether the oxygen uptake rate (OUR) is
a true reflection of the activity of a microbial
population, OUR was compared with analytical techniques
that are typically used to evaluate microbial activity. A
100 ml shake flask culture of Pseudomonas putida F1 (ATCC
70007) that had been grown for 48 hours at 28°C shaking at
190 rpm, then centrifuged and resuspended in 10 ml of
defined medium (DM) with no carbon source added, was used
to inoculate DM that contained 1.5 or 2.0 g 1-1 acetic acid
or 1.0 g 1-1 benzyl alcohol. After inoculation the culture
was sampled periodically for determination of microbial
activity by conventional analytical techniques such as
viable cell number, optical density (600 nm) and residual
substrate concentration. OUR was measured every 10
minutes. These conventional analyses were compared with
OUR measured using the method of the invention. The
experiment was repeated three times, twice with acetic
acid as the test substrate~and once with benzyl alcohol.
The correlated results of the three experiments are shown
in Figures 3, 4 and 5.
From the data shown in Figures 3, 4 and 5 there is a
clear linear correlation between OUR and both substrate
consumption and biomass concentration regardless of
CA 02545391 2006-05-10
WO 2005/047488 PCT/AU2004/001577
- 21 -
whether the substrate is acetic acid or benzyl alcohol.
The correlation between biomass and substrate utilisation
shows a clear exponential correlation. This is probably
because the yield value (YX,g; grams of biomass per gram of
substrate) is not a true constant and is actually
dependent on growth rate which is changing constantly
during growth in batch culture (Mandelstam et
al., Biochemistry of Bacterial Growth. 3rd Edition,
Blackwell Scientific Publications, Oxford, UK, 1982). The
method of the invention can therefore be used as a
superior alternative to monitor the status of enrichment
in real-time. This provides the operator with the
opportunity to rapidly refine the culture conditians or .
determine the effect on a culture of changing the many
parameters which can affect the enrichment of a microbial
population.
EXAMPLE 2: DEMONSTRATION OF REAL-TIME MONITORING OF A
POPULATION CHANGE
To test and demonstrate the operation of the method
of the invention, a control experiment was performed which
compared the output of 'the method with off-line '
measurements that are traditionally used to monitor
microbial activity. Techniques that are typically used
include measurement of the residual substrate
concentration and/or measurement of biomass concentration
(viable count and optical density). These methods were.
compared with the output of the present method to
demonstrate the utility of the method.
For these control experiments a steady state culture
of an Escherichia coli BL21DE3 which was supplied by
Novagen (Novagen Inc., Madison, WI, USA) and was expected
to grow on glucose only was used. The culture was
established using 5 ml of an E. coli culture taken from a
100 ml shake flask culture which had been grown for
17 hours shaking at 200 rpm and 30°C in defined medium
with 1.0 g 1-1 glucose as the carbon source. Although the
CA 02545391 2006-05-10
WO 2005/047488 PCT/AU2004/001577
- 22 -
feed contained another substrate (benzyl alcohol), no
growth on this substrate was expected because this
microbial population was known to be unable to use this
carbon source for growth. When steady state had been
established, 10 mL of a 100mL shake flask culture of
Pseudomonas putida F1 was added. The P. putida F1 culture
had been grown at 30°C for 17 hours, with shaking at 200
rpm, in defined medium with 1.0 g 1-1 glucose as the carbon
source. The P. putida F1 was supplied by the American Type
Culture Collection (ATCC) and was expected to grow on
benzyl alcohol'and/or glucose. The OUR was expected to
change as a result of the increased microbial activity
after the addition of P. putida.
2.1 Growth of E. coli aad P. putida oa and in the
presence of glucose and beazyl alcohol iri
defined medium in batch culture
The success of this control experiment was dependent
upon the ability of E. coli to grow on glucose in DM and
grow in DM in the presence of benzyl alcohol (i.e. benzyl
alcohol is not toxic to E. coli). Also of key importance
was the inability of E. coli to grow on benzyl alcohol.
Similarly, it was important to demonstrate growth of
P. putida on benzyl alcohol. Although P. putida is well
known for its ability to grow on a wide range of aromatic
substrates (Wackett, & Hershberger, 2001), growth on
benzyl alcohol has not been reported. The ability of each
of the two strains to grow under the conditions used in
the method is shown in Table 1. The optical density at
inoculation was calculated (based upon the optical density
on the inocula) as 0.021 (E. coli) and 0.026 (P. putida).
The cultures were incubated shaking at 200 rpm and 30°C.
The optical density was measured at 600 nm after
incubation for 23.5 and 75 hours.
Table 1: Growth of E. coli and P. putida on glucose and
benzyl alcohol in batch culture.
CA 02545391 2006-05-10
WO 2005/047488 PCT/AU2004/001577
- 23 -
Organism
(Optical density at 600 nm
Carbon source
after 23.5 and 75 hours
incubation)
Benzyl E. coli P. putida
Glucose
-1 alcohol 23.5 75 23.5 75
)
(0.1 g 1
(1.0 g 1-1)hours hours hours hours
Not added Not added 0.026 0.027 0.050 0.046
+ Not added 0.116 0.102 0.170 0.138
+ + 0.102 0.097 0.042 0.353
Not added ~+ 0.027 0.024 0.021 0.417
From the data shown in Table 1 it is clear that
E. coli can grow on glucose i~n DM and cannot grow on
benzyl alcohol in DM, but will grow in the presence of
1.0 g 1-1 benzyl alcohol. It is important that E. coli is
able to tolerate benzyl alcohol as this will be present in
the feed fluid for the entire experiment. It was
establised that P. putida was able to grow in DM
containing both glucose and benzyl alcohol.
2.2 Measurement of a characterised population shift
using the method of the invention
DM was inoculated with E. coli to give a starting
optical density (measured at 600 nm) of 0.06 and then
operated in batch mode for 19 hours during which time the
BOD increased to approximately 200 mg 1-1. The BOD then
declined rapidly indicating that the glucose in the medium
was exhausted. When the fresh medium was pumped into the
vessel the BOD increased again, peaking at just over
200 mg 1-~ before stabilising at 185 mg 1-1. Based on the
calculated BOD for a feed fluid containing 0.5 g 1-1
glucose the BOD was expected to be 178 mg 1-1 (see
calculation below).
CA 02545391 2006-05-10
WO 2005/047488 PCT/AU2004/001577
- 24 -
Balance the stoichiometry of the following equation:
C6H1206 + OZ ~ COz + H20
i.e.
C6H1206 + 602 ~ 6C02 + 6Hz0
Therefore:
Complete oxidation of 1 mol of C6H1z06 requires 6 mol of OZ
Convert from moles to grams:
180.2 grams of C6H1206 requires 32 x 6 grams OZ
180.2 g of C6H1206 requires 192 g of OZ
Concentration of glucose in the feed = 0.5 g 1-1,
therefore:
0.5 g of C6H1z06 requires 0.53 g of Oz
Therefore the Chemical Oxygen Demand (COD):
COD = 53 0 mg 1-1
The BOD is assumed to be one third of the COD:
3 0 BOD = 17 8 mg 1-1
The correction factor for conversion of COD to BOD
was determined experimentally using acetate as the carbon
source. The BOD of a known concentration of acetate was
determined experimentally and compared to the calculated
COD for the same concentration of acetate and the
difference was found to be three-fold. It is assumed that
CA 02545391 2006-05-10
WO 2005/047488 PCT/AU2004/001577
- 25 -
the same conversion factor can be used for a range of
readily biodegradable substrates.
The actual BOD was slightly higher than the
calculated BOD for the substrate due to background
respiration of the culture. Background respiration can be
attributed to maintenance energy production and is
therefore dependent upon the biomass concentration in the
reactor. As the substrate concentration was relatively low
the biomass concentration was also low and similarly the
background respiration was low. Background respiration can
be determined after the culture has reached steady state.
The feed fluid flow is reduced to 0 ml h-1 and a rapid
decrease in BOD is observed. Despite the absence of any
readily degradable carbon the BOD.is usually greater than
zero. After a period o,f stabilisation the BOD will~attain
a steady value which is an indication of the background
respiration.
Based on the BOD it was clear that steady state had
been attained (it is generally assumed that steady state
has been established after turnover of at least three
vessel volumes which, in this example would occur after
37.5 hours). After 125.7 hours (equivalent to 10 vessel
volumes) of continuous operation, P. putida was added to
the culture. Initially, there was no change in the BOD so
to ensure P. putida was not being washed out of the vessel
the feed flow rate was reduced from 60 ml h-1 to 30 ml h-1.
The BOD increased slowly indicating that degradation of
benzyl alcohol was beginning to occur. This observation
was confirmed by measuring the residual benzyl alcohol in
the culture supernatant, which had started to decrease. As
the P. putida population developed the BOD increased,
peaking initially at nearly 1400 mg 11 before declining to
1050 mg 1-1 after which a second peak in the BOD was
observed. The reason for the oscillation in the BOD is not
clear although before reaching steady state microbial
populations can demonstrate oscillations as the system
equilibrates. After the second BOD peak, the BOD
CA 02545391 2006-05-10
WO 2005/047488 PCT/AU2004/001577
- 26 -
stabilised at 1040 mg 1-1 which was the expected BOD for a
feed containing 0.5 g 1-1 glucose and 1.0 g 1-1 benzyl
alcohol (see calculation below).
Balance the stoichiometry of following equation:
C~H80 + OZ ~ COz + H20
i.e.
2C~H80 + 1702 ~ 14C02 + 8HzO
Therefore:
Complete oxidation of 2 mol of C~H80 requires 17 mol of Oz
Convert from moles to grams:
108.1 x 2 grams of C~H80 requires 32 x 17 grams OZ
216.2 g of C~H80 requires 544 g of Oz
Concentration of benzyl alcohol. in the feed = 1.0 g 1-1,
therefore:
1.0 g of C7H8O requires 2.52 g of Oa
Therefore the Chemical Oxygen Demand (COD):
3 0 COD = 2 516 mg 1-1
The BOD is assumed to be one third of the COD:
BOD = 839 mg 1-1
CA 02545391 2006-05-10
WO 2005/047488 PCT/AU2004/001577
As the feed contains both 0.5 g 1-1 glucose and 1.0 g 1-1
benzyl alcohol expected output when both substrate are
being used by the microbial population in the reactor:
BOD = 839 + 178 = 1017 mg 1~1
The feed consisting of DM containing 0.5 g 1-1 glucose
and 1.0 g 1-1 benzyl alcohol was fed into a vessel at 30°C
and pH 7. The feed flow rate was initially 60 ml h-1. As
shown in Figure ~6, after inoculation of the reactor with
E. coli (Arrow A), a population of microorganisms which
could only use glucose as a carbon source for growth was
established (Arrow B). P. putida, which can use benzyl
alcohol as a carbon source for growth, was then added to
the reactor (Arrow C) and the feed flow rate was reduced
to 30 ml hl (Arrow D). A resultant increase in BOD and
decrease in benzyl alcohol concentration were observed
(Arrow E). The residual benzyl alcohol concentration was
estimated using gas chromatography. At the same time that
the BOD stabilised the measured residual benzyl alcohol
concentration was zero. Interestingly, with a feed flow
rate of 30 ml h-1 steady state was expected to be attained
after 75 hours. However, based on the BOD, steady state
that was not achieved until 94 hours after the feed flow
rate was reduced from 60 ml h-1 to 30 ml h-1. From this
observation the microbial discovery process will be
improved by waiting at least four vessel volumes before
assuming a microbial population has reached steady state.
During the course of the experiment the biomass
concentration was also monitored as was the number of
benzyl alcohol-degrading microorganisms in the population
(Figure 7). Viable cell numbers were estimated by plating
samples of the culture (diluted in DM with no added carbon
source) on to solid DM containing either 1.0 g 1-1 glucose
or 1.0 g 1-1 benzyl alcohol. The optical density of the
culture was measured at 600 nm; samples were diluted in
water if the optical density was greater than 0.4. After
CA 02545391 2006-05-10
WO 2005/047488 PCT/AU2004/001577
_ 28 _
inoculation of the reactor with E. coli (Arrow A), a
population of microorganisms which could only use glucose
as a carbon source for growth was established. P. putida,
which can use benzyl alcohol as a carbon source for
growth, was then added to the reactor (Arrow B). A
resultant increase in optical density, the total number of
viable cells and the number of cells that could grow on
benzyl alcohol, was observed (Arrow C). The observed
increase in biomass concentration (Figure 7) correlated
with the increase in BOD shown in Figure 6. The E. coli
population growing on glucose and at steady state
contained 2.52 x 10⁹ cfu (colony forming units) ml'1 of
. culture, none of which could grow on benzyl alcohol. The
inability of the E. coli population to grow on benzyl
a:Lcohol was confirmed by plating undiluted culture onto
defined medium with benzyl alcohol as the only carbon
source. Immediately after addition of P. putida to the
culture the number of microorganisms growing on benzyl
alcohol increased to 4.47, x 106 cfu ml'1. In parallel with
the increase in the BOD, the number of microorganisms in
the population capable of degrading benzyl alcohol
increased. As expected, the total number of benzyl
alcohol-degrading microorganisms and the optical density
of the culture increased as the BOD increased and the
benzyl alcohol concentration decreased. When the
population approached steady state the number of benzyl
alcohol-degrading microorganisms had increased to greater
than 1012 cfu ml'1 (Figure 7), an observation clearly
reflected in the BOD. These data demonstrate the utility
of BOD for on-line real-time monitoring of the status of a
microbial discovery process. Unlike the BOD, both analysis
of residual benzyl alcohol concentration by gas
chromatography and off-line measurement of biomass
concentration take time and do not provide an instant
assessment of the activity of a microbial population.
Using an experimental procedure which enabled the
development of a microbial culture growing exclusively on
CA 02545391 2006-05-10
WO 2005/047488 PCT/AU2004/001577
- 29 - '
glucose and the introduction of a population change that
could be readily characterised, on-line BOD and off-line
data from conventional analytical techniques were
compared. Comparison of the BOD with off-line analyses
such as optical density, viable count and residual
substrate concentration clearly demonstrated that the
changes observed in the off-line data were also observed
in the BOD. The inverse relationship between BOD and
residual substrate concentration that was demonstrated in
batch culture was also observed in the continuous system.
These data demonstrate the utility of BOD for use in real-
~. time monitoring of the effect of changes to a microbial
population growing~in continuous culture.
ExAMPLE 3 USE OF BOD FOR MICROBIAL DISCOVERY
Discovery of 1-methyl-2-pyrrolidixion,e-utilising
microorganisms
Discovery of 1-methyl-2-pyrrolidinone-utilising
microorganisms was performed using the method of the
invention by imposing selective pressure (in this case the
ability to utilise 1-methyl-2-pyrrolidinone as a sole
source of organic carbon and energy) in unison with BOD.
The method was performed in the apparatus of Figures 1 and
2. A population of microorganisms with the required
characteristics was readily established.
Fresh activated sludge sourced from a wastewater
treatment facility was used as the source of
microorganisms for enrichment of 1-methyl-2-pyrrolidinone-
utilising microbes. As 1-methyl-2-pyrrolidinone is soluble
in water it was added to the feed fluid at the 1 g/1
concentration. The enrichment process was performed at
30°C and pH 7.0 (the pH was maintained at 7.0 by the
automatic addition of a potassium hydroxide or
hydrochloric acid solution as the alkali and acid,
respectively). The feed flow rate was 60 ml h-1.
CA 02545391 2006-05-10
WO 2005/047488 PCT/AU2004/001577
- 30 -
After the addition of the activated sludge to a
vessel the BOD was high (greater than 500 mg 1-1). The
activated sludge had a high initial BOD because it
contained residual readily biodegradable carbon which was
gradually degraded,~resulting in the observed gradual
decline in BOD before the addition of 1-methyl-
2-pyrrolidinone. After 2 ml of 1-methyl-2-pyrrolidinone
was added to the vessel (Arrow A; Figure 8) a rapid rise
in BOD was observed indicating exponential growth
(Figure 8). This data can be used to calculate ~.~.max
(maximum doubling time) for the population that is growing
on the substrate. Growth is exponential between 1220 and
1460 minutes and umax can therefore be calculated as
0.52 h-1, which corresponds to a doubling time of
1.34 hours. The rapid decline in BOD (Arrow B, Figure 8.)
was du.e to the oxygen consumption of the microbial
population being greater than the amount of oxygen
supplied to the culture.
After initial batch operation, the system was
operated, in continuous mode (Figure 9) and the feed fluid
was increased to a flow rate of 60 ml h-1. It should be
noted that when the feed was started the BOD appears to be
very low. This is not a true reflection of the status of
the culture; the BOD was in fact off-scale (too high) and
could not be measured accurately. After the feed pump was
started a second exponential rise in BOD was observed
which could be attributed to unbalanced growth. The
culture will take a period of time to adjust to the fluid
flow rate with the usual result being a build-up of the
limiting nutrient that is then rapidly depleted as all
nutrients are once again in excess: The rapid decrease in
BOD after the exponential rise signifies depletion of
excess 1-methyl-2-pyrrolidinone as the system approaches
equilibrium. The BOD then stabilised at approximately
800 mg 1-1, which is the expected value from a feed
containing 1.0 g 1-1 1-methyl-2-pyrrolidinone (see
calculation below):
CA 02545391 2006-05-10
WO 2005/047488 PCT/AU2004/001577
- 31 -
Balance the stoichiometry of the following equation:
CSH90N + Oz ~ COZ + H20 + NH3
i.e.
4CSH90N + 2702 ~ 20C02 + 12H20 + 4NH3
Therefore:
Complete oxidation of 4 mal of CSH9N0z requires 27 mol of OZ
Convert from moles to grams:
99.13 x 4 grams of CSH9N02 requires 32 x 27 grams OZ
396.5 g of CSH9N02 requires 864 g of Oz
Concentration of 1-methyl-2-pyrrolidinone in the feed =
1 g 1-l, therefore:
~ 1 g of CSH9N02 requires 2.18 g of OZ
Therefore the Chemical Oxygen Demand (COD):
COD = 218 0 mg 1-1
The BOD is assumed to be one third of the COD:
BOD = 726 mg 1-1
The calculated BOD for 1 g 1-1 1-methyl-
2-pyrrolidinone is less than the measured BOD output. Once
again, the difference is probably due to background
respiration. As expected, when the flow of the feed fluid
was reduced to 0 ml h-1 the BOD dropped rapidly and
CA 02545391 2006-05-10
WO 2005/047488 PCT/AU2004/001577
- 32 -
remained constant at approximately 80 to 120 mg 1-1. This
background respiration needs to be subtracted from the
measured BOD output to give a true indication of the BOD
and therefore the measured and calculated BOD are
approximately the same. The absolute BOD is not critical
for the success of the method of the invention. For
microbial discovery the relative value gives a better
reflection of the status of a discovery process. For
example, the large peak in BOD at the start of the
experiment (Figure 9) gives a clear indication of
microbial attack of the substrate. The calculated BOD can
be used as a guide to select substrate concentrations and
other operating parameters. For example by calculating the
BOD of a' particular substrate the operator can ensure that
the substrate concentration in the feed does not exceed
the measurable BOD output.
After 116 hours the feed flow rate was increased to
120 ml h-1 and shortly after the 1-methyl-2-pyrrolidinone
concentration in the feed was increased to 2 g 1~1(data not
shown). This was continued for a further 95 hours after
which a sample was taken for isolation of pure cultures of,
the microorganisms that were present in the culture. The
sample was heavily aggregated with large flocs present and
microscopic examination revealed a culture that was
dominated by a non-motile rod with a low number of motile
rods also being present. The sample was plated onto solid
defined medium with 1-methyl-2-pyrrolidinone as the sole
carbon source and the plates incubated at 30°C for ~40
hour's. From these plates three isolates, designated 2A, 2B
and 2C, were purified. Based on microscopic appearance and
colonial morphology 2A and 2C were assumed to be the same
organism and 2C was pursued no further.
The characteristics of the pure isolates are shown in
table 2:
CA 02545391 2006-05-10
WO 2005/047488 PCT/AU2004/001577
- 33 -
Table 2: Colony morphology and microscopic characteristics
of the 1-methyl-2-pyrrolidinone-degrading isolates
designated 2A and 2B.
Isolate 2A Isolate 2B
Colonial Microscopic Colonial Microscopic
morphology appearance morphology appearance
Slightly bent,
Slightly
Mucoid Rod shape possibly cocci
mucoid
in chains
Slight
Semi opaque Yellow/white Non motile
motility
Off white/grey
Short rods 1 mm diameter Cocco-bacilli
colour
2-4 mm
Gram negative Round colonies Gram positive
diameter
Apparent
~S 1 imy
fluorescence
Apparent
fluorescence
The ability of the pure isolates to grow on 1-methyl-
2-pyrrolidinone as the sole source of carbon in liquid
culture was also evaluated (Table 3). The cultures were
grown in 50 ml screw-capped plastic tubes that contained
10 ml of defined medium and l.0 g 1-1 1-methyl-
2-pyrrolidinone. To ensure each culture was inoculated
with a consistent number of cells, 10 ml of medium was
seeded with 100 ul of a single colony that had been
resuspended in 1 ml of DM. The cultures were incubated at
30°C shaking at 190 rpm. A single 10 ml culture was
harvested by centrifugation at each time point and the
supernatant kept for determination of the 1-methyl-
2-pyrrolidinone concentration. The 1-methyl-
2-pyrrolidinone concentrations were estimated using gas
chromatography
CA 02545391 2006-05-10
WO 2005/047488 PCT/AU2004/001577
- 34 -
Table 3: 1-methyl-2-pyrrolidinone degradation by isolates
2A and 2B.
Residual 1-methyl-2-pyrrolidinone
concentration (ing 11)
Time after
Uninoculated
inoculation ~ Isolate 2A Isolate 2B
Control
(h)
24 1000 NDa ND
48 960 ND ND
72 850 ND ND
96 870 ND ND
168 900 ND ND
a Not detected (limit of detection ~ 20 mg l~l).
The results show that from a large mixed population
(activated sludge) two isolates were obtained that were
able to use 1-methyl-2-pyrrolidinone as the sole source of
carbon. Both these isolates were able to completely
degrade 1.0 g 1-1 1-methyl-2-pyrrolidinone in batch culture
within 24 hours.
The BOD output demonstrates the usefulness of BOD as
a real-time monitor of the status of a culture. Any
changes to the operating conditions are reflected almost
immediately in the visual output. This enables the
operator to make changes and note the response of the
culture rapidly without the requirement for off-line
analyses which are time consuming and result in a delay
before the effect of a change can be assessed.
Additionally, growth on 1-methyl-2-pyrrolidinone was
demonstrated without the need for development of an assay
for the substrate. This has the added benefit in that
insoluble substrates (see Example 4) can be assessed which
CA 02545391 2006-05-10
WO 2005/047488 PCT/AU2004/001577
- 35 -
can be difficult to assay because a representative sample
cannot be taken and analysed easily.
EXAMPLE 4 DISCOVERY OF DODECANE-UTILISING
MICROORGANISMS
Discovery of dodecane-utilising microorganisms was
performed using the method of the invention. By imposing
selective pressure (in this case the ability to utilise
dodecane as a sole source of carbon and energy) in unison
with monitoring the BOD output, a microbial population
with the required characteristics was readily established.
As dodecane is practically insoluble in water it was fed
into the culture using a separate peristaltic pump at a
flow rate of 0.79 ml h-1. The purpose of this example was
to discover microbes that could potentially hydroxylate
linear hydrocarbons. This is extremely difficult to
achieve using convention chemical (non-microbial)
techniques.
Fresh activated sludge sourced from a wastewater
treatment facility was used as source of microorganisms
for discovery of dodecane-utilising microbes. The process
was conducted on the apparatus of Figures 1 and 2. The
discovery process was performed at 30°C and pH 7.0 (the pH
was maintained at 7.0 by the automatic addition of a
potassium hydroxide or hydrochloric acid solution). The
feed was comprised of DM that had no carbon source added
and the feed flow rate was initially 30 ml h-1 and the flow
of dodecane was 0.79 ml h-1. The experiment was conducted
over 137 hours then the apparatus components cleaned and
restarted (using the same culture) (Arrow B) with a feed
flow rate of 60 ml h-1 (the dodecane flow rate was
unchanged). After 330 hours of operation the fluid was
sampled to enable isolation of dodecane-degrading
microorganisms (Arrow C, Figure 10).
Although the BOD output was variable, clearly a
population of dodecane-degrading microorganisms had been
established. The population took somewhat longer to
CA 02545391 2006-05-10
WO 2005/047488 PCT/AU2004/001577
- 36 -
establish than was observed with the water soluble
substrate 1-methyl-2-pyrrolidinone. Two possible
explanations for this observation are (i) the variability
of substrate flow resulted in gradual washout of any
dodecane-degrading population that may have become
established and/or (ii) the insoluble nature of the
substrate reduces microbial attack resulting in slower
growth. A combination of gradual washout and an insoluble
substrate could result in reduced degradation of the
substrate because the enriched population may be producing
surfactants or similar molecules that assist in
solubilising the substrate. Gradual washout would
continually reduce the concentration of any surfactant-
type molecules further decreasing the accessibility of the
substrate resulting in a continual compounding negative
effect. In this experiment dodecane was fed into the
reactor using a peristaltic pump which resulted in the
variable BOD output. Syringe pumps or peristaltic pumps
can be used to feed insoluble substrates into the culture,
20, however a syringe pump is preferred because the product
contact components of a syringe pump are compatible with a
wide range of chemicals.
The BOD output is significantly less than the
calculated value based on the COD of dodecane (see
calculation below).
CA 02545391 2006-05-10
WO 2005/047488 PCT/AU2004/001577
- 37 -
Balance the stoichiometry of the following equation:
C12H26 + 02 ~ C02 + H2O
i.e.
2C12R26 + 3702 ~ 24C02 + 26H20
Therefore, complete oxidation of 2 mol Of C12H26 requires 37
mo 1 o f 02
Convert from moles to grams:
170.3 x 2 grams of C12H26 requires 32 x 37 grams 02
340.6 g of C12H26 requires 1184 g of 02
Assuming the concentration of dodecane in the feed
1 g 1-1, therefore
1 g of C12H26 . requires 3 . 48 g of 02
Therefore the Chemical Oxygen Demand (COD):
COD = 3480 mg 1-1
The BOD is assumed to be one third of the COD:
BOD = 115 8 mg 1-1
35
Actual flow rate of dodecane = 0.788 ml h-1 - 0.591 g h-1
Therefore the estimated dodecane concentration in feed =
0.591/60m1 = 9.85 g 1-1
Expected COD = 28861 mg 1-1 and BOD = 9620 mg 1-1
This result was unexpected although it could be
explained by the insolubility of the substrate. As
dodecane is less dense than water it will tend to float to
the surface of the culture, particularly during the
CA 02545391 2006-05-10
WO 2005/047488 PCT/AU2004/001577
- 38 -
measurement of oxygen uptake where aeration has stopped
and the stirrer has slowed. Much of the dodecane may be
washed out in the overflow. The measured BOD may also be
an indication of the amount of substrate that is
accessible to the microbial population and that is limited
by the solubility of dodecane in water.
After 207 hours of growth on dodecane a sample was
taken from the enriched culture for isolation of pure
cultures. Microscopic examination of the sample revealed a
range of rod-shaped bacteria both short and filamentous.
Cocci-shaped bacteria were also evident and a number of
motile rods were also observed. The sample was plated onto
solid DM with dodecane as the sole carbon source and the
plates were incubated at 30°C for ~48 hours. From these
plates four isolates, designated 1A, 1B, 1C and 1D, were
purified. Based on microscopic appearance and colonial
morphology 1A and 1D were assumed to be the same organism
and 1A was pursued no further.
The characteristics o:f the pure isolates are shown in
table 4:
CA 02545391 2006-05-10
WO 2005/047488 PCT/AU2004/001577
- 39 -
Table 4: Colony morphology and microscopic
characteristics of the dodecane-degrading isolates
designated 1B, 1C and 1D.
Isolate Isolate 1C Isolate
1B 1D
Colonial MicroscopicColonial MicroscopicColonial Microscopic
morphologyappearancemorphology appearancemorphologyappearance
Cocco- Fried egg Long and Small uneven
Shiny Long rods
bacilli appearance short colonies
rods
Crinkly
Round Non-motileTarget shapedMotile Non-motile
appearance
Off whiteGram 3-6 mm Gram Off white
Gram negative
colour negative diameter negative colour
Apparent
-1.5 mm Hazy/opaque
fluorescent
diameter appearance
halo
The ability of the pure isolates to grow on dodecane
as the sole source of carbon in liquid culture was also
evaluated and is shown in Table 5. The cultures were grown
in 50 ml screw-capped plastic tubes that contained 10 ml
of defined medium and 0.75 g 1-1 dodecane. To ensure each'
culture was inoculated with a consistent number of cells,
10 ml of medium was inoculated with 100 ~1 of a single
colony that had been resuspended in 1 ml of DM. The
cultures were incubated at 30°C shaking at 190 rpm.
Residual dodecane was extracted by the addition of 20 ml
of hexane to a single 10 ml culture at each time point.
The tube was shaken vigorously for one minute and after
phase separation, the upper layer was kept for
determination of the dodecane concentration. The dodecane
concentrations were estimated using gas chromatography.
CA 02545391 2006-05-10
WO 2005/047488 PCT/AU2004/001577
- 40 -
Table 5: Dodecane degradation by isolates 1B, 1C and 1D.
Residual dodecane concentration (mg 1-1)
Time after
Uninoculated Isolate Isolate Isolate
inoculation
Control 1B 1C 1D
(h)
24 820 920 630 1080
48 800 160 620 920
72 200 420 440 740
96 740 270 440 410
168 740 290 280 310
The results show that from a large mixed population
(activated sludge) three isolates were obtained that were
able to use dodecane as the sole source of carbon. In
batch culture the isolates were able to use (over a
168 hours period) 50 to 60% of the dodecane added to the
culture. The rate of dodecane utilisation is substantially
slower than 1-methyl-2-pyrrolidinone which may be due to
the difference in the solubility of the two compounds
(dodecane is practically insoluble in water). The
insolubility of dodecane may impose mass transfer
limitations which will slow growth and utilisation of the
substrate significantly. The variability in the gas
chromatography data from the batch experiments highlights
the difficulties associated with analysis of
concentrations of insoluble substrates. This problem can
be partly overcome by monitoring BOD, as oxygen
consumption can be used as an indirect indicator of growth
on the substrate.
CA 02545391 2006-05-10
WO 2005/047488 PCT/AU2004/001577
- 41 -
EXAMPLE 5 DISCOVERY OF OLIVE OIL-UTILISING
MICROORGANISMS
The use of olive oil as a feed fluid highlights
another of the advantages of the method of the invention,
which is microbial discovery in extreme environments.
Olive oil is a heterogeneous substrate of which
development of an analytical method for measuring
consumption would be difficult. Monitoring BOD enables
demonstration of growth on this complex substrate without
the requirement for the development of complex analytical'
methods. The isolation of microorganisms capable of using
substrates such as olive oil for growth may enable the
discovery of lipases with useful properties. The following
experiment was performed to facilitate not only the
isolation of olive oil-degrading microorganisms but also
to enrich microbes that can tolerate a very broad pH
range.
The vessel was filled with activated sludge and 10 ml
o.f olive oil was added. The BOD rose rapidly and peaked at
1700 mg 1-1. The rapid onset in the ability to degrade
olive oil in a population of microorganisms from activated
sludge is not unexpected as the presence of this type of
substrate in the influent streams of wastewater treatment
facilities is highly likely. After the peak in BOD was
observed (20.5 hours) olive oil was fed continuously into
the vessel as was a separate stream from DM mixed with
activated sludge in the ratio 4:1. The pH set point was
reduced to pH 4.0 and after 225 hours the feed medium was
changed from a mixture of DM and activated sludge to DM.
No. changes were made to the conditions for 138 hours
(equivalent to 11 vessel volumes) and the BOD of the
culture remained high. From these observations it was
concluded that a microbial population had been established
that could use olive oil as the sole source of carbon at
pH 4Ø
The olive oil flow rate was reduced to 0.061 ml h-1
and the feed was again changed to a mixture of activated
CA 02545391 2006-05-10
WO 2005/047488 PCT/AU2004/001577
- 42 -
sludge and DM. These conditions resulted in a culture with
activity (BOD in the range 1200 to 1500 mg 1-1) then after
458 hours the pH set point was changed to pH 2.2, the feed
was again changed to DM without any additions and the feed
flow rate was increased to 66 ml h-1. The conditions were
unchanged for 55 hours (4.4 vessel volumes) and the BOD
stabilised at 1700 mg 1-1 indicating that a population of
microorganisms had been established that was capable of
using olive oil as a sole source of carbon at~pH 2.2.
The next phase of the experiment evaluated the
ability of the microbial population that had been growing
at pH 2.2 to respond to an increase in the pH of the
culture. At 555 hours the pH set point was increased to
9Ø A further increase in the pH set point from pH 9.5 to
10 resulted in another decline in BOD indicating washout
and/or death of the microbial population. Interestingly,
when the pH was reduced by just 0.5 of a pH unit the
culture recovered with the BOD increasing exponentially.
The culture showed significant sensitivity to pH values
greater than 9.5. The reason for this observation is not
clear however two possible explanations for the increased
sensitivity to pH 10 could be (i) one of the medium
components was insoluble at pH 10 resulting in significant
nutrient limitation and a decline in BOD or (ii) the
microbial population present in the culture had not
adapted to growth at pH 10. The culture was maintained at
pH 9.5 for 125 hours and clearly a population of
microorganisms growing on olive oil as the sole carbon
source at pH 9.5 had been established. It cannot be
concluded that this population also has the potential to
grow at pH 2 because the time taken to establish this
population may have resulted in the development of a
totally new population that is better adapted to growth
under the new conditions.
Over a 37 day period growth of a microbial population
on olive oil at a range of pH values was demonstrated. The
two extremes of pH were 2.2 and 9.5. Clearly microbial
CA 02545391 2006-05-10
WO 2005/047488 PCT/AU2004/001577
- 43 -
activity could be demonstrated at these pH values and
these data were then used to develop an automatic pH
oscillation system; this system was designed to facilitate
the isolation of microorganisms with tolerance to a broad
pH range with the view to isolating enzymes from these
microorganisms which exhibit similar pH tolerance (both
activity and stability).
EXAMPLE 6 DEVELOPMENT OF A FEEDBACK LOOP BETWEEN FEED
FLOW RATE AND OUR
A feedback loop between feed flow rate and OUR was
developed to enable the maximum growth rate of a microbial
population to be established using an automated system.
The maximum growth rate of a population is an important
parameter as this is likely to give an indication of the
rate of flux through a metabolic pathway and therefore an
indication of the activity of enzymes in the pathway.
6.1 Design of feedback loop
The feedback loop uses the limiter that if the BOD
remains within a. set range for an operator set period then
the flow rate is increased by a value that is also
specified by the operator. This is described briefly above
in relation to the apparatus of the embodiment illustrated
in Figures 1 and 2. The software to run the feedback loop
was developed using a commercially-available software
package used to write control software.
6.2 Testing of the feedback loop between feed flow rata
and OUR
Isolation of 1,3-propanediol-degrading microorganisms
was used to test the feedback loop between feed flow rate
and OUR. The feed medium was a defined medium designated
4615 (Appendix I) which contained 1.0 g 1-1 1,3-propanediol
and the initial flow rate was 43.5 ml h-1. The operating
temperature was 30°C and pH 7Ø The medium was inoculated
with 700 ml of activated sludge. The feed flow rate was
increased by 20 ml h-lif the BOD remained constant for four
CA 02545391 2006-05-10
WO 2005/047488 PCT/AU2004/001577
- 44 -
vessel volumes. After an initial peak in the BOD, which
was due to 1,3-propanediol being in excess, the BOD
remained constant over a range of flow rates. The flow
rate was increased in steps from 43.5 ml h-1 to 143.5 ml h-1
over several days without any significant change in the
BOD, demonstrating that the microbial population which had
been established was capable of growing with doubling
times in the range 3.6 to 12 hours. At a doubling time of
3.6 hours the BOD was unchanged suggesting that the
population that had been established had the ability to
grow faster than the maximum that was tested in this
experiment. This observation was expected because the
inferred ~~.max of the population from the initial peak in
BOD at the start of the experiment was 0.25 h-1 (a
doubling time of 2.8 hours). Higher doubling times could
be achieved with any microbial population that is
established in the culture because there is a good
probability that mutants which can grow at a higher rate
will be selected at high feed flow rates.
The response of the culture to the changing flow
rates is shown in Figure 12.
EXAMPLE 7 USE OF METHOD IN ENZYME DISCOVERY
The aim of this example was to demonstrate that the
method can be used to discover specific enzymes and that
the kinetic behaviour of the enzymes could be selected and
controlled. The method was used to demonstrate (i) the
discovery of 1,3-propanediol dehydrogenase activity and
(ii) the specific activity of the discovered enzyme could
be altered in a controlled way during the course of the
discovery process. For this purpose, 1,3-propanediol was
used as the sole carbon source. It was assumed that in
prokaryotic systems, oxidoreductases are amongst the first
class of enzymes used to degrade a carbon source therefore
the likelihood of discovering a dehydrogenase specific for
1,3-propanediol was high. Furthermore, by utilising the
feedback loop as described in Example 6, it was
CA 02545391 2006-05-10
WO 2005/047488 PCT/AU2004/001577
- 45 -
anticipated that an increase in the feed flow (i.e.
dilution rate) would result in selection of microbes that
had high~l,3-propanediol dehydrogenase activity; increased
dehydrogenase activity enabling faster metabolism of the
1,3-propanediol. [i.e. Microorganisms with a higher enzyme
activity would be expected to proliferate at higher
dilution rates (high feed flows)]. If this assumption is
correct then it would be indicated, at a cursory level, by
an increase in the specific activity of 1,3-propanediol
dehydrogenase in microbial isolates recovered from the
method at high dilution rates.
The feed medium was the defined medium 4165 set out
in the second part of Appendix 1 which contained 1.0 g 1-l
1,3-propanediol. The operating temperature was 30°C and
pH 7Ø The reactor was inoculated with 700 ml of mixed
microbial population (activated sludge) suspended in
water. Dilution rates ranged from 0.058 h-1 to 0.387 h-1.
To determine the biomass concentration in the system,
samples were taken after each flow rate change and after a
minimum of three vessel volumes had passed through the
system. Optical density measured at 600 nm was used as a
measure of the biomass concentration. Samples were taken
after the culture had reached steady state and before the
flow rate increased. Optical density stabilised at
approximately 0.3 after each flow rate change but dropped
significantly at a flow rate of 163.5 ml h-1(Figure 12).
The decrease in biomass concentration correlated with a
decrease in the diversity of the microbial population in
the vessel. Further increases in the flow rate did not
result in washout of the culture, in fact the optical
density of the culture recovered and continued to be
maintained at ~0.3 up to a flow rate of 290 ml h-1.
CA 02545391 2006-05-10
WO 2005/047488 PCT/AU2004/001577
- 46 -
The samples taken at each dilution rate were plated
onto 4165 medium with 1,3-propanediol added and colonies
with different morphology were established as pure
cultures. A total of 66 isolates were obtained.
Identification of one of the selected isolates using was
undertaken using 16S ribosomal RNA sequencing. Isolate
number 7#1 showed 98% homology with the 16S ribosomal RNA
sequence of Gordonia desulfuricans. Although the
production of 1,3-propanediol has been shown in several
other bacterial genera including Klebsiella, Enterobacter,
Citrobacter, Lactobacillus and Clostridium (Huang 2002,
Nakamura 2003), to our knowledge Gordonia species have
never before been reported to be associated with
1,3-propanediol metabolism again highlighting the utility
of the method for the isolation of unique microorganisms,
or the discovery of new activities for microorganisms.
Seven isolates obtained at a range of flow rates were
chosen for further study. The activity of 1,3-propanediol
dehydrogenase was measured in cell-free extracts obtained
from each of the isolates after growth in batch culture
with 1,3-propanediol as the carbon source (Table 6).
zsolate nuzi~ber ;.' Flaw rate ~v1 hT~')'p~~~'~zc aet~.vi.ty
(,LT mg p~o~ea.n-~)
1#3 43.5 0.078
1#4 43.5 0.164
9#5 163.5 0.696
16#1 172.5 0.543
16#4 172.5 0.935
24#1 290 0.701
24#2 290 1.347
Table 6 above sets out the specific activity of
1,3-propanediol dehydrogenase in the selected isolates.
CA 02545391 2006-05-10
WO 2005/047488 PCT/AU2004/001577
- 47 -
Enzyme activity was detected in cell-free extracts. Cell-
free extracts were obtained after harvesting shake flask
cultures during early stationary growth phase by
centrifugation at 12227xg, 4°C for 15 minutes. Cell
pellets were washed in 50 mM HEPES-buffer containing
100 ~.~.M MnCl2. The cell pellets were then resuspended in a
volume of 50 mM Tris-HCl pH 8.0 that contained 1 mM ETDA,
0.1% Triton X-100, 1 mM PMSF, 2 mM MgCl2, 0.5 mg m11
lysozyme,. 5 ~Zg ml-1 DNAse equivalent to the pellet weight.
The cells were lysed by adding 1 gram of glass beads per
ml of suspended cells and vortexing for 1 minute. The
lysate was separated from the glass beads and cell debris
by centrifugation at 12000aeg, 4°C for 5 minutes. Enzyme
activity was determined in quartz cuvettes by measuring
the formation of NADH at 340 nm over a period of one
minute. The reaction mixture consisted of 0.05 M Na2CO3
(pH 9.5), 2 mM NAD+, 0.1 M 1,3-propanediol and 50 ~.l cell
free extract in a final volume of 1 ml.~All enzyme assays
were performed in triplicate and averaged. One unit of
enzyme activity is equivalent to the formation of one
micromole of product per minute. The protein concentration
in the cell-free extracts was measured by the method of
Bradford (Bradford, 1976) with BSA as the standard.
Protein analyses were performed in triplicate.
By increasing the dilution rate we demonstrated a
correlation between the substrate flow and the specific
activity of 1,3-propanediol dehydrogenase. This is shown
in Figure 13. The enzyme activity test showed that
microorganisms isolated at a high dilution rate had an
increased specific enzyme activity.
This example therefore demonstrates that the method
can be used to specifically discover a chosen enzyme
activity. The example also demonstrates that the specific
activity of the chosen enzyme can be controlled using
dilution rate and the feedback loop and that microbes with
previously undescribed phenotypes may be isolated.
CA 02545391 2006-05-10
WO 2005/047488 PCT/AU2004/001577
- 48 -
EXAMPLE 8 USE OF THE METHOD FOR DISCOVERY OF
EXTREMOPHILES
8.1 Use of the method for discovery of psychrophiles
The aim of this experiment was to demonstrate that
psychrophilic microorganisms could be isolated from a
readily available source of microorganisms using the
method. According to Stanier et al. (1987), psychrophilic
microorganisms are defined as able to grow well at 0°C.
However it should be noted 'that classification based on
temperature is somewhat arbitrary because it does not take
into account the temperature range over which growth is
possible for a particular isolate. For example Xanthomonas
pharmicola can grow at temperatures ranging from 0 to 40°C
and is classified as a psychrophile. For this experiment
4°C was chosen as the growth temperature to avoid freezing
of the growth medium that was expected to occur at lower
temperatures. The discovery process could be performed at
lower temperatures although operation at temperatures less
than 4'°C would require the addition of extra solutes to
the medium to prevent freezing.
Discovery of psychrophiles was performed using the
method of the invention, on the apparatus described above.
By imposing selective pressure (in this case the ability
to utilise acetate as a sole source of carbon at 4°C) a
population of microorganisms with the required
characteristics was readily established.
A mixed microbial population suspended in water was
used as source of microorganisms for discovery of
psychrophilic microorganisms. The discovery process was
performed at 4°C and pH 7.0 (the pH was maintained at 7.0
by the automatic.addition of ammonium hydroxide or
phosphoric acid solutions). To prevent growth in the feed
line the test substrate (carbon source) was added to the
vessel separately from the nutrients. The nutrient feed
was the defined medium 4165 of Appendix 1. The nutrient
feed flow rate was 20 ml h-1 and the substrate (16.6 g 1-1
sodium acetate trihydrate) flow was 6 ml h-1 - total 26 ml
CA 02545391 2006-05-10
WO 2005/047488 PCT/AU2004/001577
- 49 -
h-1. These parameters resulted in a doubling time of
18.4 h (corresponding to a dilution rate of 0.038h-1) and a
calculated feed acetate concentration of 2.3 g 1-1.
After the addition of the microbial population to the
vessel the BOD was high (greater than 600 mg 1-z). The
gradual decline in BOD was probably due to consumption of
any residual readily biodegradable carbon in the activated
sludge.
Figure 14 is a graph of output (in terms of BOD) over
time during growth of microorganisms from activated sludge
on acetate at 4°C.
The output did not increase markedly for the first
100 hours (~4 days) of operation after which a gradual
increase in BOD was observed. The BOD peaked after
220 hours (~9 days) of operation and stabilised after
300 hours. The time 'taken for a significant increase in
activity of the culture to be observed was far greater
than typical operation at 30°C. This highlights the
severity of the imposed conditions (low temperature) .in
the method and the impact of extreme conditions on
cellular processes. These observations also highlight the
value of the method in providing a real time assessment of
the status of a culture, a feature that is important when
attempting to find microorganisms that perform a desired
function under extreme environmental conditions or
transform a particularly recalcitrant compound. The
optical density of the culture was periodically measured
at 600 nm between 234 hours and 402 hours and averaged at
1.36. The fact the\~optical~density was maintained at ~1.3
over a period of 168 hours demonstrates that there was a
population of psychrophilic microorganisms in the vessel
that were able to survive and reproduce at a temperature
of 4°C. A constant biomass concentration in the vessel is
consistent with the output of the method (which was also
constant over the same time period) again demonstrating
that the output can be used as a real time indirect
measure of the status of a microbial population.
CA 02545391 2006-05-10
WO 2005/047488 PCT/AU2004/001577
- 50 -
Microscopic examination of the culture showed chains
of large rod-shaped bacteria (or small yeast) and small
motile bacteria; the presence of fugal hyphae was also
noted.
After 266 hours the flow rate of the substrate pump
was increased thereby changing the acetate concentration
in the feed from 2.3 g 1-1 to 3.1 g 1-1. The increase in
acetate concentration was expected to result in an
increase in BOD and optical density however no increase in'
either parameter was observed. Similarly, a feed
containing 2.3 g 11 acetate was expected to attain a BOD
of 720 mg 1-1 but the output stabilised at 400 to
450 mg 1-1. From these observations it can be inferred that.
either the temperature was limiting growth rather than the
carbon source, use of carbon or another nutrient is less
efficient at low temperatures, or growth at low
temperatures requires excess levels of one or more
nutrients other than the carbon source.
By operating the method at 4°C a psychrophilic
20~ microbial population growing on acetate as the carbon
source at 4°C was established. Although the discovery
process was slower at 4°C than is typically observed at f
30°C (an observation that was not unexpected as many
cellular processes are likely to slow at lower
temperatures), a psychrophilic population was nevertheless
established. This example therefore demonstrates that the
method is very versatile, and can even can be used to
isolate microorganisms that grow at low temperatures.
8.2 Use of the method for discovery of thermophiles
The aim of this experiment was to demonstrate that
thermophilic microorganisms could be isolated from a
readily available source of microorganisms using the
method of the invention. Thermophilic microorganisms are
defined as organisms that live at elevated temperatures
(Brock and Madigan, 1988). This definition is subjective
and can be clarified somewhat with an example of a
CA 02545391 2006-05-10
WO 2005/047488 PCT/AU2004/001577
- 51 -
microorganism that fits the definition. An example of a
thermophilic microorganism is Thermus which has an optimum
growth temperature of ~60°C and can grow at temperatures
ranging from 42°C to 69°C. Extreme thermophiles have also
been defined with members of this group being recognised
as having very high temperature optima. For example,
Thermococcus has an optimum temperature for growth of
~g7oC (Brock and Madigan, 1988).
Discovery of thermophiles was performed using the
apparatus and techniques described above. By imposing
selective pressure (in this case the ability to utilise
acetate as a sole source of carbon at 80°C) it was
anticipated that a population of thermophilic
microorganisms would be established. The measurement of
dissolved oxygen concentration at high temperatures can be
problematic because the baseline output of a number of
dissolved oxygen electrodes is very high at high
temperatures. This problem is further compounded by the
effect of temperature on the solubility of oxygen. As the
temperature of water increases the solubility of oxygen in
the water decreases and therefore reliable measurement of
dissolved oxygen concentrations at high temperatures is
essential. To enable discovery of thermophiles, the
apparatus described at the outset of the Examples was
modified to enable the installation of a dissolved oxygen
electrode that could operate at high temperatures (up to
80°C). The vessel was also modified to improve its thermal
tolerance and the heat input was enhanced with the use of
an improved heating system.
A mixed microbial population suspended in water was
used as source of microorganisms for discovery of
thermophilic microorganisms. The discovery process was
performed at 80°C. To prevent growth in the feed line the
test substrate-a carbon source (acetate)- was added to the
vessel separately from the nutrients. The nutrient feed
was the defined medium 4615 described in Appendix 1. The
nutrient feed flow rate was 52 ml h-1 and the substrate
CA 02545391 2006-05-10
WO 2005/047488 PCT/AU2004/001577
- 52 -
(16.6 g l-1 sodium acetate trihydrate) flow was 1.9 ml h-1.
These parameters resulted in a doubling time of 9 h and a
calculated feed acetate concentration of 0.26 g 11.
After 16 days no significant microbial activity was
detected in the vessel (as measured by oxygen
consumption). At 80°C the measured dissolved oxygen
concentration at saturation was ~3 mg 11 (c.f. at 30°C the
dissolved oxygen concentration at saturation is ~7 mg 1-1).
To demonstrate that the method and apparatus was capable
of detecting changes in dissolved oxygen concentration at
80°C and the dissolved oxygen electrode was operating
correctly, the vessel was sparged with nitrogen at the end
of an aeration cycle. During nitrogen sparging the output
of the dissolved oxygen probe decreased to less than
1 g 1-1 indicating that changes in dissolved oxygen could
be measured at 80°C. It should be noted that a very small
change in dissolved oxygen concentration was observed
during this experiment. This change was 0.002 mg OZ per
minute. Although this change in dissolved oxygen was
probably beyond the sensitivity of the apparatus
components, the culture was examined microscopically after ,
16 days of operation. The micrograph of the sample is set '"
out in Figure 15.
The examined sample was 1.2 ml in volume, and was
centrifuged for 2 minutes and resuspended in ~25 ~.l of
medium. The concentrated sample was examined as a wet
mount by phase contrast microscopy at a magnification of
1000x.
The micrograph clearly shows the presence of small
rod-shaped bacterial cells - see Figure 15. The cell
numbers were very low (given the sample for the micrograph
was concentrated ~50-fold) which correlated with the very
low output of this trial. Although not apparent in the
micrograph, some of the rod-shaped cells were motile
giving a clear indication that some of the cells were
viable. These observations provide evidence to suggest
CA 02545391 2006-05-10
WO 2005/047488 PCT/AU2004/001577
- 53 -
that extreme thermophiles may be recovered using the
method of the invention.
Although limited, there is some evidence that
suggests that discovery of thermophilic microorganisms may
have been facilitated by the method of the invention.
Possible reasons for the low activity of the thermophilic
microorganisms include (i) acetate is not a preferred
substrate of the thermophiles present in the initial
population, (ii) the dilution rate was too high for the
thermophiles (iii) the number of microbes capable of
growth at 80°C in the sample used to seed the apparatus
(the microbial population) was very low and (iv) the types
of microbes present in the sample may not be capable of
significant growth at 80°C [typically extremely
thermophilic microorganisms are found in hot springs,
geysers and deep sea thermal vents (Brock and
Madigan, 1988)]. It should be noted that the issues
stated above are not a limitation of the method of the
invention and in all likeliness could be readily resolved
by changing the operating parameters of the method and/or
the heterogeneous population of microorganisms used in the
method. This example demonstrates that the method can be
used to discover microorganisms that grow at high
temperatures.
EXAMPLE 9 DISCOVERY OF ANAEROBIC MICROORGANISMS
The apparatus described above which contains an
oxygen probe, suitable for the measurement of oxygen
uptake rate, was limited to the discovery of aerobic
(oxygen dependent) microorganisms. The aim of this part
of the work was to demonstrate that the method can be used
to facilitate the discovery of anaerobic bacteria. The
apparatus was therefore modified to enable the isolation
of anaerobes with the use of a probe that can detect a
molecule used for anaerobic respiration. The ability to
use the method for isolation of anaerobic bacteria is
valuable because access to other groups of bacteria with
CA 02545391 2006-05-10
WO 2005/047488 PCT/AU2004/001577
- 54 -
potentially different metabolic,pathways increases the
microbial and enzyme diversity that can be accessed when
using the method of the invention.
There are a range of electron acceptors that can be
used by anaerobic microorganisms. These include those set
out in Table 7:
Table 7: Anaerobic respiration processes (Brook and
Madigan, 1988).
=~yp~ of Elect~o~.
Respiration , Produc:~
microorganisms acceptor
facultative and
Sulphur obligate anaerobic S HS-
bacteria
Sulphate obligate anaerobes SO4z- HS-
acetogenic bacteria;
Carbonate COz CH3C00-
obligate anaerobes
methanogenic
Carbonate bacteria; obligate COz CH4
anaerobes
Fumarate succinogenic bacteria Fumarate Succinate
facultative anaerobic
NOz-, N20,
Nitrate bacteria NO3-
Nz
(denitrification)
facultative and
Iron obligate anaerobic Fe3+ Fez+
bacteria
The apparatus described above was modified to enable
the installation of a nitrate ion selective electrode.
Nitrate was chosen as the terminal electron acceptor in
place of oxygen to demonstrate the discovery of anaerobic
bacteria. Denitrification, a process whereby in the
absence o~f oxygen nitrate in used as a terminal electron
acceptor and converted into more reduced forms of
nitrogen, is quite common (Brook and Madigan, 1988)
CA 02545391 2006-05-10
WO 2005/047488 PCT/AU2004/001577
- 55 -
therefore the presence of microorganisms in the mixed
population capable of anaerobic nitrate respiration was
considered highly likely. Nitrate was measured
continuously using a laboratory bench meter with an
analogue output; the data was logged using a computer and
simple software developed for this purpose, based on
standard data collection techniques.
Nitrate was added to the nutrient feed (the defined
medium of Appendix 1) as KN03 at a concentration of 1 g 11.
Acetate was used as the test substrate (a carbon source):
Acetate was chosen over a fermentable substrate to prevent
the growth of fermentative anaerobic microorganisms and
the apparatus. was sparged with nitrogen to ensure
anaerobic conditions were maintained. The acetate was
used in an amount of 1.2 g 1-1 and the fluid feed rate was
30 ml h-1. The vessel was filled with nutrient medium to
establish the response of the nitrate probe to the nitrate
that had been added to the nutrient feed.
The initial pH was set to pH 7, and the temperature
to 30°C. The response of the nitrate probe was fairly
stable, increasing gradually from 285 to 320 ml 1-1 over
4.5 hours. The vessel was then drained to the sample port
(a loss of approximately one third of the vessel volume)
and refilled with a mixed microbial population (activated
sludge) suspended in water. This resulted in partial
dilution of the nitrate in the vessel and corresponded to
a reduction in the output of the nitrate probe. The
apparatus was left in this configuration for 1.3 hours to
establish the initial nitrate level. The relative nitrate
level after addition of the sludge was stable at
227 mg 11. The test substrate (acetate) and nutrient
pumps were then started at a fluid flow rate of 30 ml h-1.
Over the next 17 hours the relative nitrate level
decreased to ~1 mg 1-1. This is illustrated in Figure 16.
Although optical density could not be used to
estimate the biomass concentration due to interference
from the initial microbial sample added to the vessel,
CA 02545391 2006-05-10
WO 2005/047488 PCT/AU2004/001577
- 56 -
there are two indicators of microbial activity apparent in
the output. The first is the decrease in the nitrate level
which is a clear indicator of nitrate consumption and
therefore microbial activity. The second indicator is pH.
After approximately 17 hours the frequency of the pH
oscillations increased. The pH changes are an indicator of
substrate consumption (as acetate is consumed the pH
increases which is then adjusted by the pH controller to
return to pH 7) and the increased requirement for pH
control correlated with the maximum rate of nitrate
consumption which is indicative of~microbial growth. pH
control is also shown in Figure 16.
The parameters were not changed for the next 86 hours
1 during which the output of the nitrate probe remained
relatively stable with values between 20 and 40 mg 1-1
being recorded. The full operation pH and nitrate.
concentration results are shown in Figure 17.
To determine whether nitrate or acetate was the
limiting nutrient, the test substrate (acetate) feed pump
was stopped. If acetate was the limiting nutrient then the
nitrate concentration would be expected to rise, the
absence of substrate would reduce the energy and therefore-,
nitrate requirements of the cells. Alternatively, if
nitrate is the limiting nutrient the nitrate levels would
remain low because the excess acetate would continue to be
consumed. After the acetate pump was switched off, no
increase in nitrate was observed which suggested that
nitrate was the limiting nutrient.
To ensure the nitrate probe was, working correctly
(not fouled by a biofilm), after 122 hours the vessel was
spiked with 5 ml of 218 g 1-1 KN03. A rapid increase in the
output of the nitrate probe was observed indicating the
probe was still responding to changes in nitrate
concentration. The acetate feed was restarted and the
nitrate level again decreased to 20 mg 1-1 (See spike in
Figure 17).
CA 02545391 2006-05-10
WO 2005/047488 PCT/AU2004/001577
- 57 -
To further demonstrate that the nitrate consumption
was due to the presence of an active microbial population
in the vessel the culture was examined microscopically.
Figure 18 is a micrograph of the sample. The sample was
examined as a wet mount by phase contrast microscopy at a
magnification of 1000x. The microbial cells appear as
small dark short rods.
The number of cell types present was estimated at
being less than ten (not all cell types are apparent in
the micrograph) with the dominant types being non-motile
rods, motile rods, motile spirals, and filamentous
bacteria. This observation showed that a viable population
was established by the method under anaerobic conditions
and as is observed during aerobic operation, the mixed
microbial population that was initially added to the
vessel had been sorted into a-small or reduced number of
microorganisms with the desired properties.
The method was successfully operated under anaerobic
conditions and microbial activity was detected by
measuring the consumption of nitrate using an ion
selective~electrode. Although nitrate was the only
terminal electron acceptor measured in this example, the
system can be easily modified for detection of the other
terminal electron acceptors listed in Table 7. The only
limitation is the availability of a suitable ion selective
electrode. In this example the molecule used for
respiration was measured. Electrodes that detect the
products) of anaerobic respiration could also be used to
monitor the microbial discovery process in the method.
This example demonstrates that the method can be used to
discover anaerobic microorganisms.
Modifications may be made to the preferred
embodiments and Examples described above without departing
from the spirit and scope of the invention.
CA 02545391 2006-05-10
WO 2005/047488 PCT/AU2004/001577
- 58 -
REFERENCES
Bradford, M. (1976). A rapid sensitive method.for the
quantitation of microgram quantities of protein utilising
the principle of protein-dye binding. Analytical
Biochemistry 72, 248-254.
Brock, T.D. and Madigan, M.T. (1988). Biology of
Microorganisms 5th Edition, Prentice-Hall, New Jersey,
USA.
Huang, H., Gong, C.S. and Tsao, G.T. (2002). Production of
1,3-propanediol by Klebsiella pneumoniae; Applied
Microbiology Biotechnology 98-100, 687-698.
Nakamura, C.E. and Whited, G.M. (2003). Metabolic
engineering for the microbial production of 1,3-
propanediol. Current Opinions in Biotechnology 14,
454-459.
Stanier, R.Y., Ingraham, J.L., Wheelis, M, M.L. and
Painter, P.R. (1987). General Microbiology 5th Edition,
Macmillan Education, London, United Kingdom.
CA 02545391 2006-05-10
WO 2005/047488 PCT/AU2004/001577
- 59 -
APPENDIX I
Media
Composition of Defined Medium (DM)
1_1
g
NH4C1 1. 0
KHZ P04 0 . 5 '
10 o Na2S04 2 . 0 ml 1 1
*MgCl2 . 6H20 0 . 17
*CaC12.2Hz0 0.01
**Trace Metals solution 1.0 ml 1-1
25
All media were made up in reverse osmosis water and
adjusted to pH 7.0 with 4M NaOH
All chemicals were of analytical grade.
Where required, media were sterilised by autoclaving at
121°C .for 20 minutes. Large volumes (up to 20 litres) of
feed were autoclaved at 121°C for at least 60 minutes.
* Magnesium and calcium were added as a concentrated
sterile stock solution ( 17 . 0 g 1-1 MgCl2 . 6Hz0; 1. 0 g 1-1
CaClz.2Hz0) after autoclaving to prevent precipitation with
orthophosphate.
Carbon sources were added after the media were autoclaved.
Solid media were prepared by the addition of 15 g 1-1 agar.
CA 02545391 2006-05-10
WO 2005/047488 PCT/AU2004/001577
- 60 -
** The Trace Metals solution contained:
1-1
g
FeS04. 7H20 1 . 0
CoS04.7Hz0 0.2
MnS04 . Hz0 0 .1
NiC12.6Hz0 0.1
NaMo04 . 2H20 0 . 0 5
H3BO3 0 . 0 6 2
ZnCl2 0 . 07
CuS04 . 5H20 0 . 02
Composition of Defined Medium (4615) which is a
modification of .a minimal medium described by Nagel and
Andreesen as cited by DSMZ (German culture co7_lection -
www.dsmz.de/media).
2 5 ml 1-1
*Salts solution 10
**Trace Elements Stock 0.7
***Phosphates 20
* The Salts solution contained:
g 1 ~
CaCl2 . 2HzO 1 . 0
MgS04 . 7 HZO 5 0 . 0
MnS09 1 . 0
NH4C1 3 0 . 0
NaCl 5.0
CA 02545391 2006-05-10
WO 2005/047488 PCT/AU2004/001577
- 61 -
** The chemicals in the Trace Elements Stock were
dissolved 5M HCl. The Trace Elements Stock contained:
(Note: FeS04.7H20 was dissolved in the 5M HCl before the
addition of the other components.)
g 1-1 (of 5M HCl)
FeS04 . 7H20 6 . 5 6
ZnC 12 0 . 1 4
MnS04 . H20 0 . 12
H3B03 0 . 01
CoS04. 7H20 0 . 45
2 0 CuS04 . 5Hz0 0 . 004
NiClz . 6H20 0 . 048
NaMoOq . 2 H20 0 . 0 7 2
*** The Phosphates solution contained:
1-1
g
Na2HP04 7 2 . 5
KHzPOg 12 . 5
All media were made up in reverse osmosis water and all
chemicals were of analytical grade.
Media were prepared by the mixing the Salts solution and
the Trace Elements Stock prior to autoclaving.
Where required, media were sterilised by autoclaving at
121°C for 20 minutes. Large volumes (up to 20 litres) of
feed were autoclaved at 121°C for at least 60 minutes.
The Phosphates solution was added after autoclaving to
prevent precipitation of orthophosphates with the metals
in the medium.
CA 02545391 2006-05-10
WO 2005/047488 PCT/AU2004/001577
- 62 -
Carbon sources were added after the media were autoclaved.
Solid media were prepared by the addition of 15 g 1-1 agar.