Note: Descriptions are shown in the official language in which they were submitted.
CA 02559684 2013-06-07
78496-16
USER-CENTRIC EVENT REPORTING
CROSS-REFERENCE TO RELATED CASES
[00011
FIELD OF THE INVENTION
[0002] The present invention relates generally to hazard and event warning
systems. More
particularly, the invention provides a method and apparatus for receiving
event and/or hazard
information by a portable electronic device and using that information to warn
a device operator
of a future event or hazard with respect to the specific device's location,
and also provide the
device operator with the ability to report event or hazard information to a
server for further
distribution.
BACKGROUND OF THE INVENi ____ ION
[0003] Vehicle operators, such as automobile drivers, frequently tune to radio
stations while
traveling in order to obtain weather forecast information. Such forecasts
generally cover a large
geographic area, such as an entire county or a multi-county region, and can
provide some
indication to the vehicle operator of likely weather trouble, such as a flash
flood or tornado.
Because they cover such large areas, however, generalized weather forecasts
may cause wasteful
evasive action by drivers not realistically at risk. For example, if the
National Weather Service
issues a flash flood warning for an entire county, all drivers in the county
may need to heed the
warning, even if the flood areas make up only a small part of the county.
[0004] Similarly, if a sudden snowstorm approaches from the west, a large
number of drivers
may take evasive action based on a general weather forecast for cities in the
path of the
approaching storm. Depending on where the drivers are relative to the weather
hazard, some
- 1 -
CA 02559684 2006-09-14
drivers may feel the effects of the storm shortly after the warning, while
others may not be in the
path of the storm for 10, 20, or even 30 minutes. Providing drivers with more
accurate and
vehicle-specific weather forecasts could result in substantial time and energy
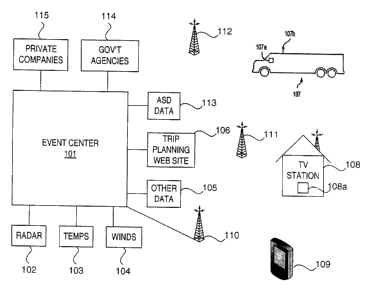
savings. For
example, if a driver is heading West and is projected to arrive at his
destination within 20
minutes, it would be helpful to know that the storm will not arrive at the
intended destination for
another 30 minutes. Such a system would be particularly useful for fleets of
commercial trucks
or buses, for example, particularly since such vehicles may be more
susceptible to causing injury
or property damage during severe weather events (e.g., snow, ice storms, and
the like).
[0005] Various position-sensitive automated vehicle systems have been
proposed. For example,
U.S. Patent No. 5,991,687 ("System and Method for Communicating Information
Related to a
Geographic Area") describes a system for displaying the location of a vehicle
to the vehicle
operator, along with other information such as a weather map. However, the
system cannot
provide the sort of information that would permit a vehicle operator to
determine whether he or
she was likely to encounter a weather hazard and for how long such a hazard
might last.
100061 Another system, disclosed in U.S. Patent No. 6,009,374 ("Apparatus for
and Method of
Controlling Vehicular Systems While Traveling"), assists a vehicle operator by
automatically
controlling the vehicle in response to various detected conditions and an
intended travel position.
One variation of the system extracts current weather information and uses the
information to
sound an alarm. The system, however, does not provide predicted weather
information to the
vehicle operator; it does not provide hazard duration information; and it does
not provide
weather information tailored to the particular vehicle. Consequently, the
system does not solve
the aforementioned problems.
[0007] Yet another system, described in U.S. Patent No. 6,018,699 ("Systems
and Methods for
Distributing Real-Time Site Specific Weather Information"), reports weather
forecasts through
the use of storm profiles that are transmitted to remote units at dispersed
geographic sites. The
remote units are stationary, and storm profiles are transmitted to remote
units based on their
geographic location. The system has no application for use with moving
vehicles, as it cannot
receive information concerning the mobile location of such vehicles.
- 2 -
CA 02559684 2006-09-14
[0008] In addition to the above, because we live in an increasingly mobile
society, individuals
are more likely to get lost or disoriented in unfamiliar territory and have
their safety threatened
by severe weather conditions. Specifically, weather is a factor in a high
percentage of
transportation accidents, including commercial aviation (26.8%), general
aviation (20%), boating
(11.2% of accidents; 14.8% of accidents involving fatalities), automobiles
(16.3%), and
recreational vehicles (10%). While some of these accidents were due to
operator error, others
are due to the driver, pilot or operator of the vehicle traveling into an area
of hazardous weather
beyond his or her skill level or the capability of his or her vehicle to
handle the inclement
weather. Current terrestrial navigation and weather systems suffer from
several deficiencies: 1)
receipt of a warning depends on a user being tuned to a radio station in the
affected area that
actually broadcasts storm warnings (in addition, many radio stations no longer
broadcast
warnings outside of the immediate area in which they are located); 2)
warnings, e.g., NWR tone
alerts, are only broadcast once¨if the user misses the warning, the user will
not be notified of
the impending inclement conditions; and 3) if the user is not tuned to the
correct radio station at
the time of the warning, the user will miss the warning.
[00091 Assuming that the user actually hears the warning, the National Weather
Service issues
storm warnings by county. Thus, in order for the warning to be meaningful to
the user, he or she
would necessarily need to be familiar with the county layout of the area.
However, when
traveling, few people know which county they are currently in or which county
they are
approaching, other than when in or around their own home county. In addition,
when the
National Weather Service indicates that a storm is "near Jonesburg, moving
northeast at 40
mph," it assumes a user knows the location of Jonesburg, the spatial
relationship between
Jonesburg and the user's location (which may be changing if the user is in
motion) and is able to
integrate the motion of the storm with the motion of the user to know if the
user is actually
threatened. However, most people are not cognizant of this information.
10010] Previously, the meteorological science and the positioning and
communications
technology required to get site specific information for a given vehicle or
user and the hazards it
could face did not exist. However, a number of navigation products for
aviation, marine and
terrestrial use have recently been introduced, including TeleType World
Navigator, MapTech
- 3 -
CA 02559684 2006-09-14
Pocket Navigator, MapTech Outdoor Navigator, TeleType GPS Companion, Microsoft
Streets &
Trips, Hertz NeverLost, Control Vision AnywhereMap / AnywhereWx.
[0011] In each of these products (except AnywhereWx), the user map orientation
is fixed with a
moving icon representing the vehicle (automobile or boat) in motion. This
approach has a
number of shortcomings, including ease with which a user can still get lost,
and inability to adapt
to non-fixed range conditions. That is, users who cannot easily read and
interpret maps may still
get lost. For example, if a map is always oriented with north at the top and a
right turn is
indicated, to someone traveling south the turn is actually to the left (on the
map). A display that
rotates to keep the route of travel at the top of the display would allow
turns and other maneuvers
to be synchronized with the route of travel (i.e., left on the display is the
direction the driver
actually turns).
[0012] Fixed ranges may be appropriate when a map display is used for
navigation only, but
fixed ranges are not appropriate when a device is used to anticipate hazardous
conditions. For
example, exits on the Kansas Turnpike can be as much as 30 miles apart. A user
traveling
westbound at Topeka using a navigation device with a fixed-range map display
set on a range of
ten miles may go past the last exit and drive into a dangerous weather
situation 15 miles to the
west. There would be no way for the user to avoid or escape on this limited-
access rural
highway.
[0013] Some known aviation systems rotate a display map with the route of
flight and changes in
aircraft direction. However, these are relatively large units intended to be
fixed inside the
cockpit of an aircraft. There is one known aviation display system that is
portable,
AnywhereMap by Control Vision. AnywhereMap uses a GPS signal to rotate its
display to
conform to the direction of travel of the AnywhereMap device. The map moves
underneath a
fixed icon or point on the display to indicate the location of the device
above the map. There is a
supplement to AnywhereMap called AnywhereWx in which current radar and other
weather
information is added. No forecast information is available on AnywhereWx, nor
does it have the
capability of changing ranges or otherwise notifying a pilot or user of
hazardous conditions in
the travel path. There is no technology to predict when the path of hazardous
weather and a
moving user will intersect.
- 4 -
CA 02559684 2006-09-14
[0014] Hertz's Neverlost in-car navigation system also changes orientation as
the automobile
changes direction. However, there is no weather information on the Neverlost
system. In
addition, because the Neverlost system is designed to assist automobile
renters who are generally
unfamiliar with the locale in which they have rented the car, the close-up
fixed map range is
inappropriate for meteorological display and warning purposes.
[0015] In addition to the above limitations, known systems typically provide,
at most, only
location information regarding the mobile device. That is, the mobile device
cannot be used to
report information, other than location information, from the mobile device to
a second party,
e.g., another user or a central server.
[0016] The aforementioned problems indicate there is a need for the solutions
provided by the
present invention.
BRIEF SUMMARY OF THE INVENTION
[0017] The invention provides a system and method for receiving event or
hazard infolination by
a mobile data processing device and using that information to warn a user of
the device of a
future hazard or life threatening event with reference to the user's and/or
device's intended
direction of travel. In one embodiment, an event center maintains a database
and display of
hazards (current and predicted) across a large area, such as the entire United
States and adjacent
coastal waters. The event center also receives information regarding the
location of each of a
plurality of mobile data processing devices, such as PDA's, cell phones,
laptop computers,
automobiles or a fleet of commercial trucks.
[0018] A hazard location algorithm compares a forecast location of each device
with a forecast
hazard and transmits a warning to each device that is predicted to encounter
the hazard. The
warning can take the form of text, audio, and/or a visual display indicating,
for example, that the
device will likely encounter heavy snow in approximately 30 minutes, and that
the heavy snow
will last for approximately 45 minutes. As the device moves, its actual
position is updated in the
event center, and a revised warning is transmitted to the device. The warning
can be conveyed to
the vehicle in terms of mile posts, railroad stations, waypoints, Very High
Frequency
Omnidirectional Range Stations (VORs), latitude/longitude, etc.
-5-.
CA 02559684 2006-09-14
[0019] In some embodiments, the event forecast warning system may use a
rotating map to
display information to a user of the system. The system display displays a
geographic map
including an icon indicating a present location of the system on the
geographic map, based on
received location information. The display also includes forecast hazard
information. Control
logic of the system rotates the geographic map displayed, based on the
received location
information, so that a direction of travel of the system maintains constant
with respect to a
predetermined position on a housing of the display (e.g., the top of the
display).
[0020] In yet other embodiments there is a method for providing information
regarding an
observed event, receiving an event type as user input into a mobile data
processing device, where
the event type is selected from a constrained set of event types displayed on
the mobile data
processing device. The mobile data processing device determines an event
location in proximity
to the mobile data processing device, and wirelessly sends to an event center,
the event type
and the determined event location. The location can be determined in various
ways, including
user input, automatic detection, or reading location information from a second
device such as an
RFID tag.
[0021] The event center may receive from a mobile data processing device,
computer readable
data comprising information corresponding to an event visually observed by a
user of the mobile
data processing device, wherein the data includes a type of event, and
includes a location of the
event based on the location of the mobile data processing device. The type of
event can be
selected from a constrained set of event types. The event center may then
display on a display
device a warning based on the received computer readable data.
[0022] In some embodiments, based on the event initially reported, the device
may be used to
report subsequent related information, or secondary information, regarding the
event dependent
on the type of event initially selected by the user of the mobile data
processing device. E.g.,
where the event type identifies a medical condition, it is useful to know such
information
including the afflicted person's blood pressure, or to relay EKG information.
The mobile data
processing device may receive an input value for a type of secondary
information associated with
the selected event type, and wirelessly send to an event center the input
value for the secondary
- 6 -
CA 02559684 2013-06-07
78496-16
information. The event center may optionally return a confirmation message to
the mobile
data processing device.
[0023] The secondary information may be determined in various ways
according to
various embodiments of the invention. For example, the types of secondary
information
associated with various event types may be stored in a lookup table, database,
or other storage
in the mobile data processing device. Alternatively, the associated type of
secondary
information may be provided by the event center. An event type may have
multiple types of
secondary information associated with it. Secondary information may include
numerical
values (e.g., a blood pressure), binary data (e.g., an EKG), textual
information, visual images
or photos, audio recordings, and the like.
[0024] The event center may incorporate any secondary information
associated with a
hazard or event into the messages or warnings displayed on the display
devices. For example,
images, audio, or video recorded of an event may be displayed by the display
device along
with the event type and location. In one embodiment, the image of an event or
hazard is
displayed on a map at a point corresponding to the location where the event or
hazard was
reported. Users of interactive display devices such as computers may customize
the display
graphical user interface so that only the desired information is included in
the displayed event
notification. The notification may be moved around on the display screen, and
the event may
be minimized by the user. Alternatively, an event may be selected and any
secondary
information associated with the event (e.g. video clips, images, sounds, text
data, etc.) may be
shown on the display screen.
[0024a] According to one aspect of the present invention, there is
provided a method
for providing information regarding an observed event, comprising: (a)
receiving from a
mobile data processing device, computer readable data comprising information
corresponding
to an event observed by a user of the mobile data processing device, wherein
said computer
readable data includes an event type and an event location based on a location
of the mobile
data processing device, and wherein said data includes sensory data recorded
proximately to
the event; and (b) displaying on a display device a notification based on the
received computer
readable data.
- 7 -
CA 02559684 2013-06-07
= 78496-16
10024b1 According to another aspect of the present invention, there is
provided an event
notification system, comprising: a database for storing information
corresponding to an event;
memory storing computer executable instructions for performing a method of
presenting a
notification to a user of the system, said method comprising: receiving from a
mobile data
processing device, information corresponding to an event, wherein said
information
corresponding to the event includes an event type, an event location based on
a location of the
mobile data processing device, and sensory data recorded proximately to the
event, outputting
a notification for display on a display device, wherein said notification is
displayed
superimposed on a map at a point proximate to the point on the map
corresponding to the
location of the event.
BRIEF DESCRIPTION OF THE DRAWINGS
[0025] FIG. 1 shows a system including an event center that provides
hazard
information to a plurality of recipients 107, 108 and 109.
[0026] FIG. 2 shows one possible configuration for a vehicle warning
system and
method including a display 201 that shows weather hazard information and a
cell phone 207
that optionally displays weather hazard information.
[0027] FIG. 3A shows a current weather grid including current and
forecast weather
hazards, and current and forecast vehicle locations.
- 7a -
CA 02559684 2006-09-14
[0028] FIG. 3B shows the weather grid of FIG. 3A after ten minutes have
elapsed.
[0029] FIG. 3C shows the weather grid of FIG. 3A after twenty minutes have
elapsed.
[0030] FIG. 3D shows the weather grid of FIG. 3A after thirty minutes have
elapsed.
[0031] FIG. 3E shows the weather grid of FIG. 3A after forty minutes have
elapsed.
[0032] FIG. 3F shows the weather grid of FIG. 3A after fifty minutes have
elapsed.
[0033] FIG. 4A shows a current weather grid including current and forecast
weather hazards,
and current and forecast vehicle locations.
[0034] FIG. 4B shows the weather grid of FIG. 4A after ten minutes have
elapsed.
[0035] FIG. 4C shows the weather grid of FIG. 4A after twenty minutes have
elapsed.
[00361 FIG. 5 shows a method of generating weather hazard information for
vehicles according
to various principles of the present invention.
[0037] FIG. 6 shows an illustrative rotating user map in a first orientation
according to an aspect
of the invention.
[0038] FIG. 7 shows an illustrative rotating user map in a second orientation
according to an
aspect of the invention.
[0039] FIG. 8 shows an illustrative rotating user map in the second
orientation according to an
aspect of the invention, zoomed out from FIG. 7.
[0040] FIG. 9 illustrates a storm spotter observing meteorological conditions
using a mobile
device, according to an illustrative embodiment of the invention.
[0041] FIG. 10 illustrates a display of meteorological conditions as reported
to a weather
monitoring system, according to an illustrative embodiment of the invention.
[0042] FIG. 11 illustrates a conventional crawl generation method.
- 8 -
CA 02559684 2006-09-14
100431 FIG. 12 illustrates a method for generating information for broadcast
via television
according to an illustrative embodiment of the invention.
[0044] FIG. 13 illustrates a block diagram of a vehicular media system with an
integrated hazard
warning system, according to an illustrative embodiment of the invention.
[0045] FIG. 14 illustrates a method for reporting follow up information based
on the type of
event initially selected by a user.
[0046] FIGS. 15, 16, 17, 18, 19, and 20 are screenshots of a graphical user
interface display
screen for a weather tracking application according to one or more
illustrative embodiments of
the invention.
DETAILED DESCRIPTION OF THE INVENTION
[0047] FIG. 1 shows a system employing various principles of the present
invention. As shown
in FIG. 1, an event center 101 receives event-related information from various
sources, such as
weather-related information from one or more radar sources 102, temperature
data sources 103,
wind data sources 104, and other data sources 105 (including, but not limited
to, regional
weather stations that provide air and pavement temperature, humidity, and
other measurements).
One or more antennas 110 coupled to weather center 101 may receive information
regarding the
location of mobile devices that use the system. In addition to or instead of
radio frequency
communication, this information can be received over the Internet, wireless
network, or other
computer network, or via dedicated dial-up telephone lines. Additionally,
Aircraft Situation
Display (ASD) data 113 can be received from various sources, such as the FAA,
which
distributes information regarding the current location and identity of
aircraft.
[0048] Event center 101 may also be connected to and receive information from
non-weather
related entities, such as Federal, State, and/or local emergency response
agencies 114 (fire,
police, EMS, 911, FEMA, etc.), private response companies 115. In this manner,
center 101
may be equipped to accept, provide, and/or relay information regarding any
life threatening or
hazardous event.
- 9 -
CA 02559684 2006-09-14
[0049] In one embodiment, event center 101 may be coupled to one or more trip
planning web
sites 106, which allow device operators to pre-register with the system and to
optionally file trip
plans, similar in nature to so-called "flight plans" that are filed by pilots.
In this embodiment,
described in more detail herein, device operators provide information
regarding the identity of
the device, the intended starting point and destination, and route information
(e.g., which
highways will be traversed), and this information is stored in event center
101 for tracking
purposes.
[0050] Each recipient 107, 108 and 109 includes a corresponding device,
illustrated by element
107a, 108a, and 109, that receives event information from event center 101
pertaining to that
device's current and/or future predicted location. In certain embodiments,
each device is
equipped with a navigational device such as a GPS receiver that enables the
device to determine
its present position and a radio frequency transmitter that transmits the
device's current location
to weather center 101. Additionally, as described below, each device
preferably includes a
display and/or audio output device that permits event information to be
communicated to the
device operator. In one embodiment, the device comprises a cellular telephone,
a wireless
Personal Digital Assistant (PDA), or other similar device.
[0051] It is presumed that a network of radio antennae illustrated as elements
110, 111, and 112
is available to relay signals to and from each device. Alternatively,
satellite communication can
be used, or a combination of the two can be used. Various commercially
available systems, such
as the so-called "ON STARTm" system, or a mobile telecommunications carrier
(e.g., Sprint PCS,
Cingular, Nextel, etc.) can be used to transmit and receive information
including device
identification and location information. For aircraft, the FAA provides a data
stream that
identifies each aircraft by its tail number and provides the current location
of the aircraft.
Although not critical to the invention, it is contemplated that each device
user (or fleet operator,
where appropriate) will pre-register each device with event center 101 by
automatically or
manually providing device identification information that can then be used to
correlate device
locations with particular devices. Event center 101 may charge a fee for event
reporting services
on a monthly or transaction basis, thus providing a commercially beneficial
arrangement.
- 10-
CA 02559684 2006-09-14
[0052] In general, event center 101 generates event or hazard predictions for
a plurality of
geographic areas, such as four square kilometer "cells," and compares the
location (current and
predicted) of each cell in which there is a future event or hazard to device
locations. The size of
the cells is arbitrary, as they could be 100 yards on a side or even smaller
as meteorological
science improves and computing power continues to drop in price. For each
event or hazard,
event center 101 transmits a message to each device that is predicted to
intersect with or be
located in the cell, and optionally provides information concerning the nature
of the event (e.g.,
severe snowstorm, flood, chemical plume, biological hazard, terrorist attack,
etc.), the predicted
time before the event will occur, based on the device's current path
(including, for example, the
direction and speed of the event), and the predicted duration of the event.
[0053] Event center 101 monitors weather conditions around various geographic
areas such as
counties, States, bodies of water, or the entire United States, and forecasts
future events,
including weather hazards such as severe storms, hail, snow, wind, ice,
tornados, or other types
of hazards. There are numerous methods of predicting weather involving both
computers and
humans, and various companies provide weather forecasting services, as does
the National
Weather Service. One example of a weather predicting method is disclosed in
U.S. Patent No.
5,959,567, entitled "Method and Apparatus for Tracking of Organized Storms."
[0054] FIG. 2 shows an illustrative embodiment for a device 200 that can be
used independently
or installed in vehicles in accordance with the principles of the present
invention. It will be
appreciated that various types of navigational aids are commercially
available, including GPS
receivers and map displays that identify a device operator's current location.
The inventive
principles can be applied by modifying any of these commercially available
units to incorporate
additional functions contained herein. Moreover, various commercially
available systems can be
installed in a vehicle to transmit the current location of the vehicle for
various purposes, such as
theft prevention and vehicle recovery. Alternatively, device 200 may be a
standalone data
processing unit with the requisite capabilities, such as a laptop or notebook
computer, personal
digital assistant or mobile telephone, handheld or tablet PC, or the like.
[0055] As shown in FIG. 2, a GPS receiver 203 receives information from
satellites that permits
the device to determine its current location with a reasonable degree of
accuracy. This
- 11 -
CA 02559684 2006-09-14
information is fed into a microprocessor 202, which is programmed to
periodically transmit the
information through wireless transceiver 204, or through an optional other
network interface 208.
When installed in a vehicle, additional information from the vehicle, such as
data from vehicle
sensors (e.g., temperature, speed, etc.) can be transmitted to the event
center through transceiver
204 or network interface 208.
[0056] Microprocessor 202 can be programmed with information regarding where
to transmit
the information (e.g., a radio frequency, Internet Protocol address, or the
like). Instead of a
single event center, multiple event centers can of course be provided, and
each device can
transmit to the nearest event center based on its location or to an event
center for a particular type
of event. Alternatively, distributed receiving centers can forward device
location information to
a central event center using a computer network such as the Internet.
Transceiver 204 may
include a receiver that receives messages transmitted from the event center
and a transmitter for
providing information from the device to the event center. Alternatively, the
warnings can be
received through Network interface 208. Warnings can be transmitted as text
and/or audio
messages to a cellular telephone number provided by the device operator
corresponding to the
device.
[0057] In one embodiment, a map display 201 of the type commonly used in
commercially
available vehicle navigation systems or on portable electronic devices is
coupled to the
microprocessor 202. As shown, the map shows the current location of the device
superimposed
on a map, such as a street or county map. Additionally, warning information
received from the
event center can be superimposed in the form of text and/or graphics on the
map display in order
to indicate the proximity and direction of the hazard or to the device
operator. A speaker 205
can be used to generate audio warnings.
[0058] Turning to the operation of the event center, in one embodiment a
computerized database
of current and forecast event information, such as weather information, is
generated and
periodically updated. This data can be stored in a grid-type data structure in
which a geographic
area is divided into cells of a given size (e.g., four statute of nautical
miles on each side). In
other words, weather hazard information extracted from a weather map
(extracted either by a
human operator or automatically by computer) is converted into a discrete
hazard indicator (e.g.,
- 12 -
CA 02559684 2006-09-14
severe snow, severe thunderstorm, hail, chemical cloud, etc.) and the
indicator is stored into a
cell corresponding to the area over which the hazard will occur. A county, for
example, may be
divided into a plurality of fixed-size cells, and a storm moving through the
county may cause
hazard indicators to be stored in a subset of those cells as the storm moves,
thus avoiding sending
a warning message to an entire county if possible.
[0059] For purposes of illustration, it will be assumed that a geographic
region is divided into a
plurality of cells. In each cell for which a current or forecast hazard
exists, a hazard indicator is
stored to indicate the current or predicted condition in the cell. The grid is
updated as the event
situation changes (e.g., the weather changes). Thus, every few minutes, the
grid is updated to
reflect the latest current and predicted future information.
[0060] In one embodiment, information concerning each device location is also
maintained in
the weather grid, such that overlaps between forecast hazards and forecast
device locations can
be identified by computer. Assume that a severe thunderstorm is moving
directly from west to
east, and a device is moving directly toward the advancing storm (i.e., from
east to west). FIG.
3A shows a current weather grid including a plurality of cells in which a
current weather hazard
WO exists in four cells on the left side of the grid. A forecast weather
hazard W10 (i.e.,
predicted to hit in 10 minutes) exists in the next set of cells just to the
east of the current weather
hazard. Similarly, a forecast weather hazard W20 exists just to the east of
the 10-minute
forecast, and a forecast weather hazard W30 exists just to the east of the 20-
minute prediction.
Thus, assuming that each cell measures 4 nautical miles on each side, FIG. 3A
shows that the
stoini is generally moving east at a rate of 4 nautical miles every 10
minutes. Although only one
weather hazard per cell is shown, it is of course possible to have multiple
weather hazards
activated in each cell (e.g., severe hail and severe lightning, for example).
It will be appreciated
that different cell sizes and granularity can be used as desired; in general,
smaller cell sizes will
result in increased computational needs, but greater specificity.
[0061] Also shown in FIG. 3A is a forecast vehicle or device location,
illustrated by the notation
VO (vehicle position now) through V30 (forecast vehicle location 30 minutes
from the present
time). As shown in FIG. 3A, the vehicle is moving due west at approximately 4
nautical miles
every 10 minutes. At the initial time as shown in FIG. 3A, the current vehicle
position is not in a
- 13 -
CA 02559684 2006-09-14
cell for which a weather hazard exists, and there is no projected overlap for
the next 30 minutes
based on the 30-minute forecast weather hazard (indicated by W30) and the 30-
minute forecast
vehicle position (indicated by V30). Thus, no warning is issued at this time.
As meteorological
science improves it will be possible to generate warnings for more than 30
minutes into the
future.
[0062] FIG. 38 shows the weather grid of FIG. 3A after ten minutes has
elapsed. In FIG. 3B, all
of the current and forecast weather hazards have moved one cell to the right
(i.e., moved due east
by four nautical miles), and the vehicle positions (current and forecast) have
moved to the left by
one cell (i.e., moved due west by four nautical miles). Consequently, there is
now an overlap
between the vehicle's 20-minute forecast location and the storm's forecast 30-
minute future
location. According to one variation of the invention, the weather center
generates a warning to
the vehicle or device indicating that a weather hazard is forecast to hit the
vehicle in 30 minutes
and, optionally, when the vehicle will "clear" the hazard. In general, the
system looks for
matches to indicate the time that the hazard will first be encountered and its
duration (i.e., based
on the number of cells that the vehicle is expected to travel through). There
may be times when
the hazard is so large that the end of the hazard will be beyond the 30-minute
interval; in such
cases, no "duration" need be provided.
[0063] There are many different ways of evaluating the overlap situations
illustrated in FIGs. 3A
through 3F, and the following is intended to provide one example only. In one
variation, for
each overlapping cell, if the vehicle forecast time is greater than the
weather forecast time (e.g.,
V30 is greater than W20), the cell is ignored for warning purposes, whereas if
the weather
forecast time is greater than or equal to the vehicle forecast time, a warning
is generated. Thus,
according to one variation of the method, a warning is generated for only one
cell in FIG. 3B
(i.e., the cell containing W30 and V20). The warning time is the weather
forecast time for that
cell (i.e., 30 minutes). The validity of this prediction can be seen by
looking forward to FIG. 3E,
which shows the situation 30 minutes later (i.e., the current vehicle position
VO coincides with a
current weather hazard, WO).
100641 Turning now to FIG. 3C (twenty minutes later), there are four cells in
which the vehicle's
location falls in cells containing weather hazards. However, the two leftmost
cells contain
- 14 -
CA 02559684 2006-09-14
overlaps where the vehicle forecast time is greater than the weather forecast
time, and these can
be ignored. The remaining two cells indicate that the vehicle's current
location is in a 30-minute
hazard cell (cell containing VO), and that the vehicle's 10-minute future
location is in a 20-
minute hazard cell (cell with V10). The hazard time can be calculated as T = V
+ (W-V) = W, or
20 minutes. That is, the hazard time is the weather forecast time in the
leftmost cell that does not
contain a vehicle forecast time that exceeds a weather forecast time. The
validity of this forecast
can be seen by looking forward to FIG. 3E (twenty minutes hence), which shows
that the vehicle
is in a cell experiencing a weather hazard.
[0065] Alternatively, where multiple overlapping cells occur, a subtraction
value W-V can be
obtained (i.e., subtract the vehicle forecast time from the weather forecast
time) for each cell.
The cell containing the lowest non-negative number is used to generate the
warning value, and
the warning value is the weather forecast time. For example, in FIG. 3B, there
are two
overlapping cells, the first one having a W-V value of ¨10, and the second
having a W-V value
of +10. The cell containing the +10 value is used, and its weather forecast
time is 30 minutes.
Therefore, a 30-minute hazard warning is generated. Similarly, in FIG. 3C,
there are four
overlapping cells, as follows: first cell W-V= ¨30; second cell W-V=-10; third
cell W-V=+10;
fourth cell W-V=+30. The cell generating the lowest non-negative number has a
weather
forecast value of 20 minutes, which can be verified by looking ahead 20
minutes (FIG. 3E).
Similarly, in FIG. 3D, there are three overlapping cells, as follows: first
cell W-V=-20; second
cell W-V=-10; third cell W-V=+10. The weather forecast value of that cell is
10 minutes, which
can be verified by looking ahead 10 minutes (to FIG. 3E). Finally, in FIG. 3E
there is only one
overlapping cell, which has a W-V value of zero. The weather forecast value
for that cell is zero,
indicating that a weather hazard presently exists for the vehicle.
[0066] FIGs. 4A to 4C show a second illustrative example in which the
vehicle's predicted path
changes over time (i.e., from generally northwest to generally southwest).
Beginning in FIG.
4A, at an initial time there is an overlap between two cells. The first cell
has a W-V value of ¨
20, and the second cell has a W-V value of zero. The weather forecast for the
non-zero cell is 20
minutes, indicating that a weather hazard will occur in 20 minutes.
- 15 -
CA 02559684 2006-09-14
[0067] In FIG. 4B, ten minutes later, there are four overlapping cells, with W-
V values as
follows: first cell, W-V=-30; second cell, W-V=-10; third cell, W-V=+10;
fourth cell, W-V=0.
The two non-negative cells show weather hazard forecast times of 20 minutes
and 10 minutes,
respectively. The lowest non-negative cell has a forecast time of 10 minutes,
which can be given
as the warning.
[0068] In FIG. 4C (twenty minutes after FIG. 4A), the forecast vehicle
position has now shifted
to a southwest position, possibly as a result of receiving updated position
information from the
vehicle, or due to an interpolated new path based on updated information, or
due to other
information such as deviation from a previously provided travel plan. In FIG.
4C, there are two
overlapping cells, with W-V values as follows: first cell, W-V=0; second cell,
W-V=+10. Using
the cell having the lowest value (0), the forecast weather hazard time is 10
minutes, which can be
given as the warning.
[0069] In addition to providing a warning indicating the time that a weather
hazard will be
encountered, the system can provide an estimate as to the duration of the
hazard, based on the
current travel path of the vehicle. For example, if the weather grid indicates
that the forecast
vehicle position for the next 30 minutes will intersect cells in which storm
activity is predicted
for the next 30 minutes, but thereafter will be cleared of the storm cells,
the system can inform
the vehicle operator that the weather hazard will last for 30 minutes. In FIG.
3C, for example, a
hazard duration value of 20 minutes can be given, because the vehicle's 20-
minute future
position is not in a cell that contains a weather hazard.
[0070] Those of skill in the art will appreciate that similar methodologies
may be used to provide
warning messages regarding events other than meteorological events, including
smog warnings,
chemical or biological attack warnings, earthquake, volcanic eruption, and the
like.
[0071] As explained above, event center 101 preferably maintains information
regarding the
positional location (e.g., latitude and longitude) of each of a plurality of
devices that have pre-
registered with the event center to provide mobile hazard reporting services.
In one variation of
the invention, each device periodically transmits its current location to the
event center, and this
information is used to update the grid. Devices can pre-register with the
event center by
providing identification information, personal identifier, serial number, or
other unique ID, (e.g.,
-16-
CA 02559684 2006-09-14
the VIN for an automobile, a license plate number, fleet serial number, or the
like), and this
information is transmitted along with the positional information to event
center 101.
Additionally, the computer in event center 101 can extrapolate future
(forecast) positions for the
device by comparing two previous locations along with the time differences
between
transmissions from those locations.
[0072] For example, if a device has moved between two latitude/longitude
points within a
certain period of time, the computer can calculate a predicted heading and
velocity based on
these two points and the elapsed time between the points. This heading and
velocity can be
translated into cells using simple linear algebra.
[0073] Device locations can also be correlated and interpolated based on a
"flight plan" provided
by a device owner before leaving for a trip. A web site can be used to
facilitate the entry and
transmission of this information to weather center 101. For example, a driver
can indicate on a
map the starting point, ending point, and intended travel path (e.g., by
specifying or highlighting
this route on a map). Weather center 101 can use this information to determine
the likely
position of a device based on the starting time of the trip and the elapsed
time. Additionally,
information regarding speed limits on various highways can be taken into
consideration when
determining the likely position of a device (e.g., if traveling on an
interstate that has a 65-mph
speed limit, the computer can assume that the vehicle has maintained this
speed between two
points). Consequently, if event center 101 does not or cannot receive a signal
indicating device
position, it can estimate the position based on the trip plan filed by the
device operator. In the
event that hazards are predicted for the vehicle, the system can suggest an
alternate route that
avoids or minimizes intersections with cells that have hazards.
[0074] In another variation of the invention, devices can register to use the
service by using a
telephone (e.g., a cell phone) to dial a telephone number and provide the
phone number of the
device, to be activated for alerts. For example, a family traveling by
automobile can use a cell
phone capability of the device to call a toll-free telephone number and enter
the telephone
number of the device. Thereafter, they can periodically transmit their current
location. Event
center 101 can thereafter transmit weather hazard warnings directly to the
cell phone, in the form
of short text messages, or by voice messages.
- 17 -
CA 02559684 2006-09-14
[0075] Aircraft positions can be obtained from an Aircraft Situation Display
(ASD) data source,
such as that provided by the Federal Aviation Administration. In this
variation of the invention,
event center 101 obtains periodic location information and identification
information (e.g., tail
numbers) and uses it to identify the location of airplanes. Consequently, it
is not necessary for
aircraft to transmit their location to weather center 101, although such a
configuration is of
course within the scope of the invention.
[0076] In addition to transmitting current location information, each device
may transmit other
data, such as temperature and current and average velocity. Temperature data
from the device
could be used, for example, to help predict whether the roads will be icy
based on meteorological
conditions.
[0077] FIG. 5 shows various steps of a method that can be used to carry out
various principles of
the present invention. Beginning in step 501, one or more devices pre-register
to receive
warnings. As described above, this pre-registration can occur using a web
site; a telephone; data
connection, or by other means. The registration step associates a device
identifier with the
device, so that subsequent location updates for that device identifier can be
correlated with the
device, including means for communicating with the device (e.g., an Internet
Protocol address of
a device; a cell phone telephone number to which warnings will be transmitted,
the network
address of a wireless PDA; or the like). Once registered and activated, event
center 101 will
track and provide warnings to the device.
[0078] In step 502, a composite of current and forecast conditions is
generated and mapped onto
a grid such as the type shown in FIG. 3A. There are many different methods of
predicting
hazards, including human-originated means, computer-generated means, and
combinations of the
two. As is conventional, various meteorological displays can be generated to
show various
forms of precipitation, temperatures, pressures, and wind conditions. The data
can include radar
reflectivity data such as that generated by NEXRAD radars operated by the
National Weather
Service; "slime track" information showing the position of observed or actual
tornados over a
period of time; meteorologist-entered information such as the suspected
location of a tornado or
other severe weather event; information derived from spotters; and other data
tending to show a
severe weather event such as a tornado. In one embodiment, this information
can also include
-18-
CA 02559684 2006-09-14
predicted future storm or tornado tracks that are predicted using any of
various technologies,
such as those illustrated in U.S. Patent No. 5,959,567, entitled "Method and
Apparatus for
Tracking of Organized Storms."
[0079] In another embodiment, a future path can be predicted using human
judgment (e.g.,
trained meteorologists monitoring various radar data and other sensed
information). In yet
another embodiment, a projected path as provided by the National Weather
Service (NWS) can
be used. The NWS often provides an array of points or "dots" that can be
connected to
determine the path along which a tornado or hurricane is expected to move.
[0080] A tornado location can be heuristically determined using a combination
of radar echo
shape ("hook" echo), radar wind velocity and echo structure, all well known in
the
meteorological community. Once the initial position is determined, a predicted
future location
can be predicted using the principles set forth in the '567 patent, or a
meteorologist can use his or
her judgment to establish a projected future path. The National Weather
Service transmits a
Tornado Detection Algorithm (TDA) in its WSR-88 radar data stream, and this
TDA position
could thus also be used. The NWS also uses its own movement algorithms, which
could be
employed in conjunction with the principles of the invention. Finally,
information supplied by
"spotters" can be used in conjunction with any of the above techniques in
order to pinpoint the
location of an actual tornado.
[0081] Event center 101 may similarly receive data regarding non-
meteorological events from
government agencies and/or private companies.
[0082] In step 503, a composite of current and forecast device locations is
generated and stored
in a data structure like that of FIG. 3A, such that device positions and
hazards can be evaluated
to determine whether there are intersections in cells that would warrant one
or more warnings.
As explained above, device locations can be extrapolated if necessary, and
updated as device
location updates are received.
[0083] In step 504, the forecast hazards and the forecast device locations are
compared to
determine whether there are any overlaps. As explained above, for example, if
a forecast device
position in 30 minutes will intersect with a cell in which a storm hazard is
forecast for 30
- 19 -
CA 02559684 2006-09-14
minutes, a warning will be sent to the device operator, based on the pre-
registered information
(e.g., information correlating the device identifier to a cell phone number,
IP address, or other
communication tool). Additionally, the duration of the weather hazard can be
provided based on
the forecast path of the device and the end of the weather hazard. For
example, if a severe
hailstorm is predicted to occur across a large number of cells, but the
vehicle will have passed
beyond the cells in 45 minutes, then the event center can indicate that the
hazard will subside in
45 minutes.
[0084] Consequently, in step 505 a warning of the distance or travel time to a
hazard is
transmitted to the device or devices in the cell corresponding to the hazard,
along with the
duration of the hazard and other supplemental information as available (e.g.,
tornado spotted in
the cell in which the vehicle is traveling). In step 506, an optional step of
suggesting an
alternate route can be provided.
[0085] In an alternative embodiment of the invention, the functions of the
event center may be
performed by system 200 (Figure 2) based on received location and hazard
information, such as
meteorological or weather information. That is, each system 200 may include
control logic (e.g.,
computer software executed by microporocessor 202) to perform the functions of
an event center
with respect to itself, calculating warning information for itself based on
the received location
and hazard information. In such an embodiment, an information distributor may
relay pertinent
weather and hazard information to each system, or the information may be
received directly from
primary information sources (e.g., the National Weather Service).
ROTATING USER MAP
[0086] According to an aspect of the invention, a rotating user map may be
used to improve
vehicle and device navigation, and hazard awareness, resulting in improved
safety and
productivity.
While the invention is described with respect to weather hazards and
meteorological information, the invention is applicable for providing warnings
for any type of
hazard, including natural or man-made disasters, life threatening events, etc.
[0087] The GPS receiver 203 may communicate with the microprocessor 202 to
generate for
display on display 201 a map that is tied to latitude and longitude
coordinates and that "rotates"
- 20 -
CA 02559684 2006-09-14
as the user changes directions. That is, the top of the display (or any
arbitrary fixed point) faces
the same direction the user is traveling. In addition, the range of the
display (i.e., the level of
granularity and size of the area visible on the display) is selectable by a
user of the device or
dynamically by software controlling the device's operation. The range refers
to the zoom level
of the display. For example, a customer may use a short range (high zoom
level) when using the
system primarily as a navigational tool, e.g., where the display depicts an
area of only 1 square
mile, in order to view in detail the immediately surrounding area. However, a
customer may use
a larger range (low zoom level) when using the system to receive
meteorological information
and/or warnings, e.g., the display depicts an area of 100 square miles, in
order to clearly view
meteorological information for a larger geographic area. The zooming of the
display may be
controlled by the microprocessor 202.
[0088] Figure 6 illustrates a display 201 of device 200, where the system is
traveling to the
north, and rain 605 is illustrated with respect to the location of the system.
If the user holding
the system or vehicle in which the system is located turns right onto Grand
Ave. and begins
traveling to the east, the display rotates so that the direction of travel is
at the top of the display
(or any other predetermined side), such as is illustrated in Figure 7. While
an icon 601 depicting
a car is used to indicate the system's current position, any icon may
alternatively be used. Arrow
603 is for illustrative purposes, indicating the direction of travel of the
system, and does not
necessarily need to be included on display 201.
[0089] With further reference to Figures 8, an aspect of the invention
provides current and
forecast weather information pertinent to the system's route of travel. An
override system may
cause the zoom level of the display to change to insure that the user receives
critical information
regardless of the range or direction of travel when the information becomes
pertinent. The
method as performed by the system may be controlled by the microprocessor
connected to the
GP S receiver with appropriate circuitry, hardware and/or software control
logic.
[0090] When a user is viewing the display at a high zoom level (e.g., one
mile) to view detailed
street, topographic or marine information, meteorological information
regarding an approaching
storm might not be visible on the display 201 until the system (and its user)
is too near the
meteorological phenomenon (e.g., inclement weather such as heavy rain or a
lightning storm) to
-21-
CA 02559684 2006-09-14
take appropriate precautions such as altering his or her route of travel to
avoid the inclement
weather. Thus, according to an aspect of the invention, the system
automatically enlarges the
range (lowers the zoom level) as appropriate such that the meteorological
threat is visible on the
display as well as the icon 601 indicating the position of the system.
[0091] Figure 8 illustrates the display after the system automatically zooms
out from the display
illustrated in Figure 7. Figure 8 illustrates the icon 601 indicating the
current location of the
user, the present location 801 of a storm with severe weather areas 803 (e.g.,
hail), and the
forecast location 805 of the storm and severe weather areas 807, with which
the system will
intersect. Figure 8 also illustrates a warning 809 indicating that hail is
predicted. The warning
may optionally include a duration or expiration time (see Figure 9, discussed
below). The types
of hazards or inclement weather for which the system will automatically adjust
the range of the
display 201 may be user-defined or set by the system software.
[0092] In some embodiments the system automatically changes the zoom level
without user
input if the inclement weather will intersect an extrapolated path of the user
or the path as
depicted on a pre-registered trip plan. The extrapolated path of the user may
be based on a
direction of travel of the system, or may be based on the road on which the
user is currently
traveling. That is, if the road turns or changes directions, the system may
assume that the system
will turn and change directions with it. Alternatively, the user may specify
or the system may
provide a default safe distance, e.g., five miles, where if the inclement
weather is or is forecast to
be closer than the safe distance value, then the system will automatically
adjust the zoom such
that the inclement weather (or weather forecast) is visible on the display.
[0093] However, if the system and the inclement weather are not calculated to
intersect (or get
closer than the safe distance) at some future time, the system might not
automatically change
zoom levels. For example, when the system is traveling away from the inclement
weather and
the paths of the system and the weather do not intersect, the system will not
change the zoom
level and interrupt the user's viewing of the display (e.g., the user is
heading south at 65 mph and
the inclement weather behind the user, while also heading south, is only
moving at 30 mph).
[0094] Using the above described systems and methods, the weather warning
system is user
centric in that the display is based on the system's specific location.
Another system one mile
- 22 -
CA 02559684 2006-09-14
away will provide a different display. Each system displays hazards or hazard
warnings when
the hazard is pertinent to the specific system's location or path. Each system
overrides the user
to display a hazard pertinent to the system's location if the hazard is within
a distance selected by
the user, and each system will not interrupt a user when the system is not
threatened by the
hazard. By only displaying information pertinent to the specific system, the
effectiveness of a
storm warning or other alert is maximized because false alarms are minimized.
Another mobile
device 905 displaying hazard information on a rotating user map is illustrated
in Figure 9,
discussed further below.
REPORTING SPOTTER INFORMATION
[0095] As indicated above, meteorological condition information or hazard
information may be
observed by a spotter or user near a location of the observed condition or
event. Figure 9
illustrates a spotter 901 observing, e.g., meteorological condition 903,
namely, a rotating wall
cloud, indicative of a possible tornado. Spotter 901 may enter data 907 into a
mobile computing
device 905, e.g., a personal digital assistant, smartphone, mobile telephone,
or the like. Data 907
may include a type 909 of the observed condition, and an approximate location
911 of the
observed condition.
[0096] Various input methods may be used to enter data 907 into mobile device
905. For
example, the observed condition may be selected from a constrained list of
predetermined inputs,
e.g., by using a drop down list, radio buttons, or the like. Alternatively,
the spotter 901 may
manually enter the observed condition, e.g., by typing or writing input into
the mobile device
905 as is known in the art. The predetermined inputs may be selected by the
mobile device
based on a category (e.g., meteorological, medical, natural disaster,
terrorist, etc.) and
subcategory (e.g., under meteorological, sub-categories may include tornado,
precipitation,
lightning, etc.) selected by the spotter. Thus, if the spotter selects the
meteorological category
and tornado subcategory, the mobile device may provide a drop down list or
radio buttons having
selections for "Tornado On Ground," "Funnel Cloud Aloft," and "Rotating Wall
Cloud" as is
illustrated in Figure 9. The following table provides illustrative categories,
subcategories, and
selections within subcategories that may be used.
Category Subcategory Selections
- 23 -
CA 02559684 2006-09-14
Meteorological Tornado Tornado On Ground
Funnel Cloud Aloft
Rotating Wall Cloud
Precipitation Rain
Sleet
Hail
Snow
Flooding
Surface Conditions Icy Roads
High Winds
Sub-32 F
Heat Advisory
Medical Individual Heart Attack
Heat Exhaustion
Seizure
Broken Bone
Vehicular Accident Auto Accident
Motorcycle Accident
Bicycle Accident
Natural Disaster Volcanic Eruption
Earthquake
Forest Fire
Terrorist Attack Physical Bomb
Gunfire/Artillery
Hostages
Chemical Liquid
Gaseous
Biological Contained
Uncontained
Table I
[0097] Those of skill in the art will appreciate that alternative categories,
subcategories, and
selections within subcategories may be used to suit the needs of the
particular system. That is,
the specific categories, subcategories, and selections within subcategories
used is secondary to
the fact that categories, subcategories, and selections within subcategories
are used to provide a
constrained list of selection items to a user. hi addition, more or fewer
hierarchical levels of
categories may alternatively be used and, as evidenced above, the same number
of category
levels need not be used for each top-level category.
[0098] The approximate location input by the user may be based on the location
of the mobile
device 905, e.g., when device 905 includes a global positioning system (GP S).
The spotter 901
- 24 -
CA 02559684 2006-09-14
may enter information indicating that the observed condition is at the
location of the mobile
device 905, or may provide information indicating the observed condition's
location relative to
the mobile device 905, e.g., by providing a distance 913 from the mobile
device 905, and a
direction 915 from the mobile device to the observed condition. Optionally,
the mobile device
905 may be equipped with a compass and/or a distance meter (e.g., a laser
distance calculator) to
help the user determine the direction of an event from the mobile device as
well as the distance
of the event from the mobile device. The device may then convert the location
information into
estimated latitude and longitude coordinates. In addition, the user of the
mobile device may
provide an approximate location of the observed condition by selecting a
position on the
displayed map. That is, the user can touch the screen at the approximate
location of the observed
condition, and the device translates the touch input coordinates to an
approximate location (e.g.,
latitude and longitude) of the observed condition based on the input location
on the displayed
map.
[0099] In other embodiments, alternative methods of computing location may be
used. For
example, the system may be adapted for use in a particular location, such as a
large stadium,
arena, race track, or other venue in which prompt reporting of hazardous and
life-threatening
events can potentially save lives. In such a scenario, the system may be
adapted for the user to
input a section, row, and/or seat number where an affected individual is
located. That is, if a
patron seated in section 212, row AA, seat 10 is having chest pains, that
patron (or others around
him or her) can signal an usher or employee equipped with a mobile device 905
adapted for use
in the particular venue. The employee may then select Medical/Heart Attack
from the
constrained list of selection items on the device, and enter the location
section 212, row AA, and
optionally seat 10 (the section and row numbers typically provide enough
specificity for
emergency response purposes). The employee then sends the information by
selecting the 'send'
button 917 or similar option. The information is wireles sly transmitted to
the event center 101,
and a confirmation message may optionally be relayed back to the device 905
from which the
employee sent the information to confirm that the report was received by the
event center 101.
In this example, the venue operator may maintain its own event center, in
which case the venue
operators are immediately notified of the patron's medical situation and can
initiate the
emergency response thereto. In addition, the venue operator may have a GIS map
that correlates
-25-
CA 02559684 2006-09-14
GPS locations to specific seat locations, where the reported location
information is sent in
latitude/longitude format.
[00100]
In another embodiment of the invention, the mobile device 905 may be equipped
with a RFID tag reader, and RFID tags may be located throughout a venue, e.g.,
at each section,
row, seat, conference hall, points of interest, offices, etc. Each RFID tag
then identifies the
location in which the RFID tag is placed when activated by the RFID tag reader
on the mobile
device 905, and the location information is automatically input into device
905 for further
communication to event center 101.
[00101]
Upon submitting the data to the event center 101 (Figure 1), the event center
may
perform an integrity check on the reported data. The integrity check may
include determining
the user or spotter from which the information was received. If the spotter is
known to the
organization operating the event center, the information is more likely to be
reliable than if the
information is received from a user unknown to the organization operating the
weather center. In
addition, the event center may compare the received information to known
conditions (e.g.,
current weather) to determine if the condition is likely or even possible. For
example, upon
receiving a report from a spotter that a rotating wall cloud has been observed
at location X,Y, the
event center may compare the report with other meteorological information. If
all other
meteorological information indicates that location X,Y is sunny with no clouds
in the sky, the
received report might be discarded or ignored.
[00102]
After performing the integrity check, the event center integrates the newly
received information with presently known information, e.g., information
received from other
sources such as the National Weather Service, FEMA, etc. In addition, the
event center may
transmit the updated information to remote subscribers who have previously
requested to be kept
informed of conditions in certain areas. Figure 10 illustrates a subscriber
display including an
indication 1001 of the spotter's report regarding the rotating wall cloud.
[00103]
The reporting system described herein is especially useful in high-noise
environments, such as at auto races, during high winds or storms, amidst a
panicked crowd of
people, or at other high-noise events, because communications are not
dependent on voice
communications or being able to hear a user attempt to audibly report event
information. The
- 26 -
CA 02559684 2006-09-14
system is also particularly useful in self-sustained environments or areas
that do not rely on
public emergency response groups. For example, many auto race tracks,
speedways, and
superspeedways are not supported by public 911, fire depaitment, paramedic
service, and/or
hospitals. That is, they provide their own fire department, their own
paramedic service, and/or
their own hospital. In such a scenario, the present system can be used to
report events when
calling 911 would only introduce an additional level of delay (i.e., 911 would
either inform the
caller that they cannot send paramedics to the caller's location, or 911 would
merely call the
venue operator for further action on the venue operator's part).
[00104] With further reference to FIG. 14, one or more aspects of the
invention may
provide or allow a user of a mobile device adapted to perform as described
herein, e.g., any of
devices 107a, 108a, 109 (Fig. 1), device 200 (Fig. 2), or device 905 (Fig. 9),
to report follow up
information relevant to the reported event based on the type of event or
hazard initially reported
by the user. That is, certain event types may have associated secondary
information that, while
not necessary in the initial report, provides useful follow up information
that may assist private,
local, state, or federal agencies in responding to the event report. For
example, if a tornado is
reported, it would be useful to provide a direction and speed of travel of the
tornado. If a heart
attack is reported, it would be useful to provide blood pressure information,
if known. The
below table provides an illustrative example of secondary information that may
be associated
with event types, and stored in the memory of the mobile device, as well as
the expected format
of the input values for the secondary information. The secondary information
preferably
comprises one or more numerical quantities, although the invention is not
limited in this respect
as is evident in Table 2. For example, the secondary information may also
comprise a Boolean
variable, text, or an image such as a photograph.
UsSecondary Information Requested _Format ______________________________
Tornado on ground Speed mph
Direction of travel compass direction
Heart Attack Blood pressure Number
Electrocardiogram (EKG) Binary data
Broken Bone Bone location Text
Flooding Depth Number (Ft.)
Hostages Number of people Number
Motorcycle Accident Rider wearing helmet? (Y/N) Boolean
Photograph of helmet Image
- 27 -
CA 02559684 2006-09-14
Table 2
[00105] The above are merely examples of secondary information that may be
provided.
Those of skill in the art will appreciate that different or additional
secondary information may be
provided, as determined by the needs of the particular system and event types
used. The specific
secondary information provided is secondary to the ability to provide
secondary information
based on a selected event type.
[00106] Referring to Fig. 14, in step 1401, a user of a mobile device
visually observes or
learns of an event or hazard regarding which the user desired to report back
to the event center.
Such an event may include any event discussed herein, including meteorological
events, medical
events, etc. After visually observing or learning about the event, the user
inputs an event type in
step 1403.
[00107] The device determines the event location in step 1405, e.g., based
on a UPS
location (e.g., latitude, longitude, and altitude) determined automatically by
the mobile device,
based on the GPS location in conjunction with a user provided or automatically
determined
direction and distance from the mobile device of the event, other user
provided information (e.g.,
section, row, and/or seat number of a venue), or based on externally obtained
location
information, e.g., by reading an RFID tag storing location information. These
are but a few
examples of how the location may be determined. The specific methodology used
is secondary
to the ability of the user or device to input or determine the event location
in proximity to the
mobile device. The mobile device in step 1407 sends the event type and event
location to the
event center via a wireless communications network, e.g., a wireless data link
over the Internet
or a cell phone with a modem.
[00108) In step 1409 the mobile device determines whether any secondary
information is
associated with the selected event type. The mobile device may determine
whether any
secondary information is associated with the selected event type by looking up
the selected event
type in a table, similar to Table 2, above. Alternatively or in addition to
the lookup table of
secondary information based on event type, the event center, upon receiving
the initial report of
the event type and event location, may transmit a list of requested secondary
information back to
the reporting mobile device, optionally with a confirmation of receipt of the
initial report. If no
- 28 -
CA 02559684 2006-09-14
secondary information is associated with the selected event type, the method
proceeds to step
1415.
[00109] If secondary information is associated with the selected event
type, the mobile
device prompts the user, and the secondary information is entered in step
1411. The mobile
device may also receive automated secondary information input from intelligent
devices
connected to or in communication with the mobile device, e.g., a camera and/or
microphone.
The mobile device transmits in step 1413 the entered secondary information to
the event center.
[00110] The event center distributes the received information, e.g., the
initial event type,
event location, and associated secondary information, to third parties in step
1415. Event center
may simply display the reported information on a display device for an event
center operator to
visually observe, and may optionally output audio to alert the operator of the
incoming report.
The server computer at the event center may log the event and store records of
it for future use,
and may also forward alerts to other personnel, as appropriate. In addition,
authorized users may
access the data stored on the event center server, e.g., via the Internet.
[00111] Figs. 15-18 are screenshots showing one or more illustrative
embodiments of a
graphical user interface for displaying reported event or hazard information.
As stated above,
this user interface may be monitored by an event center operator, who may
receive notifications
upon arrival of new event information into the event center server. A
notification is an action
taken in response to the arrival of event information at the event center.
Notifications may alert
users of the new event information in a variety of ways, and may include text
information,
images, audio, or video data to describe the event. Although Figs. 15-18
illustrate notifications
as pop-up windows on a display screen monitored by an event center operator,
notifications are
not limited to such embodiments. Alternatively, audio, text, and graphical
notifications may be
presented to any device capable of connecting to the event center server. For
example, an event
center operator may carry a mobile device which receives a custom text message
notification
whenever new event information appears in the event center server.
Alternatively, notifications
and event data may simply be logged into a data file at the event center for
processing at a future
time.
- 29 -
CA 02559684 2006-09-14
[00112] In reference to the graphical user interface illustrated in Figs.
15-18, in certain
embodiments, an operator may monitor this user interface on a display screen
in the event center.
Upon receiving a notification pop-up, indicating new event information, the
operator may
forward alerts based on the incoming information to the appropriate personnel.
In alternative
embodiments, this user interface may be implemented as an Internet
application, originating
from a server at the event center. In such embodiments, Internet clients may
view this user
interface and receive notifications directly by using their own computers or
mobile devices to
access the data at the event center. In yet another embodiment, this user
interface may be
displayed as part of a television broadcast, for example, during a weather
forecast or breaking
news alert.
[00113] While aspects and embodiments described in Figs. 15-18 allow for
interactive
data retrieval from the event center, it should be recognized that the
limitations of certain devices
or data networks will prevent some users from taking advantage of certain
interactive features of
the user interface. For example, while a meteorologist employed by a
television station may be
able to manipulate the views and data displayed by the user interface, viewers
watching the
broadcast on TV will obviously not have the same control over the user
interface. Similarly,
certain mobile or handheld computers may lack the hardware infrastructure
required to
customize views and request specific data or specific events, whereas other
personal computer
user would be able to perform such tasks.
[00114] While Figs. 15-18 show an embodiment which displays meteorological
events on
a weather map, the present invention is not limited to such uses. As discussed
above, the present
invention may be applied to more than just meteorological events. For example,
the invention
may be used to provide information regarding medical emergencies, natural
disasters, traffic
incidents, terrorist attacks, etc. Similarly, alternative embodiments do not
require a display
screen with a map, as is shown in Figs. 15-18. For example, reported events
may be presented in
list form, and sorted by location, time, or priority. Events may also be
reported using proprietary
event notification software such as instant messenger, text messaging, email
distribution lists,
and the like. Alternatively, events might only be logged in the event center
server, for
subsequent data processing.
- 30 -
CA 02559684 2006-09-14
[00115] Turning now to Fig. 15, a mobile computing device (e.g. a personal
digital
assistant, smartphone, mobile telephone, etc.) has recently transmitted data
to the event center
server reporting a meteorological hazard. In this case, a rotating wall cloud,
indicative of a
possible tornado, has been spotted by the device user, and a notification pop-
up now appears in
the user interface 1501. The display screen shows a point 1505 on a map 1503,
indicating the
location of the hazard. Additionally, a brief description of the hazard and
the time that the
hazard was reported 1507 are displayed next to the point 1505 marking the
location of the
hazard. In some embodiments, as in Fig. 15, the event description and reported
time are
displayed in a different color and font size from other labeled items on the
map, making them
easily visible to the user. Similarly, a point marking the location of an
event may be a different
size and color than the other points on the map. In certain additional
embodiments, the color of
the point 1505 depends on the existence of additional available information
describing the event
or hazard. For example, if the notification of the meteorological hazard
contains a black dot at
the location point 1505, then no additional data is available regarding that
hazard; only the
location, time, and a brief description have been reported to the event
center. However, a red dot
at the hazard location point 1505 indicates that the event center has
additional information
regarding this hazard. In one embodiment, the user may click either the point
1505 or the event
description 1507 to view this additional information about the event or
hazard.
[00116] In Fig. 16, the user has observed that the event center contains
additional
information about the recently spotted rotating wall cloud, and has clicked on
the event location
1505 or event description 1507, as shown in Fig. 15. The user interface
display screen 1601,
now shows a small notification window 1603, which displays the additional
available
information regarding the hazard. The event type 1605 (i.e., Tornado), the
identity of the spotter
1607 (i.e., Mike Smith), and the damaged caused thus far by the hazard 1609
(i.e., No Damage)
are displayed in the notification window 1603. The information displayed in
the notification
window 1603 will, of course, vary depending on the amount and type of
information reported by
the spotter, and on the type of the event or hazard. In one embodiment, a
scroll bar dynamically
appears in the window 1603 when the information available regarding the event
does not fit into
a single window.
-31-
CA 02559684 2006-09-14
[00117] Also contained in the notification window 1603 is a thumbnail
image 1611 of the
event. This thumbnail indicates to the user that the spotter has taken a
digital picture of the
rotating wall cloud and transmitted the image to the event center. With recent
developments in
technology, many common mobile devices also function as digital cameras, video
cameras, or
audio recorders. Other mobile devices may have the capacity to record external
temperature,
barometric pressure, air quality, wind speed, ground vibration, and almost any
other measurable
condition that a human might observe. Thus, while the invention is presently
described in
relation to digital images, it is not limited as such. For example, any of the
sensory data
described above, including sounds, pictures, videos, and any other recordable
information, may
be transmitted by the mobile user, stored in the event center, and displayed
by the user interface.
[00118] In Fig. 17, the user has clicked on the thumbnail image 1611 of
Fig. 16. In
response, the user interface display screen 1701 has maximized the image 1703.
That is, the
notification on the display screen 1701 now illustrates a full-sized high
quality image, and all
other information regarding this event has been hidden. In this view, the user
can observe, in as
much detail as possible, that which the mobile unit user observed. As stated
above, these
observations are not limited to images, but may be video, audio, or any other
type of measurable
sensory data.
[00119] In Fig. 18, the user has manipulated the display screen 1801,
moving the
notification, consisting of the transmitted event image 1703, away from the
location of the event
1503. A graphical user interface "rubber-band" connector 1803, now appears on
the display
screen 1801, connecting the notification to its corresponding location 1505.
Using this aspect of
the invention, the user may freely move the notification around the screen
1801, without the
danger of forgetting where the event was spotted. For example, as shown in
Fig. 18, a
meteorologist may find it useful to observe the image of the rotating wall
cloud 1703 and the
weather radar map of the surrounding area in the same display view. If the
meteorologist
subsequently moves the image notification 1703 to a different location on the
display screen
1801, the rubber-band connector 1803 will move with the image 1703. Thus, the
user has the
flexibility to customize the display screen 1801, by positioning the
notification on the display
screen and selecting the preferred notification view (e.g., brief description
only, full-size image,
thumbnail view with data, etc.).
- 32 -
CA 02559684 2006-09-14
[001201 The inventive system, including the mobile device(s) from which
reports can be
sent, in conjunction with the event center server with network access,
provides routine, non-
incident public safety and medical information collection and dissemination to
appropriate
personnel. The event center server may optionally provide a geographically
specific map (e.g., a
street-level map) illustrating the locations of all related parties to an
event as determined by a
particular subscriber to the event center. E.g., if a remote user reports a
medical emergency, and
the emergency response personnel are equipped with location aware devices
(e.g., GPS) that
report the location of the emergency response personnel back to the event
center, the event center
may track the location of the emergency response personnel and the injured
person's location on
the map, and may report the location and ETA of the emergency response
personnel to the
mobile device from which the medical emergency report was received.
[001211 The event center server may also provide, or be linked to another
database that
can provide, information regarding known risk factors for the reporting party
(e.g., a subscriber
is known to be allergic to codeine) and/or the incident location (e.g., the
location is accessible
only by dirt road). The event center may also communicate with other
computers, databases,
and/or electronic devices to obtain configuration, diagnostic, and/or repair
information based on
the event type and/or secondary information received, and optionally transmit
the information
back to the mobile device from which the event information and secondary
information is
received.
[00122] As an example, emergency medical technicians (EMTs) may respond in
an
ambulance to a 911 call or other reported medical emergency. The EMTs could
report the event
type and secondary information regarding the medical emergency to the event
center as
described above. In addition, it may be desirable for the EMTs to transmit
more complex
medical data using the mobile device. For example, EMTs may be unable to
interpret
electrocardiogram (EKG) and electroencephalogram (EEG) readouts taken at the
scene.
However, a doctor or specialist at a nearby hospital could receive images or
other information
pertaining to this medical data and properly diagnose the patient before the
ambulance reaches
the hospital.
- 33 -
CA 02559684 2006-09-14
[00123] In Fig. 19, EMTs responding to a medical emergency are treating a
patient who is
experiencing disorientation and numbness. Knowing that these symptoms may
indicate that the
patient has suffered a stroke, the EMTs perform EKG and EEG tests on the
patient. The EKG
and EEG machines transfer the test results, either using a data cable or short-
range wireless data
transfer technology, to the mobile device. The mobile device can then send
this data as an
image, video, or other data type, to the event center. The event center
operator can observe a
medical emergency notification pop-up 1902 that appears on the user interface
display screen
1901. The emergency is briefly described in the notification 1902, and its
location is indicated
by a dot 1907 on the map. Along with the description, the thumbnail images
1903 and 1905
indicate that the on-scene medical personnel have performed EEG and EKG tests,
and the results
have been uploaded to the event center. These test results can now be viewed
as images or video
by a medical specialist at the event center, or transferred to nearby
hospitals for diagnosis and
triage of the patient. Where an event center server is located at a hospital,
the hospital personnel
may immediately begin reviewing the patient's medical information.
[00124] In Fig. 20, the progress of the ambulance is being tracked and
displayed on the
user interface display screen 2001. The ambulance is designated by a dot 2003,
and the patient's
updated medical data is displayed in the notification pop-up 2005. In the
example shown, the
patient's EKG readout, which is being continually monitored in the ambulance
en-route to the
hospital, is also being uploaded to the event center and displayed in the
notification pop-up 2005
as a digital video recording (other data types are also possible)
[00125] The embodiments illustrated in Figs. 19 and 20 show that the
present invention
can facilitate better and timelier medical care in emergency situations.
Medical data sent through
the mobile device can be combined with location data to allow more informed
decisions
regarding choice of hospital and choice of en-route treatment. The event
center can make the
latest medical data available to multiple nearby hospitals. Hospital personnel
can coordinate
based on the specialized treatment facilities, the on-duty staff, and the
current patient load at
each hospital, to select the optimal hospital for the patient's needs.
Additionally, the destination
hospital can monitor the location of the approaching ambulance with the GPS
tracking in the
mobile unit, and can receive updated en-route medical data, thereby enabling
the hospital to
provide the appropriate treatment promptly upon the patient's arrival.
- 34 -
CA 02559684 2006-09-14
[00126] In another aspect of the present invention, the event center may
communicate
with other computers or databases to pinpoint the location of a reported
event. For instance,
suppose a mobile device user sees a distant lightning strike and observes that
a small forest fire
has resulted from the strike. Using the embodiments described above, she
reports this event to
the event center, including her estimate of the location of the lightning
strike. However, if she is
several miles from the event, this reported location may be some distance from
the actual
location of the lightning strike and resulting forest fire. In one embodiment,
the event center can
corroborate the occurrence of the event and pinpoint the event location, by
accessing a
meteorological database which contains the time and precise location of all
recent lightning
strikes in the area. First, the event center uses the information in this
database to confirm the
validity of the mobile user's report, by confirming an actual lightning strike
in the approximate
place and time as the reported strike. Then, the event center can update the
exact location of the
lightning strike and forest fire, using the data from the meteorological
database.
[00127] Another example will further illustrate this aspect of the
invention. A driver
observes a highway traffic accident, and, seeing that no one was injured in
the accident, he
decides not to stop. Nevertheless, the driver wishes to report this accident,
as a likely traffic
delay, to the event center. However, by the time the driver enters and
transmits his report, he and
his car may be a mile or more down the road. In this case, the event center
may access a street-
level GPS map to compute the actual location of the accident based on the
driver's current
location, speed, and time entered for the accident. If the road is straight,
then the street-level
UPS map may only be useful to determine the highway name and cross-street or
mile marker of
the accident. However, if the section of road between the driver's current
position and the
accident has any turns, then the exact location of the accident might not be
calculated accurately
from the driver's location, orientation, and speed. In that case, the event
center can use the
street-level UPS map to pinpoint an exact location for the accident. The event
center would first
identify the road that the driver is currently on, then back-track on that
road the appropriate
distance to determine the location of the accident.
[00128] In an alternative embodiment of the invention, the mobile device
user may spot an
event and set the mobile device into reporter mode, in preparation to enter
the event type and
secondary information. Once the user sets the mobile device into reporter
mode, the reported
- 35 -
CA 02559684 2006-09-14
location of the device is 'frozen,' or unchanged until after the event is
sent. While the physical
device continues to move (e.g., in a car, airplane, or other means of
transportation), the location
reported to the event center will be the location of the mobile device when
reporter mode was
engaged. This aspect of the invention allows for more accurate event location
reporting. An
observer might be a considerable distance past event before inputting the
event information into
the mobile device and sending it to the event center. In this embodiment,
without any additional
effort from the mobile device user, the most accurate known location for the
event is preserved
in the mobile device and reported. In certain embodiments, reporter mode may
be automatically
engaged when the user takes a digital photograph, or records sound or digital
video with the
device. In other embodiments, reporter mode is engaged when the user initiates
the event
reporting software on the mobile device.
[00129] Given that the system described herein provides meteorological
warnings as well
as receives event reporting information, the event center server may mediate
between responders,
on-scene systems and meteorological databases to provide location-based
prospective and
historical weather conditions, e.g., conditions at the time the event was
reported, believed to have
occurred, and/or for the expected duration of the incident or the response
thereto.
[00130] The event center may also be used for subsidiary operations such
as tracking
consumables inventory (e.g., drugs administered on-scene at a reported event),
and tracking
durable equipment inventory, maintenance, and repair.
[00131] As indicated above, authorized users or subscribers can access any
and/or all
information stored in the event center server or servers, either directly from
within the event
center or remotely via a network connection such as through the Internet. In
addition, the event
center server notifies applicable personnel, e.g., based on the type of event
and/or the location of
the event. That is, if a medical event occurs within the jurisdiction of Smith
County, the event
center may notify the Smith County Police and Smith County Paramedics.
However, if the event
occurs at the Kansas Speedway, the event center may also or alternatively
notify the Kansas
Speedway operations center because Kansas Speedway operates its own medical
response unit
and has hospital facilities on-site. The personnel, company, group, agency,
etc., to notify may be
stored in a lookup table, database, or the like in the event center server,
and may be based on
- 36 -
CA 02559684 2006-09-14
event type, event location, or any other information (including secondary
information) received
from a mobile device.
CUSTOM WARNINGS
[00132] According to an aspect of the invention, a subscriber may be a
television station
or a meteorologist employed by a television station, and updated
meteorological information
may be automatically sent to a computer used by the meteorologist or at the
location of the
television station. The meteorologist may want to display information,
referred to as a "crawl",
over a television program being broadcast by the television station, based on
the received
meteorological information. The crawl displays text moving from right to left
on the top or
bottom of a television screen. However, if the meteorologist is not present,
viewers might not
receive a crawl warning that they otherwise would if the meteorologist were
present when the
warning arrived from the event center. Thus, the event center (or
alternatively the subscriber's
computer with applicable control logic or software) may automatically generate
crawl text for
broadcast over a television program. When the meteorologist subscriber's
computer receives or
generates the automated crawl text, the crawl information is sent to a
broadcast computer for
mixing with the television signal, such that the broadcast television signal
includes the crawl text
moving across the screen.
[00133] Figure 11 illustrates a conventional method for generating a crawl
for display over
a television broadcast. In a typical scenario, in step 1101, a tornado or some
other event is
spotted by a storm chaser or other individual near the location of the
tornado, and the individual
notifies a law enforcement agency, e.g., by calling 911 or the police. In step
1103, the law
enforcement agency notifies the National Weather Service. In step 1105, the
NWS manually
sends the information to the Advanced Weather Interactive Processing System
(AWIPS) of the
NWS (that is, they type it). In step 1107, an AWIPS administrator types in
information
regarding the tornado or other event and sends the information to the National
Oceanic and
Atmospheric Administration (NOAA) Weather Wire (NWWR) and other dissemination
channels. In step 1109, the NWWR sends a notification to a television station.
In step 1111, the
television station processes the notification by manually entering crawl text
based on the
- 37 -
CA 02559684 2006-09-14
notification, and airs the crawl for broadcast. The amount of time from
initial sighting in step
1101 to display in step 1111 usually takes approximately 5 to 30 minutes.
[00134] Figure 12 illustrates a method for generating television
display information
according to an illustrative aspect of the invention. In step 1201, a storm
chaser or other
individual equipped with a mobile device as described herein witnesses a
tornado or other
hazardous or life-threatening event. In step 1203, the user inputs information
about the event
into the mobile device, which wirelessly transmits the information as a
"ground truth" report to a
= event center. In step 1205, the event center performs a quality control
integrity check on the
received "ground truth" report, either by manually comparing the received
report to presently
known conditions for the applicable area, or by using automated computer
algorithms to do so.
In step 1207, the event center sends the quality controlled report to a
device, such as a remote,
mobile or vehicular device described herein (including, e.g., the device from
which the report
was received). The event center may also send email notifications or other
reports to one or
more devices or entities including, e.g., the NVVS, news media, etc. The
remote device may also
include a computing device at a television station which, in step 1209,
automatically processes
the received quality controlled report for broadcast via television. The
television broadcast
might include not only a text crawl, but also a plotted weather report similar
to that illustrated in
Figure 10. The amount of time from initial sighting in step 1201 to display in
step 1209 takes
less than one minute, and typically only requires about 30 seconds when the
integrity check is
performed automatically.
[00135] An advantage of the present invention is that crawl information
can be
automatically generated without human intervention, thus presenting crawls and
other
information to viewers in much less time than previously possible, thereby
saving lives. In some
embodiments, a user may be required to authorize or approve the automatically
generated text,
for example, a meteorologist may approve the crawl text regarding weather
prior to its being sent
over the broadcast TV signal. In another embodiment, the crawl may be sent
automatically over
the broadcast without requiring a user to approve or authorize the crawl.
Another advantage of
the present invention is that, because the remote device from which a ground
truth report is
received may be GPS-enabled, location information is inherently trustworthy.
Whereas in
- 38 -
CA 02559684 2006-09-14
previous solutions, manual data entry errors often resulted in misidentifying
the location of
meteorological events.
[00136] Using the above-described system, a user is not required to type
the text of the
crawl into a computer because the weather center or client computer can
generate the crawl
automatically based on the location of the client computer, or based on some
other
predetermined location (e.g., the viewing area of the television station). The
event center or
subscriber computer may store a database of text information indicative of
common words and
phrases used in warnings, e.g., times, locations, hazard types, and the like.
When a warning is
received that should be provided to television viewers, the event center or
subscriber computer
automatically generates a crawl message using the stored words and phrases in
the database, e.g.,
"A thunderstorm watch is in effect for Washington County until 9:30 PM.",
based on the content
of the hazard warning information received from the event center.
Alternatively, crawls can also
be manually typed into a Chyron or other messaging system at the television
station.
[00137] According to another aspect of the invention, audio warnings may
be
automatically generated and spoken back to a user of a mobile warning device.
For example,
with reference to Figure 13, a hazard warning system 1305 as described herein
may be integrated
in a vehicular media system 1303, e.g., AM, FM, or satellite radio receiver,
CD/DVD player,
digital music player, navigation system, or the like, so that the vehicle has
one combined
information and media display system 1301. The vehicular media system 1303 and
hazard
warning system 1305 may both be connected to an output override circuit 1307.
The output
override circuit, by default, passes information received from the vehicular
media system 1303 to
the audio and video output devices, e.g., speaker(s) 1309 and visual display
1311. However,
when a warning is receive or detected by hazard warning system 1305, the
output override circuit
may mute or lower the volume of the vehicular media system 1303 and output
audio information
from hazard warning system 1305 via speaker 1309. In addition, output override
circuit 1307
may overlay information received from hazard warning system 1105 on top of
other information
already displayed on visual display 1311.
[00138] Hazard warning system 1305 may be connected to warning database
1313 that
stores audio clips that may be combined to provide customized audio warnings
to a driver of the
- 39 -
CA 02559684 2013-06-07
' 78496-16
vehicle so that the driver does not need to divert his or her attention from
the road to read
information on the visual display. Warning database may store pre-recorded
audio clips that
hazard warning system 1305 combines and plays to provide the proper warning.
E.g., hazard
warning system 1305 might combine the recorded audio clips "hail," "is,"
"detected," "five,"
"miles," "ahead," "and," "is expected to last," "until," "four," and "PM" to
inform the user that
the system, on its present route of travel, is predicted to encounter hail in
five miles and the hail
will last until 4 PM. In an alternative embodiment, the warning database
stores text strings
which, after combined, are read back by a text-to-speech processor in the
hazard warning system
1305.
[00139]
Any of the methods of the invention can be implemented in control logic, e.g.,
software, that can be stored on computer disks or other computer-readable
media for execution in
a computer or other data processing device. The invention can be implemented
using web
browser technology, handheld computing units, and/or cellular telephones in
addition to or
instead of being integrated into a vehicular system. Moreover, the invention
has wide
application for various types of weather hazards including lightning, hail,
hurricanes, wind shear,
and the like, and the inventive principles can be applied equivalently to such
phenomena, as well
as to natural and man-made hazards, disasters, and life-threatening events. No
claim should be
interpreted to be in means plus function format. Numbered steps in method
claims should not be
interpreted to require a particular ordering of the steps, unless the claim
expressly requires such
ordering. What has been described above is merely illustrative of the
application of the
principles of the present invention. Other arrangements and methods can be
implemented by
those skilled in the art without departing from the scope of the present
invention.
- 40 -