Note: Descriptions are shown in the official language in which they were submitted.
CA 02567839 2009-08-05
-1-
MASS SPECTROMETRY WITH SELECTIVE ION FILTRATION BY
DIGITAL THRESHOLDING
FIELD OF THE INVENTION
(0002] The invention relates to the field of detection and characterization of
large analytes,
such as biomolecules, by molecular mass analysis.
BACKGROUND OF THE INVENTION
[0003] Mass spectrometry has been used for many decades in the
characterization of small
organic molecules. The technique typically involves the ionization of
molecules in the sample to
form molecular ions by subjecting the sample to an electron beam at a very low
pressure. The
molecular ions are then focused and accelerated by an electric field into a
magnetic field or
quadrupole. The ions are separated in the magnetic field or quadrupole
according to the ratio of
the mass of the ion in to the charge on the ion z (m/z). After passing through
the field, the ions
impinge upon a detector which determines the intensity of the ion beam and the
m/z ratio, and
these data are used to create the mass spectrum of the sample.
[0004] With the increasing interest in larger molecules, especially
biomolecules such as
nucleic acids and proteins, new techniques in the field of mass spectrometry
are continually
being developed to characterize these molecules.
[0005] In recent years the performance of commercially available mass
spectrometers has
seen significant improvement due, in part, to the availability of improved
core components
including more stable power supplies, faster digitizers, and more
sophisticated fabrication
methods for ion optic elements, Particularly noteworthy are the newest
generation ESI-TOF
mass spectrometers which, from several vendors in a variety of configurations,
are now routinely
yielding the types of mass measurement accuracy and mass resolution previously
atiainabie only
on high end sector or Fourier transform ion cyclotron resonance (FTICR)-based
platforms. As
such, the use of such bench top instruments by the bioanalytical community
continues to expand
CA 02567839 2006-11-22
WO 2005/117270 PCT/US2005/018337
-2-
as these instruments are increasingly being made available to scientists and
technicians with a
broad range of analytical needs. Accordingly, a number of increasingly
sophisticated automation
schemes are emerging, many incorporating some form of liquid chromatography
(LC) as an on-
line sample purification step to support high throughput QC or drug screening
activities. While
there are a number of applications in which some form of LC is a requisite
step that facilitates
the analysis of very complex mixtures, it is also used frequently as a generic
desalting/purification protocol to prepare relatively pure analyte fractions
for MS analysis.
[0006] Low molecular weight chemical noise is often the limiting factor in
overall MS
performance as the presence of high levels of low molecular weight components,
such as
polymers and buffer constituents, can drastically limit the spectral dynamic
range and adversely
affect mass accuracy. While LC is often used to reduce the adverse affects of
such backgrounds,
constraints on sample throughput and issues associated with solvent
usage/disposal must be
considered as part of the laboratory work flow. Additionally, LC is often used
as a purification
step (as opposed to a separation step) to render analytes amenable to MS
analysis. Consequently,
there is an increasing need for simple methods to reduce the chemical noise
floor and render less
than "pristine" samples amenable to mass spectrometric analysis.
[0007] The present invention satisfies this need, as well as others, by
providing systems and
methods for digital filtration of mass spectral signals arising from singly-
charged low molecular
weight components such as solution additives and matrix modifiers without
significantly altering
the mass spectral signals of larger analytes such as biomolecules.
SUMMARY OF THE INVENTION
[0008] The present invention is directed to methods of identifying a multiply-
charged ion. A
mass spectrometer that comprises the following components is provided: (i) an
ion detector, (ii) a
digitizer that converts an analog signal to a digital signal, (iii) an analog
signal transfer means for
transferring an analog signal from the detector to the digitizer, and (iv) a
digital threshold filter
which is in digital data communication with the digitizer. A digital signal
threshold can be set at
the digital threshold filter and, in response to a digital signal input from
the digitizer, the digital
threshold filter independently outputs a digital signal to a data file only if
the digital signal input
is greater than the specified digital signal threshold. The continuing step of
the method is then
effected by specifying a digital signal threshold such that, upon a mass
spectrometer
measurement of the multiply-charged ion, the filtered digital signal output to
the data file
CA 02567839 2006-11-22
WO 2005/117270 PCT/US2005/018337
-3-
originates from the detection of the multiply-charged ion and excludes digital
signal output from
analog signals arising from singly-charged ions.
[0009] The present invention is also directed to methods for determining the
molecular mass
of a plurality of analytes in a mixture. A mass spectrometer that comprises
the following
components is provided: (i) an ion detector, (ii) a digitizer that converts an
analog signal to a
digital signal, (iii) an analog signal transfer means for transferring an
analog signal from the
detector to the digitizer, and (iv) a plurality of digital threshold filters,
each in digital data
communication with the digitizer. A digital signal threshold can be
independently set at any of
the plurality of digital threshold filters, each of which is in digital data
communication with the
digitizer and, in response to a digital signal input from the digitizer,
independently outputs a
digital signal to a corresponding data file only if the digital signal input
is greater than the
specified digital signal threshold. The continuing steps of the method are
then effected by
specifying a unique digital signal threshold at some members of the plurality
of digital threshold
filters, making a mass spectrometer measurement of the mixture, wherein each
unique digital
signal threshold differentially filters digital signals arising from the
plurality of analytes and
produces a unique digital signal output to each corresponding data file. The
measurement results
in storage of a plurality of data files. In the final step, each of the
plurality of data files is
analyzed and the molecular mass of at least one member of the plurality of
analytes is contained
in each of the plurality of data files.
[0010] The present invention is also directed to methods for calibrating a
mass spectrum of an
analyte. A mass spectrometer that comprises the following components is
provided: (i) an ion
detector, (ii) a digitizer that converts an analog signal to a digital signal,
(iii) an analog signal
transfer means for transferring an analog signal from the detector to the
digitizer, and (iv) a
plurality of digital threshold filters, each in digital data communication
with the digitizer. A
digital signal threshold can be independently set at any of the plurality of
digital threshold filters,
each of which is in digital data communication with the digitizer and, in
response to a digital
signal input from the digitizer, independently outputs a digital signal to a
corresponding data file
only if the digital signal input is greater than the specified digital signal
threshold. The
continuing steps of the method are then effected by specifying a first unique
digital signal
threshold at one digital threshold filter such that digital signal output to a
first data file has
signals from both the analyte and a calibrant ion and then specifying a second
unique digital
signal threshold at another digital threshold filter such that the digital
signal output to a second
CA 02567839 2006-11-22
WO 2005/117270 - PCT/US2005/018337
-4-
data file has signals from the analyte but not the calibrant. The second data
file is subtracted
from the first data file to obtain a calibration file which is then used to
calibrate the mass
spectrum.
[0011] The present invention is also directed to a system comprised of a mass
spectrometer
that comprises the following components: (i) an ion detector, (ii) a digitizer
that converts an
analog signal to a digital signal, (iii) an analog signal transfer means for
transferring an analog
signal from the detector to the digitizer, and (iv) a plurality of digital
threshold filters for setting
a digital signal threshold which are each in digital data communication with
the digitizer and in
response to a digital signal input from the digitizer independently outputting
a digital signal to a
corresponding data file only if the digital signal input is greater than the
specified digital signal
threshold. The system has a plurality of data files and a plurality of
parallel digital signal output
transferring means, each of which is in digital data communication with one of
the plurality of
digital threshold filters and a corresponding data file from the plurality of
data files.
BRIEF DISCUSSION OF THE DRAWINGS
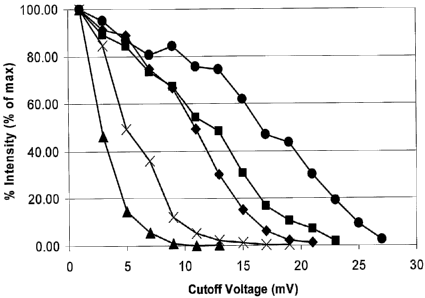
[0012] Figure 1 shows the detector response intensity as a function of digital
signal threshold
value (in this case indicated by cutoff voltage) of analyte ions having
similar m/z ratios but
differing in molecular weights. Circles: 140-mer oligonucleotide (m/z =
1232.9), squares: 70-
mer oligonucleotide (m/z = 1199), diamonds: 38-mer oligonucleotide (m/z =
1174.7), crosses:
12-mer oligonucleotide (m/z = 1233) and triangles: polypropylene glycol (PPG -
m/z = 1236).
[0013] Figure 2 is a schematic representation of the effects of specifying
digital signal
thresholds on mass spectra. Figure 2a depicts the raw digitizer (ADC, analog
digital converter)
output from a theoretical single scan containing a singly-charged ion (ionl)
which strikes the
detector at Ti and a large multiply-charged ion (ion2) which strikes the
detector at T2. Figures
2b and 2c indicate a spectrum with a high and low digital signal threshold
respectively. Figure 2d
indicates a spectrum without a digital signal threshold and detector "white
noise" is visible in the
spectrum.
[0014] Figure 3 displays mass spectra of a PCR product. Figure 3a is an ESI-
TOF mass
spectra of a 140-mer PCR product acquired at a normal (3 mV) digital threshold
setting. The
sample contains a contaminating amount of polypropylene glycol (PPG)
relatively high levels of
singly charged peptides (which serve as internal mass standards). Peaks
labeled with "x" indicate
CA 02567839 2006-11-22
WO 2005/117270 - PCT/US2005/018337
-5-
signals from the PPG and "c" represents signals from the peptide mass
standards. Figure 3b is an
ESI-TOF spectrum of the same sample of PCR product obtained at a digital
threshold setting of
15 mV. Contaminants and mass standards have been filtered out of the spectrum.
[0015] Figure 4 is an expanded region of the ESI-TOF spectra from Figure 3 in
which the
relatively low abundance high charge states of the PCR amplicon are detected.
The effective
signal to noise of the spectrum in Figure 4a is defined by the signal to
chemical noise ratio, while
the effective signal to noise of the spectrum in Figure 4b is defined by the
signal to electronic
noise ratio.
[0016] Figure 5 exhibits ESI-TOF spectra of a solution containing
approximately 0.5 nM
PCR product in the presence of 500 nM PPG was characterized at low (Figure 5a)
and high
(Figure 5b) threshold settings As shown in the inset, the top spectrum is also
inundated with
other chemical noise components and the peak-at-every-mass background
precludes the
detection of the low level PCR products. When the digital signal threshold is
set such that
signals from singly charged species are not detected, a distinct signature for
the low level
amplicon is detected.
[0017] Figure 6 indicates two overlapping peaks of a 140-mer oligonucleotide
and of a 12-
mer oligonucleotide which can be resolved through acquisition of data with
different digital
signal thresholds. The top spectrum was obtained with a digital signal
threshold setting of 7 mV.
The middle spectrum was obtained with a digital signal threshold setting of 11
mV. The bottom
spectrum was obtained by subtraction of the middle spectrum from the top
spectrum to obtain a
clean isotopically resolved spectrum of the 12-mer oligonucleotide.
[0018] Figure 7 shows the typical digitizer configuration (Figure 7a) with a
single threshold
setting compared to a digitizer which allows multiple threshold settings to be
applied
simultaneously to data stream coming from the TOF digitizer (Figure 7b).
[0019] Figure 8 shows mass spectra of carbonic anhydrase in the presence of
0.001% SDS
and P/I buffer. The protein-derived signals of the spectrum obtained with a 1
mV digital signal
threshold setting (Figure 8a) are subject to considerable interference from
the detergent and
buffer components. In contrast, Figure 8b indicates that the interfering
components are rendered
"invisible" by specifying a digital threshold setting of 11 mV.
CA 02567839 2006-11-22
WO 2005/117270 PCT/US2005/018337
-6-
DESCRIPTION OF EMBODIMENTS
[0020] In some embodiments of the present invention, the mass spectrometer
system
comprises the following components: (i) an ion detector, (ii) a digitizer that
converts an analog
signal to a digital signal, (iii) an analog signal transfer means for
transferring an analog signal
from the detector to the digitizer, and (iv) a plurality of digital threshold
filters for setting a
digital signal threshold which are each in digital data communication with the
digitizer and in
response to a digital signal input from the digitizer independently outputting
a digital signal to a
corresponding data file only if the digital signal input is greater than the
specified digital signal
threshold. In some embodiments, the analog and digital signals are voltage
signals and the
analog to digital converter (ADC) converts the analog voltage signal to a
digital voltage signal.
In some embodiments, a plurality of mass spectrometer measurements are made
and the resulting
plurality of data files are co-added.
[0021] In other embodiments, the mass spectrometer system comprises a (iv)
single digital
threshold filter instead of a plurality of digital threshold filters. The
single digital threshold filter
is in digital data communication with the digitizer and a corresponding data
file.
[0022] In some embodiments, the mass spectrometer is a time-of-flight mass
spectrometer, a
quadrupole time-of-flight mass spectrometer, a linear quadrupole mass
spectrometer, a linear
trap mass spectrometer, an electric/magnetic sector mass spectrometer or a
quadrupole ion trap
mass spectrometer. In some embodiments, ions are produced by electrospray
ionization (ESI).
[0023] In some embodiments, the multiply-charged analyte is a biomolecule such
as, for
example, a nucleic acid, a protein, a carbohydrate or a lipid. Examples of
nucleic acids include,
but are not limited to, RNA constructs used to screen small molecules for drug
discovery and
amplification products such as PCR products which can be used for genetic
analyses. In some
embodiments, the multiply-charged analyte is of a molecular weight of 5-500
kDa, 25-250 kDa,
or 50-100 kDa.
[0024] In some embodiments, the method allows for ESI-TOF characterization of
biomolecules in the presence of biomolecule stabilizing agents or matrix
modifiers used in online
separation techniques. Stabilizing agents include, but are not limited to,
buffer salts such as
phosphates for example, ampholytes, glycerol, polyethylene glycol,
polypropylene glycol,
reducing agents, detergents, and the like. Matrix modifiers may be any type of
additive used to
CA 02567839 2006-11-22
WO 2005/117270 PCT/US2005/018337
-7-
effect a solution matrix property advantageous to an analytical separation and
may include, but
are not limited to, ampholytes, detergents and buffer salts such as phosphates
for example.
[0025] In some embodiments, the biomolecule stabilizing agents or matrix
modifiers are
singly-charged when detected by the mass spectrometer. In other embodiments,
the biomolecule
stabilizing agents or matrix modifiers have one or two charges.
[0026] In some embodiments, when a plurality of digital signal threshold
filters are employed
in the mass spectrometer system, a plurality of unique digital signal
thresholds are specified in
order to obtain parallel differentially filtered data streams which are stored
in corresponding data
files. In some embodiments, any member of the data files may be subtracted
from any of the
other data files to obtain a more accurate representation of a given analyte
signal. These
embodiments may be used to obtain a more accurate mass spectrum of a calibrant
ion, or any
other lower molecular weight contaminating ion by subtracting out an
overlapping signal from
an ion having a similar m/z but with a larger molecular mass.
[0027] In some embodiments, the methods described herein which employ multiple
differentially thresholded data streams may be used in multiplexed data
acquisition of a plurality
of ions such as those obtained from chemical, protease or restriction
digestion of proteins or
nucleic acids.
[0028] In some embodiments, the methods described herein may be used to reduce
the
burden of level of purification of large molecular weight or multiply charged
analytes such as
biomolecules, for example, from stabilizing agents or matrix modifiers.
EXAMPLES
Example 1: ESI-TOF Mass Spectrometry Conditions
[0029] A Bruker Daltonics (Billerica, MA) MicroTOF ESI time-of-flight (TOF)
mass
spectrometer was used in this work. Ions from the ESI source undergo
orthogonal ion extraction
and are focused in a reflectron prior to detection. Ions are formed in the
standard MicroTOF ESI
source which is equipped with an off-axis sprayer and glass capillary. For
operation in the
negative ion mode, the atmospheric pressure end of the glass capillary is
biased at 6000 V
relative to the ESI needle during data acquisition. A counter-current flow of
dry N2 is employed
to assist in the desolvation process. External ion accumulation is employed to
improve
CA 02567839 2009-08-05
-8-
ionization duty cycle during data acquisition. Each ESI-TOF spectrum is
comprised of 75,000
data points digitized over 75 s. All aspects of data acquisition were
controlled by the Bruker
MicroTOF software package. Post processing of data was also performed using
the standard
Bruker software.
Example 2: PCR Conditions and Purification of Amplification Products
[0030] All PCR reactions were assembled in 50 pL reaction volumes in a 96 well
microtiter
plate format using a Packard MPII liquid handling robotic platform and M.J.
Dyad thermocyclers
(MJ research, Waltham, MA). The PCR reaction mix consists of 4 units of
Amplitaq Gold, lx
buffer II (Applied Biosystems, Foster City, CA), 1.5 mM MgC12, 0.4M betaine,
800 M dNTP
mix and 250 nM of primer. The following PCR conditions were used: 95 C for 10
min followed
by 50 cycles of 95 C for 30 sec, 50 C for 30 sec, and 72 C for 30 sec.
[0031] PCR products were purified using the protocols disclosed and claimed in
United
States published Patent No. 2005-0130196.
Example 3: Investigation of Detection Efficiency of Large Oligonucleotide Ions
[0032] In an attempt to optimize detection efficiency of large oligonucleotide
ions, and to
better understand the relationship between ion arrival statistics and mass
accuracy, a detailed
systematic study was designed to investigate detector response as a function
of molecular weight,
m/z, and charge state at the individual ion level.
[0033] In time of flight mass spectrometry ions are separated based on
differences in their
velocity as they traverse the flight tube. As ions strike the detector, their
arrival times are
recorded and subsequently converted to m/z based on the specific configuration
of the
spectrometer (length of flight path, accelerating voltage, geometry, etc.). It
is generally accepted
that for singly charged species, detector response is inversely proportional
to molecular weight
(velocity) and, for example in the case of MALDI, higher molecular weight
species induce a
smaller detection signal than lower molecular weight species. It was suspected
that lower charge
states (i.e, lower velocity species) induce a smaller signal than do the
higher charge states (i.e.
high velocity species) under the same accelerating voltages. The reduced
response of high
molecular weight "slow" ions can be partially ameliorated by the use of post-
acceleration
CA 02567839 2006-11-22
WO 2005/117270 PCT/US2005/018337
-9-
methods in which ions are accelerated to very high kinetic energies
immediately prior to
detection.
[0034] During the course of this investigation, it became immediately apparent
that ions of
the same nominal m/z but different molecular weights induced significantly
different detector
responses. The heavier, more highly charged ions consistently produced
detector responses
several times that of their singly charged counterparts at the same m/z. Thus,
while in the TOF
mass analyzer ions of the same m/z have the same velocity, ions of different
molecular weigh do
not have the same momentum or kinetic energy and do not induce the same signal
on the
detector.
[0035] This phenomenon is readily illustrated by examining spectral response
as a function of
the digital threshold employed to acquire mass spectra of species covering a
range of molecular
weights.
[0036] Unlike MALDI of large biomolecules, the multiple charging phenomenon
inherent to
the ESI process generally produces mass spectra in which the majority of the
signals are in the
same m/z range. Molecular ions from moderate to large biomolecules (1 kDa to
100 kDa) are
generally detected in the 500 - 2000 m/z range and it is thus not at all
uncommon for complex
mixtures to yield spectra in which peaks of many different masses are detected
at the same m/z.
To characterize detector response as a function of molecular weight (charge),
solutions
containing analytes with molecular weight ratios of 1.0, 3.7, 11.8, 21.5, and
43 were analyzed at
a range of digital thresholds. For each series, a single charge at or near m/z
1233 was used to
gauge the detector response. The resulting molecular weight isopleths are
plotted in Figure 1.
Importantly, at low digital signal thresholds set according to Example 4 (vide
infra), the singly
charged PPG ions drop in intensity at significantly lower cutoff voltages than
do the higher
molecular weight (charge) species. For example, at a digital signal threshold
cutoff voltage of 9
mV, the signal of the PPG ions at m/z 1233 is attenuated to non-detectable
levels while the 43
kDa PCR product at m/z 1233 is still detected at approximately 90% of the
initial response.
There is a definite trend in cutoff voltages as a function of molecular weight
(charge state)
suggesting that one can select a digital signal threshold to selectively
detect (or not detect)
species of interest.
CA 02567839 2006-11-22
WO 2005/117270 PCT/US2005/018337
-10-
Example 4: Digital Signal Threshold Rationale
[0037] Under the acquisition conditions routinely employed to characterize PCR
products,
individual scans are acquired and co-added at a rate of 75 kHz. Thus for a
typical 45 second
acquisition, each spectrum is comprised of 660,000 co-added individual scans.
In order to
reduce the shot/white noise in the co-added spectrum, the MicroTOF electronics
allow one to set
a digital filter threshold (voltage cutoff) such that white noise from the
detector at the single or
low-bit ADC count is zeroed out of each scan and only detector responses
consistent with ion
detection events are passed to the transient summing digitizer data system to
be co-added. This
concept is shown schematically in Figure 2. Figure 2a depicts the raw ADC
output from a
theoretical single scan in which a singly charged ion (ionl) strikes the
detector at T1 and a large
multiply charged ion (ion2) which strikes the detector at time T2. During the
time intervals in
which neither ionl nor ion2 are striking the detector the ADC is picking up
and digitizing
detector noise generally corresponding to 1-5 bits. Because of the fast
acquisition rate of the
TOF and the finite ion capacity of the source, each scan is typically
comprised of relatively few
ion detection events and for any given ion channel, it is very unlikely that
an ion will be detected
in each scan. Thus, co-adding large numbers of unfiltered scans such as those
depicted in Figure
2d would result in a noise floor that increases linearly with the number of
scans and a mass
spectrum in which the ultimate dynamic range would be limited by the
relatively high electronic
noise floor.
[0038] To minimize the deleterious effects of co-adding low-bit detector
noise, the MicroTOF
electronics allow the user to set a cutoff voltage that has the net effect of
zeroing-out low level
signals that are attributed only to detector noise. As illustrated in Figure
2c, this approach,
ideally, does not affect the ADC counts for signals consistent with a singly
charged ion but
digitally filters each scan prior to co-adding, such that detector white noise
is not co-added with
the same efficiency as detector ion response. As illustrated in Figure 2b,
this concept can be
taken a step further by setting the digital filter threshold such that ADC
counts derived from
detector noise and singly charged ions striking the detector are zeroed out
prior to co-adding.
Thus, with the digital threshold set at the level depicted in Figure 2b, a
singly charged ion
striking the detector is "invisible" in the post-filtered ADC output and the
net result is a "high
pass" molecular weight (charge) filter in which low molecular weight (charge)
species are not
detected but high molecular weight (charge) species, which tend to be multiply-
charged are still
detected.
CA 02567839 2006-11-22
WO 2005/117270 - PCT/US2005/018337
-11-
Example 5: Chemical Noise Removal by High Pass Digital Threshold Filtering
[0039] A key challenge in the analysis of large biopolymers by ESI-MS is
sample purification.
Low molecular weight contaminants in biopolymer solutions can have deleterious
effects on the
quality of ESI-MS spectra and can significantly limit the dynamic range and
accuracy of the
measurement. In some cases these low molecular weight "contaminants" are
actually required
additives as components of an on-line separations. Such additives include
ampholytes used in
capillary isoelectric focusing, phosphates commonly used as components of
buffers used in
capillary zone electrophoresis, and solution matrix modifiers used to promote
micelle formation
in micellar electrokinetic chromatography. Similarly, electrospray
incompatible additives such
as glycerol and polymers (polyethelene glycol, PPG) are often used to
stabilize enzymes to be
used in biochemical processes. These compounds often make their way through an
entire
biochemical process and end up in the mass spectrometer. A key example of the
latter type of
"contaminant" is the presence of high levels of polyethelene glycol and
polypropylene glycol
polymers in the Taq polymerase used for PCR. While typically only 1-2 L of
Taq are used in
each 50 L PCR reaction, the relatively high concentration of polymer in the
presence of the
relatively low concentration of PCR products (typically 10 - 100 nM), coupled
with the fact that
such polymers are ionized with high efficiency, may cause a significant
chemical noise
suppression issue.
[0040] Figure 3a illustrates an example of an ESI-TOF spectrum of a 140-mer
PCR product
into which a contaminating amount of PPG was spiked along with relatively high
levels of singly
charged peptides (which serve as internal mass standards). The signal from the
charge state
envelope of the multiply charged strands of the PCR amplicons is confounded by
the presence of
the intense signal arising from the low molecular weight species. This
spectrum was acquired
using a "normal" digital threshold setting in which the detector white noise
output from the
digitizer is filtered out but the threshold is set low enough to ensure that
signals from singly
charged ions are captured. This spectrum is exemplary of a common situation in
which a large
biopolymer is analyzed in the presence of a significant chemical noise
background arising from
low molecular weight contaminants. As shown, such interferences can adversely
affect the mass
accuracy of the measurement and result in reduced spectral dynamic range.
[0041] In contrast, the ESI-TOF spectrum in Figure 3b was acquired on the same
spectrometer from the identical solution using the identical ESI source
parameters and
acquisitions conditions with the important exception that the spectrum in
Figure 3b was acquired
CA 02567839 2006-11-22
WO 2005/117270 PCT/US2005/018337
-12-
at a cutoff voltage of 15 mV while the spectrum in 3a was acquired moments
earlier at a cutoff
voltage of 3 mV. It is clear from these spectra, and the data presented in
Figure 2 that the 15 mV
cutoff setting precludes the detection of the singly charged species in the
solution yet facilitates
the detection of the larger, more highly charged PCR amplicons. It is evident
from the spectra in
Figure 3 and the cutoff profiles in Figure 2 that the intensity of the
amplicon peaks are reduced
by about 30%; importantly the peaks from the singly charged polymer and
calibrants are not
present in the spectrum acquired at the higher cutoff voltage and the spectrum
in Figure 3b has
significantly improved signal-to-chemical noise characteristics. It is
worthwhile to emphasize
that, no other instrument, solution, or data processing parameters were
changed between
collecting the spectra in Figures 3a and 3b, the only difference was the
digital signal threshold
setting.
[0042] Indicating the applicability of the method for biomolecules other than
nucleic acids,
Figure 8 shows mass spectra of carbonic anhydrase in the presence of 0.001%
SDS and 25 mM
Piperidine/Imidizole buffer. The protein-derived signals of the spectrum
obtained with a 1 mV
digital signal threshold setting are subject to considerable interference from
the detergent and
buffer components. In contrast, Figure 8b indicates that the interfering
components are rendered
"invisible" by specifying a digital threshold setting of 11 mV.
[0043] These data indicate that in some high throughput screening and QC
applications a less
rigorous sample purification protocol might be employed and chemical noise can
be removed via
the digital filtering approach described above. Importantly, this approach
allows ESI-MS
analysis of large biomolecules (or noncovalent complexes) from solutions which
might
otherwise contain too much chemical noise to produce interpretable spectra.
Example 6: Dynamic Range Enhancement by Digital Threshold Filtering
[0044] By reducing or eliminating the chemical noise floor in addition to
reducing the
electronic noise floor, significant improvements in dynamic range and spectral
quality are
attainable. This concept is demonstrated in Figures 4 and 5. Shown in Figure 4
is an expanded
region of the ESI-TOF spectra from Figure 3 in which the relatively low
abundance high charge
states of the PCR amplicon are detected. Note that the signals from the (M-
43H+)43 (M_
42H+)42-, and (M-41H+)41" charge states are barely visible in the unfiltered
spectrum (Figure 4a)
but clearly visible in the filtered spectrum (Figure 4b). The effective signal
to noise of the
spectrum in Figure 4a is defined by the signal to chemical noise ratio, while
the effective signal
CA 02567839 2006-11-22
WO 2005/117270 PCT/US2005/018337
-13-
to noise of the spectrum in Figure 4b is defined by the signal to electronic
noise ratio. For
example, for the (M-41H+)41- charge state of the amplicon the signal to
(chemical) noise in the
spectrum acquired at the low cutoff threshold is approximately 2 while the
signal to (electronic)
noise of the spectrum acquired at the higher cutoff threshold is approximately
12. Additionally,
signals from charge states (M-40H+)40- and (M-39H+)39" are not readily
discernable from the
chemical noise in Figure 4a but clearly visible in Figure 4b.
[0045] The improvement in effective dynamic range afforded by the present
invention is
further illustrated in Figure 5 in which a solution containing approximately
0.5 nM PCR product
in the presence of 500 nM PPG was characterized at high and low threshold
settings. At the
normal threshold setting the spectrum is dominated by highly abundant singly
charged polymer
ions and the very low level PCR products are not observed. As shown in the
inset, the top
spectrum is also inundated with other chemical noise components and the peak-
at-every-mass
background precludes the detection of the low level PCR products. When the
digital signal
threshold is set such that signals from singly charged species are not
detected, a distinct signature
for the low level amplicon is detected. This attribute has the potential to
significantly improve
the detection of low concentration biomolecules in solution as it is
frequently the presence of low
level, ubiquitous, contaminants introduced from buffer impurities,
plasticware, and sample
handling that define the chemical noise floor of the mass spectra and limit
the applicability of
ESI-MS to complex biological systems.
[0046] In addition to reducing the useful dynamic range of a mass spectrum,
chemical noise
and low molecular weight contaminants can have adverse affects on accurate
mass
measurements. As described above, ESI-MS spectra often have overlapping peaks
that result
from species of different molecular weights but the same m/z. This is
particularly problematic
for large biopolymer ions which generally produce somewhat congested spectra
in which
multiple charge states are observed in the 500 to 2000 m/z range. Because low
molecular weight
species are isotopically resolved and species above about 10 kDa are generally
not, it is quite
common to see a low molecular weight contaminant peak overlap with and distort
an otherwise
analytically useful analyte peak. An example of this is shown in Figure 6 in
which the signal
from the (M-3H+)3" charge state of a 12-mer oligonucleotide is observed at the
same m/z as the
(M-35H+)35" charge state of a much larger 140-mer PCR product. In this case
the smaller
oligonucleotide is intended to serve as an internal mass standard but, as is
illustrated in Figure 6
and in the mass accuracy data in Table 1, the co-location of these signals is
deleterious to both
CA 02567839 2006-11-22
WO 2005/117270 PCT/US2005/018337
-14-
signals. First, at the 7 mV threshold it is not immediately apparent that
there are two species at
m/z 1233 as peaks from the isotopically resolved 12-mer mask the presence of
the larger
unresolved amplicon peak. Additionally, the presence of the unresolved
amplicon peak distorts
the peak shapes and centroids of the isotopically resolved 12-mer peaks such
that the mass
accuracy is compromised. When the digital threshold is set to 11 mV, the
contribution to the
peak from the triply charged 12-mer is substantially reduced and the presence
of a high
molecular weight unresolved peak is apparent. Importantly, because the
aggregate signal (i.e.
12-mer and 140-mer) is captured at the 7 mV digital threshold level, and the
contribution to the
signal from the 140-mer can be measured at a higher digital threshold level
(11 mV in this
example), the signal from the 12-mer can be derived by subtracting the
spectrum acquired at 11
mV from the spectrum acquired at 7 mV. The resulting spectrum exhibits a
notably improved
distribution (containing 5 peaks) and, perhaps more importantly, the
centroided peaks yield a
reduced mass measurement error across the distribution. In this example, the
average mass
measurement error for the five peaks was reduced from 5.9 to 1.5 ppm following
the spectral
subtraction.
Table 1: Calculated Error in m/z Measurements for 7 mV Digital Signal
Threshold vs. (7
mV) - (11 mV) Digital Signal Thresholds
Digital Signal Peak Theoretical Measured Error (ppm)
Threshold (mV) Number (m/z) (m/z)
7 1 1232.5408 1232.5596 -15.2512
7-11 1 1232.5408 1232.5449 -3.3246
7 2 1232.8752 1232.8809 -4.6266
7-11 2 1232.8752 1232.8753 -0.0844
7 3 1233.2095 1233.2005 7.2811
7-11 3 1233.2095 1233.2071 1.9292
7 4 1233.5437 1233.5452 -1.1898
7-11 4 1233.5437 1233.5428 0.7558
7 5 1233.8780 1233.8764 1.2781
7-11 5 1233.8780 1233.8799 -1.5585
[0047] In Table 1, 7-11 indicates that a spectrum obtained with a digital
signal threshold
setting of 11 mV was subtracted from a spectrum obtained with a digital signal
threshold setting
of 7 mV.
Example 7: Spectral Subtraction and Ion Partitioning: Obtaining "Slices of
Ions"
[0048] In accordance with the present invention, the experiments illustrated
in Figures 3-5
illustrate that the digital thresholding method described above allows for the
detection of large
multiple charged biomolecular ions in such a manner so as to render low
molecular weight
CA 02567839 2006-11-22
WO 2005/117270 PCT/US2005/018337
-15-
species "invisible" (based on digital thresholding) while the data presented
in Figure 6 illustrates
a method by which low molecular weight species can be analyzed in such a
manner so as to
make large multiple charged biomolecular ions "invisible" (by digital
thresholding and spectral
subtraction). The results from the relatively simple subtraction described in
Example 6 lay the
foundation for more sophisticated digital thresholding schemes in which
multiple "slices" of a
complex ion population can be analyzed simultaneously with the effective
result being a
multidimensional detection configuration in which ions are simultaneously
measured.
[0049] In this work all of the high threshold/low threshold comparisons were
made by
multiple measurements of the same analyte solution acquired under identical
instrument
conditions except the digital threshold was varied. This was done out of
necessity because, as
illustrated in Figure 7a, the basic system architecture of the Bruker MicroTOF
consists of a
single data stream from the detector to the digitizer for which a single
threshold level is applied
to the data stream prior to co-adding of scans. As sample throughput is a key
driver in many
laboratories, requiring each sample to be analyzed two (or more) times at
different digital
thresholds may not be feasible.
[0050] In accordance with the present invention and as a means of
circumventing this
problem, the alternative digitization scheme illustrated in Figure 7b
indicates that output from
the ADC can be split to multiple parallel data streams, each of which is
subjected to a different
digital threshold. By subtracting spectra acquired at different digital
thresholds, one could obtain
a mass spectrum for any "slice" of the ion population. This would allow one to
perform digital
thresholding on a very complex mass spectrum and evaluate a range of molecular
weights
(charges) independent of other, potentially interfering, ion populations such
as for example, a
restriction digest of a nucleic acid or a protease digest of a protein.
Another example could be a
biomolecule such as a nucleic acid or a protein having a non-convalently-bound
small molecule.
[0051] Having multiple variably-thresholded mass spectra derived from the
identical
digitization event would guarantee perfect subtraction of spectral features
and would eliminate
potential artifacts which may arise from spectral drift over the course of
acquiring multiple
spectra. Importantly, this also means that one could introduce low molecular
weight internal
mass standards (calibrants) to very accurately calibrate the m/z axis (e.g.
the PPG series in
Figure 3a) but derive accurate mass measurements of biomolecular analytes from
peaks that are
CA 02567839 2009-08-05
-16-
never "stepped on" by low molecular weight species (e.g. the digitally
thresholded spectrum in
Figure 3b).
[0052] Various modifications of the invention, in addition to those described
herein, will be
apparent to those skilled in the art from the foregoing description. Such
modifications are also
intended to fall within the scope of the appended claims.