Note: Descriptions are shown in the official language in which they were submitted.
CA 02571084 2006-12-14
WO 2006/001868 PCT/US2005/011045
PHASE RESPONSIVE OPTICAL FIBER SENSOR
Background of the Invention
1. Field of the Invention
[0001] The invention concerns techniques for detecting and accurately
determining the location of a physical disturbance. Input signals are coupled
in two opposite directions along a waveguide, through multiple signal paths,
at
least one such path traversing a detection zone. The waveguide, for
example, can consist of one or more optical fibers. Multiple signal paths can
be provided by distinct signals traveling in different fibers, and/or multiple
signal paths can be provided using different modes of signal propagation in
one or more of the same fibers.
[0002] In exemplary applications of the inventive techniques, optical fibers
are routed around a security perimeter, along or across a road or path,
coextensively with a power or signal transmission line, on or near a pipeline,
etc. A disturbance such as sound or vibration from nearby activity changes
the propagation conditions of the light signals carried in the multiple signal
paths, simultaneously locally affecting the signal paths in both opposite
directions. A phase relationship change occurs for the signals carried along
the multiple signal paths in each of the two opposite directions. The change
is
carried along in the signals propagating away from the point of the
disturbance in both directions. The propagation time difference, between
appearances of the corresponding changes in the phase relationship at each
end, is determined and used to resolve the location.
(0003] According to an inventive aspect, the disturbance is detected and
located from a time variation in phase relationship between the signals
carried
along different signal paths and for each of the counter-propagating signal
directions. A phase responsive receiver is used to obtain the phase
relationship between signals on different signal paths. The phase responsive
receiver comprises at least one beam combiner and at least two detectors to
mix and to detect the signals from at least two signal paths, respectively.
[0004] Preferably, the beam combiner, such as a bidirectional coupler,
functions as a beam splitter for producing multiple input signals paths in one
-1-
CA 02571084 2006-12-14
WO 2006/001868 PCT/US2005/011045
direction and also forms an optical interference node at the receiving end for
the signals propagating in the opposite direction. The arrangement can be
symmetrical, with couplers at each of the ends splitting signals into multiple
paths directed toward the opposite ends, while receiving and interfering the
signals from the opposite end. Through the beam combiner, the received-
and-interfered signals produce at least two phase-related intensity responses
for each of the phase responsive receivers. The two intensity responses
provide independent phase-related variable values when applied to detectors.
These values can be used to obtain the phase relationship between signals
carried along different signal paths. Two phase relationship signals are
obtained, preferably as successions of data samples representing phase
versus time, for the signals in each of the opposite directions, as affected
by
the disturbance.
[0005] The beam combiner can be a three-by-three fused fiber coupler, or
an n-by-m coupler, a two-by-two coupler with polarization dependent
elements, or multiple cascaded couplers. The light levels at the detectors are
sampled and processed by techniques involving at least two independent
phase-related variables, modeled and preferably normalized and reoriented
using multi-dimensional data analysis techniques as described herein. The
techniques discriminate for disturbance-induced variations in phase
relationship, as a function of time, for each of the counter-propagating
directions. A correlation function then matches the corresponding variations
of
phase versus time for the opposite directions, deriving a differential
propagation delay. The differential delay enables accurate resolution of the
location of the physical disturbance.
2. Prior Art
[0006] A security system should detect and provide information about any
intrusion into a protected area or facility. An advantageous system should
discreetly detect even modest physical disturbances, and report the location
of the disturbance so as to permit corrective action to ensue promptly.
[0007] One technique for locating a disturbance is by determining the
difference in timing between the arrivals of effects of the disturbance, in
two
-2-
CA 02571084 2006-12-14
WO 2006/001868 PCT/US2005/011045
counter-propagating signals that are both affected by the disturbance. A
relative delay in arrival of the disturbance induced effects in the signal
propagating in one direction versus the other direction indicates a longer
propagation distance from the disturbance to the receiver, where the signal is
detected. Measuring the delay can permit one to calculate an apparent
location of the disturbance. This technique is described for example, in
British
Patent GB 1,497,995 - Ramsay, entitled "Fiber Optic Acoustic Monitoring
Arrangement."
Optical fiber has inherent advantages as a waveguide, such as low
loss, immunity to electromagnetic noise and other characteristics, which are
useful in remote sensing. The measurement of the disturbance effects in
Ramsay utilizes an interferometer or interference sensor. An example of an
interference sensor is the Mach-Zehnder interferometer, which has been
applied to acoustic sensing, magnetic sensing, temperature sensing, pressure
sensing, structure monitoring, etc, including using optical fibers, as
described
in "Overview of Mach-Zehnder Sensor Technology and Applications" by
Anthony Dandridge and Alan D. Kersey, Fiber Optic and Laser Sensors VI,
Proc. SPIE Vol. 985, pp. 34-52 (1988).
[0009] In addition to GB 1,497,995 - Ramsay, cited above, the publication
"Fiber Optic Distributed Sensor in Mach-Zehnder Interferometer
Configuration" by Bogdan Kizlik, TCSET'2002 Lviv-Slavsko, Ukraine,
proposes a similar location resolving technique. Recent US Patents 6,621,947
and 6,778,717 describe a perimeter defense system also based on this
principle.
[0010] These prior art teachings produce an interference intensity signal
versus time for each of two opposite signal paths, and seek to determine the
location of the disturbance from the difference in propagation time over two
counter-propagating signal paths, between the appearances of corresponding
time variations at receiving ends for the opposite signal paths. There are
problems, however, when attempting to use optical fiber waveguides and the
like for location detection in this way. Polarization induced effects can
reduce
or defeat the usefulness of these prior techniques for discerning the location
of the disturbance.
-3-
CA 02571084 2006-12-14
WO 2006/001868 PCT/US2005/011045
[0011] Light waves interfere only when there is some correspondence in
the state of polarization, permitting the beams to interfere. Two light waves
that are orthogonally polarized cannot interfere. Over plural paths between a
light source and two or more detectors, the birefringence of the fibers
forming
an optical path can change the state of polarization and phase characteristics
of the light beams. The birefringence of an optical fiber may be small
compared to its refractive index. Nevertheless, an accumulated polarization
effect arises, particularly over a long distance. Prior art systems cannot
perform consistently, and in some circumstances do not perform at all,
because the interfering optical beams vary from time to time between more or
less parallel and more or less orthogonal states.
[0012] Variable beam interference conditions caused by polarization state
changes are recognized as a problem in single light path interferometers, the
problem being known as polarization-induced fading. The problem is
described, for example, in "Polarization-Induced Fading in Fiber-Optic Sensor
Arrays" (Moshe Tur, Yuval S. Bogey, and H. J. Shaw, Journal of Lightwave
Technology, Vol. 13, No. 7, p1269, 1995). This publication seeks to enhance
the visibility of the interference beam in a single-channel fiber based
interferometer, where the light travels along a single direction.
[0013] Polarization induced phase shift, which is caused by the mismatch
of the polarization of the interfering beams, is a somewhat different effect
from
polarization induced fading, but causes measurement problems, because
polarization induced phase shift can be difficult to distinguish from other
factors. If there is a polarization induced phase shift, the interference
intensity
signals at the detectors for the two counter propagating signals may not
correlate closely. The technique of calculating a location for the disturbance
relies on identifying two corresponding variations in amplitude over time, and
then measuring the difference in time of arrival between the two counter-
propagating signals. Such a measurement is difficult and potentially
inaccurate, if variations in the two signals cannot be properly matched.
[0014] In the prior art interferometer system, signal phase conditions are
varied by the disturbance to produce variations in interference amplitude. But
the swing in the interference output signal is not exclusively or linearly
related
-4-
CA 02571084 2006-12-14
WO 2006/001868 PCT/US2005/011045
to the change in relative phase caused by the disturbance. The interference
amplitude is affected by changes in polarization states which generally are
different for the two signal directions because of differences in the
polarization
effects in the two counter propagating directions. The interference amplitude
is not uniquely related to the relative phase relationship between interfering
beam along different paths. For these reasons, a disturbance locating
security system as in G~ 1,497,995 - Ramsay may be undependable or may
need regular polarization adjustment. Measurement failure from polarization
induced effects is an imminent danger. The correlation of time varying
interference signal signatures for a given disturbance for the two opposite
signal paths produces uncertain location measurements due to unpredictable
polarization effects. For all these reasons, the system dependability and
accuracy are less than might be desired for security purposes.
[0015] In terms of structure, the prior art technique for coupling signals
typically employs two-by-two optical couplers, such as fused fiber junctions,
for splitting and/or for combining light signals.
[0016 It would be advantageous for the location detection purposes
discussed, to enable an accurate determination of phase variations between
two received signals applied as two inputs to a coupler, and to do so free of
complications from polarization fading and phase shift. What is needed is
additional independent variable information whereby the two independent
output variables can be derived to permit the effects of phase to be
discriminated from the effects of polarization.
[0017] The present invention avoids detrimental effects of polarization
induced fading and phase shift. Conditions are established that provide a
robust response notwithstanding time changing polarization transformation
characteristics such as birefringence. In certain embodiments, these
conditions are established by providing coupler outputs that are characterized
by a phase difference, permitting an analysis with the benefit of at least two
and optionally additional independent variables by which phase effects are
discriminated from polarization effects. A multi-dimensional data analysis
technique is used, as illustrated by optional techniques in the disclosure,
demonstrating how independent variables are translated substantially
-5-
CA 02571084 2006-12-14
WO 2006/001868 PCT/US2005/011045
exclusively to phase angle as a function of time. The adverse effects caused
by polarization are reduced to signal to noise ratio effects and can be
readily
avoided. The invention is practical, dependable and effective in perimeter
security systems, as well as in other distributed sensing purposes.
Summary of the Invention
[0018] In one arrangement, a distributed location resolving sensor system
according to the invention comprises four major parts: a waveguide, a light
source, a phase responsive receiver, and a signal processor.
[0019] The waveguide includes at least two signal paths, which in different
configurations can be distinct signals traveling in different fibers,
different
modes of signal traveling in the same fiber, etc. The waveguide supports two
counter-propagating signal directions. The waveguide is arranged such that
at least one signal path in each direction is affected by a disturbance in the
detection zone. The effects of the disturbance include a phase variation
effect
that propagates in both directions beyond the disturbance and is sensed at a
phase responsive receiver for each of the counter-propagating signal
directions. The input signals producing the input or carrier signals for the
two
counter-propagating signal directions can be derived from different light
sources, or can be derived from the same light source by the use of one or
more beam splitters.
[0020] The phase responsive receiver is capable of determining the phase
relationship between the signals on different signal paths. The phase
responsive receiver has a beam combiner operative to combine different
signal paths, and at least two detectors. An important aspect of the phase
responsive receiver is that the phase responsive receiver can generate and
detect at least two independent variables that both concern phase-related
intensity responses. From these at least two variables, information can be
derived from which the phase relationship is resolved unambiguously.
[0021] The processor is coupled to sample data from the at least two
detectors of the phase responsive receiver, and for each of the opposite
directions. The two independent intensity responses can be processed
-6-
CA 02571084 2006-12-14
WO 2006/001868 PCT/US2005/011045
according to a novel multi-variable data analysis technique, usefully modeled
using corresponding multiple dimensions of a coordinate system, to obtain the
time varying phase relationship as explained in detail hereinafter.
[0022] In the event of a disturbance, a phase variation occurs due to
acoustic effects, vibration and the like in a detection zone. The disturbance
can be detected and the location can be obtained through correlation
techniques to match corresponding time variations in the phase relationships
between signals along different paths for each of two counter-propagating
signal directions, at different times. The differential delay is resolved to
identify a location in the detection zone, namely that location at which the
difference in propagation delay times for arrival of correlated phase
variations
at the phase responsive receivers for the two opposite directions is
attributable to a difference in propagation path lengths.
[0023 The perturbation in signal propagation from the disturbance occurs
in the phase relationship between the at least two signals carried on
different
paths propagating in each opposite direction. Thus at least one signal path in
each direction traverses the detection zone. In respective embodiments, one
or both paths in each opposite direction can traverse the detection zone to be
subjected to a disturbance that produces a time variation in phase
relationship
for each opposite direction, originating at the location of the disturbance.
By
using phase responsive receivers as described, and deriving two independent
phase related variables for each end, the inventive technique derives the
phase relationship for the signals carried on different paths in both opposite
directions, in a manner that is virtually free of confounding influences
arising
from the mismatch of the state of polarization of the signals carried on
different paths for respective light signals directions.
[0024] One example of the phase responsive receiver uses changing
polarization characteristics of the combined beam as a parameter that is
sensed and from which the phase relationships are determined and hence the
location of the disturbance is resolved. This is one example of an effect that
involves a time variation in phase relationship.
[0025] In an example that actually uses polarization, the mutually
orthogonal components of a light signal can be regarded as two beams and
-7-
CA 02571084 2006-12-14
WO 2006/001868 PCT/US2005/011045
the polarization state can be regarded as a measure of the phase relationship
between two beams, namely the orthogonal components that vary in phase
relationship to define different polarization states. Techniques are disclosed
herein for extracting the phase relationship between the members of the pair,
without complications resulting from the use of polarization state as a
variable
that is related to relative phase.
[0026] The change in polarization characteristics of the combined beam is
directly related to the change in phase relationship of the combining beams.
Polarization can be a confounding factor in interference intensity sensing
systems. However, the invention solves potential difficulty with polarization
induced signal fading and polarization induced phase shift by reliably
detecting phase relationships independent of polarization state.
[0027] In another example, the phase responsive receiver has couplers,
preferably arranged symmetrically with respect to the detection zone, each
coupler having two or more outputs and the detector responding to the
polarization attribute of the output light so as to derive the at least two
independent output signals from which two independent phase variable
values are available.
[0029] In yet another example, the phase responsive receiver has
couplers, preferably arranged symmetrically with respect to the detection
zone, each coupler having three or more outputs and the detector responding
to at least two of the outputs so as to derive the at least two independent
output signals from which two independent phase variable values are
available.
[0029] Another example of the phase responsive receiver employs two or
more cascaded 2x2 couplers. Although this example uses 2x2 couplers, the
cascading of the couplers produces the desired two independently-varying
intensities, both of which are related to phase, in a manner similar to
employing two of three outputs from a 3x3 coupler. Other coupler
arrangements also can be used to obtain two independent variable values
related to phase, from which the phase relationship of the two signals can be
computed or otherwise derived for each opposite signal path. Accordingly,
additional examples of phase responsive receiver embodiments operative as
_g_
CA 02571084 2006-12-14
WO 2006/001868 PCT/US2005/011045
described herein and within the scope of the invention will become apparent
to those skilled in the art in view of this disclosure.
[0030] An inventive aspect is the characteristic of the phase responsive
receiver to generate at least two independent variables values applied to two
detectors for each opposite signal direction. The two independent variables
have phase related intensity responses but are useful as demonstrated by
solutions to simultaneous equations, to produce a variable that is
proportional
to phase. An exemplary and nonlimiting technique to achieve this result,
which is exemplified by 3x3 couplers as well as by cascaded 2x2 couplers
and other similar arrangements, is to provide structures wherein the outputs
have inherent phase relationships, as described herein.
[0031] The invention bidirectionally uses a change in phase relationship
between two signals, instead of an intensity response from interfering two
signals, as the parameter sensed from a disturbance occurring in the
detection zone. Detecting and timing the difference between corresponding
variations in phase relationship can be accomplished more dependably than
attempting to make corresponding use of an interference signal, the amplitude
of which does not uniquely correspond to a phase angle, and in any event
consists of only a single variable value that may be adversely affected by
polarization effects.
[0032] A time variation in an interference intensity response (as in the prior
art) occurs when there is a change in the phase relationship between two
interfering input signals. The interference intensity response and the phase
relationship do not have a one to one correspondence. Thus even assuming
that a disturbance produces an identical time-change phase signature for
signals in both signal directions, variations in interference intensity
provided
by interfering signals for each direction cannot be expected to have the same
time-change amplitude signatures because of confounding polarization
issues. According to the inventive technique, on the other hand, an object is
to derive the time-change phase relationship per se, thus benefiting from
substantially identical temporal signatures in the operative parameter, namely
phase.
_g_
CA 02571084 2006-12-14
WO 2006/001868 PCT/US2005/011045
[0033] In the inventive technique described, the signal levels from which
phase relationships are derived contain polarization effects. In the inventive
technique, polarization variations affect an offset level between the two
phase
responses. As an offset, the effects are readily subtracted away in data
processing. A comparable polarization related effect in prior art interference
intensity measurements may produce different intensity responses for the
counter-propagating signal directions because of the nonlinear and non-
monotonic relationship between phase relationship and the intensity
response.
[0034 According to the inventive technique, the at least two independent
intensity responses are processed mathematically to produce the phase
relationship using multiple independent variable (multi-dimensional) data
analysis techniques. At least two independent variables are derived
respecting phase and together the variables permit the phase angle itself to
be derived. Polarization mismatch affects the phase relationship as an offset.
Even polarization state variation over time in many instances is a low
frequency effect compared to the time scale of most forms of disturbance to
be detected (e.g., acoustic noise), and can be treated much the same as a
steady state offset. The time signatures of the changing phase relationships
for the counter-propagating directions are substantially identical in shape by
this technique. The signatures correlate strongly between the two counter-
propagating directions.
[0035] Several exemplary configurations of the phase responsive receiver
are described herein, each useful in measuring a phase relationship by
deriving plural independent values that together permit a resolution of phase.
One technique is to measure the intensity response of different polarization
components. The signal paths can be combined using a polarization sensitive
combiner (e.g., a walk-off crystal), or a polarization insensitive combiner
(e.g.,
a fused fiber coupler). The two independent intensity signals can be two
polarization components from the same output port, and/or two polarization
components from different output ports.
[0036 Another example is to use a coupler with three or more output
ports, or cascaded multiple two-by-two couplers. For this purpose, the three-
-10-
CA 02571084 2006-12-14
WO 2006/001868 PCT/US2005/011045
way couplers can comprise fused fiber couplers dimensioned or similarly
configured so that although the sum of all three output intensities is
constant,
any two output intensities are independent from each other. The distribution
of
the power between the three output ports is determined by the phase
relationship of the two signals along two different paths. Differences in
phase
displacement through the coupler to the detectors and the independence of
said two of three coupler outputs, produces the information needed for
deriving the phase relationship between two signals coupled to two of the
three inputs of a 3x3 coupler, or both inputs of a cascaded 2x2 coupler.
[0037] The inventive technique can be applicable in test measurement
apparatus for making direct phase measurements. The inventive technique is
useful for sensing movement, acoustic noise, shock or vibration, variations in
pressure, and similar physical phenomena that may occur at distributed points
along a waveguide carrying two signals in one direction, and as applied to
counter-propagating directions allows the location of such phenomena to be
determined.
[0038] The "line" through the detection zone could be, without limitation, a
straight line, a sinuous arrangement, a full loop or partial perimeter, an
arbitrary pattern that passes successively through points of interest, a
member of an array such as a zigzag or raster pattern, etc. The waveguide
can be continuous or a succession of serial segments. The waveguide can
be a permanent or temporary installation, placed to establish a detection path
or to monitor an existing path such as a fence line, a road, a pipeline, a
power
or signal transmission line, a building perimeter or building component, a
succession of monitored portals such as windows or doors, etc. The path can
cross or run parallel to the path or to the expected movement of a person or
item to be detected. The occurrences produce detectable local changes in
physical properties in an optical waveguide, such as an optical fiber.
[0039 Short term changes in physical conditions (generally termed a
disturbance) of a character that produces a change in signal propagation
conditions, result in similar short term deflection in the phase relationship
of
the signals carried on different paths of the counter-propagating signal
directions. The short term nature of the conditions to be detected can permit
-11-
CA 02571084 2006-12-14
WO 2006/001868 PCT/US2005/011045
longer term changes and drift to be treated as offsets that can be
substantially
eliminated in a differential calculation relying on the time changing
signature
of a brief disturbance. Disturbances to be detected in a security system, for
example, are normally associated with physical events associated with
persons or animals or things (e.g., vehicles) moving and producing vibration
in
the vicinity of the waveguide carrying the counter-propagating pairs of
signals.
Only one path or multiple paths of each signal direction might be affected,
the
disturbance nevertheless producing a time variation of phase relationship
signature between two signals carried on different paths from which a phase
relationship signal is derived.
[0040] A number of alternative configurations are possible and several
examples are discussed in detail herein. These may advantageously include
or involve polarization sensitive or insensitive detection, tuning of the
input
signal wavelength, using one or more fibers or fiber transmission modes to
carry the beams, splitting beams from one or more coherent laser sources or
one or more other light sources, splitting and recombining beams using
various coupler configurations, such as 3x3 couplers, cascaded couplers, and
other variations.
[0041] Although the disclosed technology can be applied to various
applications including position sensing situations, this disclosure uses the
example of optical fiber based perimeter security as a non-limiting example of
a particularly effective use. Inasmuch as an optical waveguide is easily
placed to follow various paths, the same technique can be used to extend a
detection path between arbitrary zones, to provide a two or three dimensional
detection area, etc.
[0042] These and other objects will be made apparent by the following
discussion of exemplary embodiments and variations, from which further
variations within the scope of the claimed invention can be inferred.
Brief Description of the Drawings
[0043] Shown in the drawings are exemplary embodiments to illustrate the
invention as presently preferred. The invention is capable of these and other
embodiments, and it should be appreciated that the scope of the invention is
-12-
CA 02571084 2006-12-14
WO 2006/001868 PCT/US2005/011045
defined by the claims as opposed to this description of illustrative examples.
In the drawings,
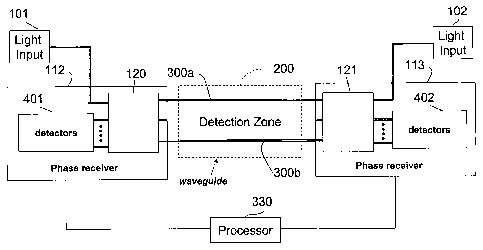
[0044] FIG 1 is a block diagram of a distributed fiber sensor according to
the invention.
[0045] FIG 2 is a block diagram of another arrangement of the distributed
fiber sensor, using polarization-based phase responsive receiver.
[0046] FIG 3 is a block diagram of another arrangement of the distributed
fiber sensor using polarization dependent phase responsive receiver, wherein
a single light source is used to generate the counter-propagating signals.
Polarization controllers are advantageously included.
[0047] FIG 4 is a block diagram of another arrangement of the distributed
fiber sensor using polarization dependent phase responsive receiver, where
the polarization receiver measures partial polarization information.
(0048] FIG 5 is a long timescale plot of typical interference intensity traces
comparing interference intensity variations for two counter-propagating
directions, demonstrating relatively low signal correlation.
[0049] FIG 6 is a time plot of typical Stokes parameter traces shown in the
Poincare sphere using a polarization insensitive beam combines for each
counter-propagating direction, demonstrating typically different polarization
parameter trajectories for the two directions.
[0050] FIG 7 is a time plot of typical phase traces calculated from the
Stokes parameter trajectories in FIG 6, for each propagating direction. One
trace is shown as a solid line, the other marked by open circles. These traces
demonstrate the high degree of correlation available according to the
inventive concept of discriminating specifically for phase.
(0051] FIG 8 shows a schematic interferometer, employing a free space
polarization sensitive beam combination device, using a polarizing beam
splitter.
[0052] FIG 9 shows an interferometer based on polarization sensitive
beam combination using a polarization beam displaces.
[0053] FIGS 10 and 11 compare two circular trajectories on a Poincare
Sphere demonstrating an output state of polarization (SOP) evolution when
combining orthogonal polarization components.
-13-
CA 02571084 2006-12-14
WO 2006/001868 PCT/US2005/011045
[0054] FIG 12 schematically compares two special situations when only
one beam is coupled into the detector.
[0055] FIG 13 schematically shows a switching configuration for phase
detection using polarization.
[0056] FIG 14 schematically shows polarization based phase
measurement including polarization controllers.
[0057] FIG 15 schematically illustrates a bidirectional polarization based
fiber distributed sensor.
[0058] FIG 16 shows a technique for detection of phase using two
polarization sensitive detectors and a polarization insensitive beam splitter.
[0059] FIG 17 illustrates use of a patterned liquid crystal cell as a
polarization controller.
[0060] FIG 13 is an example showing a two-beam polarization sensitive
beam combiner.
[0061] FIG 19 is an example showing a four-beam polarization sensitive
beam combiner.
[0062] FIG 20 is an example showing an n-beam polarization sensitive
beam combiner.
[0063] FIG 21 is a two dimensional plot wherein the X and Y coordinate
positions represent intensity values measured by sets of two polarization
sensitive detectors according to the invention, one set being plotted(or
otherwise encoded) for each propagating direction (Channels 1 and 2) and
showing a population of many paired data samples.
[0064] FIG 22 is a time plot comparing a plot of two intensities for the
same propagation direction versus time and the corresponding relative phase
difference versus time, calculated from the intensities. The intensity as
plotted
is bounded. The phase is unbounded.
[0065] FIG 23 is a pair of time plots comparing phase response signatures
for two counter-propagating beams and showing the extent of divergence of
such signatures over longer and shorter time scales.
[0066] FIGS 24(a) through 24(e) are sets of plotted channel intensity
traces as in FIG 21, together with time-phase plots, showing experimental
results of detected signal values in the absence of disturbance, for
-14-
CA 02571084 2006-12-14
WO 2006/001868 PCT/US2005/011045
polarization state trajectories having different circle sizes on a Poincare
Sphere, and demonstrating the effect of evolution of the trajectory to
progressively smaller diameters down to a spot.
[0067] FIG 25 is a comparative illustration of intensity plots as in FIG 21,
showing that the size of the circular trajectory is in part a function of
wavelength, the data being collected for a 1 km fiber system.
[0068] FIG 26 is a block diagram of another arrangement of the distributed
fiber sensor using a 3x3 fused fiber coupler.
[0069] FIG 27 is a block diagram of another arrangement of the distributed
fiber sensor using a 3x3 fused fiber coupler, with individual polarization
controllers for each of the counter-propagating signal directions.
[0070] FIG 28 is a block diagram of another arrangement of the distributed
fiber sensor using 3x3 fused fiber coupler, with a polarization controller
applied commonly for both of the counter-propagating signal directions.
[0071] FIG 29 is a time plot of the two intensities values measured by two
detectors for the same propagating direction.
[0072] FIG 30 is a time plot of the sum and difference of the two intensities
values measured by two detectors for the same propagating direction as
separately plotted in FIG 29.
[0073] FIG 31 is a comparison plot showing (a) an elliptical relation
between the sum and difference of the two intensities values from FIG 30, and
(b) a normalized and centered circular trajectory of the values, as used
according to the invention for relative phase calculations.
[0074] FIG 32 is a time plot showing typical drift of relative phase
calculated over a long time scale as labeled, for one of the counter-
propagating light signals.
[0075] FIG 33 (a-d) are sets of plotted elliptical relations between the sum
and difference of the two intensities values and the corresponding calculated
phase values for the two counter-propagating light signals.
[0076] FIG 34 contains overlaid plots for successive samples showing
changes in the plot that occur when polarization of the combining beam is
progressively changed.
-15-
CA 02571084 2006-12-14
WO 2006/001868 PCT/US2005/011045
[0077] FIG 35 shows experimental plot data for (a) an elliptical relation
between the sum and difference of the two intensities values measured by
sets of two detectors for each of the two propagating directions and (b) the
normalized circular trajectory for phase calculation. The relative angle of
each
plotted point from a reference angle around the center of the circle as an
origin is regarded as the instantaneous phase.
[0078] FIG 36 is a time plot of relative phase versus time, showing the data
from FIGS 35(a) and (b), showing the time difference over a short term
representing the signature of a disturbance. This plot shows the high
correlation of the phase-time signatures of the two counter-propagating
signals according to the inventive technique.
[0079] FIG 37 is a plot showing a time slice from FIG 36 over an expanded
time scale, showing that there is a readily measurable time lag between the
signatures of the disturbance in the counter-propagating signals. This time
lag is due to the difference in signal propagation time between the location
of
the disturbance and the respective detectors, and is used to determine the
location of the disturbance.
[0080] FIG 38 is a block diagram of another arrangement of the distributed
fiber sensor using multiple cascaded 2x2 fused fiber couplers.
[0081] FIG 39 is the time plot of the calculated phase produced to
demonstrate similar signature, in which a disturbance (a recorded sound) was
repeated.
Detailed Description
[0082] The invention provides a technique for collecting signals
representing the time variation of the phase relationship between the multiple
signals carried on different paths for counter-propagating light signals,
useful
for determining the location along a waveguide at which a detectable
occurrence has disturbed light propagation conditions locally. The
disturbance locally affects both counter-propagating optical signals
simultaneously. The disturbance is detected after the affected light beams
have propagated away from the disturbance to receivers at opposite ends of
-16-
CA 02571084 2006-12-14
WO 2006/001868 PCT/US2005/011045
the counter-propagating signal paths. Such propagation occurs along paths
of potentially different length, based on whether the disturbance occurs
closer
to one receiver or the other. The rate of signal propagation is known. The
difference in propagation distance results in a difference between the times
at
which the disturbance arrives at the receivers disposed along the paths of
different length.
[0083] Referring to FIG 1, the disclosed system contains four major parts:
the waveguide, the light source, the phase responsive receiver, and the
processor. The waveguide comprises at least two signal paths 300a and
300b, and supports counter-propagating signal directions. In this example,
preferably the counter-propagating signals share the same paths in both
directions. At least one beam for each counter-propagating optical channel
passes through the detection zone 200 in opposite directions. Thus at least
that one beam for each direction is affected by the disturbance, and a phase
variation occurs over time. Each direction has at least two signal paths, one
or both of which can pass through zone 200. The waveguide can have more
numerous paths as well, provided that there is a phase variation signature
produced. The light source can be separate light sources 101 and 102, or two
or more signals can be split from the same light source.
[0084] In order to work most effectively, it is necessary to obtain
substantially identical but time-shifted signatures of the disturbance signal
in
two counter-propagating signals, with high correlation so as to permit sure,
fast and accurate measurement of the lead/lag time (differential delay) in
receiving the signatures. This is accomplished according to the invention by
using a phase responsive receiver, 112 and 113, one disposed on each end
of the waveguide (at least functionally at each end if not also physically
placed
there). The detected signals are further processed to obtain the location of
the
disturbance. For this purpose, a processor preferably employs a multi-
dimensional data analysis technique using independent variable data derived
from the manner in which the signature signals are received and processed.
[0085] According to different aspects of the invention, the phase
responsive receiver can be accomplished in exemplary embodiments using
polarization sensitive intensity detection arrangements, optical couplers that
-17-
CA 02571084 2006-12-14
WO 2006/001868 PCT/US2005/011045
have three or more output ports, and/or cascaded multiple couplers. These
and similar techniques are used for determining the phase relationship of the
two (or more) signals in each counter-propagating direction.
[0086] The phase responsive receiver detects at least two independent but
phase related intensity responses for each counter-propagating signal
direction. The measured intensities are then processed and analyzed by the
processor using a multiple variable data analysis technique (illustrated
herein
as a multi-dimensional technique for plotting circular trajectories) to
resolve
the phase relationship between multiple signals along different paths.
[0087] The invention uses the time variation of phase relationship as
opposed to the time variation of intensity responses as in the prior art. The
prior art cited above typically uses interference intensities between two
paired
signals traversing a detection zone, or between a signal traversing a
detection
zone and a reference signal, as the parameters of disturbance detection and
location. By reliance instead on a phase variable, preferably derived
according to particular inventive techniques, the invention represents a
substantial improvement over known location-discerning techniques using
optical waveguides, as described in the cited prior art. For example, the
interference intensity technique described in GB 1,497,995 - Ramsay is
implemented by adjusting delays to match the shape of interference intensity
signals for two counter-propagating directions. Phase variation effects are
likely inherently to produce the same or similar phase variation signature
shape for counter-propagating directions. Intensity variations in opposite
directions are not likely to provide similar or easily correlated time
signatures,
due to the various polarization induced effects which are generally different
for
the two counter-propagating directions. Polarization typically affects phase
variation measurements by adding a constant offset, which is can be
subtracted away and removed, particularly in a differential data process.
[0088] According to one inventive aspect, the waveguide can be structured
in such a way that the extent of the polarization change caused by the
disturbance is substantially smaller than the corresponding phase relationship
change, as the beams in each direction are combined. On the time scale
applicable to acquiring data representing a typical disturbance, the
-18-
CA 02571084 2006-12-14
WO 2006/001868 PCT/US2005/011045
polarization states for each of the combining beams remain more or less
constant. On the other hand, the relative phase relationship changes to
produce a distinctive signature of changing phase versus time. The extent of
polarization mismatch changes, but over a long period of time. Difference in
polarization induced phase shift from time to time does not impose a problem
in the present invention, because the polarization induced contribution to
phase shift will not change the shape of time varying phase relationship
response.
[0089] One advantageous embodiment of the invention uses a 2x2 coupler
with at least two detectors that are configured to detect the intensity
response
of two polarization components for each of the two counter-propagating
directions of the waveguide. The coupler in that embodiment can be
polarization sensitive (e.g., a walk-off crystal) or polarization insensitive
(e.g.,
a fused fiber coupler). The two polarization components can be different
polarization components derived from the same output port of the coupler,
and/or two polarization components obtained one from each of the output
ports. A change in polarization properties produces a related change in the
phase relationship between the combining beams. The change in polarization
properties can be measured by the use of a polarimeter and/or other
polarization sensitive detection scheme, as one technique for sensing a
changing phase relationship produced by a disturbance in the detection zone.
[0090] Another advantageous embodiment of the invention uses one or
more couplers configured to provide three or more output ports. One example
of such a configuration comprises a fused fiber 3x3 coupler. Another example
is a series of cascaded couplers, such as two cascaded 2x2 couplers wherein
the outputs are selected from output ports of the cascaded couplers. Various
such arrangements are possible and will provide at least two independently
varying values that both are related to phase. At least two detectors for each
of the oppositely propagating signals are coupled to measure these at least
two independent but phase related intensity outputs from two output ports.
The detectors can be photodetectors whose outputs are repetitively sampled
and digitized.
-19-
CA 02571084 2006-12-14
WO 2006/001868 PCT/US2005/011045
[0091] Preferably, the 3x3 coupler is a fused fiber coupler characterized by
an equal intensity splitting ratio for the three ports. Any two of the
intensities
can be further processed to reveal the phase relationship of the two beams
along different paths before interference.
[0092] In the following, both embodiments are discussed in detail for
illustration purposes. It should be understood that other embodiments will be
apparent to those skilled in the art and are encompassed according to the
appended claims.
Example: Phase Detection Based on Polarization Sensitive Detection
[0093] In this example of certain representative embodiments, methods
and apparatus are provided to manage, and moreover to exploit, variations in
polarization aspects of two counter-propagating light signals, in discerning
the
location along an extended waveguide at which a detectable occurrence has
locally disturbed light propagation conditions. According to an aspect of the
invention, a polarization-based exemplary system is provided that uses
polarization effects in the counter-propagating optical signals, as the
operative
parameter detected and employed to calculate the location of the disturbance.
The inventive system is constructed so that the two counter-propagating
polarization signals are processed to obtain an intrinsically matched temporal
variation of the signal, which is significantly different from an intensity-
only
system that might otherwise behave similarly, but only iri the special case
where it is assured that the relative polarization relationships of the two
interfering beams, prior to interfering, are substantially identical for the
two
counter-propagating directions.
(0094] The output state of polarization of interfered beams is a parameter
that is related to the phase difference between these two beams. According
to an aspect of the invention, this effect is used to discern and to locate a
phase disturbing event in a counter-propagating configuration, without
difficulties caused by polarization related fading and polarization-induced
phase shift.
-20-
CA 02571084 2006-12-14
WO 2006/001868 PCT/US2005/011045
[0095] Referring specifically to FIG 2, a block diagram shows an inventive
polarization-based distributed sensing system, wherein an object is to
determine the location of a physical event causing a disturbance at some
point along an optical fiber waveguide passing through a detection zone 200.
Light sources 101 and 102 can be derived from different sources or from the
same light source using a power splitter. The signal from the respective
source 101 or 102 in each case is separated by a phase receiver 114 and
115, which includes beam splitter/combiner 120, 121 and polarization
sensitive sensors 403, 404. Each phase receiver 114 and 115 is a polarization
sensitive measurement unit, which comprises at least one beam
splitter/combiner and at least two polarization sensitive sensors. The beam
splitter (120, 121 ) can be a polarization sensitive component or a
polarization
insensitive component. The beams are recombined by beam combiners 121,
120, respectively. In this arrangement, the same beam splitter/combiners 120
and 121 work in one direction leading toward associated receivers to join the
multiple incoming beams, and work in a second or opposite direction to
separate one beam from the respective source 101 or 102 into multiple
beams that propagate through the detection zone toward the receiver at the
other end.
[0096] In the receiving (combining) direction, the optical signals from the
combined optical channels are detected by polarization sensitive sensors 403,
404 functioning as the phase receivers. The receivers extract at least some
information with respect to the state of polarization of the combined beams.
The polarization receivers are coupled to a data processing unit 330, which
determines the time difference between the first and second emergences of a
corresponding change in the state of polarization, for the beams in the
respective counter-propagating directions. This time difference can be used
to determine the location of the disturbance along the length of the detection
zone. In the case of a disturbance due to a physical intrusion, for example,
the location of the intrusion can be determined and reported by a variety of
means including but not limited to a display, Internet protocols, cell phones
etc.
-21 -
CA 02571084 2006-12-14
WO 2006/001868 PCT/US2005/011045
[0097] FIG 3 is a block diagram showing another exemplary arrangement
of a polarization based remote fiber distributed sensing system embodiment
according to the invention. In this arrangement, the light signals for the two
counter-propagating directions or channels can be derived from the same light
source 100. Throughout the drawings, the same reference numbers and
labels have been used where possible to identify the same or functionally
similar elements. Therefore, the description shall rely where possible on the
previous descriptions of the same functional blocks instead of describing them
anew in each figure or instance.
[0098 The embodiment of FIG 2 has a plurality of polarization controllers
130, 131, placed so as to advantageously control the optical signals from the
laser source 100 into the light splitter/combiners 120, 121 and as emerging
from the splitter/combiners 121, 120 (operating oppositely splitters and as
combiners) into the respective polarization sensors 403, 404. Alternative
specific arrangements for polarization controllers also exist and can be used,
the alternatives being apparent to persons skilled in the art.
[0099 According to an inventive aspect, the phase relationship between
the combining beams along different paths is determined by measuring the
change in polarization properties of the combined beam. A change in the
phase difference between the two beams in the detection zone causes the
output polarization properties of the combined beam to change.
[00100 A disturbance in the detection zone produces a change in
polarization properties for the two beams in both counter-propagating
directions. However, the changing polarization states of the beams typically
are not equal for both directions. The change in polarization properties for
the
combined beams thus is not a matter of, the same beam states occurring in
both directions, changing in the same way, and producing the same changing
output polarization state. An aspect of the invention is to detect and to
correlate changes in both beam directions that are accountable to the same
disturbance, specifically to respond to phase variations that occur in both
signals, but to do so without adverse polarization effects and in a manner
that
discriminates specifically for corresponding changes in phase.
_22_
CA 02571084 2006-12-14
WO 2006/001868 PCT/US2005/011045
[00101] Polarization state changes can be characterized as changes in the
values of Stokes parameters that can define a unique polarization state.
Stokes parameters are defined as a set of four numbers: S0, S1, S2 and S3.
SO is defined as the total intensity. S1, S2 and S3 encode the respective
intensity differences between orthogonal states of polarization in three ways,
namely: 0° and 90° linearly polarized states; +45° and -
45° linearly polarized
states; and right-handed and left-handed circularly polarized states,
respectively.
[00102] In order to characterize the state of polarization of light in a
manner
that is intensity independent, the Stokes Parameters are often normalized
such that the SO=1. This is accomplished by dividing all four Stokes
parameters by S0. The intensity dependent Stokes Parameters is usually ,
referred as the un-normalized Stokes Parameters (or intensity dependent
Stokes Parameters), which is the preferred way of representing the
polarization in the present embodiment of the invention. In the following
discussion, Stokes parameters should be assumed to refer to the un-
normalized (or intensity dependent) version Stokes parameters. Where
reference is to be made to Stokes parameters that are normalized, the context
will refer to normalized Stokes parameters.
[00103] In one embodiment of the invention, the beam combiners 120 and
121 combine the incoming beams in a polarization insensitive way. A change
in the phase difference between the two beams in the detection zone causes
the output polarization properties of the combined beam to change. When the
two beams are orthogonally polarized, a phase change between the two
beams causes the intensity dependent Stokes vector to trace a circular arc as
plotted (or otherwise encoded) on the Poincare Sphere (a three dimensional
plot of the Stokes parameter values). When the two combining beams are
parallel polarized, a phase change between the two beams causes the
intensity dependent Stokes vector to trace a line. When the two detection
beams are arbitrarily polarized (e.g., somewhat parallel and somewhat
orthogonal), a phase change between the two beams causes the intensity
dependent Stokes vector to trace an ellipse.
-23-
CA 02571084 2006-12-14
WO 2006/001868 PCT/US2005/011045
[00104] According to an inventive aspect, the phase relationship between
the two beams, even of arbitrary polarization, can be determined by analyzing
the elliptical trajectory. For example the plotted (or otherwise encoded)
values on the ellipse trajectory are projected or replotted (or otherwise
encoded) as a circle. An angular difference can be determined between any
plotted (or otherwise encoded) points representing states of polarization. The
phase difference between the two beams can be obtained from that angular
difference, except that there is a constant offset having a value dependent on
the polarization mismatch between the two beams. The data can be
processed, for example, to monitor for change in phase.
[00105] In general, according to one aspect of the invention, polarization
dependent measurements need not be used to resolve a complete set of
Stofces parameters. Other polarization measurement techniques can be
employed in which only limited polarization related information is obtained,
which information is nonetheless sufficient to encode the phase variations
that
occur for two counter-propagating beams.
[00106] In general, at least two polarization dependent intensity responses
are obtained to resolve the phase relationship between the combining beams.
This technique is generally useful as a phase measurement technique, and is
particularly effective when used for both counter-propagating beam directions
in the intrusion/disturbance detection system of the invention.
[00107] One example of obtaining at least two polarization dependent
intensity responses comprises separately detecting the intensity of different
polarization components (at least two) for one of two or more output signals
from the beam combiner. It is also possible to detect the intensity response
for
two polarization components, one from each of two or more output ports. The
different polarization components can be orthogonally polarized components,
such as 0° and 90° linearly polarized components. Alternatively,
the different
components can be two other arbitrary polarization components, provided that
the components are different and thus represent two independent variable
responses that are related to phase.
[00108] In a case comprising measuring the intensity response of two
polarization components, when the two combining beams are arbitrarily
-24-
CA 02571084 2006-12-14
WO 2006/001868 PCT/US2005/011045
polarized, a phase change between the two beams causes the plotted (or
otherwise encoded) relationship between the two detected intensities to trace
an ellipse. A phase relationship between the two beams of arbitrary
polarization can therefore be determined by analyzing the elliptical
trajectory,
for example by transforming the ellipse into a circle and calculating the
relative angular difference between consecutive points on the circle. The
phase difference between the two signals along different paths can be
obtained from the rotation angle between the points, except for a constant
offset value which is a dependent of the polarization mismatch between the
two beams.
[00109] Other similarly applicable techniques for resolving phase
relationships exist and now will be apparent to those skilled in the art.
These
and other techniques can be applied to each of the counter-propagating
directions to determine the phase relationship between the signals on two
signal paths in each direction. More particularly, the phase relationship is
monitored over time, for example by sampling. A disturbance at some point in
the detection zone alters the propagation conditions for at least one of the
two
beams along different signal paths in each of the two opposite directions. The
disturbance thereby causes a time variation in the phase relationships
between the two beams of both opposite signal pairs. The effect of the
disturbance on the counter-propagating light signals is detected, after the
light
signals carrying the effect of the disturbance have propagated in opposite
directions to the phase receivers. Depending on whether the disturbance
occurred nearer to one end or another, the effect of the disturbance arrives
sooner or later at one or the other phase receivers. The leading or lagging
time shift and knowledge of the rate of signal propagation can be used in
calculating the point at which the disturbance occurred. The use of the phase
relationship between the members of the opposite signal pairs produces a
similar and readily correlated phase-versus-time signature for the signal
pairs
in both opposite directions.
[00110] This technique is optimally free of polarization influences, even
though polarization affects the oppositely propagating signals. If the states
of
polarization of two combining beams happen to be substantially parallel to
-25-
CA 02571084 2006-12-14
WO 2006/001868 PCT/US2005/011045
each other, the resulting polarization trajectory can be highly eccentric, and
possibly reduced into a straight line. This situation can be avoided by
changing the input polarization by the use of the polarization controller 130
and 131, as shown in FIG 2. Because polarization effects are partly a matter
of wavelength, a tuning control can be included to permit a wavelength
adjustment for repositioning the polarization transformation situations for
the
different light paths, such that the polarizations of the combining beams are
made substantially different from one another instead of parallel.
[00111] In another embodiment, the beam combiners 120, 121 are
polarization sensitive, combining orthogonal polarization components. This
manner of beam combination results in a circular normalized Stokes
Parameter trajectory on the Poincare Sphere. A relative angular change of
the polarization state in the trajectory plane is proportional to the phase
difference between the two interfering beams. Therefore, according to an
aspect of the invention, this change in polarization state can be detected and
used as the parameter that is correlated for the counter-propagating signals.
This technique likewise permits a disturbance in the detection zone 200 to be
localized to the place at which the disturbance caused a change in optical
propagation properties.
[00112] For a combination of orthogonal polarization components, the
polarization trajectory can be circular but might not be a great circle on the
Poincare Sphere. The trajectory may have a diameter that is smaller than the
diameter of the Sphere itself. The size of the circular trajectory on the
Poincare sphere is a function of the relative power between the orthogonal
polarization components in the two beams that are being combined. If the
intensities of the orthogonal polarization components being combined are
equal to each other, then the circular polarization trajectory produced by a
changing phase difference between the combining beams will be a great
circle on the Poincare Sphere. If these intensities become unequal, the
circular trajectory is reduced in diameter compared to the full diameter of
the
Sphere. The angular position of points on the trajectory circle can still be
determined, and such angular position provides a phase related variable.
-26-
CA 02571084 2006-12-14
WO 2006/001868 PCT/US2005/011045
(00113] According to an inventive aspect, the changes in polarization state
around a trajectory on the Poincare Sphere represent the parameter by which
the location of the disturbance is resolved. The invention relies on this
phase
related variable and not on a variation in intensity produced by interference
of
the beams whose phase relationship is the variable of interest.
(00114] The precision with which a difference or change between
polarization states can be resolved (namely the angular displacement
between two points on the, circle of polarization trajectory) is best when the
trajectory circle has a large diameter. According to another aspect of the
invention as explained below, the precision of the detection measurement can
be maintained to an effectively high precision by taking steps to keep the
trajectory circle large on the Poincare Sphere, as obtained from changing
polarization states. These steps, which are desirable but not necessary,
include the effective management of the polarization controllers or the
wavelength of the laser.
(00115] With counter-propagating beams, the same optical waveguide is
interrogated from two different directions (or alternatively, coextensive
plural
optical waveguides can be interrogated). Constant offsets and/or slowly
changing phase difference values might occur and be. measured for one or
both of the two counter-propagating directions, for example caused by
environmental drift or the like. A steady state offset can be subtracted away
and ignored, and a change in phase relationship that has a lower rate of
change than the phase variation produced by the disturbance, can likewise be
subtracted away in much the same way as an offset.
(00116] If a disturbance occurs somewhere along the length of the optical
waveguide in detection zone 200, the time required to propagate to the two
detectors or sensors 110, 111 in the counter propagating directions varies
with the relative distances over which the respective counter-propagating
beams propagate on, beyond the disturbance, to their respective phase
detection sensors. This time difference can be measured by comparing the
time varying angular change of the output polarization for the two counter
propagating optical channels. The difference in propagation time thus can be
measured. Knowing the velocity of light in the optical waveguide, it is a
-27-
CA 02571084 2006-12-14
WO 2006/001868 PCT/US2005/011045
straightforward calculation from the time difference to the location of the
disturbance along the waveguide in detection zone 200.
[00117] FIG 4 is a block diagram, again using the same labels and
reference numbers for elements already discussed, demonstrating certain
alternative embodiments. Although the polarization response of the system
can be detected by a polarimeter that is capable of measuring complete
polarization properties (e.g., a full set of Stokes variables), a limited
polarization sensitive detector is also possible. In FIG 4, a detection system
comprises two multiple channel high-speed detectors as the polarization
sensors 112, 113.
[00118] In the following, two examples are discussed in detail to illustrate
the principles of the inventive polarization based phase responsive receiver.
Example 1.1: Polarization insensitive beam combiner
[00119] In this first example, light from the same source is launched into two
fibers using a polarization insensitive light splitter. The output light is
combined, using a polarization insensitive beam combiner. The combined
output light is analyzed using a polarization measurement system (such as a
high speed version of PS2300B polarization analyzer available from Optellios,
Inc., Langhorne, PA) or using another polarization sensitive detector or
detection scheme. A detected change of polarization provides information
relating to the phase difference between the light signals that travel along
the
two signal paths for each of the opposite signal directions.
[00120] This approach does not require a particular state of polarization for
light signals launched into the fiber(s). Nor is it necessary that the fiber
have
a particular amount of birefringence. The measurement generally is not
influenced by different starting conditions (polarization states and
birefringence conditions) or by long term changes that may occur such as
changes in temperature. These effects can be ignored and/or distinguished
from the short term changes that result from disturbances to be detected. As
a result, this dual fiber system can be operated effectively in a
bidirectional
configuration in conjunction with a high-speed polarization analyzer or other
_28_
CA 02571084 2006-12-14
WO 2006/001868 PCT/US2005/011045
polarization sensitive detection scheme, as a location resolving intrusion
detection system.
[00121] For illustration purposes, a fiber optic coupler, preferably with an
equal intensity-splitting ratio, is used as a non-limiting example in this
part of
the discussion. The input light signal is separated into at least two light
beams
with equal intensities. These beams, after traveling through the detection
zone, are recombined with one another, using a polarization insensitive
coupler. The intensity as well as the state of polarization of the resulting
combined output light signal are affected by the phase relationship. However,
the intensity response, as discussed previously, cannot produce substantially
the same intensity-versus-time signature for both counter-propagating signals
where there are differences in various polarization induced effects for the
two
propagating directions. Such a combined intensity response is only useful
when a polarization controller is actively used to balance the polarization
induced effects for both directions.
(00122] The time variation of the output polarization for the combined
counter-propagating beams, characterized as the angular rotation of a phase .
trajectory on the Poincare Sphere as described above, on the other hand,
always has substantially the same shape for both counter-propagating beams.
This occurs because the phase trajectory is a more direct representation of
the changing phase difference caused by the disturbance, and the phase
difference is substantially identical for both counter-propagating directions.
[00123] The phase difference of the combining beams can be calculated
from the angular difference between consecutive plotted (or otherwise
encoded) points on un-normalized polarization trajectory as projected onto a
circular shape. Because the phase effects are substantially identical for both
counter-propagating directions, the location can be determined from the
resulting two phase responses for the two counter-propagating signals,
measured by corresponding angular changes in the positions of points plotted
(or otherwise encoded) for both counter-propagating directions.
(00124] The size and shape of the polarization trajectory represented by the
Stokes parameters changes as a result of changes in the polarization
relationship between the combining beams. According to the invention,
-29-
CA 02571084 2006-12-14
WO 2006/001868 PCT/US2005/011045
however, the polarization trajectory can be processed to project the points
onto a circle of a normalized unit diameter, and from which the angular
position of each sampled set of data points is derived.
[00125] The resulting trajectory can become eccentric or small in diameter.
It is possible to project a small or eccentric trajectory onto a unit circle.
The
accuracy in the measurement of the rotation angle of the sample points in
most conditions is sufficient to enable correlation of the time signatures of
the
disturbance, namely to identify the effect of the disturbance as comparable
changes in rotation angle versus time, for the two counter-propagating signal
paths. Specific conditions can arise when the trajectory becomes so small or
highly eccentric as to preclude a positive determination of the rotation
angles
of the sample points.
[00126] For example, if the diameter of a trajectory is made small, the
resolution used in digitizing the position of a sample on the trajectory may
become large relative to the size of the trajectory. If the small trajectory
then
is projected onto a larger diameter circle, the digitizing error is
correspondingly larger. Similarly, as the eccentricity of a trajectory also
affects the measurement accuracy. For example, the situation can arise that
the beams become wholly parallel polarized, reducing the trajectory trace to a
straight line.
[00127] It is relatively rare for polarization relationships in the real world
to
become or to remain so fully parallel or orthogonal as to preclude effective
operation of the system as described herein. Nevertheless, the situation can
be avoided by providing controls that are enabled to adjust the polarization
relationships using one or more polarization controllers 130 and 131, shown in
FIG 3, when the trajectory size or eccentricity become extreme. All that is
necessary is to displace the polarization relationships away from these
specific states.
[00128] Because the beams are combined in a polarization insensitive
manner, the polarization controllers) can be placed outside the waveguide to
adjust the relative relationship between the polarizations of the interfering
beams.
-30-
CA 02571084 2006-12-14
WO 2006/001868 PCT/US2005/011045
[00129] The only situation wherein a polarization controller might be
advantageous inside the waveguide is when the two light paths have
substantially equal polarization transformation functions. That situation is
unlikely for any practical system. Another method to avoid a small trajectory
situation is to provide a control to tune the wavelength. As described
previously, the polarization transformation is wavelength dependent. By
adjusting the wavelength of the light beam, the relative polarization
relationship can be adjusted. A wavelength adjustment or a displacement
using the polarization controllers) can be triggered by an output from a
processor (not shown in FIG 3) that processes the data from the phase
receivers, in this case from polarization sensors 403, 404.
[00130] FIG 4 demonstrates an arrangement with polarization controls 130,
131 in the signal insertion paths leading from source 100 into the
splitter/combiners 120, 121. Also, polarization controls 132, 133 are provided
from the combined beam outputs from splitter/combiners 120, 121, leading
into the phase detectors that in this case comprise two-channel high speed
polarization state detection units 112, 113. The detection units 112, 113
derive two phase related variables that are schematically shown in FIG 4 as
more or less eccentric plots of trajectories 410, 411 along which sample
points fall. When projected onto a circle (not shown in FIG 4), the sample
points define rotation angles as described.
[00131] Experiments were conducted and data collected to test and
demonstrate the concepts discussed above. FIG 5 is a typical measurement
of intensity traces versus time for the two channels. The two intensity traces
shown are the intensities of the opposite combined pairs of signals for the
two
counter-propagating paths. Because of various polarization effects, the
intensity responses have quite different time varying shapes as shown in this
plot over a time scale of one minute.
[00132] FIG 6 is a three dimensional isometric view showing corresponding
non-normalized Stokes parameters trajectories. The trajectories each appear
to represent the intersection of a plane and sphere. The sizes and
orientations of the trajectories are different. However, repetitive samples of
polarization parameters, taken over a time scale during which the intensity
-31 -
CA 02571084 2006-12-14
WO 2006/001868 PCT/US2005/011045
values may irregularly as shown in FIG 5, are found to fall on these highly
regular trajectory paths. An aspect of the invention is to regard these and
similarly derived trajectories as projected phase relationship plots
demonstrating a phase variation. The angular position of a sample on said
trajectories demonstrates a phase difFerence between the two combining
beams. A change in phase difference can be derived and calculated over
time, providing a phase variation signature.
[00133] The phase variation time signatures derived by determining the
relative angular positions of points on these trajectories, are substantially
independent of polarization influences. Changes in polarization states may
increase or decrease the size of the trajectory and may change the orientation
at which the trajectory plane intersects a sphere defined by the un-normalized
Stokes parameter values. However, the time varying phase relationships of
points on these trajectories have been found to correlate closely.
[00134] FIG 7 is a dual plot showing the time varying phase relationships for
two counter-propagating signal directions, determined from angular positions
around trajectories as shown in FIG 6, and at the same time scale as shown
in the dual plot of intensity traces of FIG 5. The very substantial
correlation in
the time varying signal shapes as shown in FIG 7 enables the two signals to
be used for various comparison techniques. These comparison techniques
lend themselves readily to determining a lead or lag time of propagation of a
phase variation caused by a local disturbance in the detection zone, to the
appearance of corresponding variations at the phase receivers for the
counter-propagating signal directions. The location of the disturbance can be
resolved from the time difference.
Example 1.2: Polarization sensitive beam combiner
[00135] In this second example, light from the same source is launched into
two fibers using a polarization beam splitter, thereby creating two beams. The
signal from the same light source can be used to create both counter-
propagating beams. The light beams pass through the detection zone and are
then combined, using a polarization beam combiner so as to analyze the
orthogonal components of the beams in the two fibers. The combined signal is
-32-
CA 02571084 2006-12-14
WO 2006/001868 PCT/US2005/011045
analyzed using a polarimeter or other polarization sensitive detection scheme.
The change of polarization provides the information about the phase
difference between the beams that travel along the two paths.
[00136] A schematic example demonstrating phase detection based on
polarization change is shown in FIG 8. Light is injected into two paths 300a
and 300b by operation of a beam splitter 122 (element A). In the illustrated
example, the beam splitter is a polarization beam splitter. Both beams are
recombined using through a polarization beam combiner 123 (element B). If
the polarization states for these two beams vary slowly, the intensity of the
combined beam output from the polarization beam combiner 123 remains
substantially constant over the time scale of interest. The state of
polarization
(SOP) of the output beam, on the other hand, can vary with the phase
difference between the two beams. The output SOP varies as a function of
the phase difference d~ of the two beams as follows:
E = Elox + EZO ~ a°~Y
[00137] FIG 9 illustrates another configuration for detection using
polarization change. In this embodiment, the polarization beam
splitter/combiner is replaced by a polarization displacer, for example
comprising a birefringent crystal cut to the required dimensions. The
birefringent crystal retards a polarization component that is parallel to one
axis
the crystal relative to the other axis.
[00138] These arrangements of FIGS 8 and 9 each segregate and
recombine polarization components as separate beams. A change in the
relative phase difference ~~ between the beams corresponds to a change in
the polarization state of the combined beam, which state is determined by the
presence and relative power levels of such polarization components. In a
case where the relative phase difference between the two signals along
different paths in either FIG 8 or FIG 9 should change, and assuming that the
intensities of the two polarization components for the two beams are equal,
then the trajectory of the polarization evolution between plotted (or
otherwise
encoded) points will be an arc of a great circle on the Poincare Sphere,
-33-
CA 02571084 2006-12-14
WO 2006/001868 PCT/US2005/011045
representing the polarization state before and after the change in phase (and
change in polarization state). The angular change of that polarization
evolution, measured with respect to the center of the circular trajectory, is
directly related to the phase difference between the two combining beams
along different paths.
[00139] If the power is unequal for the two beams and the phase
relationship changes, then the evolution is a circular arc trace on the
Poincare
Sphere that represents a phase difference, but the size of the circular
trajectory can vary. Nevertheless, the angular change of between the starting
and ending polarization states plotted (or otherwise encoded) in this way,
measured with respect to the center of the circle, is still equal to the
changed
phase difference between the two signals along different paths. The angular
measurement of phase difference remains resolvable whether the circular
trajectory is larger or smaller. Thus it can be seen that by determining and
using the rotation angle around the trajectory, changes in phase angle can be
discerned in a way that are free of certain complications associated with
polarization.
[00140] Experimental tests were conducted using the polarization sensitive
beam separator and combiner shown in FIG 9. The two paths 300a, and 300b
were composed of single-mode optical fibers. The outputs of the combined
beam for the two counter-propagating signals were analyzed using Optellios'
PS2300B polarization analyzers. FIG 10 shows an experimentally obtained
circular SOP trajectory that resulted from the varying phase difference of two
signals carried on different paths in one of two counter-propagating
directions
and FIG 11 shows the SOP trajectory in the opposite direction. The variations
in state of polarization (SOP) as shown were due to ambient phase
fluctuations between the two fibers, 300a, and 300b.
[00141] It can be seen in the oblique isometric projections in FIGS 10 and
11 that the SOP trajectories are circles on the Poincare Sphere. According to
an inventive aspect, the trajectory circles are used as a phase attribute of
polarization state.
[00142] The location, size and orientation of the trajectory circles are
different in FIGS 10 and 11. At any given time, the positions of respective
-34-
CA 02571084 2006-12-14
WO 2006/001868 PCT/US2005/011045
samples for the counter-propagating directions, plotted (or otherwise
encoded) as points on either of the two trajectory circles, are different
points
on the Poincare Sphere. It has been found, however, that the successive
differences in phase angle as represented by the rotation angle around the
depicted circles, is a measure of phase relationship that is reflected in the
progress of samples for both counter-propagating directions.
[00143] In an embodiment as described with reference to polarization state,
the phase relationship concerns the relative phase relationship of orthogonal
polarization components in each of the counter-propagating directions, that
relative phase relationship being reflected in the plotted (or otherwise
encoded) polarization state on the Poincare Sphere.
[00144] As visually shown by the trajectories in FIGS 10 and 11,
successively plotted points provide a way to determine relative phase
differences from one sample to the next, as shown by angular rotation
between that points at which the successively plotted (or otherwise encoded)
samples fall on the trajectories. Although two opposite signal. paths plot to
different trajectories, for example when a power imbalance exists between the
two channels (e.g., comparing the two traces in FIGS 10 and 11 ), this
technique can be employed to measure phase time changing phase
relationships and to provide a signature of phase variation over time. The
power imbalance and other particulars of the polarization state do not prevent
the trajectories from plotting to circles from which angular position data can
be
derived, in particular changes in rotation angle versus time for successive
samples, representing the changing phase relationship.
[00145] An optical fiber typically has some birefringence that differentially
retards one polarization component relative to another. This alters the SOP of
the light propagating in a fiber from an input to an output. The alteration is
different in opposite directions. Differential retardation through a fiber
results
in some power loss at the polarization combiner 125. However, power
fluctuations do not alter the angular difference in plotted (or otherwise
encoded) positions around the polarization trajectory in FIGS 10 and 11 when
the polarization state changes. The parameter of interest, namely the angle
-35-
CA 02571084 2006-12-14
WO 2006/001868 PCT/US2005/011045
at which a point plots around the trajectory circle, is not sensitive to power
level.
[00146] Assuming that a SOP fluctuation causes an intensity mismatch, the
trajectory circle is possibly moved on the Poincare Sphere (e.g., compare the
two examples in FIGS 10 and 11 ), and it is possibly changed in size, but the
phase difference of the two beams can still be measured using the changing
SOP trajectory circle rotation angle as the operative parameter.
[00147] Although intensity fluctuation does not prevent measurement of an
angle around a trajectory as a representation of phase, the same practical
consideration discussed with respect to the previous embodiments apply to
favor keeping the intensities equal if possible. If the intensities are equal,
the
trajectory has the full great circle diameter of the Poincare Sphere. In other
cases, the circular trajectory of the rotation of the SOP can be displaced
(e.g.,
the trajectory in FIG 11 is displaced downward compared to the example
shown in FIG 10). In an extreme case, the diameter of the trajectory on the
Poincare Sphere is reduced to an impractically small dimension. The situation
can be avoided, and if desired the system can be optimized to maintain a
power balance, by providing polarization controllers to adjust the beam
polarization conditions when needed, or by triggering a controller operable to
tune the operating wavelength of the laser or other light source.
[00148] If no light should be received along the path to the detector for one
of the two paths, as illustrated schematically in FIG 12, a phase difference
measurement between the two beams obviously cannot be obtained. There
may be some light along both paths, but if the transfer functions between the
input SOP and one of the two outputs is such that the beams are not
combined, then the rotation of SOP cannot be detected and the phase
difference cannot be obtained. A way to avoid or correct for this situation,
if
necessary, is to provide one or more polarization controllers at some point in
the path, so that the polarization of one or both of the two beams is altered
to
avoid the situation discussed above wherein one beam is effectively blocked.
Another preferred technique is to tune the launch wavelength so as to alter
the state of polarization of the light propagating through the fibers and in
effect
to control the power distribution in the two beams at the polarization
combiner,
-36-
CA 02571084 2006-12-14
WO 2006/001868 PCT/US2005/011045
which has a similar effect of opening two signal paths from which a phase
measurement is possible. The polarization transformation is wavelength
dependent. Especially for a long fiber, changing the wavelength will alter the
propagation conditions sufficiently to relieve the special situation described
above in most instances.
[00149] Still another technique to avoid the problem is to use a switching
configuration, for example as shown in FIG 13, wherein a power mismatch in
the two arms can be properly managed by using a 1x2 optical switch 500. In
this configuration either of the two switch-selectable output ports can be
used
for monitoring the phase difference between the two detection signal paths.
At any given time one or the other port can be selected using the switch 500.
Switching from monitoring one port to the other can be triggered as a function
of the detected size of the polarization circle trajectory on the Poincare
Sphere, using a control function of a programmed processor (not shown in
FIG 13) to toggle switch 500 if the polarization trajectory size should be
reduced to some threshold minimum, thus establishing different polarization
trajectory conditions.
[00150] If a polarization controller is used in the system, there are several
choices of configuration and operation. Some are now discussed. As shown
in FIG 14, a polarization controller 601 can precede a polarization splitter
124
to control the incident SOP. A polarization controller 602 and/or 603 can be
placed between the polarization splitter 124 and a polarization combiner 125.
Also the polarization splitter can be replaced by a polarization insensitive
coupler, so as to provide for substantially equal intensity along the two
paths.
[00151] In this discussion, a number of examples are detailed for handling
two beams or two signals along different paths, the phase relationship of
which is to be established and monitored over time. The invention relates to
phase relationship measurements as such, and also to the advantageous use
of such phase responsive measurement techniques in counter-propagating
signal paths where paired-beam signal paths are established in opposite
counter-propagating directions, and the phase measurements taken for both
directions are correlated to resolve a lead/lag time accounting for the
location
of the disturbance that produces a signature variation of phase versus time.
-37-
CA 02571084 2006-12-14
WO 2006/001868 PCT/US2005/011045
[00152] According to another inventive aspect, phase effects can also be
collected and analyzed with only a limited set of polarization related
properties
obtained using two polarization sensitive detectors, which will be described
in
more detail below.
[00153] By measuring the time difference between the two counter
propagating directions using polarization measurements as described before,
the location of an intrusion can be resolved by equating the observed time
delay with a difference in propagation time between the location of the
intrusion (or other disturbance) and the detectors. In the arrangement shown
in FIG 15,,there is no need to adjust the SOP such that the relative SOPs
relationship of the two beams are matched before the point at which two
beams combine to produce an interFerence intensity for the two counter-
propagating signals. As a result, the method and apparatus of the invention
are more robust and less sensitive to system fluctuations.
[00154] In one embodiment, polarimeters are used to measure the state of
polarization and to collect trajectories from the values of successive
samples,
being coupled to a data processor or the like to resolve and to correlate the
changing phase difference between the two beams in each counter-
propagating direction so as to determine the location of a disturbance. A
simple detection arrangement is possible wherein less-complete polarization
state related information will suffice.
[00155] An inventive aspect is to provide a circularly projected transform of
the polarization evolution, for example as represented graphically (or
otherwise) by a two dimensional projection of trajectory points on a Poincare
Sphere, in a direction whereby the result is a circle. The projection is two
dimensional (i.e., on a plane if considered graphically). The projection can
employ a set of two dimensional data points that form an eccentric
(elliptical)
pattern, but that pattern is normalized as a circular trace centered at an
origin.
[00156] For example, the SOP of the output signal can be a great circle in
the S1-S2 plane (i.e. , S3=0). The angular change of the SOP can be
calculated using the outputs of two detectors, the sampled values from which
are independent variables that together define a point in a two dimensional
space. FIG 16 shows an embodiment in which detectors A and B are
-38-
CA 02571084 2006-12-14
WO 2006/001868 PCT/US2005/011045
preceded by polarizers 801 and 802, oriented, for example, at 0° and
45°,
respectively. In FIG 16, the output signal is separated into two equal
intensity
paths by a polarization insensitive beam splitter 701. The first path passes
through a 0° polarizer 801, before it is applied to an intensity or
amplitude
detector A. The second path passes through a 45° polarizer 802, before
it is
applied to detector B. This arrangement provides two intensity data channels.
[00157] The relation between these two intensity channels is such that as
the input light signal changes in polarization state, the intensity responses
vary. The power distribution between the two channels shifts. If the
polarization characteristics vary over time through a full phase transition or
period (i.e., 2rr), the intensity distribution shifts full cycle back to its
original
condition. The successively sampled data values fall at various points in a
closed trajectory pattern. As the polarization state of the light signal
varies,
the changing intensity data points plot to points on an elliptical shape in
two
dimensions.
[00158] The shape of the SOP trace projection as thus obtained may be
elliptical but it is possible accurately to determine a phase angle even
though
the trace is elliptical rather than circular. This generally amounts to re-
mapping the elliptical pattern of the trajectory as a projected circle with an
origin, whereupon an angle can be determined by the sine and cosine
relationships of the X and Y coordinate values on the projected circle. The
aspect ratio of the trajectory plot is corrected to render the trajectory
circular.
[00159] In this disclosure, the graphic nature of the Poincare Sphere, the
elliptical shape of certain trajectory trace patterns obtained from samples of
two independent variables and other aspects are discussed and explained
with respect to graphic plots and patterns, i.e., the appearance of a graph
that
might be obtained if the data values were plotted (or otherwise encoded) in a
coordinate system. It should be understood that such graphic explanations
are to enable understanding. In an operational embodiment, there is no
requirement for a graphic printout or display or the like. The point is simply
that data points as represented by a set of values that may encompass a
larger or smaller span and may be eccentric rather than substantially
circular,
regardless of whether the values are ever plotted, encoded or displayed, are
-39-
CA 02571084 2006-12-14
WO 2006/001868 PCT/US2005/011045
processed according to the invention to derive a rotation angle in a
circularly
periodic trigonometric representation of phase data.
[00160] The size of the trajectory is determined by the power relationship
between the two components that are combined by the polarization sensitive
combiner and used for output SOP detection. The size of the trajectory can be
controlled by polarization controllers, some examples being shown in FIG 14.
[00161] The polarization controllers 601, 602 and 603 of FIG 14 can be
used to control the size of the trajectory. Polarization controller 601
establishes a polarization state before the light reaches the polarization
sensitive beam splitter 124. Polarization controllers 602 and 603 control the
polarization before the polarization sensitive combiner 125. (FIG 14 shows a
one-direction signal path with two signal legs, but in location detection
embodiments as otherwise explained herein, counter-propagating signal
paths are used the can be, for example, two signal paths as in FIG 14,
oriented in opposite directions.)
[00162] In the proposed location detection system, the location of the event
or disturbance is detected directly from the phase responses obtained in the
counter-propagating signals, specifically by their lead/lag timing. In this
case,
variations in polarization state, as discussed above, only affect the trace
size
and the projected trace shape. The phase relationship between signals along
different signal paths for each opposite signal directions, and ultimately the
event location, are determined by sampling values that correspond to the
angular displacement of the point along the circularly projected trace. As
long
as the trace is not so small or so eccentric that the resolution.error is
untenable, the rotation angle can be determined, independently of specific
polarization values. This technique produces a robust and dependable
parameter, whereby sampled values representing the same phase change
time signature appears clearly in both counter-propagating signal directions,
can be readily correlated over a lead/lag time, and allows a location to be
inferred for the disturbance that caused the phase change.
[00163] Some further examples are also explained herein. In FIG 17,
polarization controllers functionally similar to devices 602 and 603 in FIG
14,
are implemented by two patterned Liquid Crystal (LC) tunable waveplates.
-40-
CA 02571084 2006-12-14
WO 2006/001868 PCT/US2005/011045
These waveplates can be directly attached to the polarization sensitive beam
combiner as manufactured. The LC cell contains a patterned electrode, such
that polarization controls can be applied independently to the upper arm and
the lower arm (distinguished in FIG 17 by shading). With two patterned
waveplates, it is always possible to generate a SOP trajectory that is a great
circle. Even without such capability, because the measurement is insensitive
to the size of the trajectory (and as long as the trajectory is not too
small),
accurate measurement can be achieved. Therefore, one patterned LC cell
oriented at 45 degrees also will suffice.
[00164] An example of a two-beam combination is shown in FIG 18. Two
beams are combined, passing through 0° and 90° polarizers 128a.
Other
combinations of the angles may also be used. In this case, the polarization
state for the combined beam depends on the phase difference of these two
beams. Multiple beams also can be combined using a polarization sensitive
beam splitter. One such example is shown in FIG 19, where four beams are
combined, each passing through a polarizer oriented at a specific angle. For
combining more than two beams, as shown in FIG 20, the polarization aspect
of the combined beam can be somewhat complicated.
[00165] Experiments were conducted to test and demonstrate these
concepts. FIG 21 is a plot of typical intensity measurements, wherein two
detector values were obtained as independent variable values as described,
namely by repetitive sampling of two detectors for each of two counter-
propagating signal channels. The detector sample values are plotted in FIG
21 on vertical and horizontal Cartesian coordinate plots, using X and O
characters for the respective counter-propagating directions, each such
character representing two contemporaneously sampled detector values in
one of said directions. Sampling continued over a sufficient time to ensure
phase changes that may exceed full 2rr period. By comparing the change in
angular positions from one sample point to the next, in repetitive samples of
the two intensities of each of the two channels, the phase relationship of
component beams can be determined over time.
[00166] Corresponding intensity values for two detectors and the
corresponding accumulating change in angular phase position are plotted (or
-41 -
CA 02571084 2006-12-14
WO 2006/001868 PCT/US2005/011045
otherwise encoded) over a short time scale in FIG 22. As discussed, an
object of an intrusion detection system or other system in which the location
of
a disturbance is to be calculated, is to correlate the time signature of
corresponding responses in the counter-propagating beams. Specifically, the
time changing phase relationship of plural beams is to be determined and
correlated in counter-propagating beam pairs. Although the upper and lower
plots in FIG 22 represent the same phase change, the processed phase angle
data is a cleaner and potentially more useful representation.
[00167] FIG 23 shows precisely how closely the counter-propagating
signals along different paths correlated as to processed phase angle data.
The upper plot in FIG 23 shows the close match between the shapes of the
phase difference in the counter-propagating beams on a 10 mS time scale,
showing that the traces track closely. In the event of a disturbance, as shown
in the lower expanded time-scale plot, a time shift is shown between the
responses of the two counter-propagating beams. This is due to the
difference in propagation time for the occurrence of an event at a location in
the detection zone that was closer to one phase receiver than the other, such
that the phase variation arrived sooner. Channel 1 and Channel 2 in FIG 23
refer to the two counter-propagating directions.
[00168] FIG 24(a)-(e) compare the detector intensity trajectories and phase
plots obtained in a range of different experimental conditions using a system
as described herein. Two independent phase-related detector values were
sampled repetitively over the time scales shown, producing trajectory data
values and phase-time signatures that are plotted(or otherwise encoded) on
the same graphic presentations in different shades. These data values were
collected with no particular disturbance locally affecting the phase
relationships, demonstrating a typical range of phase variation the beams
from environmental drift and general ambient conditions. In the absence of a
localized disturbance, the calculated phase differences in the counter-
propagating directions should substantially overlap if the phase
measurements are accurately obtained.
[00169] FIGS 24(a) to (e) show various conditions in which the traces are
larger or smaller and more or less eccentric. The phase measurements are
-42-
CA 02571084 2006-12-14
WO 2006/001868 PCT/US2005/011045
insensitive to the shape and the size of the trajectory, as shown by the
closely
corresponding phase-time plots, except that the correlation becomes more
noisy when the maximum-to-minimum intensity value spans become very
small (i.e., the diameter of the trajectory shrinks) as in FIG 24(d). The
measurement technique becomes unworkable only if the size of the trajectory
projection shrinks all the way to a point (FIG 24(e)) or to a line (not
shown).
[00170 FIG 25 demonstrates that in the event that a trajectory projection
becomes small, then without changing other aspects it is possible to increase
the size of the projection by just a small change in wavelength. Because the
polarization transformation through a fiber depends in part on wavelength, the
intensity distribution in the orthogonal polarization components of the two
beams being combined, and hence the size of the projected circles, can be
adjusted by changing the operating wavelength. The wavelength dependent
changes can be advantageously exaggerated by using birefringent
components right after the light source. In FIG 25, a change in wavelength of
1.0 nm generally doubled the circular trajectory size. This effect can be used
advantageously to enhance the signal to noise ratio for measurement of the
phase difference and detection of the disturbance location. The change can
be a matter of switching between available wavelengths under control of a
processor to correct a perceived reduction in signal to noise ratio, or the
operational wavelength can be changed in a regular and repetitive manner
during measurements.
Phase Detection Based on Fiber Optical Coupler
with Three or More Output Ports
[00171] The light signal has a phase characteristic that can be used to
provide a phase-time signature, and can be accurate if handled as described.
The following examples concern applications of the idea of discerning a
phase-time signature from two independent variable intensity values.
However, according to further inventive arrangements, do not depend on time
variations in polarization state. These embodiments further reduce the
measurement to sensing and correlating time changing phase relationships
for two counter-propagating signals.
-43-
CA 02571084 2006-12-14
WO 2006/001868 PCT/US2005/011045
[00172] As discussed in the prior art section, it is known to use two-by-two
couplers at opposite ends of a two-fiber counter-propagating signal path,
using the interference between the signals at a receiving end in an effort to
develop a signal that is to be correlated at opposite ends to identify the
location of a disturbance. As also described, the interference intensity of
the
two signals is not an effective signal for this purpose because of confounding
polarization problems.
[00173] Moreover, a two-by-two coupler as in the prior art cannot alone
produce two independent phase related intensity variables from which phase
can be derived (at least not without polarization processing as well). In a
two-
by-two coupler, the sum of the two output intensities must equal the total
input
power. Assuming a given input power, the two output intensities are linearly
dependent on each other. If one increases, the other must decrease, their
sum being a constant so long as the input power is constant. In order to
generate sufficient information to discern phase, one needs at least two
independent variables that are related to phase. One method as described
above is to respond to different polarization components. Additional methods
are now presented, to illustrate the principle without reliance on
polarization
components. These methods are particularly useful, effective and
inexpensive as well.
[00174] At least two independent intensities useful for discerning phase, can
be obtained by the use of a coupler with three or more output ports, as the
device that couples the combined signals from two or more signal paths, onto
two or more detectors. In a disturbance locating system with counter-
propagating dual beams, such as two optical fibers, such couplers are
provided at both ends.
[00175] In the case of a coupler with at least three outputs (at least two of
which are to be used as sources of independent variable data), the sum of all
the output intensities still equals the input intensity. However, any two
output
intensities are independent from each other. According to an inventive aspect,
the distribution of power among the two of at least three output ports of such
a
coupler, is arranged to depend at least partly on the phase relationship of at
-44-
CA 02571084 2006-12-14
WO 2006/001868 PCT/US2005/011045
least two input beams, at least one of which traverses the detection zone, and
which are both combined by the coupler.
[00176] Preferably, the coupler has equal power distribution among the
outputs when only one input beam is present, and a power distribution that
varies between two of the three outputs as a function of the relative phase
differences between two input beams that are combined as inputs. Some
alternatives embodiments are possible to achieve this arrangement. In the
following discussion, a 3x3 coupler with equal output power distribution from
one input is used as an illustrative example.
[00177] In this embodiment, two signal paths are combined by the use of a
three-by-three coupler, and at least two of the three signal outputs are
applied
to photo-detectors and their intensities are sampled. These sampled
intensities, or a linear combination of these intensities, such as their sum
and
the difference, produce two variables that are used for obtaining the phase
relationship via multi-dimensional data analysis that is substantially similar
to
the polarization state trajectory analysis discussed above with reference to
other embodiments. For purposes of illustration and explanation, the sum and
difference values of the sampled two intensities, are interpreted by a
processing algorithm as the X and Y coordinate values of sample points
plotted (or otherwise encoded) on a two-dimensional trajectory curve. An
eccentric elliptical progression is produced if the data is plotted
graphically (or
otherwise encoded) as a closed pattern (although as already discussed, the
matter of graphic presentation is optional). The size of the elliptical
progression or trajectory can vary, especially due to changes in the
polarization conditions of the launched light signals. The position of a
sample
point on the trajectory is determined by the instantaneous phase relationship
of the input beams.
[00178] The elliptical pattern can be normalized into a circular pattern for
further processing similar to the technique described previously. This
includes
mathematically eliminating its eccentricity, defining a center origin and
encoding the angular position around the origin as the phase varies.,The
angular position of each sampled point, with respect to the center of the
circular trajectory, is interpreted as a phase variable associated with the
two
-45-
CA 02571084 2006-12-14
WO 2006/001868 PCT/US2005/011045
beams of the optical signal propagating in one of the two opposite directions
at the sampled point in time. The process is carried out simultaneously and
repetitively for both directions.
[00179] The foregoing technique optionally includes one or more
polarization controllers to maximize the size of the circle that results from
normalizing and plotting (at least in the processing logic) the sum and
difference of detector sampling values on the x-axis and the y-axis. Such a
polarization controller makes it possible to improve the signal to noise ratio
of
the measurement of phase change, by maintaining the swing or span of
values at least to a desired threshold, namely by changing the polarization
conditions if the size of the trajectory shrinks to a small span or even to a
line
or point.
[00180] There are phase effects associated with the polarization states of
the dual beams of,the counter-propagating signals, as described previously.
The arbitrary polarization relation of multiple interfering beams introduces
phase factors. Those factors do not depend on the location of the disturbance,
but rather depend on the relative polarization relationships. According to an
aspect of the present invention, a system can be configured with two 3x3
couplers that each have at least two out of three outputs coupled to
detectors,
so as to eliminate adverse polarization effects. As explained further below,
and in a manner comparable to the polarization embodiments already
discussed, when a disturbance affects the two counter-propagating optical
signals, the effect at least comprises a temporal change in the phase
relationships embodied in each of the signals. The invention seeks to focus
directly on the phase variation as the operative parameter to be used for the
location measurement, as opposed to parameters that may become
complicated by polarization state issues.
[00181] The use of a 3x3 coupler for phase discrimination is proposed in
K.P. Koo, A.B. Tveten, et. al., "Passive stabilization scheme for fiber
interferometers using (3x3) fiber directional couplers", Appl. Phys. Lett.,
Vol.
41, No. 7, 1 October 1992, p616., as a technique applicable in one direction
to
deal with polarization fading. In another example, US Patent 5,313,266 -
Keolian et al. teaches a 3x3 coupler in a passive phase demodulator.
-46-
CA 02571084 2006-12-14
WO 2006/001868 PCT/US2005/011045
According to an aspect of the present invention, a 3x3 coupler is employed as
a signal launching and combining element in a location detection system with
counter-propagating signal pairs, which is not found in the cited prior art.
According to another aspect of the present invention, the outputs of 3x3
couplers are applied to novel data processing techniques as discussed
herein, to discern time changing phase relationships from trajectory
projections, which techniques are particularly effective for location
determination in counter-propagating interferometer arrangements as
disclosed and claimed.
[00182] According to the invention, output detector readings from two of
three coupler outputs can be combined to collect trajectory progressions, that
plot to closed trajectory loops. This technique preferably employs the sum
and difference of two detector readings on a selected two of at least three
coupler outputs. If sample values processed as sum and differences are
plotted (or otherwise encoded) in a Cartesian plot, the result is an ellipse.
The
X and Y axes are sine- and cosine-related variables representing a phase
difference, particularly if the data is further processed to normalize the
trajectory to a circle centered on an origin. The change in the phase
relationship between two signals along different paths propagating in either
of
the two opposite directions can be calculated by measuring the relative angle
around the normalized circular trajectory, as described below.
[00183] As described in Koo, supra, the output intensities for port 2 and 3 of
a 3x3 coupler can be represented as follows,
IZ = Bl + BZ cos 0~ + B3 sin ~r~
Ia = Bl + Bz cos 0~ - B3 sin 0~
therefore the sine and cosine terms can be obtained by simple sum and
difference of these two intensities:
IS = Ii + I3 = 2B1 + 2B2 cos ~~
Ia = Iz - I3 = 2B3 sin 0~
when we plot Ia as a function of IS, an elliptical trajectory results.
[00184] The phase difference o~ can be readily obtained from the elliptical
trace, for example, by renormalization of the elliptical trace into a circular
trace, and calculation of the relative angle for each data point.
-47-
CA 02571084 2006-12-14
WO 2006/001868 PCT/US2005/011045
[00185] The time dependence of the phase difference can then be
calculated by the following, which is discussed here as a non-limiting
exemplary procedure, and it will be apparent that several other methods can
be employed in a similar way.
[00186] The collected intensity data forms a closed loop on a two-
dimensional x-y plane, which is first transformed to a circular loop. The
origin
of the circle is then shifted to (0,0). The angle with respect to the x-axis
is
calculated from the tangent of the X and Y values for each sample point, i.e.,
by taking 8(t)=tari ~(y(t)/x(t)) for each point (x(t),y(t)) corresponding to a
particular time t. The temporal phase dependence is 0(t). This procedure is
repeated for the counter propagating channel and the value of 0'(t) is
calculated. The location of the event is determined by calculating the value
of
~ for which the correlation between the two functions 0(t+~), and 8'(t) is the
highest during a measurement interval. Incrementally different positive and
negative values of ~ can be tried, up to positive and negative values equal to
half the signal propagation time through the detection zone, thereby testing
for
correlation at incremental locations throughout the detection zone. Knowing
the velocity of the light in the waveguide medium, the location of the phase
disturbance can be calculated from the value of ~ at which the correlation is
highest. Other techniques exists for calculating directly the correlation
between the two functions 8(t+~), and 8'(t), to obtain the value of ~.
[00187] FIG 26 is a block diagram showing one arrangement of the remote
distributed fiber sensing system of the invention based on three-by-three
couplers. In this arrangement, light signals for the two optical channels are
derived from the same light source 100. The light splitter/combiner 120 and
121 can be a commercial 3x3 fiber coupler and launches the signal into the
two legs of the detection zone for its respective end. One or a plurality of
polarization controllers 130, 131, 132 preferably but optionally is placed so
as
to advantageously control the optical signals from the laser source 100 into
the light splitter/combiners 120, 121 as shown in FIG 27 and FIG 28.
Alternatively, a wavelength tuner can be provided. The polarization control
and/or tuner are optional in view of the rarity of the situation wherein the
-48-
CA 02571084 2006-12-14
WO 2006/001868 PCT/US2005/011045
trajectory size shrinks so small as to be incapable of representing a phase
angle, but in a given application such as a high security intrusion detection
system, controls and tuners may be advantageous.
[00188] The optical signals that emerge from the splitter/combiners 121,
120 (now operating as combiners for their respective phase receiver ends)
are coupled into the respective pairs of detectors 110, 112, and 111,113.
Each pair of detectors develops two variable values that change
independently as the phase relationship of the combined pair of signals into
the combiner coupler 121 or 120 varies, for example due to a disturbance. In
the inventive method and apparatus, two detection beams are combined
using optical couplers as elements 120, 121. This manner of combination of
the detection beams causes the output of the pair of detectors after data
processing to always fall at some point on a close loop formed by plotting on
the x-axis and the y-axis a combination of the detector readings. This
characteristic will be illustrated further below, including an explanation of
how
the close loop is transformed into a circle, and how it is possible and
advantageous to maximize the circle.
[00189] The optical beam combiners 120, 121 combine the optical power
from the two beams in the detection zone. The detector values vary with
relative phase change, and the values are processed so that a progression
through a period corresponds to a progression through a defined trajectory.
That trajectory can be remapped (either graphically or simply as a matter of
data value mapping) to provide the corresponding phase angles.
[00190] In the preferred arrangement the trajectory is obtained from sum
and difference values and plots to an ellipse. The ellipse is normalized as a
circle and centered. An elliptical trajectory is useful and if the character
of the
ellipse changes (e.g., its size), the trajectory can be adaptively mapped to a
normalized circle. However, any trajectory that is traversed in conjunction
with a phase swing through a full period of phase difference (e.g., zero to
2rr),
and that repeats the same trajectory for the next period (2~rr to 4rr, etc.),
can
be remapped onto a circle or into a succession of incremental phase angles,
in a similar way.
-49-
CA 02571084 2006-12-14
WO 2006/001868 PCT/US2005/011045
[00191] The signal phase variation from one time sample to the next is
proportional to the angular change between of the corresponding points on
the remapped circle around the center origin (or to the incremental phase
angles as otherwise remapped). Therefore, according to an aspect of the
invention, the readings from a two pairs of detectors corresponding to the two
counter propagating channels can be obtained and used as the parameter
that localizes a disturbance in the detection zone 200 in which the
disturbance
causes a change in optical propagation properties.
[00192] The shape of the loop is generally determined by the optical
characteristics of the light splitter/combiner, and the shape normally does
not
vary as a result of changes in the detection zone. However, since the signal
in the two arms is subject to polarization changes, the size of the loop will
change with the polarization state changes. The polarization changes are
generally expected to be slow compared to the time scale of a disturbance
(such as vibration at audible acoustic frequencies) so that polarization can
be
taken into account during the course of data processing. For example,
readjustment of the size of the loop in calculating the angular change from
the
transformed circle that is derived from the loop can involve factors derived
from a currently sensed trajectory size, and the size can be repetitively
updated at some slower rate than the rate used for disturbance detection and
applied as a constant. This technique is generally sufficient but it is also
possible adaptively to recalculate the trajectory size more frequently, which
is
advantageous if a detected disturbance can occur that markedly affects
polarization on a short time scale, e.g., as the disturbance occurs, such as a
disturbance that affects birefringence by twisting an optical fiber in the
detection zone.
[00193] According to one inventive aspect, the changes in phase, derived
from the angular change around a circle, represent the parameter by which
the location of the disturbance is resolved. The precision with which the
angular change between two points on the circular trajectory can be resolved
is best when the trajectory circle is large because a larger diameter enables
more precise resolution of the angle of a point than a smaller diameter, i.e.,
a
better signal to noise ratio.
-50-
CA 02571084 2006-12-14
WO 2006/001868 PCT/US2005/011045
[00194 According to another aspect of the invention as explained below,
the precision of the detection measurement can be maintained by taking
certain steps to keep the circle large. These steps can include polarization
state management using polarization controllers and/or tuning of the
wavelength of the laser.
[00195 FIG 26 is a block diagram demonstrating a preferred embodiment
involving multiple bidirectional fiber signals and couplers arranged to
combine
the signals at the phase receiver end and to develop two independent phase
related variables using two detectors at each receiver end. Whereas the
optical beam combiner and splitter can be chosen from a variety of
configurations, a 3x3 fiber optic fused coupler is preferred. In FIG 26, two
3x3
couplers 120 and 121 are used in combinations with two pairs of detectors
111,113and110,112.
[00196 FIG 27 and FIG 28 are further embodiments that further include
polarization controllers 130, 131 and 132 to enhance the signal to noise ratio
by maintaining a maximum or otherwise optimal diameter for the phasor
trajectory ellipses (or normalized circles), .or avoiding the collapse of the
same, as described above. The accuracy or resolution in discriminating a
location for a disturbance is smallest when the trajectories are large, namely
when a substantial proportion of the full scale span of digitizers in the
detectors is used to obtain values from the detectors 110 to 113. In these
configurations, the state of the polarization controllers can be adjusted by
using the radius of the circle used to determine the phasor values as a
feedback parameter.
[00197] A numerical data processing method is now described, as an
exemplary but non-limiting technique for executing the procedures discussed.
This method is explained in association with data plots (or other
representation) showing examples and experimental results.
[00198 Raw intensity data signals from a pair of detectors monitoring the
outputs of two of the three output ports of a 3x3 coupler at one phase
receiver
end of the detection system, are plotted (or otherwise encoded) as two time
traces in FIG 29. Similar data is generally observed for the pair of detectors
for the opposite end, i.e., for the opposite counter-propagating signal. The
-51 -
CA 02571084 2006-12-14
WO 2006/001868 PCT/US2005/011045
readings from the two detectors are sampled, digitized and numerically or
otherwise combined to obtain a value for their sum and a value for their
difference. The sum and difference values are plotted in FIG 30 as a function
of time, showing the same data shown in FIG 29. This same data is replotted
(or otherwise encoded) as a succession of time samples in FIG 31 a, but
without the time scale shown. In this plot, each point is shown as a mark
placed at the point where the sum and the difference values correspond to the
positions along the x-axis and the y-axis, respectively. This results in a
trajectory wherein the data values plot to points falling in a closed loop.
The
closed loop shown in FIG 31 is a collection of data points over a time and
number sufficient to infer that the data points represent a span of phase
values. The trajectory figure shown in FIG 31 a, which in general forms an
elliptical trace. A particular point in FIG 31 corresponds to a particular
instance in time, and to a particular phase relationship. It is not apparent
in
the plot as to which plotted (or otherwise encoded) angle corresponds to
which phase angle, but this is not important because the succession of phase
changes is the function that will be correlated between data values collected
for the counter-propagating signals. The position of any sample plotted(or
otherwise encoded) as a point on the closed loop trajectory in FIG 31 a can
be characterized as a radial line of some length and angular orientation
relative to a center of the trajectory pattern. The aspect ratio of the
pattern is
altered to transform the elliptical trace in FIG 31 a into a circular
trajectory as
shown in FIG 31 b, for example by equalizing the radial lengths, thereby
stretching the lateral dimensions of the elliptical trajectory to the extent
necessary to produce a circular one. The phase angle of a sample is now
represented by the angle of its radius in FIG 31 b.
[00199] FIG 32 illustrates a time plot of the calculated and accumulated
phase angles in radians obtained by starting at a first sample and adding the
phase angle change from that sample to the next sample, repetitively to
integrate the change in phase angle over a time (two minutes in this
example). The integrated value of the currently integrated phase compared to
the starting phase value can be termed the "phasor."
-52-
CA 02571084 2006-12-14
WO 2006/001868 PCT/US2005/011045
[00200] FIG 33(a) through (d) plot the phasor change results calculated
based on the above described method. FIGS 33a through 33d each show an
example in which the trajectories and phasors versus time are plotted (or
otherwise encoded) for both counter-propagating optical channels. The size
of the trajectories can be seen to vary. The corresponding phasor change
values substantially overlap. One can conclude that the polarization of the
launch signal can be changed but there is no material effect on the measured
and accumulated value of phase change of the system for the two counter
propagating signals other than an possible polarization induced phase offset..
[00201] The signal to noise ratio can be advantageously improved by using
polarization controllers, but the problem with trajectory size is specific to
rarely
occurring and short-lived polarization conditions, so that polarization
management is not necessary for most users.
[00202] The phasor values correspond to the accumulated phase change.
The absolute value of the relative phase angle is not needed because only the
change is of interest for this example. On the time scale of seconds the two
traces overlap because the phase change for the two counter-propagating
signals is the same.
[00203] If a polarization controller is used in the system, there are several
choices of configuration and operation. As shown in FIG 27 and 28, a
polarization controller 132 can precede the power splitter 121 to control the
incident SOP. A polarization controller 131, can be placed in front of the
power splitter 120. Configuration of the polarization controller such as that
shown in FIG 28 is preferred when an acceptable signal-to-noise ratio, rather
than the maximum one, is sufficient. Any one or more of the polarization
controllers can be provided. The polarization controllers can be tuned to
optimize the trajectory size, or simply switched when necessary to bump the
polarization conditions away from a state at which the trajectory is too small
for effective calculations. The change in wavelength, as discussed before may
also be used to improve the signal to noise of the phasor measurements.
[00204] One polarization related effect is the size of the trace. Because the
interference effect is polarization dependent, if the polarizations of the
interfering beams are not parallel to each other, only those polarization
-53-
CA 02571084 2006-12-14
WO 2006/001868 PCT/US2005/011045
components that are parallel will interfere, resulting in a smaller change in
the
intensity of the signals coupled through to the detectors. This will further
cause the size of the trajectory of the phasor change to be smaller, an
example of a succession of different polarization states being shown in FIG
34. However, the size of the trace does not prevent or affect the phasor
calculation, provided that the trace has a nonzero diameter from which an
angle can be found. The configurations with polarization controllers, shown in
FIG 27 and 28, are non-limiting examples. Other configurations exist.
[00205] Experiments testing these concepts, using the configuration shown
in FIG 28, are demonstrated by data plotted in FIGS 35-37. FIG 35(a) shows
raw trajectory plots of sum and difference detector output values. FIG 35(b)
shows the same data transformed and normalized.
[00206] The data in FIGS 35-37 represent integrated phasor results for two
counter-propagating channels during a phase disturbance event. The good
signal to noise ratio and the appearance of a single closed loop for each
channel indicate that the polarization states have not changed substantially
over the time scale of the event. The amplitude of the raw trajectory data at
about one third to one half of the detector encoding span was more than
sufficient to determine angular phasor data and in the normalized trajectory
graph, the two channels overlap. The phasor data correlated very closely
over the 10 mS span shown in FIG 36.
[00207 Although the data appear overlap exactly in the phasor time plot of
FIG 36, there is a detectable temporal shift shown clearly in FIG 37, arising
from the difference in time of arrival of the signals. This difference in time
is
used to calculate the location of the source of disturbance by correlating the
two signals as discussed previously.
[00208] FIG 38 shows another embodiment of the invention, demonstrating
that it is not necessary to use 3x3 couplers specifically to obtain two
independent phase related variable values from which a trajectory can be
derived. In this embodiment, the 3x3 couplers of previous embodiments are
functionally replaced by cascaded 2x2 couplers. This arrangement also
results in independently varying phase related signals at the detectors. Other
-54-
CA 02571084 2006-12-14
WO 2006/001868 PCT/US2005/011045
configurations also exist and will be known or apparent to those skilled in
the
art seeking to apply the invention.
[00209] Because the inventive system measures the phase relationship
directly for each counter-propagating direction, different events actually are
distinguishable as to the type of event concerned (in addition to its
location),
provided the events have characteristic distinct phase responses. The shape
of the phase response during a disturbance has been found to depend in part
on the way that the fiber was disturbed. A particular type of event may have a
recognizable phase variation waveform over time due to the physical changes
that affect the fiber, such as vibrating parts, lateral or longitudinal
stress,
bending, torque (twisting), etc. An event may also produce a greater or lesser
stress. These phasor shapes may be useful in characterizing the nature of the
disturbances.
[00210] FIG 39 shows an event with an exemplary set of deflection and
ringing aspects. Signature phase variations as shown in FIG 39 can be
matched to received waveforms and may help to characterize some types of
events as known and non-threatening. An example is a recurring natural
event (such wind pressure on a fence), to be distinguished from vibration of a
person climbing the fence. Another example is a low level event (such as the
movement of a small animal, etc.) for which it may be undesirable to trigger
an alarm except during times of particularly high security.
[00211] Several advantageous embodiments have been discussed as
examples, and other arrangement are also apt for certain needs. The
proposed technology is useful for a distributed sensor associated with a fiber-
carrying fence, or a perimeter defense system with in-ground fiber. A fiber
can also be integrated into a wall or other structure. A fiber can be routed
along a series of doors, windows and other portals. A fiber can be routed
laterally across a path to detect a crossing event or longitudinally to assess
progress along the path. Apart from security applications, the same sort of
location sensing can be useful in industrial positioning, counting, level
control
and robotic motion applications. The invention also is applicable to traffic
control systems. Numerous other possibilities should now be apparent from
this disclosure.
-55-
CA 02571084 2006-12-14
WO 2006/001868 PCT/US2005/011045
[00212 According to another inventive aspect, a disturbance detecting and
locating system as discussed can be used in a secure communication system,
particularly in conjunction with optical fibers that are used for
communication
and detection at the same time. If an attempt is made to tap the optical
fiber,
or if other activities in proximity with the fiber even disturb the fiber, a
phase
disturbance occurs that can be detected in the same manner as detection of
an event in an intrusion control system.
[00213 In such an embodiment, the optical communication channel may be
carried over the same fibers as the sensing system or may simply be laid in
proximity with the sensing fiber. For example, in a multi-fiber optical cable,
a
certain number of fibers can function as intrusion sensing fibers while using
the rest of the fibers for data communications. As another example, the same
fiber can be used both for the intrusion detection and carrying data, in a
time
division or wavelength division multiplexed manner. In that case multiple data
channels can be carried over the same fiber while using one channel (or any
number) for detection of intrusion, disturbance or the like.
[00214 The invention has been described in connection with a number of
advantageous embodiments, but it should be appreciated that the invention is
also applicable to other embodiments that are encompassed within the scope
of the appended claims. Reference should be made to the claims rather than
the foregoing description in order to assess the scope of exclusive rights
claimed.
-56-