Note: Descriptions are shown in the official language in which they were submitted.
CA 02573926 2007-01-12
WO 2006/007715 PCT/CA2005/001134
SYSTEM AND METHOD FOR RAPID READING OF
MACRO AND MICRO MATRICES
Field of the Invention
The present invention relates to a device and the reading and data analysis of
an assay
device for identification and quantification of analytes.
Background of the Invention
Micro matrices of bacteria and macro matrices of their respective toxic
proteinaceous
contaminants account for several million cases of food-related illness and
about 9,000
deaths per year in the United States. Contaminated processed food, poultry and
meat
products etc. are a major cause of these deaths and illnesses. The five most
common
pathogens infecting food products and especially poultry and meat products are
E. coli
0157:H7, Salmonella species, Listeria species, Listeria monocytogenes and
Campylobacter jejuni.
Similarly, contamination of water supplies also causes illness and death. The
United
States Environmental Protection Agency has determined that the level of E.
coli in a
water supply is a good indicator of health risk. Other common indicators are
total
coliforms, fecal coliforms, fecal streptococci and enterococci. Currently,
water
samples are analyzed for these micro-organisms using membrane filtration or
multiple-tube fermentation techniques. Both types of tests are costly and time
consuming and require significant handling. They are not, therefore, suitable
for field-
testing.
Accordingly, to prevent infection of consumers through contaminated food and
water
and detection of many disease conditions there is a need for the accurate and
rapid
identification of micro-organisms and markers of the health of a patient. The
accurate,
rapid detection and measurement of micro-organisms, such as bacteria, viruses,
fungi
or other infectious organisms and indicators aggregates in food and water, on
surfaces
where food is prepared, and on other surfaces which should meet sanitary
standards is,
therefore, a pressing need in industrial, food, biological, medical,
veterinary and
environmental samples. Further, in routine inspection of industrial products
for
-1-
CA 02573926 2007-01-12
WO 2006/007715 PCT/CA2005/001134
microbiological contamination there is a need for the early detection of
contamination
to permit rapid release of safe products, and for the rapid, accurate
detection and
measurement of micro-organisms which are not pathogenic but have a role in the
determination of a product's shelf life.
A variety of assay methodologies have been used for determining the presence
of
analytes in a test sample. Assays for detecting micro-organisms generally
require that
the samples be grown in culture. In this assay, the typical practice is to
prepare a
culture growth medium (an enrichment culture) that will favour the growth of
the
organism of interest. A sample such as food, water or a bodily fluid that may
contain
the organism of interest is introduced into the enrichment culture medium.
Typically,
the enrichment culture medium is an agar plate where the agar medium is
enriched
with certain nutrients. Appropriate conditions of temperature, pH and aeration
are
provided and the medium is then incubated. The culture medium is examined
visually
after a period of incubation to determine whether there has been any microbial
growth.
It could take several days to obtain results and requires a technician to read
the agar
plates by visual inspection. Attempts to identify the organisms of interest
can lead to
additional error and delay in time to test results.
Many disease conditions, such as bacterial and viral infections, many cancers,
heart
attacks and strokes, for example, may be detected through the testing of blood
and
other body fluids, such as saliva, urine, semen and feces for markers that are
known to
be indicative of specific conditions. Early and rapid diagnosis may be the key
to
successful treatment. Standard medical tests for quantifying markers, such as
ELISA-
type assays, are time consuming and require relatively large volumes of test
fluid.
There are presently many examples of one-step assays and assay devices for
detecting
analytes in fluids. One common type of assay is the chromatographic assay,
wherein a
fluid sample is exposed to a chromatographic strip containing reagents. A
reaction
between a particular analyte and the reagent causes a colour change on the
strip,
indicating the presence of the analyte. In a pregnancy test device, for
example, a urine
sample is brought into contact with a test pad comprising a bibulous
chromatographic
strip containing reagents capable of reacting with and/or binding to human
chorionic
-2-
CA 02573926 2007-01-12
WO 2006/007715 PCT/CA2005/001134
gonadotropin ("HCG"). The urine sample moves by capillary flow along the
bibulous
chromatographic strip. The reaction typically generates a colour change, which
indicates that HCG is present. While the presence of a quantity of an analyte
above a
threshold level may be determined, the actual concentration of the analyte is
unknown.
Accordingly, there is a risk that a pathogen may be present below a level
sufficient for
either the test to detect its presence, or for the individual assessing the
test strip to
visually observe the confirming colour change of the test strip.
Assays have been developed for providing a quantitative measure for the
presence of
pathogens or analytes of interest. In such a typical test assay, a fluid
sample is mixed
with a reagent, such as an antibody, specific for a particular analyte (the
substance
being tested for), such as an antigen. The reaction of the analyte with the
reagent may
result in a colour change that may be visually observed, or release of
chemiluminescent, bioluminescent or fluorescent species that may be observed
with a
microscope or detected by a photodetecting device, such as a spectrophotometer
or
photomultiplier tube. The reagent may also be a fluorescent or other such
detectable-
labelled reagent that binds to the analyte. Radiation that is scattered,
reflected,
transmitted or absorbed by the fluid sample may also be indicative of the
identity and
type of analyte in the fluid sample.
In a commonly used assay technique, two types of antibodies are used, both
specific to
the analyte. One type of antibody is immobilized on a solid support. The other
type of
antibody is labeled by conjugation with a detectable marker and mixed with the
sample. A complex between the first antibody, the substance being tested for
and the
second antibody is formed, immobilizing the marker. The marker may be an
enzyme,
or a fluorescent or radioactive marker, which may then be detected.
A large variety of assays and other specific binding assay is already known.
These
assays essentially are qualitative lateral flow devices to be read by eye and
quantitative
assays which are to be read by generic reading devices.
Examples of such assays and the materials used are described in detail in
reference
texts "Principles and Practice of Immunoassay", (Price C.P. and Newman DJ,
Eds.)
Stockton Press 1997, ISBN 1-56159-145-0; "The Immunoassay Handbook", (Wild, D.
-3-
CA 02573926 2007-01-12
WO 2006/007715 PCT/CA2005/001134
Ed.) Nature Publishing Group 2001, ISBN 0-333-72306-6 and "Protein
Microarrays",
(Schena, M. Ed.) Jones and Bartlett Publishers 2005, ISBN 0-7637-3127-7.
To date, emphasis has predominantly been placed on the development of
respective
assays, when co-development between assay device and an optimal reading of the
assay in a reading device is needed. The required reader device is not only a
simple
imaging relay device, but should have the capability to interface and
interactively,
recognize the dependent assay device. In order to quantitatively measure the
concentration of an analyte in a sample and to compare test results, it is
usually
necessary to either use a consistent test volume of the fluid sample each time
the assay
is performed or to adjust the analyte measurement for the varying volumes.
Incorporation of specific algorithms, micro-fluidics and ergonomics should
provide an
integrated system for application of a method when reading micro and macro
matrices.
There is need of a system and method which can efficiently, rapidly and
accurately
read an assay for determining the presence of analytes in a sample and for
determining
the quantity of respective analytes in the sample in an efficient, simple and
reliable
manner.
Summary of the Invention
The present invention provides an analyte reading system which includes an
analyte
reader device for rapidly detecting and measuring the presence of analytes of
test
sample in a co-dependent assay device. Quantitative and qualitative
measurements of
analyte concentration in a sample may be rapidly obtained using the reader
device
with preset algorithms which also ascertain the nature of the assay being
read, provide
controls and can prevent erroneous duplication of measurement of that assay.
According to a method of the present invention, the reader device can detect
from a
reading area of an assay device, control reference spots from which the system
can
calculate or ascertain the nature of the assay or assays conducted in the
assay device,
meter the volume of test sample and read simultaneous reference calibration
curves in
the assay device. The calibration matrices, which are measured within the
assay
-4-
CA 02573926 2007-01-12
WO 2006/007715 PCT/CA2005/001134
device as the test sample concentrations are measured, allows the reading
device to
generate respective calibration curves to be used in the deriving the actual
concentrations of the unknown analytes contained in the test sample.
According to another aspect of the present invention, the reader device can
scan preset
areas of an assay device in order to provide focal points for the reader
device and
evaluate the volume of the test sample in the assay device. This aspect of the
invention permits the reader device to adjust the analyte measurement for
varying
volumes.
According to another aspect of the present invention, there is provided a
reading
system for reading and measuring the outcome of an assay in an assay device
containing a labelled analyte, comprising a positioning stage for holding the
assay
device in a desired position, a light sensor, an optical system comprising an
excitation
light source for illuminating a labelled analyte, and a dichroic mirror for
reflecting
excitation light to the analyte and light emitted by the dye to pass through
to the light
sensor, and a computer for processing the signal detected by the light sensor
to
generate a measurement of analyte density on a detected portion of the assay
device.
According to yet another aspect of the present invention, there is provided a
method of
reading an assay device containing a labelled analyte, comprising the steps of
illuminating a portion of the assay device containing a test sample, detecting
an
intensity of light emitted by the test sample in a single image field, and
generating a
measurement of analyte density in the test sample based on said intensity
detection.
According to another aspect of the present invention, there is provided, a
method of
reading an assay device containing a fluorescently labelled analyte,
comprising the
steps of illuminating a portion of the assay device containing a test sample
of
unknown analyte density, illuminating a portion of the assay device containing
a
calibration sample of known analyte density with an excitation light,
detecting an
intensity of light emitted by the unknown concentration of test sample and an
intensity
of light emitted by the known concentration of calibration sample in a single
image
field, and comparing the intensity of light emitted by the unknown
concentration of
-5-
CA 02573926 2007-01-12
WO 2006/007715 PCT/CA2005/001134
test sample to the intensity of light emitted by the known concentration of
calibration
sample to generate a measurement of analyte density in the test sample.
The present invention thus provides an analyte reading system consisting of a
unit for
reading and measuring the qualitative and quantitative outcome of an assay in
an assay
device for a labelled analyte, comprising an X-Y-Z positioning stage for
holding the
assay device in a desired location, a light sensor, and an optical system
comprising an
excitation light source for illuminating a labelled analyte, and a dichroic
mirror for
reflecting excitation light to the analyte and emittor radiation to pass
through to the
light sensor.
The present invention further provides an analyte reading system for measuring
the
outcome of an assay in an assay device containing a fluorescently labelled
analyte,
comprising a positioning stage for holding the assay device in a desired
position, a
light sensor, an optical system comprising an excitation light source for
illuminating a
fluorescently labelled analyte, and a dichroic mirror for reflecting
excitation light to
the analyte and light emitted by the fluorescent dye to pass through to the
light sensor,
and a computer for processing the signal detected by the light sensor to
generate a
measurement of analyte concentration on a detected portion of the assay slide.
The present invention further provides a method of reading an assay device
containing
a fluorescently labelled analyte, comprising the steps of a. illuminating a
portion of
the assay slide containing a test sample; b. detecting an intensity of light
emitted by
the test sample in a single image field; and c. generating a measurement of
analyte
density in the test sample based on said intensity detection.
The present invention further provides a method of reading an assay device
containing
a fluorescently labelled analyte, comprising the steps of: a. illuminating a
portion of
the assay slide containing a test sample of unknown analyte density and a
portion of
the assay slide containing a calibration sample of known analyte density with
an
excitation light; b. detecting an intensity of light emitted by the test
sample and an
intensity of light emitted by the calibration sample in a single image field;
and
c. comparing the intensity of light emitted by the test sample to the
intensity of light
-6-
CA 02573926 2007-01-12
WO 2006/007715 PCT/CA2005/001134
emitted by the calibration sample to generate a measurement of analyte density
in the
test sample.
Brief Description of the Drawings
In drawings which illustrate by way of example only a preferred embodiment of
the
invention,
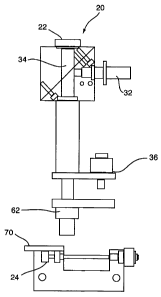
Figure 1 is a schematic view of a Reader Device of the present invention;
Figure 2 is a flow-chart of the image processing in the Reader Device of the
present
invention;
Figure 3 is an a micrograph of a focus spot in the Assay Device as read by the
reader
device of Figure 1;
Figure 4 shows a map of the virtual window assignment for the reading area of
the
Assay Device shown in Figure 7;
Figure 5 illustrates the Assay Device identification arrays and encoding
algorithm;
Figure 6 illustrates the Assay Device control array;
Figure 7 is a schematic drawing of a reader-compatible Assay Device;
Figure 8 illustrates a calibration array and a capture array in the viewing
area of an
Assay Device;
Figure 9 is an example of typical calibration and capture arrays;
Figure 9A is a graphical representation of a Fixed Array layout;
Figure 10 plots the data for Fluorescence Response against concentration for
Calibration and Capture Array responses;
Figures 11A and 1 lB show the calibration arrays compared to patient plasma
testing
for exposure to Toxoplasma gondie;
-7-
CA 02573926 2007-01-12
WO 2006/007715 PCT/CA2005/001134
Figures 12A and 12B are schematic illustrations of an Acquired Pathogen Array
(APT) and a Protein Array, respectively;
Figure 13 illustrates core sections of Tumour Tissue section arrays; and
Figure 14 is a schematic view of an analyte reader system of the invention
incorporating the Reader Device of Figure 1.
Detailed Description of the Invention
The present invention provides an analyte reading system and method for the
rapid
reading of macro and micro matrices. A macro matrix consists of objects to be
detected and measured when the objects are molecular aggregates ranging in
size from
about 5 m (micrometers) to about 1000 m. These objects are usually planar,
essentially two dimensional or flat spots that are attached to a substrate
contained in
the assay device. A macro matrix is defined as a "fixed macro array"
containing
multiple spots, each located at known X-Y locations in the assay device. The
locations
of individual spots that make up an array, have pre-determined centre-to-
centre
spacing. Location of the spots which make up the arrays in a matrix is found
automatically by the reading device from a primary reference spot also on the
assay
device. The reader focuses on the spots in the plane of attachment. A "fixed
macro
array" is further characterized into being a "fixed macro test array" for
detection and
measurement of unknown concentrations of test sample and "fixed macro
calibration
array" for the generation of respective calibration curves from known
concentrations
of calibrators. Both types of arrays are read by the reader within the same
assay device
for each test to obtain accurate quantitative measurement of analyte
represented in the
molecular aggregates.
A micro matrix ranges in size from about 0.25 m to about 5 m. These objects
are
usually discrete micro-organisms or particles that tend to be randomly
distributed in
three dimensional space defined by the volume of test fluid in the assay
device. A
micro matrix is defined as a "random micro array" containing free floating,
three-
dimensional objects suspended in three-dimensional space.
-8-
CA 02573926 2007-01-12
WO 2006/007715 PCT/CA2005/001134
Example 1
As illustrated in Figure 1, the preferred embodiment of the analyte reading
device 20,
has a fully automatic analytical interface with a co-functional assay device
and an
imaging device such as a CCD camera 22 which transmits signals to a general
purpose
computer integrated into the system. The reader device 20 has a stage 24,
stage
movement (X and Y axes) for assay device positioning 70 and auto-focusing (Z
axis)
for image clarity and resolution 36, controlled by servo motors through a
suitable user
interface, such as a touch-pad or touch-screen control board.
In the preferred embodiment the computer is programmed to process the signal
returned by the CCD camera 22 to provide accurate assay identification and
results, as
described in detail below; however the computer may also be programmed to
control
the functions of the analyte reading unit via user displays and touch-screen
activation
of functions. The reader device has an optics assembly 62. Optics assemblies
known
in the art may be used for the purposes of the present invention. The
microscope 20
also has a dichroic mirror 34 and an auto- focus mechanism 36. A laser 32 is
connected to the dichroic mirror 34. The options assembly 30, shown in Figure
14,
controls the laser 32 that is adapted to apply energy to the dichroic mirror
34 that
forms part of the microscope 20.
Example 2
The flowchart illustrated in Figure 2 outlines the processing logic of the
reader device
and the Assay Device when the test sample has been prepared using the Assay
Device
assembly. Once the Assay Device is inserted into the reader and the user
presses
'Begin Scan' the Reader device X-Y stage draws in the Assay Device to center
the
viewing area of the assay device.
Example 3
The Assay Device is illuminated under a bright field (LED light source) and a
100x100 pixel image is captured to view and analyze the focus spot, Figure 3.
The Z-
axis is adjusted to determine the optimal focus and the Z-axis position is
stored as Z1.
-9-
CA 02573926 2007-01-12
WO 2006/007715 PCT/CA2005/001134
The auto-focus spots are molded into the Assay Device at time of
manufacturing.
These features are approximately 80x 80 m +/- l0um in size also 25-30 m in
focusing depth and are imaged using the full-spectrum LED light source.
The stage auto-ranges and moves so that the image center is located at the
exact center
of the focus spot in window 117. Repeating the 1 OOx 100 pixel image capture
and
analysis with Z-axis adjustment again focuses the image. The new Z-axis
position is
stored as Z2. Finally, the stage is moved so that the image center is located
at the
exact center of the window 105. The image is focused again and the new Z-axis
position is stored as Z3.
An optimal focus plane is then calculated using Z1, Z2, and Z3, after which
the Z-axis
is calculated for the optimal focus value for each focus spot location.
The stage is then moved to the center of window 1 which contains the Assay
Device
Identification array and a full 1024x768 pixel window is captured under a
laser
illumination. The captured image is analyzed and the Assay Device Assay Type
is
determined. The assay type identifies the analyte organism and whether the
assay is a
fixed or random array. The stage is then moved to window 14 where a duplicate
assay
identification array is located. The second array is imaged and analyzed and
the results
are compared to ensure that the correct assay type has been determined. Should
the
two differ, the test will halt and the operator will be notified.
Based on the assay type, the Reader will then either process the Assay Device
as a
random array (typically microbial identification and quantification) or will
begin fixed
array processing.
In operating the system, a user places an assay device that is to be read onto
the stage
24, Figure 1. The system then applies an initialization and an auto-
calibration routine.
The auto-calibration is referenced to an emission standard, which, under
software
control, tests and calibrates the optics assembly as needed. The performance
levels of
the instrument are monitored via remote access, e.g. the internet, and may be
adjusted
also by remote control.
-10-
CA 02573926 2007-01-12
WO 2006/007715 PCT/CA2005/001134
Example 4: Assay Device Virtual Window Construct
The reader is interactive with the assay device in that the viewing area of
the assay
device is partitioned into virtual areas of viewing or imaging.
Figure 4 shows the layout and numbering of the virtual windows ascribed to the
viewing area of the assay device. The locations of the special purpose windows
are
highlighted in Figure 4.
Example 5: Assay Device Identification Array and EncodingAlgorithm (Virtual
Windows 1 and 14)
The Assay Device Identification Array is a 4 x 3 grid of 80 m +/-10 m
diameter
spots arrayed on a 150 m +/-10 m pitch. The grid is left-justified and placed
in
virtual window 1 with a duplicate array replicated in virtual window 14.
The Assay Device Identification Array is comprised of two elements - a
reference
column of three spots that will always be present and a 3 x 3 array that is a
binary
encoding that, when decoded, will give an Assay Device ID that uniquely
identifies
each type of assay.
The binary encoding will be from least significant to most significant from
left to right
across the three columns. To increase the reliability of the identification
algorithms,
the binary values "000" and "111" will not be permitted in any column.
Therefore
there are 6x6x6 = 216 valid Assay Device IDs. Should additional values be
required in
the future, there is space to add additional columns to the array. Adding
another
column of 3 spots will produce 1296 valid Assay Device IDs. This is
effectively using
Base 6 to encode the values, with an offset of 1(i.e. "0" will never be
valid).
Figure 5 encodes 010 110 010 which translates to Assay Device ID #262.
The purpose of the reference column of three spots is to ensure that the Assay
Device
ID software always locates the left edge of the array. Assay Device ID values
are not
allowed to be "111" to ensure that the algorithm can differentiate a valid
numeric
column from the reference column. Similarly, "000" is not permitted so that
the
algorithm will always have at least one spot in a column. The unique
identification
-11-
CA 02573926 2007-01-12
WO 2006/007715 PCT/CA2005/001134
code can be obtained from the specific Product Plot allocated in the product
part
number. e.g. Listeria Genus has Plot Number LIG02001 with ID of 111.
Example 6: Assay Control Array (Virtual Window 59)
The Assay Control Array, located in Window 59, is present only in Random Array
assays. It consists of a left justified 2 x 3 array of 85 m +/-l0 m diameter
spots on a
150 m +/- l 0 m pitch.
The Assay Control Array is used as a positive control to ensure that the assay
is
functioning correctly. Each control spot is composed of denatured organisms of
the
assay's analyte. For example, the control spot on a Listeria Assay are
composed of
denatured Listeria.
When the sample is introduced into the Assay Device assembly, the excess
labeled
antibodies will react with and collect on the control spots. The window is
imaged
using the laser excitation source and the assay is presumed to have worked
correctly if
the spots are emitting signal. The control spots will not emit any signal if
an incorrect
sample preparation is used.
The combination of imposing sequential, dedicated areas of illumination to be
examined, allows only the window under examination to be illuminated. The
surprising benefit is that while this window is being examined, the remaining
viewing
area is not being irradiated and therefore preserves optimal detection output.
This
results in specimen preservation which is in direct contrast to standard
readers which
expose the whole viewing area to continually scanning irradiation. The assay
device
preferably has at least one identification coding dot that is detected by the
reader
system to provide identification of which assay is being tested and ensure
that the
appropriate sub-routine or multiple sub-routines for image analysis is read
and
accordingly which routines and calculations need to be carried out.
In one embodiment of the invention the analyte reading system is designed to
detect
micro-organism antigens marked or coated with an indicator such as a
fluorescent
labelled antibody. In this embodiment the analyte reading system can be used
to
determine the concentration in a given sample of the micro-organism antigen.
The
-12-
CA 02573926 2007-01-12
WO 2006/007715 PCT/CA2005/001134
antigen concentration, which can be used as a measure of the micro-organism
concentration from a sample, such as a food sample, can then be compared with
an
acceptable analyte concentration limit and a pass/fail response reported to
the user.
In this embodiment of the invention the analyte reader unit is adapted to read
and
detect specifically labelled analytes in an assay slide or assay chip into
which the
analyte sample is placed. One fluorescent dye suitable for labelling bacteria
for use in
the designed assay chip is AlexafluorTM 647nm dye. It is the assay chips which
are
presented to the analyte reader for scanning. One skilled in the art will
appreciate that
alternatives to fluorescent labelling can also be used. Whichever labelling
system is
used, the light source (which may include electromagnetic radiation ranging
from
ultraviolet to infrared) for imaging and the detector must be matched, and may
be
collectively referred to as the imaging system.
Example 7: Operation of the Random Array Assay Device Format
The Random Array reading format is technology unique to the present invention.
Pathogens are tagged with fluorescent dye markers, including use of organism-
specific
antibodies, receptor binding and other methods known in the art. The now
fluorescing
pathogens are directly enumerated in a known sample volume, resulting in
accurate,
quantified test results. The random array format uses also ELISA immuno-
chemistry
for "on-chip" calibration purposes and as positive control. The system
actually counts
individual micro-organisms to establish the concentration of micro-organisms
in the
tested sample. The accuracy of this count when compared to the current agar
plating
and incubation leading to a physical count of colonies grown gold standard
method,
has confirmed a 1:1 concordance.
Both the Random and Fixed array share a common system platform - the Assay
Device, Analyte labeling and the Reader Device. The assay device, for use with
reader, in the preferred embodiment has the following main characteristics:
=All required chemical compounds needed to process a sample are contained in a
single-use, disposable, Analyte labeling applicator. No specialized training
is
required to use the assay device.
= The liquid sample is drawn from the sample loading area into the sample
reading
-13-
CA 02573926 2007-01-12
WO 2006/007715 PCT/CA2005/001134
area by means of almost instantaneous fluid transfer.
= The fluid sample is optionally processed through a tunable dynamic
separation
matrix during the fluid transfer phase to exclude background contamination.
= The amount of test volume contained in the sample reading area is self-
metering
and has a fixed volume. Once the sample reading area is filled, no additional
fluid is drawn from the sample loading area.
= All Assays are automatically self-calibrating.
= All Assays are single use. Once a chip has been read and the data processed,
it is
automatically marked in a way that will prevent the reader from processing a
chip a second time.
In the embodiment for reading and counting the actual number of specific
microbes
contained in a known sample volume of fluid as measured by the assay device,
the
optical imaging system sequentially examines cylindrical fluid volumes of
sample
held under the viewing area of the Assay Device. The reader proceeds to scan
and
count the micro-organisms contained in each of these "optical volumes" and
calculates and displays a requisite concentration upon completion of the
window
scans. The virtual windows, or 3-D matrix volumes, are created by the x/y co-
ordinates which drive the Reader stage. The interaction of the reader and the
assay
device therefore creates virtual windows as an x/y matrix, in which each
virtual
window, or optical volume, contains signal generating micro-organisms in the
format
of a three-dimensional random array within the optical volume. Because these
micro-
organisms or particles are not fixed to a substrate but are in suspension and
because
they are generally less than about 5 micrometers in size, they are defined as
"random
micro matrices". An added advantage of rapid, automatic, sequential optical
volume
imaging, is that particle counting error and background is significantly
reduced as a
sample optical volume is being scanned because the reader detects and measures
micro-fluidic parameters to also discriminate true micro-organisms from random
background contamination. These parameters include signal to noise ratio
analysis,
fitting the detected micro-organisms into size categories, background
subtraction and
particle movement analysis.
-14-
CA 02573926 2007-01-12
WO 2006/007715 PCT/CA2005/001134
Example 8: Reader processing of Random Array Assay Format
The Random Array method is used test for the presence of pathogenic organisms.
The
organism is tagged with a fluorescent dye and the number of organisms present
in a
sample is directly enumerated by the Reader.
Imprinted on the underside of the sample viewing area are six positive-control
dots.
These dots are imprinted at time of manufacture with the pathogen of interest.
During
the fluid transfer phase, significant populations of the loose pathogen-
specific
antibodies are bound to the positive-control dots. This serves as the positive-
control
aspect of the test.
The Assay Device is then inserted into the reader for automated analysis.
Printed on the Assay Device is an assay-specific identifier. The reader seeks
to the
specific location of the Assay Device containing the assay-specific identifier
and loads
any pathogen-specific analysis routines. The reader then locates and confirms
that the
positive-control dots have been tagged with the loose antibodies. If an
incorrect
analyte labeler has been used to dispense the sample, the reader will
recognize that the
test has been compromised and the test run will terminate with an appropriate
notification message.
Once the positive-control test has completed, the reader proceeds to
processing the
chip and enumerating the pathogenic organisms tagged with fluorescent-dye (via
the
pathogen-specific antibodies). The processing steps conducted are as follows:
= The sample viewing area is divided into more than 100 individual virtual
sample
windows. These sample windows are referred to as optical volumes.
= The reader detects and enumerates the number of dye-tagged pathogens found
in
each optical volume.
= Given that each optical section is of a known volume, it is, therefore,
possible to
calculate and quantify the number of pathogens found in the sample.
= The reader processes the 100+ optical sections in approximately 4-5 minutes
and
reports the number of Pathogens per milliliter to the operator on the front
panel.
-15-
CA 02573926 2007-01-12
WO 2006/007715 PCT/CA2005/001134
= Given that the reader is able to average the detected pathogen population
over a
significant number of optical volumes, a high degree of confidence level is .
achieved.
The results are available for reporting to QA systems or for hard copy
printout.
In a preferred embodiment the optical system consists of five parts: a light
source such
as a laser light source, a light emitting diode (LED) ring light source, a
filter cube, a
microscope objective lens, and an optical tube with focussing. In this
embodiment the
laser light source preferably has a peak spectral emission at 635 nm. The
laser spectral
emission at 635 nm then passes through an excitation filter of the filter
cube. This
excitation filter is used to control the bandwidth and wavelength of light
that will
reach the assay chip assay chip in the analyte reader unit. In this embodiment
the
excitation filter allows only the 635nm emission line from the laser light
source to be
passed to the filter cube's dichroic mirror, which then reflects this light
down the axis
of the optical tube towards the microscope objective lens. The laser light is
focused on
the assay chip assay chip by the microscope objective lens and causes the
labelling
marker, in this embodiment the AlexafluorTM 647nm fluorescent dye attached to
the
antibody bound (directly or indirectly) to the analyte to fluoresce and emit
light with a
peak intensity at 668nm.
In a preferred embodiment of the invention, the assay chip containing the
labelled test
sample also has focus spots. To ensure accuracy in this embodiment of the
invention,
the analyte detector device ideally will auto-focus the optical system by
reference to
the focus spots carried on the assay chip. When the analyte detector device is
focussing by imaging the focus spots on the assay chip in this embodiment the
laser
light source used to provide the excitation of the labelled sample is
prevented from
illuminating the assay chip. This may be achieved in a variety of ways such as
switching off the laser or blocking the light from the laser light source from
entering
the filter cube. The bright field illumination of the assay chip for imaging
of the focus
spots in this embodiment is provided by side illumination of the assay chip
from the
LED ring light source. In one embodiment the bright field side illumination of
the
-16-
CA 02573926 2007-01-12
WO 2006/007715 PCT/CA2005/001134
assay chip is provided by four LumexTM SSL-LX5093SRC/E 3500mcd 660nm high
brightness LEDs which are used in an LED ring around the microscope objective.
A suitable microscope objective lens for this embodiment of the invention is
an
Edmund Industrial OpticsTM R43-906 4x plan achromatic commercial grade
standard
microscope objective lens with a working distance of 13.9mm, which is used to
focus
an image of the bacteria on the CCD image sensor. This objective lens is
designed to
produce an image at 150mm from the top edge of the objective lens.
In this preferred embodiment of the device of the invention, a light-
impervious metal
optical tube is used to house the optics of the optical reading unit. The
purpose of this
optical tube is to prevent interference with the detected signal, the
excitation light and
emitted light by peripheral or external light sources. This optical tube is
grooved and
the entire assembly is anodized to reduce the reflection of light and prevent
reflection
of light from the optical assembly directly onto the image sensor. The optical
tube
provides a conduit for the light from the excitation source and the emitted
light from
the labelled analyte between the microscope objective lens and the filter
cube. In this
preferred embodiment the microscope objective lens is attached to the lower
end of
the optical tube and the filter cube is attached to the upper end of the
optical tube. One
way in which the filter cube and microscope objective lens can be attached to
the
optical tube is using threaded attachment.
In the preferred embodiment of the invention a Point Grey Research Dragonfly
IEEE-
1394 monochrome CCD camera is used to capture images of fluorescing analytes.
This camera contains an ICX204AL 1/3" black and white, 1024x768 pixel, CCD.
image chip with a pixel size is 4.65um x 4.65um. The camera in this embodiment
is
powered from the IEEE-1394 bus and has an interface protocol which is
compliant
with the IEEE IIDC DCAM V1.3 specification.
Thus, the analyte reading system of the invention can be used to carry out a
preferred
embodiment of the method of the invention, which comprises illuminating a
portion
of the assay slide containing a test sample of unknown analyte density and a
portion of
the assay slide containing a calibration sample of known analyte density with
the
excitation light; detecting an intensity of light emitted by the test sample
and an
-17-
CA 02573926 2007-01-12
WO 2006/007715 PCT/CA2005/001134
intensity of light emitted by the calibration sample in a single image field;
and
comparing the intensity of light emitted by the test sample to the intensity
of light
emitted by the calibration sample to generate a measurement of analyte density
in the
test sample.
The optical tube is also provided with a focussing means, in this embodiment
using a
stepper motor focussing assembly. In an embodiment of the optical tube a
Hayden
Switch and InstrumentTM 26463-12-003 26mm 12V captive unipolar linear actuator
stepper motor is used to move the lower end of the optical tube along the Z-
axis. The
Z-axis is perpendicular to the plane defined by the assay chip in position on
the
positioning stage. Thus movement in this Z-axis provides focussing of the
microscope
objective lens on the assay chip.
A metal frame is used to keep the filter cube, optical tube, image board, and
positioning stage in fixed positions relative to each other. The positioning
stage is
used to move the assay chip in the X-Y plane relative to the microscope
objective
lens. The Y-axis is along the short dimension of the plane of the assay chip
which is
perpendicular to the longitudinal axis of the optical tube. The assay chip is
inserted
onto the positioning stage along the Y-axis of the assay chip. The X-axis is
along the
long axis of the plane of the assay chip which is perpendicular to the
longitudinal axis
of the optical tube. The positioning stage can be moved in the X-Y axis using
two
motors, for example two Hayden Switch & InstrumentTM motors. In one embodiment
a 26mm 12V captive unipolar linear actuator stepper motor is used to drive the
stage
in the X-axis over a 12.7mm total displacement distance. Similarly, a 26mm 12V
non-
captive unipolar linear actuator stepper motor is used to drive the stage in
the Y-axis
over a 38.1mm total displacement distance. These examples of motors have a
step size
of 0.005" (or approximately 12.7 m).
The reference (or home) position for the positioning stage is found by moving
the
positioning stage to a preset position (usually to the limit of its range of
movement in
the X and Y-axes). At the reference position an electrical contact is
established with
two detector switches mounted on the positioning stage. One type of detector
switch
suitable for this application is PanasonicTM Type ESE11HS1. Optionally, the
-18-
CA 02573926 2007-01-12
WO 2006/007715 PCT/CA2005/001134
positioning stage can be controllably moved to the locations of several
reference
marks or points on the assay chip for accurate optical calibration.
Example 9: Fixed Array Macro Matrices Specifications and Processing
The system of the present invention also reads Fixed Array Macro Matrices and
non-
biological assays. Each individual fixed array is comprised of two macro
matrices - a
calibration array which is used as an internal calibrator and a capture array
which is
used to determine the concentration of the target analyte. Each grid is
located in an
individual window with an empty window separating them. Therefore, a total of
three
windows are used for each fixed array. A clear perimeter of windows is
reserved on
the perimeter of the Assay Device and an empty column and an empty row of
windows is reserved between the active windows. This allows a maximum of 12
possible locations for fixed arrays on the Assay Device, as shown in Figure 8.
Example 10: Calibration Array
Figure 9 highlights a calibration array in window 17 and a capture array in
window 43.
The calibration array consists of a six-element dilution series of the antigen
of interest.
The calibration array matrix has three identical replicas of the dilution
series. The
dilution factor of two is typically used, but factors of 10 can be used. When
the
analyte is introduced, the excess labeled antibodies bind with the spots in
the dilution
series spots and fluoresce proportionally when excited by the illumination
laser
source. The reader takes a single image of the calibration array. The
fluorescence
intensity for each element of the dilution series from each of the three
replicas is
measured and a response curve is calculated. This establishes the relationship
between
the fluorescent intensity of the spots with known antigen concentrations. The
calculated response curve captures the antigen of interest and its
interactions with the
labeled antibody at different concentrations.
Typically, dilution series are arranged in a decreasing or increasing order of
concentrations. However, the dilution series in the calibration array is
geometrically
ordered from the outside inwards. The concentrations, in decreasing order, are
-19-
CA 02573926 2007-01-12
WO 2006/007715 PCT/CA2005/001134
allocated to alternating left-most and right-most available columns as
described in the
following table, typically using 2:1 dilution factor per calibration location:
Dilution Concentration Column
Original 100% 1 (left-most)
Dilution 1 50% 6 (right-most)
Dilution 2 25% 2
Dilution 3 12.5% 5
Dilution 4 6.25% 3
Negative Control 0% 4
This arrangement ensures that the most dilute spots are well framed within the
higher-
dilution spots to facilitate recognition and enhance analysis quality and
speed of
detection.
Figure 9A, shows a graphical representation of the Fixed Array layout.
Example 11: Capture ArraX
The capture array is a 9-element (3 x 3) grid of capture antibodies. Each one
of these 9
identical replicas is a possible binding site for free floating labeled-
antigen analyte
complexes. The reader's stage is moved to the capture array and an image is
obtained.
The fluorescence responses of a119 replicas are recorded and a representative
statistical value (average, mode, or median) is calculated. This value is
considered to
be the response of the analyte. It is compared to the values of the antigen
dilution
series response curve and a corresponding concentration is deduced by matching
the
analyte response to the equivalent intensity in the calibration curve
calculated from the
calibration array. Thus, an accurate, quantitative and statistically
significant result is
provided with high confidence.
The graph shown in Figure 10 represents the results of fixed array processing.
Each of
the dilution series is plotted (from highest to lowest) and the average of the
three
series is calculated. Each of the nine capture locations is then plotted
against the
dilution curves and the average concentration is derived. In addition, data
such as
-20-
CA 02573926 2007-01-12
WO 2006/007715 PCT/CA2005/001134
min/max, standard deviation and coefficient of variability (+/-CV) can also be
reported.
The test dots include reagents that specifically bind to the analyte for which
the assay
is directed. The reagent is preferably a bound antibody specific for the
analyte. The
bound antibodies are preferably spaced apart to make each bound antibody
available
for binding to the test antigen free of stearic hindrance from adjacent
antigen
complexes.
The results of the assay device Figure 7, is read and calculated by the reader
system of
the present invention. To determine the concentration of analyte in a sample,
the
concentrations of two characteristic assay reagents are predetermined. A
relationship
between a fluorescent intensity of the fixed test dots in a series of samples
with known
antigen concentrations is determined. An example of a relationship between
fluorescent intensity of test dots and known antigen concentration is a sample
is
shown in the form of a graph as shown in Figure 10. Next, a relationship
between
fluorescent intensity of the calibration dots and the amount of antigen in the
calibration dots, determined by using excess detection antibody, as shown in
Figure
10. From Figure 10, an association between the antigen in the sample and the
antigen
dot concentration is determined. The calibration curve serves as an array-
specific
standard curve for the determination of the antigen concentration in the
samples. The
calibration curve is calculated by the reader system of the present invention
based on
the light intensities of the calibration dots containing known amounts of
analyte.
In the instance of a sample of unknown antigen concentration, the sample is
premixed
with an excess of detecting antibody. This solution is applied to an assay
device such
as the assay device shown in Figure7. The fluorescent intensity of the test
dots is
normalized against the calibration curve for that particular analyte to
provide a
normalized test dot value. This normalized test dot value is then read off the
calibration curve shown in Figure 10 for that analyte to give the
concentration of
analyte in the sample.
This preferred embodiment applies directly to a format described as detection
of
"fixed array macro matrices". In this instance, the analyte/protein complexes
are
-21-
CA 02573926 2007-01-12
WO 2006/007715 PCT/CA2005/001134
generally much larger than micro-organisms and attached to a substrate. The
dots are
printed for optimal diameter and as droplets ranging in volume from pico to
nano
liters. The virtual window format is again of great advantage in that both
signal is
conserved and x/y positioning of dot matrices is maintained. The reader tracks
array
position and composition and therefore locates and identifies each dot in any
fixed
array. Because each dot has a known location and identification, the reader in
concert
with the assay device, needs only a single label exitation source to generate
a detection
signal. Fixed Array images are automatically tracked as the initiation point
of the array
is also the registration of origin.
Another preferred embodiment of the present invention is the use of multiplex
array
formats. Two predominant formats are used. The first consists of a single
test, which
is then printed several times, on the same substrate, including both test
arrays and
calibration arrays. The ability to run these tests simultaneously using a
common
patient sample, dramatically increases the confidence limit that the test
results are in
fact correct. Receiver - Operator curves (ROC curves) can reach better than a
99%
assurance that the test results are correct. The second format uses multiple
arrays of
different assays printed on the common substrate, each with multiple
calibration
arrays. The reader device of the present invention automatically locates,
reads and
analyzes these arrays with femtomole sensitivity. Because the arrays are
located
according to x-y co-ordinates, only a single illumination source is required.
Example 12: Fixed Array to test for the presence and concentration of s en
cific
proteins
Each unique fixed-array proteomic assay is comprised of two components - a
specific
Assay Device and a corresponding Analyte Labeling applicator. A calibrated
sample
amount of the sample is labelled, shaken for 10 seconds and incubated for five
minutes in a glass vial. Contained within the labeling chemistry are two main
constituents. These are:
= Protein-specific antibodies conjugated with a specific-wavelength dye;
= An additional dye that provides the operator later with visual confirmation
that
the sample reading area of the Assay Device is correctly flooded with the test
sample.
-22-
CA 02573926 2007-01-12
WO 2006/007715 PCT/CA2005/001134
The proteins of interest are tagged with the conjugated antibodies during the
five-
minute incubation period.
Once the incubation period is finished, the test operator discards the first
two drops
and the third is then dispensed onto the sample loading area. The test sample
is drawn
into the sample viewing area and in so doing is passed through the separation
matrix.
The separation matrix filters out any sample impurities e.g. blood cells and
delivers
the test sample onto the test viewing area containing:
= Proteins tagged by protein-specific antibodies conjugated with fluorescent
dye,
= Sample fluid dyed blue for confirmation that the sample viewing area was
correctly filled, and
= Protein-specific antibodies conjugated with fluorescent dye
The laminar flow of the fluid transfer causes the test fluid to be drawn past
and
exposed to two sets of protein arrays that are printed on the surface of the
array. These
are:
= Calibration spots, with varied concentrations of the protein of interest,
and
= Test spots, which contain the capture antibody.
The non-analyte complexed fluorescing antibodies bind to the calibration dots
which
are printed as a concentration gradient format ranging in concentration of
12.5 /ml to
200 /ml of human IgG, shown in Illustration 12A. This test array contains 5
calibration concentrations, repeated three times in three separate arrays to
provide the
basis for automatic calibration of the test. The tagged proteins in the sample
fluid are
captured by analyte protein-specific antibodies in the test locations as shown
in
Illustration 12B for a patient's plasma sample being tested for a reaction to
Toxoplasma.
Patient Serum Analysis: Fixed Arrays printed in picoliter format. Images were
developed by incubating the chip with patient serum, washing, and then
incubating
with Goat anti-human IgG conjugated to DY47 fluorescent dye. The Assay device
was
then inserted into the reader of the present invention for automated analysis.
-23-
CA 02573926 2007-01-12
WO 2006/007715 PCT/CA2005/001134
A further embodiment of sequential virtual window array scanning allows the
reading
of signal from tissue sections. Appropriately labelled tissue samples are
investigated,
imaged and digitally recorded. All images undergo digital image processing and
are
optionally stored for record keeping and regulatory purposes.
A typical Acquired Pathogen Titer Array (APT), which presents single
concentration
spots, is made up as in the example shown in Figure 12A. In this array the
specific
HIV antigen on the sandwich assay bottom is the target. The middle is a Human
IgG
HIV antibody specific to the HIV antigen, and the top reporter labeled with a
specific
anti antibody to Human IgG. This is in contrast to a standard protein array
shown in
Figure 12B, which presents multiple calibration spots, in which the bottom is
generic
Human IgG antigen and the reporter is labeled with a specific anti-Human
antibody to
Human IgG.
Both types of arrays are read by the reader within the same assay device for
each test
to obtain accurate quantitative measurement of analyte represented in the
molecular
aggregates.
Example 13: Tissue sections analysis
Tissue cores, about 0.5 tol.5 mm in diameter are punched out of fixed tissue
samples
and embedded into paraffin blocks. Three cores from each tissue are assembled
into
an array in a second paraffin block. Sections are cut with a microtome to be
arranged
in comparative tissue section arrays on an Assay Device. The tissue arrays are
attached to the viewing area of the Assay Device of the present invention to
be
immuno stained for specific markers as shown in Figure 13.
Example 14
In order for the method of the present invention to have optimal reciprocity
with both
reader and assay devices the following control parameters constitute an
integral
sequence for routine auto-analysis.
Printed on the Assay device is an assay-specific identifier. The Reader of the
present
invention seeks to the specific location of the Assay device containing the
assay-
specific identifiers and loads any test-specific routines.
-24-
CA 02573926 2007-01-12
WO 2006/007715 PCT/CA2005/001134
The Reader then locates and confirms that the calibration dots have been
tagged with
the respective antibodies. If an incorrect Analyte Labeler has been used to
dispense the
sample, the reader will recognize that the test has been compromised and the
test will
conclude with an appropriate notification message.
Once the positive-control test has completed, the reader proceeds to each test
dot and
compares the light level of the fluorescing proteins with the level emitted by
the
calibration dots. Given that the calibration dots are increasing over a
dynamic
concentration range, the signal to noise ration derived as a function of
protein
concentration to fluorescence emission intensity, making it possible to
determine, with
accuracy, the concentration of proteins present in the test sample.
When the sample has been auto- processed, the reader of the present invention
performs additional housekeeping tasks. These include:
= Making the Assay device un-readable to prevent further use;
= The Results are recorded in a log file with:
o The operators ID
o Date and Time
o Test performed
o Test Results
The results are ready for reporting to QA systems or for hard copy printout.
Those skilled in the art will recognize, or be able to ascertain using no more
than
routine experimentation, many equivalents to the embodiments of the invention
described specifically above. Such equivalents are intended to be encompassed
in the
scope of the following claims.
-25-