Note: Descriptions are shown in the official language in which they were submitted.
CA 02580937 2007-03-21
WO 2006/036726
PCT/US2005/033931
1
METHODS AND COMPUTER PROGRAM PRODUCTS FOR ANALYSIS AND
OPTIMIZATION OF MARKER CANDIDATES FOR CANCER PROGNOSIS
FIELD OF THE INVENTION
The present invention relates to methods for choosing, analyzing, and
optimizing biomarkers that may be candidates for use in establishing the
prognosis of
a patient afflicted with cancer.
BACKGROUND OF THE INVENTION
Gene amplification, gene deletion, and gene mutation are known to have a
prominent role in abnormal cellular behaviors through abnormal protein
expression.
The range of cellular behaviors of concern includes behaviors as diverse as,
for
example, proliferation or differentiation regulation. Therefore, effective
detection and
quantification in gene amplification, deletion and mutation, mR_1\TA
quantification, or
protein expression analyses is necessary in order to facilitate useful
research,
diagnostic and prognostic tools in complex diseases such as, for instance,
various
forms of cancer.
There are numerous laboratory techniques directed to detection and
quantification in gene amplification, deletion and mutation, mR_NA
quantification, or,
protein expression analyses. For example, such techniques include Western,
Northern
and Southern blots, polymerase chain reaction ("PCR"), enzyme-linked
immunoseparation assay ("ELISA"), and comparative genomic hybridization
("CGH") techniques. However, microscopy is routinely utilized because it is an
informative technique, allowing rapid investigations at the cellular and sub-
cellular
levels while capable of being expeditiously implemented at a relatively low
cost.
When microscopy is the chosen laboratory technique, the biological samples
must first undergo specific detection and revelation preparations. Once the
samples
are prepared, a human expert typically analyzes the samples with a microscope
alone
in a qualitative study, or with a microscope coupled to a camera and a
computer in a
quantitative and generally standardized study. In some instances, the
microscope may
be configured for fully automatic analysis, wherein the microscope is
automated with
a motorized stage and focus, motorized objective changers, automatic light
intensity
controls and the like.
CA 02580937 2007-03-21
WO 2006/036726
PCT/US2005/033931
2
The preparation of the samples for detection may involve different types of
preparation techniques that are suited to microscopic imaging analysis, such
as, for
example, hybridization-based and immunolabeling-based preparation techniques.
Such detection techniques may be coupled with appropriate revelation
techniques,
such as, for example, fluorescence-based and visible color reaction-based
techniques.
In Situ Hybridization ("ISH") and Fluorescent In Situ Hybridization ("FISH")
are detection and revelation techniques used, for example, for detection and
quantification in genetic information amplification and mutation analyses.
Both ISH
and FISH can be applied to histological or cytological samples. These
techniques use
specific complementary probes for recognizing corresponding precise sequences.
Depending on the technique used, the specific probe may include a colorimetric
(cISH) marker or a fluorescent (FISH) marker, wherein the samples are then
analyzed
using a transmission microscope or a fluorescence microscope, respectively.
The use
of a colorimetric marker or a fluorescent marker depends on the goal of the
user, each
type of marker having corresponding advantages over the other in particular
instances.
Imaging and microscopy techniques have been developed to optimize and
standardize the reading of colorimetric markers or stains that may be used to
detect
and/or quantify gene amplification, gene deletion, gene mutations, and
abnormal
protein expression that may be visible upon analyzing a tissue section slide
treated
with an appropriate marker chosen to highlight the abnormal cellular activity
that may
aid in the diagnosis and/or determination of prognosis for a disease such as
cancer.
Such methods are useful for obtaining a quantitative measurement of a target
molecular species within a given tissue sample, however, if additional
molecular
species are highlighted within the same tissue sample by additional
biomarkers, they
may be not immediately perceptible and there exists a need to identify and
quantify
such features in order to more systematically analyze a tissue sample so as to
allow a
clinician to provide a more accurate prognosis for patient suffering from a
complex
disease such as cancer. For instance, in many types of cancer, a small
percentage of
patients who are diagnosed at an early-stage still eventually have a poor ten-
year
outcome such as disease recurrence, metastasis, or death within this ten-year
period.
The majority of cancer patients diagnosed at an early stage, however, has a
good 10-
year prognosis and is unlikely to need, or benefit from, additional aggressive
adjuvant
therapy (e.g., chemotherapy). For example, the current clinical consensus is
that at
CA 02580937 2007-03-21
WO 2006/036726
PCT/US2005/033931
3
least some early-stage, node-negative breast cancer patients should receive
adjuvant
chemotherapy, but presently there are no FDA-approved assays to risk stratify
patients for more aggressive treatment. Since the majority of these early-
stage breast
cancer patients enjoy long-term survival following surgery and/or radiation
therapy
without further treatment, it is likely inappropriate to recommend aggressive
adjuvant
therapy for all of these patients, particularly in light of the significant
side effects
associated with cancer chemotherapeutics. Compositions and methods that permit
the
differentiation of these populations of early-stage breast cancer patients at
the time of
initial diagnosis into good and bad prognosis groups would assist clinicians
in
selecting appropriate courses of treatment. Thus, methods for evaluating the
prognosis of breast cancer patients, particularly early-stage breast cancer
patients, are
needed.
Although current prognostic criteria and quantitative video-microscopy
analyses of markers provide some guidance in predicting patient outcome and
selecting appropriate course of treatment, a significant need exists for a
systematic
method that utilizes clinical video-microscopy data to provide an optimally
specific
and sensitive cancer prognosis, particularly in early-stage patients. In
addition there
exists a need for a method for identifying and evaluating candidate markers
and
features thereof identified via video-microscopy, to aid in the evaluation of
cancer
prognosis.
SUMMARY OF THE INVENTION
A method and computer program product for analyzing and/or evaluating at
least one marker adapted to determine a prognosis of a cancer patient is
provided.
The method for analyzing at least one marker to determine the prognosis of a
cancer
patient comprises the steps of: exposing a body sample (taken from the cancer
patient)
to the at least one marker; extracting at least one quantifiable feature from
an image
taken of at least one slide using an image processing system, wherein the at
least one
slide is prepared from the body sample; and applying a decision rule to the at
least one
quantifiable feature, so as to determine the prognosis of the cancer patient
based on a
relationship between the at least one quantifiable feature and the decision
rule. In
some embodiments of the method for analyzing the at least one marker, the
applying
step further comprises applying a threshold to the at least one quantifiable
feature so
CA 02580937 2007-03-21
WO 2006/036726
PCT/US2005/033931
4
as to determine the prognosis of the cancer patient based on a relationship
between the
at least one quantifiable feature and the threshold. In yet another embodiment
of the
method for analyzing the at least one marker the applying step further
comprises
applying an affectation rule for the threshold, the affectation rule being
capable of
establishing a either a good prognosis or a bad prognosis corresponding to a
value of
the at least one quantifiable feature in relation to the threshold.
The method for evaluating at least one marker includes the step of exposing a
plurality of body samples to the at least one marker, the plurality of body
samples
being taken from a corresponding plurality of patients, wherein each patient
has a
known outcome. The method further includes the step of extracting at least one
quantifiable feature from an image taken of each of a plurality of slides
using an
image processing system. The plurality of slides may be prepared from the
plurality
of body samples corresponding to each patient. Furthermore, the method
includes the
steps of applying a plurality of candidate decision rules to the at least one
quantifiable
feature of each of the plurality of slides so as to provide a corresponding
candidate
prognosis for each of the plurality of slides; and selecting an optimal
decision rule,
wherein the optimal decision rule is selected from the candidate decision
rules, for the
at least one quantifiable feature. The optimal decision rule provides that the
candidate
prognosis for each of the plurality of slides optimally corresponds to the
known
outcome for each of the plurality of patients. For instance, the optimal
decision rule
may be chosen by determining the specificity and sensitivity for each of the
candidate
decisions rules and choosing the decision rule having a specificity and
sensitivity that
is nearest the optimal specificity and sensitivity couple of (1,1).
Some embodiments of the method and computer program product of the
present invention further comprise the step of evaluating the statistical
independence
of the at least one marker so as to ensure that the at least one marker is
capable of
providing a prognosis that is substantially statistically independent of at
least one
complementary marker. More particularly, the evaluating step above may, in
some
embodiments, further comprise the steps of: first, comparing a frequency
distribution
of observed outcomes to a frequency distribution of theoretical prognoses for
a first
plurality of body samples exposed to the at least one marker and to the at
least one
complementary marker, the first plurality of body samples corresponding to
patients
having a known good outcome; second, comparing a frequency distribution of
CA 02580937 2007-03-21
WO 2006/036726
PCT/US2005/033931
observed outcomes to a frequency distribution of theoretical prognoses for a
second
plurality of body samples exposed to the at least one marker and to the at
least one
complementary marker, the second plurality of body samples corresponding to
patients having a known bad outcome; and finally,
5 assessing the independence of the at least one marker with respect to the
at least one
complementary marker (using, in some cases, a chi-square analysis).
According to some embodiments, the applying step of the method for
evaluating may further include applying a plurality of candidate thresholds to
each
quantifiable feature so as to generate a plurality of candidate prognoses
corresponding
to each of the plurality of candidate thresholds for each of the plurality of
body
samples. Furthermore, the selecting step may further include selecting an
optimal
threshold value from the plurality of candidate thresholds such that candidate
prognosis for each of the plurality of slides optimally corresponds to the
known
outcome for each of the plurality of patients. Such an optimal threshold may
provide,
for instance, a tool for use by a computerized image processing system to
categorize a
given value determined for a particular quantifiable feature of a marker after
it has
been applied to a body sample (such as a histological slide). Once categorized
as
either above or below the optimal threshold, the given value may then be
translated
into a result of the applied decision rule that may, in turn be used to
establish a
prognosis for the patient from whom the body sample was taken.
In other embodiments, the applying step may further comprise determining an
affectation rule for each of the plurality of candidate thresholds, the
affectation rule
being capable of establishing either a good prognosis or a bad prognosis
corresponding to a value of the at least one quantifiable feature in relation
to each of
the plurality of candidate thresholds.
According to various embodiments of the present invention, the method may
include exposing the plurality of body samples to at least one marker wherein
the
marker may be chosen from the following: colorimetric biomarkers, SLPI, PSMB9,
NDRG-1, Muc-1, phospho-p27, src, E2F1, p2lras, p53, and combinations thereof.
Additionally, in some embodiments, the method may include extracting at least
one
quantifiable feature from an image taken of each of a plurality of slides
wherein the
quantifiable feature is detectable and quantifiable by an image processing
system.
CA 02580937 2007-03-21
WO 2006/036726
PCT/US2005/033931
6
Such quantifiable features may include: transmittance; optical density; cell
morphology; percentage of cell types; and combinations thereof.
The method steps summarized above may also be embodied in one or more
appropriate computer program products executable on a computer device (such as
a
computer device in communication with a microscopy system and/or image
analysis
system suitable for capturing an image of a stained histological slide) and
capable of
accomplishing the various functions associated with the method embodiments
described above. For instance, according to one embodiment a computer program
product is provided that may be capable of controlling an image processing
system to
determine a prognosis of a cancer patient, wherein the computer program
comprises:
(1) an executable portion for extracting a feature from an image taken of each
of the
plurality of slides using an image processing system, the plurality of slides
being
prepared from a plurality of body samples taken from a plurality of patients,
wherein
each patient has a known outcome, the plurality of body samples having been
exposed
to at least one marker; (2) an executable portion for applying a plurality of
candidate
decision rules to the feature of each of the plurality of slides so as to
provide a
candidate prognosis for each possible combination of the candidate decision
rules and
the feature; and (3) an executable portion for selecting an optimal decision
rule
corresponding to an optimal prognosis, the optimal decision rule being
selected from
the candidate decision rules, for the feature, the optimal decision rule
providing that
the optimal prognosis for each of the plurality of slides optimally
corresponds to the
known outcome for each of the patients.
Thus, the optimal decision rule may provide, based on the known outcomes of
the plurality of patients, a prognosis that is based on the comprehensive
analysis of at
least one marker, having at least one quantifiable feature such that the
prognosis
provides a minimum number of false positive prognoses and false negative
prognoses
when compared to the known outcomes of the plurality of patients. Thus, once
chosen, the optimal decision rule may be utilized to optimize the analysis of
one or
more colorimetric markers, having one or more features that are quantifiable
(by, for
instance, analysis in an image processing system) so as to provide patient
prognoses
that may more accurately predict good or bad outcomes. Thus, the method and
computer program product of the present invention may allow clinicians to
better
CA 02580937 2013-11-04
'
,
62451-1002
7
utilize a given marker ( or suite of markers) to predict the incidence of bad
outcomes even in
patients exhibiting only early stage manifestations of a particular disease.
According to an aspect of the present invention, there is provided a method
for
analyzing at least one marker to determine a prognosis of a cancer patient,
said method
comprising: exposing a body sample to: (i) the at least one marker indicated
by a dye, and (ii)
at least one other dye, the body sample taken from the cancer patient;
extracting at least one
quantifiable feature from an image taken of at least one slide using an image
processing
system, the at least one slide being prepared from the body sample exposed to
the at least one
marker, and the at least one quantifiable feature being determined at least in
part from a
chromogen separation of the image into relative amounts of each of the dyes in
each pixel of
the image; applying a decision rule to the at least one quantifiable feature,
so as to determine
the prognosis of the cancer patient based on a relationship between the at
least one
quantifiable feature and the decision rule.
According to another aspect of the present invention there is provided a
computer-readable storage medium having computer-readable program code
portions stored
therein, the computer-readable program code portions being capable of
controlling an image
processing system to analyze at least one marker to determine a prognosis of a
cancer patient,
the computer-readable program code portions comprising: an executable portion
for extracting
at least one quantifiable feature from an image taken of at least one slide
using an image
processing system, the at least one slide being prepared using a body sample
exposed to: (i)
the at least one marker indicated by a dye, and (ii) at least one other dye,
the body sample
taken from the cancer patient, and the at least one quantifiable feature being
determined at
least in part from a chromogen separation of the image into relative amounts
of each of the
dyes in each pixel of the image; and an executable portion for applying a
decision rule to the
at least one quantifiable feature, so as to determine the prognosis of the
cancer patient based
on a relationship between the at least one quantifiable feature and the
decision rule.
CA 02580937 2013-11-04
62451-1002
7a
According to still another aspect of the present invention, there is provided
a
method for evaluating at least one marker adapted to determine a prognosis of
a cancer
patient, said method comprising: exposing a plurality of body samples to: (i)
the at least one
marker indicated by a dye and (ii) at least one other dye, the plurality of
body samples being
taken from a corresponding plurality of patients, each patient having a known
clinical
outcome; extracting at least one quantifiable feature from an image taken of
each of a plurality
of slides using an image processing system, the plurality of slides being
prepared using the
plurality of body samples exposed to the at least one marker and each
corresponding to a
respective patient, and the at least one quantifiable feature being determined
at least in part
from a chromogen separation of the image into relative amounts of each of the
dyes in each
pixel of the image; applying a plurality of candidate decision rules to the at
least one
quantifiable feature of each of the plurality of slides so as to provide a
candidate prognosis for
each of a plurality of combinations of the plurality of candidate decision
rules and the at least
one quantifiable feature; and selecting a decision rule corresponding to a
prognosis, the
decision rule being selected from the candidate decision rules, for the at
least one quantifiable
feature, the decision rule providing that the prognosis for each of the
plurality of slides
optimally corresponds to the known clinical outcome for each of the plurality
of patients.
According to yet another aspect of the present invention, there is provided a
computer-readable storage medium having computer-readable program code
portions stored
therein, the computer-readable program code portions being capable of
controlling an image
processing system to evaluate at least one marker adapted to determine a
prognosis of a cancer
patient, the computer-readable program code portions comprising: an executable
portion for
extracting at least one quantifiable feature from an image taken of each of a
plurality of slides
using an image processing system, the plurality of slides being prepared using
a plurality of
body samples exposed to: (i) the at least one marker indicated by a dye, and
(ii) at least one
other dye, each body sample taken from a respective one of a plurality of
patients, each
patient having a known clinical outcome, and the at least one quantifiable
feature being
determined at least in part from a chromogen separation of the image into
relative amounts of
each of the dyes in each pixel of the image; an executable portion for
applying a plurality of
CA 02580937 2013-11-04
62451-1002
7b
candidate decision rules to the at least one quantifiable feature of each of
the plurality of
slides so as to provide a candidate prognosis for each of a plurality of
combinations of the
plurality of candidate decision rules and the at least one quantifiable
feature; and an
executable portion for selecting an optimal decision rule corresponding to a
prognosis, the
decision rule being selected from the candidate decision rules, for the at
least one quantifiable
feature, the decision rule providing that the prognosis for each of the
plurality of slides
corresponds to the known clinical outcome for each of the plurality of
patients.
CA 02580937 2013-11-04
= 62451-1002
7c
BRIEF DESCRIPTION OF THE DRAWINGS
Having thus described the invention in general terms, reference will now be
made to the accompanying figures, which are not necessarily drawn to scale,
and
wherein:
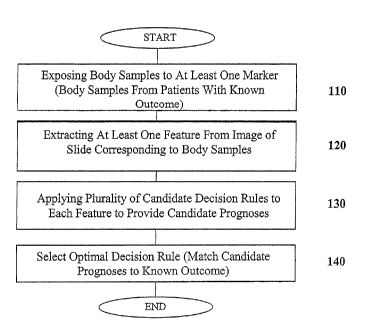
FIG. 1 shows a block diagram of the method and computer program product
for evaluating at least one marker according to one embodiment of the present
invention;
FIG. 2 shows a graphical representation of the four possible quadrants within
which a candidate prognosis may lie when compared to a corresponding actual
outcome ¨ the depicted quadrants may be used to generate a sensitivity and
specificity
couple for a candidate prognosis;
FIG. 3 shows an example of an ROC curve of plotted sensitivity and
specificity couples that may be used to select an optimal combination of
marker
features and/or thresholds so as to maximize both the sensitivity and
specificity of the
prognosis established by a marker or combination of markers according to one
embodiment of the present invention;
FIG. 4 shows a block diagram of the method and computer program product
for evaluating at least one marker and assessing the independence of the al
least one
marker with respect to at least one complementary marker according to one
embodiment of the present invention; and
FIG. 5 shows a visual representation of the determination of an optimal
threshold for a given feature in a single marker analysis by plotting the
distributions
of good and bad outcomes on a scale of candidate thresholds.
DETAILED DESCRIPTION OF THE INVENTION
The present invention provides methods for evaluating and optimizing marker
candidates for use in establishing the prognosis of a cancer patient. While
the
markers (and particular features thereof) described below are particularly
useful for
establishing a prognosis for a breast cancer patient, and more particularly an
early-
stage breast cancer patient, the methods disclosed herein may be utilized to
evaluate
CA 02580937 2007-03-21
WO 2006/036726
PCT/US2005/033931
8
and optimize marker candidates for use in establishing the prognosis of a
patient
suffering from any disease that may be linked to (via, for instance, clinical
data) the
overexpression of a particular protein or other target molecule that is
amenable to
staining via, for instance, a colorimetric biomarker (marker). Thus, one
skilled in the
art will appreciate that the methods disclosed herein may be applicable to the
analysis
and optimization of markers for use in establishing the prognosis of patients
having
other forms of cancer or other diseases linked to the expression of proteins
or target
molecules that may be marked and subsequently analyzed via microscopy.
The methods disclosed herein also find use in evaluating markers that may be
useful in predicting the response of a breast cancer patient to a selected
treatment. By
"predicting the response of a breast cancer patient to a selected treatment"
is intended
assessing the likelihood that a patient will experience a positive or negative
outcome
with a particular treatment. As used herein, "indicative of a positive
treatment
outcome" refers to an increased likelihood that the patient will experience
beneficial
results from the selected treatment (e.g., complete or partial remission,
reduced tumor
size, etc.). By "indicative of a negative treatment outcome" is intended an
increased
likelihood that the patient will not benefit from the selected treatment with
respect to
the progression of the underlying breast cancer. In some aspects of the
invention, the
selected treatment is chemotherapy.
The methods disclosed herein may also find use in evaluating and/or
optimizing markers useful in identifying or diagnosing cancer, particularly
breast
cancer. "Diagnosing breast cancer" is intended to include, for example,
diagnosing or
detecting the presence of breast cancer, monitoring the progression of the
disease, and
identifying or detecting cells or samples that are indicative of breast
cancer. The
terms diagnosing, detecting, and identifying cancer are used interchangeably
herein.
In particular embodiments, the methods of the invention may facilitate the
detection
of early-stage breast cancer by optimizing the markers and/or marker
combinations
that are most effective in diagnosing breast cancer or other diseases that may
be
characterized and/or diagnosed by the detection of a given marker as it is
either
overexpressed or presents an expression loss in a body sample (such as a
stained
histological slide or cytological slide).
The methods described herein relate to the application of a plurality of
threshold values to a selected feature of a given marker (biomarker or
colorimetric
CA 02580937 2007-03-21
WO 2006/036726 PCT/US2005/033931
9
biomarker) whose overexpression may be indicative of either a good outcome or
bad
outcome for a given patient. One skilled in the art will appreciate that the
methods of
the present invention may be applied to markers showing expression loss such
as, for
example, melastatin which shows expression loss in cases of melanoma.
Furthermore, the methods of the present invention permit the differentiation
of
patients that are likely to experience disease recurrence (i.e., poor
prognosis) from
those who are more likely to remain cancer-free (i.e., good prognosis) based
on the
systematic analysis of quantifiable features (and the plurality of threshold
values
applied thereto) that may be highlighted by colorimetric analysis of tissue
samples
(such as prepared histological slides) that have been exposed to one or more
biomarkers. More particularly, the methods of the present invention involve a
systematic process of evaluating features of a given tissue sample that have
been
exposed to a marker (such as a colorimetric biomarker) and choosing optimal
threshold values for each feature such that the marker may be analyzed in
terms of the
features and corresponding optimal thresholds so that the marker/threshold
combinations provide prognoses that are most accurate when compared to known
actual patient outcomes. Thus, the methods of the present invention may
further be
used to select optimal combinations of markers, features thereof, and
threshold values
for each particular feature so as to provide more accurate prognoses for early
stage
cancer patients.
The biomarkers evaluated by the invention include genes and proteins. Such
biomarkers include DNA comprising the entire or partial sequence of the
nucleic acid
sequence encoding the biomarker, or the complement of such a sequence. The
biomarker nucleic acids also include RNA comprising the entire or partial
sequence of
any of the nucleic acid sequences of interest. A biomarker protein is a
protein
encoded by or corresponding to a DNA biomarker of the invention. A biomarker
protein comprises the entire or partial amino acid sequ_ence of any of the
biomarker
proteins or polypeptides.
A "biomarker" is any gene or protein whose level of expression in a tissue or
cell is altered compared to that of a normal or healthy cell or tissue. The
biotnarkers,
according to one embodiment of the present invention, are genes and proteins
whose
overexpression correlates with cancer prognosis, and particularly, in the
examples
presented herein, breast cancer prognosis. In some cases, selective
overexpression of
CA 02580937 2007-03-21
WO 2006/036726
PCT/US2005/033931
a biomarker or combination of biomarkers of interest in a patient sample is
indicative
of a poor cancer prognosis. By "indicative of a poor prognosis" is intended
that
overexpression of the particular biomarker is associated with an increased
likelihood
of relapse or recurrence of the underlying cancer or tumor, metastasis, or
death within
5 less than five years. Biomarkers that are indicative of a poor prognosis
may be
referred to herein as "bad outcome biomarkers." In other aspects of the
invention,
selective overexpression of a biomarker or combination of biomarkers of
interest is
indicative of a good prognosis. As used herein, "indicative of a good
prognosis"
refers to an increased likelihood that the patient will remain cancer-free for
at least
10 five years. Such biomarkers may be referred to as "good outcome
biorriarkers."
The biomarkers that may be evaluated by the methods of the present invention
include any gene or protein whose overexpression correlates with a cancer
prognosis,
as described above. Biomarkers include genes and proteins that are indicative
of a
poor cancer prognosis (i.e., bad outcome biomarkers) as well as those that are
indicative of a good prognosis (i.e., good outcome biomarkers). Biomarkers of
particular interest include genes and proteins that are involved in regulation
of cell
growth and proliferation, cell cycle control, DNA replication and
transcription,
apoptosis, signal transduction, angiogenesis/lymphogenesis, or metastasis. In
some
embodiments, the biomarkers regulate protease systems involved in tissue
remodeling, extracellular matrix degradation, and adjacent tissue invasion.
Although
any biomarker whose overexpression is indicative of cancer prognosis may be
analyzed and/or utilized in the method of the present invention, in particular
embodiments evaluating breast cancer prognoses, biomarkers are selected from
the
group consisting of SLPI, p2lras, MUC-1, DARPP-32, phospho-p27, src, MGC
14832, myc, TGF13-3, SERHL, E2F1, PDGFRa, NDRG-1, MCM2, PS1\1139, MCM6,
and p53. More preferably, the biomarkers of interest in establishing breast
cancer
prognoses comprise SLPI, PSMB9, NDRG-1, Muc-1, phospho-p27, src, E2F1,
p2lras, or p53. In one aspect of the invention, as illustrated in the
experimental
example included herein, the methods for evaluating breast cancer prognosis
comprise
detecting the overexpression of E2F1 and at least one other biomarker selected
from
the group consisting of SLPI, src, phoshp-p27, p2lras, and PSMB9.
The term "feature" as discussed herein refers to a perceptible and/or
quantifiable variation produced in a body sample by exposure to a given marker
CA 02580937 2015-01-30
62451-1002
11
and/or biomarker. Features may include variations in transmittance or optical
density
values produced by the staining characteristics of a colorimetric marker
(including the
markers discussed above) that may be detected, for instance, using microscopy
techniques and image processing systems. Such microscopy techniques and/or
image
processing systems are used to provide an image of the biological sample after
it has
been stained to visually indicate the presence of a particular biomarker of
interest (and
thus indicate the presence of a corresponding particular protein and/or target
molecule
.
of interest). Some of these methods and associated systems, such as those
disclosed
in U.S. Patent Application 09/957,446 to Marcelpoil et al. (the '446
application) and
U.S. Patent Application 10/057,729 to Marcelpoil etal. (the '729 application),
disclose the use of an image processing system,
method, and associated computer program product to determine the relative
amounts
of each molecular species present in a given image based on the presence of
representative color dye markers as indicated by those color dye markers'
optical =
density or transmittance value, respectively, as determined by an imaging
system and
associated software. These techniques may further provide quantitative
determinations of the relative amounts of each target molecule or protein
whose
overexpression may be revealed by a colorimetric biomarker applied to a tissue
sample slide. For instance, the expression of a feature of a given marker may
be
revealed using a digital image of a Marked tissue sample slide wherein the
marker is
separated from background stain and/or other markers using chromogen
separation
from its component red, green, and blue (RGB) color parts such that the
relative
contribution of the marker (relative to background stain and/or staining from
other
markers) may be determined within a cell or a region of interest (ROI) within
a body
sample taken from a patient.
.1
According to the various embodiments of the present invention, various
features (both quantifiable and non-quantifiable) may be extracted from an
image .
taken from a marked tissue sample (such as a prepared histological slide
stained with
a colorimetric biomarker) using an image processing system capable of
capturing
regions of interest (ROI), various fields of view (F0V) or images of entire
histological slides and determining morphological boundaries defined therein
such as
the various regions of the cell including the nucleus, cytoplasm, and cell
membrane.
This image processing step for determining morphological boundaries within a
slide
=
CA 02580937 2015-01-30
= =
.=-
. .
62451-1002
12
and/or body sample is known as segmentation. Regions of interest (ROI) may,
according to various embodiments, span an entire slide, portions of a slide,
discrete
= selected portions of a slide, and/or an entire FOV. Accurate segmentation
of the
=
morphological boundaries (via microscopy and/or image analysis) is required
for the
determination of many features as various different biomarker types exhibit
different
sub-cellular location within the cells of a given body sample. For instance,
some
biomarkers reveal overexpression of a target molecule only within the nucleus
of a
cell. Other markers may reveal overexpression of a target molecule within the
cytoplasm or within the cell membrane of a cell. For instance, Table 1 shows
some of =
markers used in establishing a prognosis and/or diagnosis for breast cancer
are listed
along with their respective areas of sub-cellular localization.
=
As described in the attached Appendix of Example Features, certain cell
descriptor features -such as CELL, CYTO, MEMB, and NUCL (referring to the
cell,
cytoplasm, cell membrane, and cell nucleus, respectively) serve as location
identifiers
within the cells of a body sample wherein the features exhibited by a
particular
= marker may be detected and/or quantified using, for instance, clu-omogen
separation
of a dye or stain.
Also shown in the attached appendix are a number of other exemplary features
=
of various biomarkers that may be extracted, examined, and or quantified by
the
=
methods of the present invention in order to optimize the prognostic value of
a given
biomarker or combination of biomarkers. The features are categorized generally
as
follows: shape, descriptor features; texture and/or histogram descriptor
features (which =
refer mainly to statistical detenninations as to the amount and variation of
target
molecule overexpression that may be highlighted by a particular biomarker);
spectral
descriptor features (such as transmittance or optical density of the various
colorimetric biomarkers and/or counterstains that may be used to reveal
overexpression of the target molecules); hierarchy descriptor features (which
are used =
to compute quantifiable features relative to hierarchical objects captured by
an
= imaging system);- and cellular descriptor features (including CELL, CYTO,
MEMB,
and NUCL (as described above and detailed in the Appendix of Example
Features).
The list of features described generally above and in more detail in the
appendix
attached hereto is not meant to be exhaustive and is meant to serve only as an
example. The method of the present invention may utilize a variety of
different =
=
CA 02580937 2007-03-21
WO 2006/036726
PCT/US2005/033931
13
quantifiable features (and various combinations thereof) in order to optimize
the
prognostic value of a given marker or combination of markers. According to the
computer program product embodiments of the present invention, the features
described herein may be detected in an automated manner by, for instance, a
controller (such as a computer device) configured to control an image
processing
system having the capability of marking regions of interest (ROI), segmenting
the
various compartments and components of a cell or tissue sample, and/or
deconstructing a stain or dye into component RGB parts so as to determine
transmittance, luminance, optical density and/or other spectral features.
In some embodiments of the present invention, the features above and others
may be combined to create summary features that incorporate several types of
underlying features in order to create a quantifiable feature that may have
utility for
the purposes of providing a diagnosis and/or prognosis of a given patient. In
order to
construct such a summary feature, other more specific features may be
quantified and
examined in order to create the summary feature which may, in some cases, have
more significance to a clinician seeking to obtain prognostic and/or
diagnostic value
from the features highlighted by a biomarker and/or collection of biomarkers.
For
instance, in the Experimental Example described herein, the features utilized
include
numerical percentages of various grades of cancer cells that are deemed
present in a
given collection of cells that may be highlighted in a specific region of
interest (ROT)
identified in a body sample (such as an histological slide). One skilled in
the art will
appreciate that a pathologist may "grade" a cell that has been stained with a
marker as
it is viewed, for instance, via microscopy, by ascertaining the degree of
marker that is
present in the region of interest (ROT) (such as an area of a histological
slide that
appears to be stained darker than the surrounding regions). While visual
grading by a
pathologist is helpful for ascertaining the relative level of marker present
in a cell,
such grading is fairly subjective and may vary according to various clinicians
and in
various contexts. Thus, in building a summary feature in the present
invention,
suspected cancer cells may be more objectively graded as, for instance, either
0
(indicating a complete lack of marker present in the targeted cell
compartment), 1
(indicating some small amount of marker present in the targeted cell
compartment), 2
(indicating a medium level of marker present in the targeted cell
compartment), or 3
(indicating a high level of marker present in the targeted cell compartment).
Such
CA 02580937 2007-03-21
WO 2006/036726
PCT/US2005/033931
14
grading may be accomplished in an automated manner using a video-microscopy
system and/or image processing system such as those disclosed in the '446
application
and the '729 application. As summarized below in Table 2, according to one
example
of the present invention, the features denoted by NUCL, CYTO, MEMB, DYE2, OD,
and MEAN may be combined to produce optical transmittance values having a
range
of values that may be partitioned to determine the level of the given
colorimetric
biomarker (or in some instances, a colorimetric component thereof) (denoted by
"DYE2," for instance) in a given cell. The same dye may be used to render the
given
biomarker a colorimetric biomarker (such as, for instance, a commonly used dye
stain
such as DAB or others well-known to one skilled in the art) however, the
various
different markers evaluated by the present invention may reveal the existence
of target
molecules in various cell compartments (such as the nucleus, cell membrane,
and/or
cytoplasm). The example threshold values (corresponding to transmittance
values), in
this case shown in Table 2 may thus dispatch each of the viewed cells into a
one of
the following categories: 0, 1, 2, or 3. An evaluation of category 0
corresponding to
the expected number of non-stained cells (i.e. cells found not to exhibit
overexpression of the target molecule when exposed to the marker) may be
performed
using an image processing system and/or microscopy. The approximate number of
0
(non-stained) cells may further be computed using the average tumor cell area
(for
instance, 1100 pixels as estimated from the feature called CELL_AREA (See
Appendix of Example Features)) obtained, in this particular embodiment, from
calculations of 1, 2 and 3 cells area (using the determinations listed below):
NNegRef (1)
N2 = N Test (2)
N3 = N Pm Ref (3)
FOCUS AREA
NTotal = max(N1 +N2 +N3 (4)
1 1 00
= max(0, Arnica ¨ N1¨ N2 ¨ N3) (5)
In other embodiments the number of cells may be computed using methods other
than
determining the cell areas (such as by counting nuclei within a FOV that are
stained
with a nucleus localized marker). Once the number of 0, 1, 2, and 3 cell types
(No,
CA 02580937 2007-03-21
WO 2006/036726
PCT/US2005/033931
N2 and N3, respectively) is determined (using, for instance, the various
threshold
values given in Table 2), the percentage of 0, 1, 2 and 3 cells may be
computed.
Table 3 presents the names of these new summary features using the prefix
CELL_PERCENT along with a numerical identifier showing the types of cells
5 reflected in the given percentage. These example summary features may be
computed
as simple percentage. For example, CELL_PERCENT_O may be computed as
follows:
CELL PERCENT 0= Nox 100 (6)
N Total
Although the CELL_PERCENT summary features described above are used
in the experimental example described herein, any number of possible
quantifiable
features may be evaluated as part of the embodiments of the methods and
computer
program products of the present invention. For example, one or more of the
colorimetric features disclosed in the Appendix of Example Features
(associated with,
for instance, the analysis of a stained histological slide using an image
analysis
system) may be combined to form another type of summary feature or individual
features described in the Appendix may be used and analyzed independently.
The various features and summary features described above may be applicable
in the analysis of one or more markers that may be used to stain a body sample
(or a
slide prepared therefrom, such as, for example, a histological slide) in order
to
establish (or aid in the establishment of) a prognosis for a cancer patient
(such as an
early-stage breast cancer patient). According to the embodiments of the
present
invention, different combinations of markers and features thereof, may be
evaluated
using the embodiments of the present invention to establish an optimal
combination of
features, feature thresholds (such as a given CELL_PERCENT of Type-2 cancer
cells
in a given region of interest (ROT)), and marker types such that the
sensitivity and
specificity of a given marker or marker combination may be optimized. In
addition,
other types of patient-based features may be combined with the features
disclosed
herein such as (but not limited to): patient age; patient medical history; and
other
factors indicating possible prognosis and/or diagnosis for cancer patients.
For
example, lymph node involvement, tumor size, histologic grade, estrogen and
CA 02580937 2007-03-21
WO 2006/036726
PCT/US2005/033931
16
progesterone receptor levels, Her 2/neu status, tumor ploidy, and family
history may
all be prognostic and/or diagnostic factors to aid in the establishment of a
prognosis
for an early-stage breast cancer patient.
Using the methods and computer program products of the present invention,
features, thresholds, and marker combinations may be efficiently and
systematically
analyzed and evaluated to determine an optimal specificity and sensitivity in
establishing a prognosis for any given cancer patient. In the methods and
computer
program products of the present invention, the endpoint for assessing
specificity and
sensitivity is comparison of the prognosis (for example, the outcome predicted
using a
particular candidate marker and/or corresponding candidate feature or
features) with
the actual clinical outcome (i.e., whether the patient remained cancer-free or
suffered
a recurrence within five years). As shown in FIG. 2, the candidate prognoses
produced by a number of candidate feature/threshold combinations may be
plotted in
a four-quadrant matrix as shown based on the known outcomes of the body
samples
used in the methods of the present invention to determine the numbers of true
positive
210, true negative 240, false positive 220, and false negative 230 prognoses
produced
by a given marker/feature (and/or decision rule) combination as described in
more
detail below. After computing relative numbers of true positive 210, true
negative
240, false positive 220, and false negative 230 prognoses, a characteristic
sensitivity
and specificity couple may be computed to assess the effectiveness of the
marker/feature/decision rule combination as a prognostic tool (as described in
more
detail below)
As used herein, "specificity" refers to the level at which a method of the
invention can accurately identify true negatives. In a clinical study,
specificity is
calculated by dividing the number of true negatives by the sum of true
negatives and
false positives (as determined by plotting candidate prognoses in the
quadrants of
FIG. 2). By "sensitivity" is intended the level at which a method of the
invention can
accurately identify samples that are true positives. Sensitivity is calculated
in a
clinical study by dividing the number of true positives by the sum of true
positives
and false negatives (also as determined by plotting candidate prognoses in the
quadrants of FIG. 2). In some embodiments, the sensitivity of a given
combination of
markers, features, and thresholds uncovered by the disclosed methods is at
least about
40%, 45%, 50%, 55%, 60%, 65%, 70%, 75%, 80%, 85%, 90%, 91%, 92%, 93%,
CA 02580937 2007-03-21
WO 2006/036726
PCT/US2005/033931
17
94%, 95%, 96%, 97%, 98%, 99% or more. Furthermore, the specificity attainable
by
the present evaluation methods is preferably at least about 40%, 45%, 50%,
55%,
60%, 65%, 70%, 75%, 80%, 85%, 90%, 91%, 92%, 93%, 94%, 95%, 96%, 97%,
98%, 99% or more.
As used herein, the definitions of "true" and "false" positives and negatives
will be dependent upon whether the marker or combination of markers under
consideration is good outcome or bad outcome markers. That is, in the case of
good
outcome markers (i.e., those indicative of a good prognosis), "true positive"
refers to
those samples exhibiting overexpression of the biomarker of interest, as
determined
by the methods of the invention (e.g., positive staining by
immunohistochemistry),
that have a confirmed good actual clinical outcome. In contrast, "false
positives"
display overexpression of the good outcome biomarker(s) but have a confirmed
bad
actual clinical outcome. "True negatives" and "false negatives" with respect
to good
outcome markers do not display marker overexpression (e.g., do not stain
positive in
immunohistochemistry methods) and have confirmed bad and good actual clinical
outcomes, respectively.
Similarly, in the case of bad outcome markers, "true positives" refers to
those
samples exhibiting overexpression of the marker or combination markers of
interest
that have a confirmed bad actual clinical outcome. In summary, "true positive"
with
respect to both good and bad outcome biomarkers refers to samples in which the
actual clinical outcome (i.e., good or bad) is accurately predicted. "False
positives"
display overexpression of the bad outcome biomarker but have a confirmed good
actual clinical outcome. "True negatives" and "false negatives" with respect
to bad
outcome biomarkers do not display biomarker overexpression and have confirmed
good and bad actual clinical outcomes, respectively. The methods and computer
program products of the present invention utilize a systematic comparison of
prognoses produced using a number of markers, features of markers, and
threshold
values for given features, with actual clinical outcomes in order to determine
which
optimal combination of markers, features, and thresholds are most likely to
provide
prognoses that are the most accurate as defined by actual clinical outcomes.
FIG. 1 shows a schematic flow diagram of a method according to one
embodiment of the present invention for evaluating at least one marker that
may be
utilized to determine a prognosis of a cancer patient. Step 110 shows an
exposing
CA 02580937 2007-03-21
WO 2006/036726
PCT/US2005/033931
18
step, including exposing a plurality of body samples to a marker (or in some
cases, a
plurality of markers). The plurality of body samples are taken, for instance,
from a
corresponding plurality of patients, wherein each patient has a known clinical
outcome. As described in more detail above, the marker may include a variety
of
colorimetric biomarkers that may be used to detect a variety of target
molecules (such
as, for instance, proteins) that may be overexpressed in a given cell. The
body
samples may include biopsy tissue samples taken from patients having a disease
for
which the method of the present invention is being used to evaluate a marker.
Step 120 shows the next step according to one method of the present invention
which includes extracting at least one quantifiable feature from an image
taken of
each of a plurality of slides using an image processing system, wherein the
plurality
of slides are prepared from the plurality of body samples corresponding to
each
patient having a known outcome. The slides may hold sequential sections of a
biopsy
core sample or other tissue sample and may be exposed to one or more of the
markers
that may be under evaluation as part of the methods of the present invention.
The
slides may include histological slides that are dyed and/or stained to
facilitate the
extraction of a quantifiable feature (such as a perceptible change in color,
shade,
luminance, transmittance (TRANS), optical density (OD), or other features as
described in more detail above). For instance, the slide may be treated with a
stain
configured to highlight the marker (or plurality of markers) to which the body
samples have been exposed. In addition, the slide may be treated with a
counterstain
having a color and/or staining characteristic tending to highlight the
staining of the
marker or markers of interest. One skilled in the art will appreciate that
such
colorimetric stains may include DAB (tending to stain the appearance of
markers
brown) and that counterstains may include hematoxylin (tending to stain the
normal
morphology of the cell blue). In addition, any of the stained slides may be
analyzed
using the chromagen separation techniques disclosed, for instance, in the '446
application and the '729 application.
As described above, the extracting step may involve extracting features from a
video-microscopy image of the slide using, for instance, an image analysis
system and
an associated controller (such as a computer device) configured to analyze a
given
image (such as an entire slide, a camera field-of-view (FOV), or a selected
region-of-
interest (ROT)). As described in detail in the attached Appendix of Example
Features,
CA 02580937 2007-03-21
WO 2006/036726
PCT/US2005/033931
19
many different features relating to an image of a slide having been exposed to
a given
marker (or set of markers) tnay be extracted and analyzed. In some
embodiments, a
clinician such as a pathologist, may utilize an image analysis system to
select a ROT
(corresponding, for instance, to a region of a microscopy image stained dark
with
DAB so as to indicate the presence of large amounts of a given marker). Within
the
ROT, the image analysis system (and controller in communication therewith) may
be
used to isolate and extract a number of the features described in the attached
appendix. For example, a number of cells within the ROT may be computed and
the
percentage of Type 1 cells therein may be computed as well (by applying, for
instance, the dispatcher settings outlined in Table 2, after determining the
optical
density of light transmitted through different cell compartments (depending on
marker
type) contained within the R01). In order to apply a threshold or objective
decision
rule ((see step 130) described in detail below), the feature is, in most
cases, a
quantifiable feature, such as a percentage, number of cells, area, luminance,
transmittance, and/or optical density. For example, in the attached
experimental
example, the summary features extracted from various ROI's included the
percentages of Type 1, Type 2, and Type 3 cancer cells (and combinations of
these
percentages) wherein the percentages were computed by combining more specific
features (such as the transmittance and/or optical density of stained areas of
the cells
which are used to dispatch a given cell to a particular type designation (Type
1, 2, or
3, for instance)).
Step 130 of one embodiment of the method of the present invention includes
applying a plurality of candidate decision rules to the extracted quantifiable
feature of
each of the plurality of slides so as to provide a corresponding candidate
prognosis for
each of the slides. The "decision rule" can be made up of several components
including an affectation rule (which involves a determination of whether a
quantifiable feature greater than a given threshold is indicative of a good
prognosis or
a bad prognosis) as well as a threshold value for a given quantifiable
feature. In the
analysis of a single marker having a single feature, the decision rule may be
a binary
decision for the particular feature. According to many embodiments of the
present
invention, the overall decision rule involves generating either a good or bad
candidate
prognosis (depending on the candidate threshold and the corresponding
affectation
rule). For instance, according to one embodiment, good prognoses may be
denoted as
CA 02580937 2007-03-21
WO 2006/036726
PCT/US2005/033931
zero (0), and bad prognoses may be denoted as (1). However, for each possible
threshold, there are two possible choices for affectation rules (i.e. good
prognoses (0)
may refer to values less than the threshold value, or, alternatively, bad
prognoses (1)
may refer to values less than the threshold value). Thus, each affectation
rule (for
5 each possible threshold) may be evaluated for each body sample
(corresponding to a
patient having a known outcome) and placed in one of four quadrants
corresponding
to one of the following categories as shown in FIG. 2: true positives
(quadrant a, 210),
false positives (quadrant b, 220), false negatives (quadrant c, 230), and true
negatives
(quadrant d, 240). A possible prognosis may then be generated for each of the
10 possible threshold/affectation rule combinations for each body sample
(corresponding
to a patient having a known outcome) such that the optimal affectation rule
for each
threshold may be determined by choosing for each quadrant in FIG. 2, an
affectation
rule, based upon the occurrence of good and bad outcomes in that quadrant.
For instance, given a threshold value (T) for a specific quantifiable feature
(F)
15 of a marker, two affectation rules are possible to determine a
prognosis. The first
possible rule is, if F is greater than T, the prognosis is bad (1). The second
possible
rule is: if F is greater than T, the prognosis is good (0). For each of these
possible
affectation rules, the predicted prognosis may either accurately predict the
actual
patient outcome (i.e. yield a true positive or true negative) or fail to
predict the actual
20 patient outcome (i.e. yield a false positive or false negative). It is
possible to
determine which quadrant of FIG. 2 contains most of the possible prognoses to
determine which affectation rule is most appropriate for a given quantifiable
feature.
For example, referring to FIG. 2, the possible prognoses for the first
possible rule may
be plotted to determine where the results lie. In addition, the possible
prognoses for
the second possible rule may be plotted to determine where the results lie
within the
quadrants depicted in FIG. 2. After plotting both possible affectation rules
in the
appropriate quadrants, an optimal affectation rule may be determined by
determining
the ratio of predicted good versus bad outcomes normalized to the overall
number of
good and bad outcomes. For instance, for a given feature and threshold, most
plotted
points may lie in the true positive quadrant if the first possible affectation
rule (if F>
T, prognosis = bad (1)) is used. In this case, the following candidate
decision rule
may be generated: patients exhibiting the quantifiable feature above the
threshold are
considered to have a bad prognosis (positive for the disease). In another
example,
CA 02580937 2007-03-21
WO 2006/036726 PCT/US2005/033931
21
most plotted points may lie in the false negative quadrant if the first
possible rule if F
<T, prognosis = good (0) is used. In this case, the candidate decision rule
may read
as: patients exhibiting the quantified feature above the threshold are
considered to
have a good prognosis (negative for the disease). One skilled in the art will
appreciate
that other statistical methods may also be utilized to find efficient decision
rules. For
instance, linear discrimination, quadratic discrimination, generalized linear
models,
logistic regressions, penalized discrimination, flexible discrimination,
mixture
discrimination, and/or other statistical methods may be utilized to find such
decision
rules as part of step 130 of the present invention.
As shown in FIG. 1, step 140 includes selecting an optimal decision rule,
selected from the candidate decision rules, for the at least one quantifiable
feature.
The optimal decision rule is chosen so as to provide that the candidate
prognosis for
each of the plurality of slides optimally corresponds to the known outcome for
each of
the plurality of patients. For example, the decision rule is chosen from the
plurality of
candidate decision rules so as to provide an optimally predictive prognosis
tool that
produces the minimum number of false negatives and false positives when
compared
to the clinical outcomes of the patients from whom the body samples have been
taken
(see Step 110). As described above, the candidate decision rules have both a
threshold component and an affectation rule component_ By systematically
evaluating a plurality of candidate thresholds (and affectation rules) an
optimal
threshold value may be chosen such that the optimal prognosis resulting
therefrom for
each of the plurality of slides may correspond most closely to the known
outcome for
each of the plurality of patients (from which the plurality of slides are
produced).
Additionally, the efficiency of a given decision rule may be tested using
specificity
and sensitivity as shown below in equations 7 and 8.
According to some embodiments of the present invention, selecting an optimal
decision rule further comprises determining a plurality of specificity and
sensitivity
couples corresponding to each of the plurality of candidate decision rules. In
such
embodiments, the specificity and sensitivity for each candidate decision rule
(and for
each of the plurality of candidate thresholds and corresponding affectation
rules) may
be computed by comparing the candidate prognosis from each candidate decision
rule
to the actual known outcome for each patient from which the body samples were
taken. In performing this comparison each the relative numbers of true
positives
CA 02580937 2007-03-21
WO 2006/036726
PCT/US2005/033931
22
(quadrant a), false positives (quadrant b), false negatives (quadrant c), and
true
negatives (quadrant d) may be determined using a quadrant system such as that
depicted in FIG. 2. Using the relative numbers for each quadrant, sensitivity
and
specificity couples (sens, spec) may be computed for each candidate decision
rule and
each of the plurality of candidate thresholds using the following formulas:
a
Sensitivity = ________________________________________________ (7)
(a + c)
Specificity = ________________________________________________ (8)
(b + d)
Thus, as described generally above, sensitivity refers to the probability of a
bad
outcome patient being evaluated as being positive in regard to the marker
(i.e. to be
considered as a true positive). Similarly, specificity refers to the
probability of a good
outcome patient being evaluated as being negative in regards to the marker
(i.e. to be
considered a true negative).
Each of the sensitivity and specificity couples may then be plotted on two-
dimensional sensitivity and specificity chart as shown in FIG. 3 wherein each
point
refers to the specificity and sensitivity value calculated for each of the
plurality of
candidate decision rules (and for each of the plurality of candidate
thresholds). The
chart shown in FIG. 3 is also known as receiver operating characteristic (ROC)
curve
shows a plot of sensitivity values 310 and corresponding specificity values
300 for a
set of candidate decision rules that have been compared to a set of data
corresponding
to actual clinical outcomes. An ideal prognostic test would have an ideal
sensitivity
and specificity couple 320 plotted at point 1,1 which indicates that all the
prognostic
results consist of either true positives or true negatives (see quadrants a
210 and d 240
in FIG. 2). For each plotted sensitivity and specificity couple on the ROC
curve, the
Euclidian distance may be computed between the plotted couple and the ideal
couple
320 at (1,1) using the specificity difference 350 and the sensitivity
difference 340
between the plotted and ideal couples. After plotting the ROC curve as shown
in FIG.
3, the specificity and sensitivity couple having the minimum Euclidian
distance 320 to
the ideal couple 320 may be identified such that the optimal decision rule
(and
corresponding optimal threshold and/or affectation rule) may be selected in
order to
CA 02580937 2007-03-21
WO 2006/036726
PCT/US2005/033931
23
target a specific sensitivity and specificity couple of the marker and feature
combination under evaluation. Furthermore, in some embodiments, the optimal
decision rule may be selected in order to maximize both the sensitivity and
specificity
(i.e. approach the ideal (1,1) sensitivity and specificity couple) of the
marker and
feature combination under evaluation.
As shown in FIG. 4, some methods of the present invention may further
comprise an additional step, shown schematically in block 150, which includes
evaluating the statistical independence of at least one marker so as to ensure
that the
marker is capable of providing a prognosis that is substantially statistically
independent of at least one complementary marker. Thus, this embodiment may
ensure that for a given pair of markers applied to a body sample, the
prognoses
generated therefrom are substantially statistically independent such that one
marker
does not provide substantially repetitive information with regard to the
complementary marker. This may ensure, for instance, that a complementary
marker
is not used in conjunction with a first marker when the two are not
substantially
statistically independent. The dependence of the two markers may indicate that
they
are duplicative and that the addition of a second marker adds no additional
value to
the prognostic power of a given pair of markers. In order to optimize the
prognostic
power of a given panel of markers it is also desirable to reduce the amount of
signal
"noise" by minimizing the use of markers that provide duplicative prognostic
information when compared to another marker in the panel.
The evaluation of the statistical independence of the two markers may involve,
for instance, in some embodiments, the following additional steps: (1)
comparing a
frequency distribution of observed outcomes to a frequency distribution of
theoretical
prognoses for a first set of body samples exposed to a first marker and to a
complementary marker, wherein the first set of body samples correspond to
patients
having a known good outcome; (2) comparing a frequency distribution of
observed
outcomes to a frequency distribution of theoretical prognoses for a second set
of body
samples exposed to the first marker and to the complementary marker, wherein
the
second set of body samples correspond to patients having a known bad outcome;
and
(3) assessing the independence of the at least one marker with respect to the
at least
one complementary marker using a chi square (X2) analysis.
CA 02580937 2007-03-21
WO 2006/036726
PCT/US2005/033931
24
For example, a X2 analysis may be performed in order to assess marker
independence when considering 2 markers at a time and taking the outcome of
the
patients (corresponding to the body samples) into account. Table 7 details how
the X2
value was obtained for both good and bad outcome patient sub-populations for a
particular marker pair. According to one example, the X2 value was computed to
be
7.81 with a probability of error (p) of 0.05. Thus, the following results may
follow:
(1) if X2Good < 7.81, then HoGood cannot be rejected; (2) If X2Bad< 7.81,
HoBad
cannot be rejected; and thus (3) If (X2Good <7.81 and X2Bad<7.81) Ho cannot be
rejected, and the markers can be considered independent.
The methods disclosed herein may also be embodied in one or more
appropriate computer program products executable on a computer device (such as
a
computer device in communication with a microscopy system and/or image
analysis
system suitable for capturing an image of a stained histological slide or
cytological
slide) and capable of accomplishing the various functions associated with the
methods
and associated systems described herein. More particularly, steps 120, 130,
140, and
150 of the method embodiment illustrated in FIGS. 1 and 4, may be accomplished
with a computer program product having one or more executable portions for
accomplishing or otherwise directing the method steps to be undertaken. For
example, in such computer program embodiments, the executable portions may
accomplish step 120 shown in FIGS. 1 and 4 by facilitating communication
between a
computer device (or other controller device) and a microscopy system or image
analysis system suitable for extracting one or more of the features described
and
detailed in the appendix of example features included herein. For example, an
executable portion illustrated schematically by step 120 may be capable of
extracting
statistical data (or another quantifiable feature) from a digital image
(obtained via an
image analysis system) of a stained histological slide corresponding to the
staining
characteristics of a particular marker.
Additionally the executable portions of the computer program products of the
present invention may also accomplish step 130 shown in FIGS. 1 and 4 via the
systematic application of an exhaustive plurality of candidate decision rules
to the at
least one quantifiable feature extracted from each of the plurality of slides
so as to
generate a sequence of candidate prognoses corresponding to each of the
plurality of
combinations of the exhaustive plurality of decision rules (comprising, in
some cases,
CA 02580937 2007-03-21
WO 2006/036726
PCT/US2005/033931
a systematic evaluation of possible thresholds and/or affectation rules for a
plurality
of marker combinations and features thereof).
According to some embodiments, the executable portions of the computer
program products of the present invention may also perform or facilitate step
140
5 shown in FIGS. 1 and 4 by calculating a specificity and sensitivity
couple for each of
the candidate prognoses using the known outcomes for each of the patients
corresponding to the plurality of slides under investigation. Thus, the
executable
portion illustrate schematically in step 140 may determine a decision rule
that
corresponds to a targeted and/or optimal specificity and sensitivity couple.
10 Finally, as shown in step 150 of FIG. 4, the executable portions of the
computer program products of the present invention may also direct and/or
facilitate a
determination of marker independence of two or more markers using chi-square
analyses or other techniques as described above in relation to the method
embodiments of the present invention. Such determinations may also take into
15 account the prevalence of certain outcomes in the patient population
from which the
plurality of slides (and images thereof) were taken.
Thus, one skilled in the art will appreciate that the computer program product
embodiments of the present invention may be utilized to systematically
evaluate
complex combinations of thresholds, affectation rules, and corresponding
sequence-
20 based decision rules that may result when evaluating sets of markers so
as to
determine a marker combination and decision rule corresponding thereto that
will
approach and/or reach a targeted and/or optimal specificity and sensitivity
level.
One of skill in the art will appreciate that any or all steps in the methods
of the
invention could be implemented by personnel or, alternatively, performed in an
25 automated fashion. Thus, the steps of body sample preparation (see step
110, for
instance), sample staining (see step 110, for instance), and detection of
biomarker
expression (see step 120, for instance) may be automated. Moreover, in some
embodiments, the immunohistochemical methods of the invention are used in
conjunction with computerized imaging equipment and/or software to facilitate
the
identification of positive-staining cells by a pathologist. The methods
disclosed
herein can also be combined with other prognostic methods or analyses (e.g.,
tumor
size, lymph node status, expression levels of other biomarkers (including, for
instance, Her2/neu, Ki67, estrogen receptor (ER), progesterone receptor (PR)
and
CA 02580937 2007-03-21
WO 2006/036726
PCT/US2005/033931
26
p53). In this manner optimization and evaluation of the biomarkers using the
methods
described herein may facilitate the detection of overexpression of the various
biomarkers evaluated by the invention so as to permit a more accurate
determination
of the prognosis of a patient suffering from a disease that may be linked to
the
overexpression of one or more of the various biomarkers.
In addition, many modifications and other embodiments of the invention will
come to mind to one skilled in the art to which this invention pertains having
the
benefit of the teachings presented in the foregoing descriptions and the
associated
drawings, appendices and examples. Therefore, it is to be understood that the
invention is not to be limited to the specific embodiments disclosed and that
modifications and other embodiments are intended to be included within the
scope of
the appended claims. Although specific terms are employed herein, they are
used in a
generic and descriptive sense only and not for purposes of limitation.
The following experimental example describes the use of the embodiments of
the present invention in evaluating an example panel of 4 candidate biomarkers
and
quantifiable summary features thereof that may be used in establishing
prognoses for
breast cancer patients. It is offered by way of illustration and not by way of
limitation.
EXPERIMENTAL EXAMPLE: EVALUATION OF A PANEL OF BIOMARKERS
(SLPI, p2lras, E2F1 and src) FOR ESTABLISHING BREAST CANCER
PROGNOSES
Introduction:
According to the experimental example included herein, the embodiments of
the present invention may be used to evaluate a combination of biomarkers
whose
overexpression may be useful for establishing diagnoses and prognoses for
patients
having various types of breast cancer. In the case of the appended
experimental
example, and, in other embodiments of the present invention, a panel of
markers may
be evaluated to determine an optimal sequence-based decision rule. By "breast
cancer" is intended, for example, those conditions classified by biopsy as
malignant
pathology. The clinical delineation of breast cancer diagnoses is well-known
in the
CA 02580937 2007-03-21
WO 2006/036726
PCT/US2005/033931
27
medical arts. One of skill in the art will appreciate that breast cancer
refers to any
malignancy of the breast tissue, including, for example, carcinomas and
sarcomas. In
particular embodiments, the breast cancer is ductal carcinoma in situ (DCIS),
lobular
carcinoma in situ (LCIS), or mucinous carcinoma. Breast cancer also refers to
infiltrating ductal (DC) or infiltrating lobular carcinoma (ILC). In most
embodiments of the invention, the subject of interest is a human patient
suspected of
or actually diagnosed with breast cancer.
The American Joint Committee on Cancer (AJCC) has developed a
standardized system for breast cancer staging using a "TNM" classification
scheme.
Patients are assessed for primary tumor size (T), regional lymph node status
(N), and
the presence/absence of distant metastasis (M) and then classified into stages
0-IV
based on this combination of factors. In this system, primary tumor size is
categorized on a scale of 0-4 (TO = no evidence of primary tumor; Ti = <2 cm;
T2 =
>2 cm - <5 cm; T3 = >5 cm; T4 = tumor of any size with direct spread to chest
wall or
skin). Lymph node status is classified as NO-N3 (NO = regional lymph nodes are
free
of metastasis; Ni = metastasis to movable, same-side axillary lymph node(s);
N2 ---
metastasis to same-side lymph node(s) fixed to one another or to other
structures; N3
= metastasis to same-side lymph nodes beneath the breastbone). Metastasis is
categorized by the absence (MO) or presence of distant metastases. While the
evaluation of markers used to establish the prognosis of breast cancer
patients at any
clinical stage is encompassed by the present invention, the evaluation and
optimization of markers used to establish a prognosis for a breast cancer
patient in
early-stage breast cancer are of particular interest. By "early-stage breast
cancer" is
intended stages 0 (in situ breast cancer), I (Ti, NO, MO), IIA (T0-1, Ni, MO
or T2,
NO, MO), and JIB (T2, Ni, MO or T3, NO, MO). Early-stage breast cancer
patients
exhibit little or no lymph node involvement. As used herein, "lymph node
involvement" or "lymph node status" refers to whether the cancer has
metastasized to
the lymph nodes. Breast cancer patients are classified as "lymph node-
positive" or
"lymph node-negative" on this basis. Methods of identifying breast cancer
patients
and staging the disease are well known and may include manual examination,
biopsy,
review of patient's and/or family history, and imaging techniques, such as
mammography, magnetic resonance imaging (MRI), and positron emission
tomography (PET).
CA 02580937 2007-03-21
WO 2006/036726
PCT/US2005/033931
28
The term "prognosis" is recognized in the art and encompasses predictions
about the likely course of breast cancer or breast cancer progression,
particularly with
respect to likelihood of disease remission, disease relapse, tumor recurrence,
metastasis, and death. For the purposes of the example described herein, "good
prognosis" refers to the likelihood that a patient afflicted with breast
cancer, will
remain disease-free (i.e., cancer-free) for at least five years, while "poor
prognosis" is
intended to mean the likelihood of a relapse or recurrence of the underlying
cancer or
tumor, metastasis, or death within less than five years. Cancer patients
classified as
having a "good outcome" remain free of the underlying cancer or tumor for at
least
five years. In contrast, "bad outcome" cancer patients experience disease
relapse,
tumor recurrence, metastasis, or death within five years. As used herein, the
relevant
time for assessing prognosis or disease-free survival time begins with the
surgical
removal of the tumor or suppression, mitigation, or inhibition of tumor
growth.
As described herein above, a number of clinical and prognostic breast cancer
factors are known in the art and are used to predict the likelihood of
treatment
outcome and disease recurrence. Such factors include lymph node involvement,
tumor size, histologic grade, estrogen and progesterone hormone receptor
status
(ER/PR), Her 2/neu levels, and tumor ploidy. Using the methods of the present
invention, the evaluation of a combination of markers and a feature thereof
used in
establishing the prognosis of an early-stage breast cancer patient can be
accomplished
in a systematic manner independent of or in combination with assessment of
these or
other clinical and prognostic factors.
The methods of the invention permit the systematic evaluation of candidate
biomarkers (and features thereof) so as to provide superior assessment of
breast
cancer prognosis in comparison to analysis of other known prognostic
indicators (e.g.,
lymph node involvement, tumor size, histologic grade, estrogen and
progesterone
receptor levels, Her 2/neu status, tumor ploidy, and family history).
Breast cancer is managed by several alternative strategies that may include,
for
example, surgery, radiation therapy, hormone therapy, chemotherapy, or some
combination thereof. As is known in the art, treatment decisions for
individual breast
cancer patients can be based on the number of lymph nodes involved, estrogen
and
progesterone receptor status, size of the primary tumor, and stage of the
disease at
diagnosis. Stratification of patients into poor prognosis or good prognosis
risk groups
CA 02580937 2007-03-21
WO 2006/036726 PCT/US2005/033931
29
at the time of diagnosis using the methods disclosed herein may provide an
additional
or alternative treatment decision-making factor. The methods of the invention
permit
the analysis and evaluation of candidate biomarkers used to differentiatie
those breast
cancer patients with a good prognosis from those more likely to suffer a
recurrence
(i.e., patients who might need or benefit from additional aggressive treatment
at the
time of diagnosis). The methods of the invention find particular use in
choosing
appropriate biomarkers, features thereof, and feature thresholds so as to
maximize the
prognostic value of a candidate biomarker (or panel of biomarkers) in
establishing a
more accurate prognosis of an early-stage breast cancer patient. As discussed
above,
the majority of breast cancer patients diagnosed at an early-stage of the
disease enjoy
long-term survival following surgery and/or radiation therapy without further
adjuvant therapy. A significant percentage (approximately 20%) of these
patients,
however, will suffer disease recurrence or death, leading to clinical
recommendations
that some or all early-stage breast cancer patients should receive adjuvant
therapy
(e.g., chemotherapy). The methods of the present invention find use in
evaluating
biomarkers and features thereof that may better highlight this high-risk, poor
prognosis population of early-stage breast cancer patients and thereby
determining
which patients would benefit from continued and/or more aggressive therapy and
close monitoring following treatment.
In this experimental example, the methods of the present invention were
utilized to evaluate a panel of 4 candidate biomarkers (SLPI, p2lras, E2F1 and
src)
and a single summary feature corresponding to each biomarker (extracted using
an
image-processing system). The example shows the determination of an optimal
sequence-based decision rule according to one embodiment of the present
invention.
The features utilized in the example relate to the percentage of 1+, 2+ and 3+
cells in
breast cancer tumor regions identified as regions of interest (ROT) by a
pathologist.
Based upon these features, sensitivity and specificity couples were maximized
for the
selected marker/feature combinations using optimal sequence-based decision
rules
(consisting of thresholds and affectation rules).
Materials and Methods:
In this experimental example, over 200 patients were analyzed in order to
evaluate and optimize different marker and feature combinations for
establishing
CA 02580937 2015-01-30
=
62451-1002
. breast cancer prognoses. As summarized in Table 4, this population of
patients is
quite heterogeneous and exhibits tumors of different stages ranging from T1NO
to
T3NO. The targeted characteristic of the patients is their good outcome or bad
outcome status. Good outcome patients were those still disease-free after five
years;
5 bad outcome patients were defined as patients with recurrence or death
within five =
years. Body samples and corresponding slides taken thereof were taken from
each
patient so as to provide body samples having a known outcome such that
specificity
and sensitivity couples could be determined for each possible
marker/feature/threshold combination as described above.
10 The body samples from the study (from the same patient population
outlined
in Table 4) were then exposed to the panel of 4 biomarkers (see Table 5) and
corresponding slides were produced so as to subject themarked slides to the
methods
of the present invention. The following steps highlight the method of the
present
= invention as it was applied in this experimental example: (1) chrornogen
separation
15 was optimized for each marker that showed the best quality stain
(according to the
chrom ogen separation methods of the '446 application and the '729
application); (2) =
segmentation set up was customized for each marker according to its sub-
cellular
localization; see Table 1 (nucleus, cytoplasm or membrane). (See also the
NUCL, =
CYTO, and MEMB features highlighted in the attached appendix of example
20 features); and (3) features were extracted at cell, field of view (FOV)
and focus level,
within the defined ROT and exported to an output file (XML format).
A specific computer program product according to one embodiment of the .
.
present invention (in this example named "Multi Marker Analyzer") was then
used to
complete the evaluation and optimization of the marker combinations. According
to = =
25 one embodiment, the computer program product is configured to be capable
of
loading all or a portion of either tissue micro-arrays (TMA) or tissue section
XML =
files generated using microscopy, to merge data contained in these files using
XML
files describing the TMA keys (in the case of a TMA analysis) or Excel files
giving
patient clinical status and patient evaluation (in the case of a tissue
section analysis)
30 and all the further analyzes. This merge process consists in the
association of the . .
features extracted via microscopy for each body sample (corresponding to each
. patient) with the infonnation kept in the TMA key (or the Excel file)
about the
patient: identification number and medical status (including Good or Bad
outcome)
CA 02580937 2007-03-21
WO 2006/036726
PCT/US2005/033931
31
and the pathologist evaluation if it is not included in the XML formatted
file.
Table 5 lists the markers evaluated in this example (SLPI, p2lras, E2F1 and
src) and the corresponding CELL_PERCENT summary features extracted for each
marker type (this example shows the establishment of a sequence-based decision
rule
for four markers wherein single-marker/single feature thresholds were analyzed
to
determine an optimal sequence-based decision rule). The decision rule was
created
using the methods of the present invention outlined in FIG. 1 wherein the
predicted
prognoses (for each possible sequence of markers, wherein each marker is
either "on"
(1) or "off' (0). In order to determine thresholds for the feature evaluated
for each
particular marker (see Table 5) each possible threshold amount (from 0 to
100%) was
analyzed and compared to the outcomes for the various patients in the study
from
which the body samples for the example were taken. For example, FIG. 5 shows
the
distribution curves for CELL PERCENT 2 corresponding to the E2F1 marker. The
plot shows the distribution of bad outcome patients 520 and the distribution
of good
outcome patients 510 as a function of CELL_PERCENT_2 values. As is shown in
FIG. 5, above the 2-3 percent limit, Bad Outcome patients (520) are
significantly
more frequent than Good Outcome patients (510). Using a threshold 550 of 2.46%
would give sensitivity and specificity of 0.54 and 0.75, respectively with the
use of
the E2F1 marker alone as a prognostic indicator. Column 3 of Table 5 shows the
resulting decision rule determined for the E2F1 marker from the data in FIG. 5
(which
includes both the threshold of 2.46% and affectation rule ("on" if greater
than 2.46%
CELL PERCENT 2) for E2F1).
Candidate prognoses (corresponding to each possible combination of
sequences) were generated and then compared to the actual outcomes for each of
the
body samples being evaluated using the quadrant system in FIG. 2 in order to
determine the number of true positives 210, false positives 220, false
negatives 230
and true negatives 240. As described in detail above, once plotted in the
appropriate
quadrants, specificity and sensitivity values corresponding to each possible
decision
rule were computed (the results of such computations are shown in Table 6).
The
sequence-based decision rule determined from the data of Table 6 can be read
as
follows: if E2F1 is ON (i.e. 1) and not the only one marker to be ON then the
patient
is considered bad outcome, good outcome otherwise.
CA 02580937 2007-03-21
WO 2006/036726
PCT/US2005/033931
32
Results:
Using only one percentage feature for SLPI, p2lras, E2F1 and src with
thresholds and decision rule defined in Table 5, 60 % sensitivity and 80 %
specificity
was reached on this sample set using a rather simple sequence-based decision
rule: if
E2F1 is ON (i.e. 1) and not the only one marker to be ON then the optimal
prognosis
for the patient is bad outcome. Therefore, the prognosis for the patient is
good
outcome otherwise.
As described above, a prognostic decision rule based on E2F1 alone would
give sensitivity and specificity of 54% and 75%, respectively. However, using
an
interpretation-based marker combination when E2F1 is ON and either SLPI,
p2lras or
src is ON leads to 60 % sensitivity and 80 % specificity (using the sequence-
based
decision algorithm defined by the results of Table 6).
APPENDIX: EXAMPLE FEATURES
The following features are indicative of the types of quantifiable features
that
may be extracted from an image of a body sample (such as a stained
histological slide
or a cytological slide) using an imaging system or video-microscopy system in
communication with, for instance, a controller such as a computer device.
Furthermore, the following features may be extracted and/or computed using
embodiments of the computer program product described herein. In some
embodiments, the following features may be compounded and/or combined so as to
build summary features that may be more easily utilized by a clinician to
quantify a
value that may correspond to a prognostic indicator for a particular disease
that may
be linked to the overexpression (and resulting dye staining) of a particular
target
molecule.
It should be understood that the following appendix of features is offered by
way of illustration and not by way of limitation. One skilled in the art will
appreciate
that other features may be of interest and may be extracted and analyzed so as
to
evaluate one or markers using the methods and computer program product
embodiments of the present invention.
CA 02580937 2007-03-21
WO 2006/036726
PCT/US2005/033931
33
A. Shape Descriptor Features:
1. AREA
This is the number of foreground pixels in a blob (holes are not counted),
which mask (binary representation) is M. When pixel to micron correspondence
is
available (k) it represents the physical area of the blob (M) on the slide
(micrometers2). If no physical correspondence of pixel to micron (k) is
available
AREA is the number of measured pixels (k=1).
Area = k2 x E p
peE (9)
with E = 1p I p e MI
Range is [0,4
2. PERIMETER
This is the total length of edges in a blob (including the edges of any holes)
),
which mask (binary representation) is M, with an allowance made for the
staircase
effect that is produced when diagonal edges are digitized (inside corners are
counted
as -5, , rather than 2.). A single pixel blob (area = 1) has a perimeter of
4Ø When
pixel to micron correspondence is available (k) it represents the physical
perimeter of
the blob (M) on the slide (micrometers). If no physical correspondence of
pixel to
micron is available (k=1).
Perimeter = kx EpeE p x q(np) (10)
1 t
with E = {p I p e MI and np = 1 p r , if p Interior and p is a Corner then
b ,
else q(n) = 4 ¨ E (t, 1,r ,b)
Range is [0,04
CA 02580937 2007-03-21
WO 2006/036726
PCT/US2005/033931
34
3. MINFERET
This is the smallest Feret diameter (minimum bounding diameter of a
rectangular box fitting the object, found after checking a certain number of
angles).
When pixel to micron correspondence is available (k) it represents the
physical Min
Feret diameter of the blob (M) on the slide (micrometers). If no physical
correspondence of pixel to micron is available (k=1).
Range is 10,4
4. MAXFERET
This is the largest Feret diameter (maximum bounding diameter of a
rectangular box fitting the object, found after checking a certain number of
angles).
When pixel to micron correspondence is available (k) it represents the
physical Max
Feret diameter of the blob (M) on the slide (micrometers). If no physical
correspondence of pixel to micron is available (k=1).
Range is [0, co[
5. COMPACTNESS
This value is a minimum for a circle (1.0) and is derived from the perimeter
(P) and area (A). The more convoluted the shape, the greater the value.
P2
Compactness =
47-al (11)
Range is [1,4
6. ROUGHNESS
This is a measure of how rough a blob is and is equal to perimeter (P) divided
by the convex perimeter (Pa). A smooth convex object will have the minimum
roughness of 1.0
Roughness = ¨ (12)
Range is [0,1]
CA 02580937 2007-03-21
WO 2006/036726
PCT/US2005/033931
7. ELONGATION
This value is equal to the true Length / Breadth. It should be used for long
thin objects.
5 Range is [0, co[
B. Histogram Descriptor Features
10 1. SUM
The SUM is the sum of all the individual pixel scores.
Su = i0
E255 i
Sum X h(i) (13)
=
15 Range is [0, co[ for transmittances and for optical densities
2. MEAN
The arithmetic mean is what is commonly called the average: When the word
"mean" is used without a modifier, it can be assumed that it refers to the
arithmetic
20 mean. The mean is the sum of all the scores divided by the number of
scores. The
mean is a good measure of central tendency for roughly symmetric distributions
but
can be misleading in skewed distributions since it can be greatly influenced
by
extreme scores. Therefore, other statistics such as the median may be more
informative for distributions such as reaction time or family income that are
25 frequently very skewed.
The sum of squared deviations of scores from their mean is lower than their
squared deviations from any other number.
For normal distributions, the mean is the most efficient and therefore the
least
subject to sample fluctuations of all measures of central tendency.
r 2.55 i x
Mean = L'1.0 (14)
CA 02580937 2007-03-21
WO 2006/036726
PCT/US2005/033931
36
with N =E255 h(i)
i=o
Range is [OA for transmittances
Range is [0.0000,2.4065] for optical densities
3. MIN
The min is the smallest value of a distribution.
Min= 40
1{> 0,Eh(i).0} (15)
i=o
Range is [0,1] for transmittances
Range is [0.0000,2.4065] for optical densities
4. Q1
Q1 is the 25th percentile of a distribution. 25% of the scores are below Q1
and
75% are above Ql.
j<i
Nj<=iN
= Ehki)<¨, (16)
J=O 4 .J=0 4
with N =
i=o
Range is [0,1] for transmittances
Range is [0.0000,2.4065] for optical densities
5. MEDIAN
The median is the middle of a distribution: half the scores are above the
median and half are below the median. The median is less sensitive to extreme
scores
than the mean and this makes it a better measure than the mean for highly
skewed
distributions.
The sum of the absolute deviations of each number from the median is lower
than is the sum of absolute deviations from any other number.
The mean, median, and mode are equal in symmetric distributions. The mean
CA 02580937 2007-03-21
WO 2006/036726
PCT/US2005/033931
37
is higher than the median in positively skewed distributions and lower than
the
median in negatively skewed distributions
j<i N N
Median = 2 = Ehki < ¨ (17)
i=o 2 2
with N
i.o
Range is [0,1] for transmittances
Range is [0.0000,2.4065] for optical densities
6. Q3
Q3 is the 75th percentile of a distribution. 75% of the scores are below Q3
and
25% are above Q3.
i<1 x
Q3 = {Eho<N34 Nx 3}
(18)
4
j=0
with N
Range is [0,1] for transmittances
Range is [0.0000,2.4065] for optical densities
7. MAX
The max is the largest value of a distribution.
255
Max = 1{40> 0, E 0} (19)
j=i+i
Range is [0,1] for transmittances
Range is [0.0000,2.4065] for optical densities
8. MODE
The mode is the most frequently occurring score in a distribution and is used
as a measure of central tendency. The advantage of the mode as a measure of
central
CA 02580937 2007-03-21
WO 2006/036726
PCT/US2005/033931
38
tendency is that its meaning is obvious. Further, it is the only measure of
central
tendency that can be used with nominal data.
The mode is greatly subject to sample fluctuations and is therefore not
recommended to be used as the only measure of central tendency. A further
disadvantage of the mode is that many distributions have more than one mode.
These
distributions are called "multimodal."
In a normal distribution, the mean, median, and mode are identical.
f.Mode= ili120)>= h012.,5_05}
(20)
Range is [OA for transmittances
Range is [0.0000,2.4065] for optical densities
9. TRIMEAN
The trimean is computed by adding the 25th percentile + twice the 50th
percentile (median) + the 75th percentile and dividing by four.
The trimean is almost as resistant to extreme scores as the median and is less
subject to sampling fluctuations than the arithmetic mean in skewed
distributions. It
is less efficient than the mean for normal distributions.
TriMean=Q1+ 2Q2 + Q3
4 (21)
Range is [OA for transmittances
Range is [0.0000,2.4065] for optical densities
10. TRIMMEDMEAN50
A trimmed mean is calculated by discarding a certain percentage of the lowest
and the highest scores and then computing the mean of the remaining scores. A
mean
trimmed 50% is computed by discarding the lower and higher 25% of the scores
and
taking the mean of the remaining scores. The median is the mean trimmed 100%
and
the arithmetic mean is the mean trimmed 0%.
A trimmed mean is obviously less susceptible to the effects of extreme scores
CA 02580937 2007-03-21
WO 2006/036726
PCT/US2005/033931
39
than is the arithmetic mean. It is therefore less susceptible to sampling
fluctuation
than the mean for skewed distributions. It is less efficient than the mean for
normal
distributions.
x
TriminedMean50 = __ 1
Ii=Q3(22)
i=Q1
Range is [0,1] for transmittances
Range is [0.0000,2.4065] for optical densities
11. RANGE
The range is the simplest measure of spread or dispersion: It is equal to the
difference between the largest and the smallest values. The range can be a
useful
measure of spread because it is so easily understood. However, it is very
sensitive to
extreme scores since it is based on only two values. The range should almost
never
be used as the only measure of spread, but can be informative if used as a
supplement
to other measures of spread such as the standard deviation or semi-
interquartile range.
Range = Max ¨ Min (23)
Range is [0,1] for transmittances
Range is [0.0000,2.4065] for optical densities
12. SEMIINTERQUARTILERANGE
The semi-interquartile range is a measure of spread or dispersion. It is
computed as one half the difference between the 75th percentile [often called
(Q3)]
and the 25th percentile (Qi).
Since half the scores in a distribution lie between Q3 and Ql, the semi-
interquartile range is 1/2 the distance needed to cover 1/2 the scores. In a
symmetric
distribution, an interval stretching from one semi-interquartile range below
the
median to one semi-interquartile above the median will contain 1/2 of the
scores.
This will not be true for a skewed distribution, however.
The semi-interquartile range is little affected by extreme scores, so it is a
good
CA 02580937 2007-03-21
WO 2006/036726
PCT/US2005/033931
measure of spread for skewed distributions. However, it is more subject to
sampling
fluctuation in normal distributions than is the standard deviation and
therefore not
often used for data that are approximately normally distributed.
5
SemiInteratartileRatge= Q3
(24)
2
Range is [0,1] for transmittances
Range is [0.0000,2.4065] for optical densities
13. VARIANCE
The variance is a measure of how spread out a distribution is. It is computed
as the average squared deviation of each number from its mean.
Variance=nE,x2 ¨(xY
E
(25)
n(n-1)
Range is [0, oo[
14. STDEV
This feature estimates standard deviation based on a sample. The standard
deviation is a measure of how widely values are dispersed from the average
value (the
mean). The standard deviation is the square root of the variance. It is the
most
commonly used measure of spread.
Although less sensitive to extreme scores than the range, the standard
deviation is more sensitive than the semi-interquartile range. Thus, the semi-
interquartile range should supplement the standard deviation when the
possibility of
extreme scores is present.
2
nEx 4E42
Stdev =1
n(n ¨1) (26)
Range is [0,04
CA 02580937 2007-03-21
WO 2006/036726
PCT/US2005/033931
41
15. SKEW
This feature returns the skewness of a distribution. Skewness characterizes
the
degree of asymmetry of a distribution around its mean. A distribution is
skewed if
one of its tails is longer than the other. Positive skewness indicates a
distribution with
an asymmetric tail extending toward more positive values. Negative skewness
indicates a distribution with an asymmetric tail extending toward more
negative
values.
r ¨N3
nv xi ¨ x
Skew= , _______________________________________________________ (27)
VI ¨1)(n ¨ 2) L'''' S i
Range is ]-00,+00[
with S is the sample standard deviation
16. KURTOSIS
This feature returns the kurtosis of a data set. Kurtosis characterizes the
relative peakedness or flatness of a distribution compared with the normal
distribution. Positive kurtosis indicates a relatively peaked distribution.
Negative
kurtosis indicates a relatively flat distribution. Kurtosis is based on the
size of a
distribution's tails.
( -\4
n(n +1) v x }
Kurtosis = {
(n ¨1)(n ¨ 2)(n ¨3) z' S xi ¨ ( _________ (28)n ¨ 2Xn
¨3)
e
Range is 1¨ 00,+4
S is the sample standard deviation.
C. Transmittance and Optical Density Features (TRANS, OD, and others)
1. TRANS - Transmittance
Transmittance is the ratio of the total radiant or luminous flux transmitted
by a
transparent object to the incident flux, usually given for normal incidence.
CA 02580937 2007-03-21
WO 2006/036726
PCT/US2005/033931
42
Trans = ¨ (29)
/0
Range is [OA
Within images, transmittance is discretized on 8bits leading to 256 values
within
[0,255] range. If underlying computation is based upon such discrete values,
computed features are however expressed within [0,1] range, from 0% to 100%
transmittance.
Trans255 = 255 __ 1255 [0,255]
/01255 (30)
2. OD ¨ Optical density
Optical density relates to Transmittance as the negative value of its
logarithm.
Within images, transmittance is discretized on 8bits leading to 256 values
within
[0,255] range.
OD = ¨logio (Trans) = logio (31)
Range is [0.0000,2.4065]due to 8bits discretization of transmittances
Temporary OD image buffers are also discrete buffers.
(255\ r
0D255 k x logio ____________________
(/1255 = k xlogio ___________________________________ ,L0,255} (32)
1255 J 1255
255
with k = log (255),OD255(Trans 2550)) = 0D255 Trans255(i))
If the underlying computation is based upon such discrete values, computed
features are however expressed according to real OD values ranging from 0 to
infinite
(theoretical), cast on upper limits to 2.4065 in practice due to 8 bits
constraint.
CA 02580937 2015-01-30
-
= =
62451-1002
=
43
=
3. Luminance and Dye Features (LUMIN, DYE1, DYE2, DYE3)
The histogram features computed on Transmittance or Optical density
histograms reflect either the Luminance ("LUMIN") of the RGB image or the Dye
of
interest calculated after solving the chromogen model for the pixel (R,G,B)
value
("DYE1", "DYE2" or "DYE3"). The RGB chromogen separation model is described
for instance in the '446 application and the '729 application.
LUMIN (Y) = 0.299R 0.587G + 0.114B Conventional floating-point
equations (33)
LUMIN (y) = [(9798 R + 192350 + 3736 B) /32768] Equations used by code
(34)
Note: ChronxIgen Errors, dye confidence
When solved, the RGB chromogen separation model evaluates a
reconstruction error, which is the Euclidean distance within the RGB space
between
the input RGB value of the pixel and the recomputed RGB value based upon the
reconstruction of the ROB value from each dye contribution. This error can be
=
evaluated for each and every pixel of the object of interest reported using
the methods
. and apparatus of the ROB chromogen separation model referenced
above.
Depending on the chromogen error measured for each RGB value and the =
noise level (NOISE) recorded within the optical system when acquiring the
white
. reference image used to perform shading correction and image normalization,
a
confidence is computed for each dye based upon the probability that the
transmittance
evaluated for this pixel would not statistically vary more than the ability of
he human
eye to discriminate between different transmittances.
D. Hierarchy Descriptor Features
When computing features relative to the different hierarchical objects (such
as
a cell, cell membrane, nucleus, or other object) within a slide (such as a
histological =
= slide) or image of a slide, the features may be evaluated with respect to
the following
hierarchical reference fields: the slide (SLIDE), the focus (FOCUS), the field
of view
(FOV) or the cell (CELL) relative to that object.
=
CA 02580937 2007-03-21
WO 2006/036726
PCT/US2005/033931
44
= Slide: "SLIDE", and related "FOCUS",
"FOV", "CELL"
= Focus: "FOCUS", and related "FOV", "CELL"
= Field of View: "FOV", and related
"CELL"
= Cell: "CELL"
E. Cellular Descriptor Features
When computing cell features, the features are reflected in one or more of the
following cellular or sub-cellular localities: the whole cell (CELL), the
nucleus
(NUCL), the cytoplasm (CYTO) or the cell membrane (MEMB).
= Whole cell: "CELL"
= Nucleus: "NUCL"
= Cytoplasm: "CYTO"
= Membrane: "MEMB"
APPENDDC OF TABLES:
Table 1: List of exemplary markers
and their respective sub-cellular
localization.
Marker Name Localization
E2F1 Nucleus
MUC-1 (1F3.9) Membrane
NDRG-1 (ZYMED CAP43) Cytoplasm (Nucleus + Membrane)
p21' Cytoplasm
p53 Nucleus
Phospho p27 Cytoplasm (Nucleus)
PSMB9 (3A2.4) Cytoplasm
SLPI (5G6.24) Cytoplasm
STC Cytoplasm
CA 02580937 2007-03-21
WO 2006/036726 PCT/US2005/033931
Table 2: Dispatcher settings resulting in the
affectation of selected cells into category 1, 2 or 3.
Marker Value
Dispatch
Targeted Cell If Feature Is (Transmit- Cell(s) Is
Step
Compartment tance)
0.161151 (2 or 3)
1 NUCL DYE2 OD MEAN > All
_ _ _
(69%) otherwise 1
Nucleus
0..29243
2 NUCL DYE2 OD MEAN > 2 and 3 3 otherwise 2
_ _ _
(51%)
0.173925 (2 or 3)
1 CYTO DYE2 OD MEAN > All
_ _ _
(67%) otherwise 1
Cytoplasmic
0_29243
2 CYTO DYE2 OD MEAN > 2 and 3 3
otherwise 2
_ _ _
(51%)
0_06048
CYTO DYE2 OD MEAN >
_ _ _
(87%)
(2 or 3)
1 0.200659 All
MEMB DYE2 OD MEAN >
_ _ _ otherwise 1
(63%)
MEMB AREA > 150 pix.
Membrane
0.173925
CYTO DYE2 OD MEAN >
_ _ _
(67%)
2 0.29243 2 and 3 3 otherwise 2
MEMB DYE2 OD MEAN >
_ _ _
(51%)
' MEMB_AREA > 1 50 pix.
5 Table 3: Percentage
Summary Features.
Percentage of cells
Feature N ame
from categories
0 CELL_PERC ENT_O
1 CELL_PERCENT_1
2 CELL_PERC ENT_2
3 CELL_PERCENT_3
0 and 1 CELL_PERCENT_01
2 and 3 CELL_PERCENT_23
0, 1 and 2 CELL_PERCENT_012
1,2 and 3 CELL_PERCENT_123
CA 02580937 2007-03-21
WO 2006/036726
PCT/US2005/033931
46
Table 4: Description and Outcomes of
Patients from which Body Samples
were Taken (Experimental Example)
Stage Good Bad All
T1NO 60 20 80
T1N1 6 7 13
T2NO 59 39 98
T3NO 6 10 16
Totals 131 76 207
Table 5: Percentage summary features for
Experimental Example (showing threshold values
determined for sequence-based decision rule).
Marker Feature Threshold Rule (1 if)
SLPI CELL PERCENT 01 99.887874
p21ras CELLIPERCENTIO 35.642851
E2F1 CELL PERCENT_2 2.463659
src CELLIPERCENT_1 37.624326
CA 02580937 2007-03-21
WO 2006/036726 PCT/US2005/033931
47
Table 6: Sensitivity and Specificity couples using
sequence interpretation approach for SLPI, p2lras,
E2F1 and SRC combination from Experimental
Example. (Sequence S0110 must be read as
follows: SLPI=OFF / p2lras=ON / E2F1=ON /
src=OFF.)
SLPI-p21ras-E2F1-src
Sequence CumulBad CumulGood Sensitivity Specificity
51111 4 0 0.069 1
S1011 7 0 0.1207 1
S1110 12 0 0.2069 1
S0111 14 8 0.2414 0.9184
S1010 22 12 0.3793 0.8776
S1101 26 14 0.4483 0.8571
S0011 31 16 0.5345 0.8367
S0110 35 19 0.6034 0.8061
S1001 37 24 0.6379 0.7551
S1100 37 26 0.6379 0.7347
S0010 39 37 0.6724 0.6224
S0101 41 40 0.7069 0.5918
S1000 46 56 0.7931 0.4286
S0001 49 63 0.8448 0.3571
S0100 52 71 0.8966 0.2755
S0000 58 98 1 0
Table 7: Details of X2 analysis formulas resulting in the computation
of a X2 value for the Good outcome patients (X2Good) and a X2 value
for Bad Outcome patients (X2Bad,1
\---=
Good outcomes
Sequence Observed Theoretical Weighted Deviation
00 a P(001Good) x S (a -
P(00IGood) x S)2/( P(00IGood) x S)
01 b P(01 !Good) x S (b -
P(01 lGood) x S)21( P(01 Good) x S)
10 c P(10IGood) x S (c -
P(10IGood) x S)21( P(10IGood) x S)
11 d P(111Good) x S (d -
P(11 'Good) x S)2/( P(111Good) x S)
Sum S=(a+b+c+d) S X2Good
HoGood: Markers are independent regarding Good outcome patients
CA 02580937 2007-03-21
WO 2006/036726
PCT/US2005/033931
48
Bad outcomes
Sequence Observed Theoretical Weighted Deviation
00 a P(001Bad) x S (a -
P(001Bad) x 5)2/( P(001Bad) x S)
01 b P(011Bad) x S (b -
P(01 Bad) x S)2/( P(011Bad) x S)
c P(101Bad) x S (c - P(101Bad) x S)21(
P(101Bad) x S)
11 d P(111Bad) x S (d -
P(111Bad) x S)21( P(111Bad) x S)
Sum S=(a+b+c+d) S X2Bad
HoBad: Markers are independent regarding Bad outcome patients
All publications and patent applications mentioned in the specification are
5 indicative
of the level of those skilled in the art to which this invention pertains. All
publications and patent applications are herein incorporated by reference to
the same
extent as if each individual publication or patent application was
specifically and
individually indicated to be incorporated by reference.
Although the foregoing invention has been described in some detail by way of
10 illustration and example for purposes of clarity of understanding, it
will be obvious
that certain changes and modifications may be practiced within the scope of
the
appended embodiments.