Note: Descriptions are shown in the official language in which they were submitted.
CA 02583059 2007-03-26
08876.105047
METHOD AND SYSTEM FOR CALIBRATING A TUBE SCANNER
This application claims benefit of U.S. Provisional Application Ser. No.
60/786,661, filed on March 28, 2006.
FIELD OF THE INVENTION
The present invention relates generally to a scanner instrument for collecting
and
analyzing data describing a tube associated with an oil well and relates more
specifically
to calibration of the scanner instrument.
BACKGROUND
During the drilling, completion and maintenance of an oil well, personnel
routinely insert and/or extract devices such as tubing, tubes, pipes, rods,
hollow cylinders,
casing, conduit, collars, and duct into the well. For example, a service crew
may use a
workover rig or service rig to extract a string of tubing and sucker rods from
a well that
has been producing petroleum. The crew may inspect the extracted tubing and
evaluate
whether one or more sections of that tubing should be replaced due to physical
wear,
thinning of the tubing wall, chemical attack, pitting, or other defect. The
crew typically
replaces sections that exhibit an unacceptable level of wear and makes note of
other
sections that are beginning to show wear and may need replacement at a
subsequent
service call.
As an alternative to manually inspecting tubing, the service crew may deploy
an
instrument to evaluate the tubing as the tubing is extracted from the well
and/or inserted
into the well. The scanning instrument typically remains stationary at the
wellhead, and
the workover rig moves the tubing through the instrument's measurement zone.
This
instrument may be called a "tube scanner".
The tube scanner typically measures pitting and wall thickness and can
identify
cracks in the tubing wall. Radiation, field strength (electrical,
electromagnetic, or
magnetic), and/or fluid pressure differential may interrogate the tubing to
evaluate these
1
CA 02583059 2007-03-26
08876.105047
wear parameters. The tube scanner typically produces a raw analog signal and
outputs a
sampled or digital version of that analog signal.
In other words, the tube scanner typically stimulates a section of the tubing
using
a field, radiation, or pressure and detects the tubing's interaction with or
response to the
stimulus. An element, such as a transducer, converts the response into an
analog
electrical signal. For example, the tube scanner may create a magnetic field
into which
the tubing is disposed, and the transducer may detect changes or perturbations
in the field
resulting from the presence of the tubing and any anomalies of that tubing.
The analog electrical signal output by the transducer can have an arbitrary or
essentially unlimited number of states or measurement possibilities. That is,
rather than
having two discrete or binary levels, typical transducers produce signals that
can assume
any of numerous levels or values. As the tubing passes through the measurement
field of
the instrument, the analog transducer signal varies in response to variations
and
anomalies in the wall of the moving tubing.
The tube scanner also typically includes a system, such as an analog-to-
digital
converter ("ADC"), that converts the analog transducer signal into one or more
digital
signals suited for reception and display by a computer. These digital signals
typically
provide a "snapshot" of the transducer signal. Thus, the ADC typically outputs
a number,
or set of a numbers, that represents or describes the analog transducer signal
at a certain
instant in time. Because the analog transducer signal describes the section of
tubing that
is in the tube scanner's measurement zone, the digital signal is effectively a
sample or a
snapshot of a parameter-of-interest of that tubing section.
The signals generated by the tube scanner may fluctuate or drift over time.
Vibrations or mechanical shocks that occur during transportation of the
instrument may
slightly alter the performance of the tube scanner. Thermal variance, power
fluctuations,
or vibrations during the operation of the tube scanner may cause drift or
noise in the
readings output by the tube scanner. These fluctuation, drift, and noise
components of
the signals output from the tube scanner may lead to inconsistencies of the
type that
would result in two different tube scanner outputs from scanning the same pipe
at two
2
CA 02583059 2007-03-26
08876.105047
=
different times. Such inconsistencies are undesirable when the tube scanner
outputs are
used for evaluating the wear and wear patterns of the tubing and determining
if particular
sections of tubing should be retained for reuse or otherwise discarded.
To address these representative deficiencies in the art, an improved
capability for
calibrating the tube scanner is needed. A need also exists for a capability of
an oilfield
service crew to calibrate the tube scanner in the field. A further need exists
for a
capability to use one or more post-operational calibrations to correct,
validate, or flag the
data scanned during the operation of the tube scanner.
SUMMARY OF THE INVENTION
The present invention relates to a method for calibrating a scanner instrument
used for scanning tubing that is being placed into an oil well or being
removed from the
well. This scanning instrument may be called a "tube scanner". In one aspect
of the
present invention, a method for calibration of the tube scanner may involve
scanning a
tubing standard with known characteristics and then computing the relationship
between
the data from the scan and the known characteristics of the tubing standard.
This
relationship between the expected and actual data may then be used as the
calibration
function of the tube scanner.
In another aspect of the present invention, a method for calibration of the
tube
scanner may include adjusting the data collected while scanning a string of
tube segments
based on equalizing the data peaks that occur in the scan data at the coupling
joints
between tube segments.
In yet another aspect of the present invention, the dependence of the results
of a
tube scan upon the speed at which the tube moves through the scanner is
determined.
The inventive tube scanner calibration may establish typical, fast limit, and
slow limit
metrics for the speed at which a tube should be moved through a tube scanner.
The
typical speed would be the one where the calibrated scanner reproduces
expected scan
values most closely and the fast limit and slow limit would be the scan speeds
where the
tube scanner still operates within tolerances, but movement of tubing through
the tube
3
CA 02583059 2007-03-26
08876.105047
scanner that is faster that the fast limit or slower than the slow limit may
introduce
excessive error into the scan. These limit values can be used by the crew to
guide their
operation of the rig while extracting or inserting tubing through the tube
scanner.
The discussion of tube scanner calibration presented in this summary is for
illustrative purposes only. Various aspects of the present invention may be
more clearly
understood and appreciated from a review of the following detailed description
of the
disclosed embodiments and by reference to the drawings and any claims that may
follow.
Moreover, other aspects, systems, methods, features, advantages, and objects
of the
present invention will become apparent to one with skill in the art upon
examination of
the following drawings and detailed description. It is intended that all such
aspects,
systems, methods, features, advantages, and objects are to be included within
this
description, are to be within the scope of the present invention, and are to
be protected by
any accompanying claims.
BRIEF DESCRIPTION OF THE DRAWINGS
Figure 1 is an illustration of an exemplary system for servicing an oil well
where
the system scans tubing as the tubing is extracted from or inserted into the
well in
accordance with an exemplary embodiment of the present invention.
Figure 2 is a functional block diagram of an exemplary system for scanning
tubing that is being inserted into or extracted from an oil well in accordance
with an
exemplary embodiment of the present invention.
Figure 3A illustrates a vertical cross-section of an exemplary tube standard
for use
in calibrating a tube scanner in accordance with an exemplary embodiment of
the present
invention.
Figure 3B illustrates a horizontal cross-section of the rotationally variant
region of
an exemplary tube standard disposed within a circular array of transducer
elements in
accordance with an exemplary embodiment of the present invention.
4
CA 02583059 2007-03-26
.
.=
08876.105047
Figure 4 is a flowchart of an exemplary process for scanning tubing that is
being
inserted into or extracted from an oil well and for calibrating the tube
scanner using a
tube standard in accordance with an exemplary embodiment of the present
invention.
Figure 5 is a flowchart of an exemplary process for calibrating a tube scanner
using a tube standard and stored information about the standard in accordance
with an
exemplary embodiment of the present invention.
Figure 6 is a flowchart of an exemplary process for scanning tubing that is
being
inserted into or extracted from an oil well and for calibrating the tube
scanner based on
the scanned information in accordance with an exemplary embodiment of the
present
invention.
Many aspects of the present invention can be better understood with reference
to
the above drawings. The components in the drawings are not necessarily to
scale,
emphasis instead being placed upon clearly illustrating the principles of
exemplary
embodiments of the present invention. Moreover, in the drawings, reference
numerals
designate like or corresponding, but not necessarily identical, elements
throughout the
several views.
DETAILED DESCRIPTION OF EXEMPLARY EMBODIMENTS
The present invention supports a method for calibrating a tube scanner used to
scan tubing being placed into or being removed from a well. An exemplary
method and
system for calibrating the tube scanner will now be described more fully
hereinafter with
reference to Figures 1-6. These figures show representative embodiments of the
present
invention. Figure 1 depicts a workover rig moving tubing through a tube
scanner in a
representative operating environment for one embodiment of the present
invention.
Figure 2 provides a block diagram of a tube scanner that monitors, senses, or
characterizes tubing and that validates and interprets tubing data. Figure 3
depicts an
exemplary tubing standard for calibrating the tube scanner illustrated in
Figure 2. Figures
4, 5 and 6 provide flow diagrams of methods for calibrating a tube scanning
instrument.
5
CA 02583059 2007-03-26
= 08876.105047
The invention can be embodied in many different forms and should not be
construed as limited to the embodiments set forth herein; rather, these
embodiments are
provided so that this disclosure will be thorough and complete, and will fully
convey the
scope of the invention to one having ordinary skill in the art. Furthermore,
all
"examples" or "exemplary embodiments" given herein are intended to be non-
limiting,
and among others supported by representations of the present invention.
Moreover, although an exemplary embodiment of the invention is described with
respect to calibrating a tube scanner in a measurement zone adjacent to a
wellhead, one
skilled in the art will recognize that the invention may be employed or
utilized in
connection with a variety of applications in the oilfield or another operating
environment.
Figure 1 illustrates a system 100 for servicing an oil well 175. The system
100
scans the tubing 125 as the tubing 125 is extracted from or inserted into the
well 175
according to an exemplary embodiment of the present invention.
The oil well 175 includes a hole bored or drilled into the ground to reach an
oil-
bearing formation. The borehole of the well 175 is encased by a tube or pipe
(not
explicitly shown in Figure 1), known as a "casing," that is cemented to down-
hole
formations and that protects the well from unwanted fluids and debris within
the
formation.
Within the casing is a tube 125 that carries oil, gas, hydrocarbons, petroleum
products, and/or other formation fluids, such as water, to the surface. In
operation, a
sucker rod string (not explicitly shown in Figure 1), disposed within the tube
125, forces
the oil uphole. Driven by strokes from an uphole machine, such as a "rocking"
pump
jack, the sucker rod moves up and down to communicate reciprocal motion to a
downhole
pump (not explicitly shown in Figure 1). With each stroke, the downhole pump
moves
oil up the tube 125 towards the wellhead.
As shown in Figure 1, a service crew uses a workover or service rig 140 to
service
the well 175. During the illustrated procedure, the crew pulls the tubing 125
from the
well, for example to repair or replace the downhole pump. The tubing 125
includes a
string of sections, each of which may be referred to as a "joint," that
typically range in
6
CA 02583059 2007-03-26
= 08876.105047
length from 29 to 34 feet (about 8.8 to 10.3 meters). The joints screw
together via
collars, unions, tubing joints, or threaded connections.
The crew uses the workover rig 140 to extract the tubing 125 in increments or
steps, typically two joints per increment. The rig 140 includes a derrick or
boom 145 and
a cable 105 that the crew temporarily fastens to the tubing string 125. A
motor-driven
reel 110, drum, winch, or block and tackle pulls the cable 105 thereby
hoisting or lifting
the tubing string 125 attached thereto. The crew lifts the tubing string 125 a
vertical
distance that approximately equals the height of the derrick 145, typically
about sixty feet
or two joints.
More specifically, the crew attaches the cable 105 to the tubing string 125,
which
is vertically stationary during the attachment procedure. The crew then lifts
the tubing
125, generally in a continuous motion, so that two joints are extracted from
the well 175
while the portion of the tubing string 125 below those two joints remains in
the well 175.
When those two joints are out of the well 175, the operator of the reel 110
stops the cable
105, thereby halting upward motion of the tubing 125. The crew then separates
or
unscrews the two exposed joints from the remainder of the tubing string 125
that extends
into the well 175. A clamping apparatus grasps the tubing string 125 while the
crew
unscrews the two exposed joints, thereby preventing the string 125 from
dropping into
the well 175 when those joints separate from the main string 125.
The crew repeats the process of lifting and separating two-joint sections of
tubing
from the well 175 and arranges the extracted sections in a stack of vertically
disposed
joints, known as a "stand" of tubing. After extracting the full tubing string
125 from the
well 175 and servicing the pump, the crew reverses the step-wise tube-
extraction process
to place the tubing string 125 back in the well 175. In other words, the crew
uses the rig
140 to reconstitute the tubing string 125 by threading or "making up" each
joint and
incrementally lowering the tubing string 125 into the well 175.
The system 100 incorporates a tube scanner for monitoring, scanning,
assessing,
or evaluating the tubing 125 as the tubing 125 moves into or out of the well
175. The
tube scanner 150 obtains information or data about the portion of the tubing
125 that is in
7
CA 02583059 2007-03-26
08876.105047
the tube scanner's 150 sensing or measurement zone 155. Via a data link 120,
an encoder
115 provides the tubing scanner 150 with speed, velocity, and/or positional
information
about the tube 125. For example, the encoder 115 may be mechanically linked to
the reel
110 to determine motion and/or position of the tubing 125 as the tubing 125
moves
through the measurement zone 155.
As an alternative to the illustrated encoder 115, some other form of
positional or
speed sensor can determine the derrick's block speed or the rig engine's
rotational
velocity in revolutions per minute ("RPM"), for example.
Another data link 135 connects the tube scanner 150 to a computing device or
computer 130, which can be a laptop, a handheld, personal digital assistant
("PDA"), a
cellular system, a portable radio, a personal messaging system, a wireless
appliance, or a
stationary personal computer ("PC"), for example. The computer 130 displays
data that
the tube scanner 150 has obtained from the tubing 125. The computer 130 can
present
the tubing data graphically, for example in a trend format. The service crew
monitors or
observes the displayed data on the computer 130 or other display device to
evaluate the
condition of the tubing 125. The service crew can thereby grade the tubing 125
according to its fitness for continued service, for example.
The communication link 135 can include a direct link or a portion of a broader
communication network that carries information among other devices or similar
systems
to the system 100. Moreover, the communication link 135 can include a path
through the
Internet, an intranet, a private network, a telephony network, an Internet
protocol ("IP")
network, a packet-switched network, a circuit-switched network, a local area
network
("LAN"), a wide area network ("WAN"), a metropolitan area network ("MAN"), the
public switched telephone network ("PSTN"), a wireless network, or a cellular
system,
for example. The communication link 135 can also include a signal path that is
optical,
fiber optic, wired, wireless, wire-line, waveguided, or satellite-based, to
name a few
possibilities. Signals transmitting over the link 135 can carry or convey data
or
information digitally or via analog transmission. Such signals can include
modulated
8
CA 02583059 2007-03-26
= 08876.105047
electrical, optical, microwave, radiofrequency, ultrasonic, or electromagnetic
energy,
among other energy forms.
The computer 130 typically includes hardware and software. That hardware may
include various computer components, such as disk storage, disk drives,
microphones,
random access memory ("RAM"), read only memory ("ROM"), one or more
microprocessors, power supplies, a video controller, a system bus, a display
monitor, a
communication interface, and input devices. Further, the computer 130 can
include a
digital controller, a microprocessor, or some other implementation of digital
logic, for
example.
The computer 130 executes software that may include an operating system and
one or more software modules for managing data. The operating system can be
the
software product that Microsoft Corporation of Redmond, Washington sells under
the
registered trademark WINDOWS, for example. The data management module can
store,
sort, and organize data and can also provide a capability for graphing,
plotting, charting,
or trending data. The data management module can be or include the software
product
that Microsoft Corporation sells under the registered trademark EXCEL, for
example.
In one exemplary embodiment of the present invention, a multitasking computer
functions as the computer 130. Multiple programs can execute in an overlapping
timeframe or in a manner that appears concurrent or simultaneous to a human
observer.
Multitasking operation can include time slicing or timesharing, for example.
The data management module can include one or more computer programs or
pieces of computer executable code. To name a few examples, the data
management
module can include one or more of a utility, a module or object of code, a
software
program, an interactive program, a "plug-in," an "applet," a script, a
"scriptlet," an
operating system, a browser, an object handler, a standalone program, a
language, a
program that is not a standalone program, a program that runs a computer, a
program that
performs maintenance or general purpose chores, a program that is launched to
enable a
machine or human user to interact with data, a program that creates or is used
to create
9
CA 02583059 2007-03-26
=
,.
08876.105047
another program, and a program that assists a user in the performance of a
task such as
database interaction, word processing, accounting, or file management.
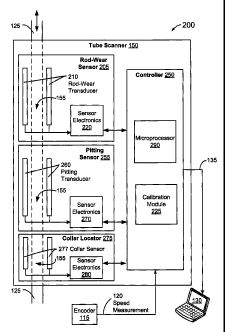
Turning now to Figure 2, this figure illustrates a functional block diagram of
an
instrumentation system 200 for scanning tubing 125 that is being inserted into
or
extracted from an oil well 175 according to one exemplary embodiment of the
present
invention. One skilled in the information-technology, computing, signal
processing,
sensor, or electronics arts will recognize that the components and functions
that are
illustrated as individual blocks in Figure 2, and referenced as such elsewhere
herein, are
not necessarily strictly separate modules. Furthermore, the contents of each
block are not
necessarily positioned in one physical location. In one embodiment of the
present
invention, certain blocks represent virtual modules, and the components, data,
and
functions may be physically dispersed. Moreover, in some exemplary
embodiments, a
single physical device may perform two or more functions that Figure 2
illustrates in two
or more distinct blocks. For example, the function of the computer 130 can be
integrated
into the tubing scanner 150 to provide a unitary or commonly-housed hardware
and
software element that acquires and processes data and displays processed data
in
graphical form for viewing by an operator, technician, or engineer.
The tubing scanner 150 may include a rod-wear sensor 205 and a pitting sensor
255 for determining parameters relevant to continued use of the tubing 125.
The rod-
wear sensor 205 assesses relatively large tubing defects or features such as
wall thinning.
Wall thinning may be due to physical wear or abrasion between the tubing 125
and the
sucker rod that is reciprocates therein, for example. Meanwhile, the pitting
sensor 255
detects or identifies smaller defects or features, such as pitting that stems
from corrosion
or some other form of chemical attack within the well 175. These small flaws
may be
visible to the naked eye or may have microscopic features, for example.
Pitting can occur
on the inside surface of the tubing 125, the so-called "inner diameter," or on
the outside
of the tubing 125.
The inclusion of the rod-wear sensor 205 and the pitting sensor 255 in the
tubing
scanner 150 is intended to be illustrative rather than limiting. The tube
scanner 150 can
CA 02583059 2007-03-26
08876.105047
include additional sensors or measuring apparatus that may be suited to a
particular
application. For example, the instrumentation system 200 can include a collar
locator
275, a device that detects tubing cracks or splits, a temperature gauge, a
camera, a
hydrostatic tester, etc. In one exemplary embodiment of the present invention,
the tube
scanner 150 includes or is coupled to an inventory counter, such as one of the
inventory
counting devices disclosed in U.S. Patent Application Publication Number
2004/0196032.
The tube scanner 150 also includes a controller 250 that may process signals
from
the rod-wear sensor 205 and the pitting sensor 255. In one exemplary
embodiment, the
controller 250 processes signals according to a speed measurement 120 from the
encoder
115. The controller 250 can include a computer, a microprocessor 290, a
computing
device, or some other implementation of programmable or hardwired digital
logic. In one
exemplary embodiment, the controller 250 includes one or more application
specific
integrated circuits ("ASICS") or digital signal processing ("DSP") chips.
Calibration
module 225 may include executable code stored on ROM, programmable ROM
("PROM"), RAM, an optical disk, a hard drive, magnetic media, tape, paper, or
some
other machine readable medium. Alternatively, calibration module 225 maybe
implemented in programmable or hardwired electronics, or some combination of
hardware and executable software code.
The speed measurement 120 from the encoder 115 may be used in one aspect of
calibrating tube scanner 150 that relates to the dependence of the results of
a tube scan
upon the speed 120 at which the tube moves through the tube scanner 150. The
calibration module 225 may establish typical, fast limit, and slow limit
metrics for the
speed at which a tube 125 should be moved through a tube scanner 150. The
typical
speed would be the one where the calibrated tube scanner 150 reproduces
expected scan
values most closely and the fast limit and slow limit would be the scan speeds
where the
tube scanner 150 still operates within tolerances, but movement of tubing 125
through the
tube scanner 150 that is faster that the fast limit or slower than the slow
limit may
introduce excessive error into the scan. These limit values can be used by the
crew to
11
CA 02583059 2007-03-26
08876.105047
guide their operation of the rig 140 while extracting or inserting tubing 125
through the
tube scanner 150.
The rod-wear sensor 205 may include a transducer 210 that outputs an
electrical
signal containing information about the section of tubing 125 that is in the
measurement
zone 155. Sensor electronics 220 may amplify, condition, and digitize the
output from
transducer 210 and then provide controller 250 with samples or snapshots of
the wall
thickness of the portion of the tubing 125 that is situated in the measurement
zone 155.
Similar to the rod-wear sensor 205, the pitting sensor 255 include a pitting
transducer 260. Sensor electronics 270 may amplify, condition, and digitize
the output
from transducer 260 and then provide controller 250 with samples or snapshots
of the
amount and nature of pitting in the walls of the portion of the tubing 125
that is situated
in the measurement zone 155.
The transducers, such as 210 and 260 may respond to stimuli within the
measurement zone 155 such as electromagnetic, mechanical, fluid pressure
differential,
sonic, ultrasonic, or optical/visual.
A collar locator 275 includes a collar sensor 277 and sensor electronics 280.
The
sensor 277 may include a mechanical switch, electromagnetic transducer,
optical
detector, or other sensor for identifying when a coupling joint collar is
within
measurement zone 155. Sensor electronics 280 may amplify, condition, and
digitize the
output from sensor 277 and then provide controller 250 with information
regarding the
presence of a coupling joint collar within the measurement zone 155. Inclusion
of collar
locator 275 in tube scanner 150 or even outside of the tube scanner 150 but as
part of
service rig system 100, can provide controller 250 and/or computer 130 with
information
regarding the location of couplings or collars at the points where tube 125
sections or
joints connect to one another within the tubing string.
The calibration module 225 can use signals from sensors, such as 205 and 255,
and indications from the operating crew as inputs to one or more calibration
processes.
These calibration processes can determine corrective calibration functions
that may
transform the signals output by the sensors, such as 205 and 255, to more
accurately
12
CA 02583059 2014-01-10
represent signals that are descriptive of the actual tube 125 being scanned.
These
calibration functions maybe required due to drift, offset, noise, or other
errors or artifacts
introduced into the signals from sensors, such as 205 and 255. Once these
calibration
functions are determined, the calibration module 225 of controller 250 may
apply the
5" calibration functions to the signals received from sensors, such as 205
and 255, in order
to achieve data that is more representative of the actual tube 125 being
analyzed. One
of ordinary skill in the art will appreciate that the calibration
functionality, described for
one exemplary embodiment as a calibration module 225 of controller 250, may be
located and/or partitioned otherwise, for example as functionality of computer
130,
controller 250, or electronics within sensors, such as 205 or 255. An
exemplary tubing
standard for use in calibration as well as some exemplary calibration process
flowcharts
are described hereinafter.
Figure 3A illustrates a vertical cross-section of an exemplary tubing standard
300
used to calibrate the tube scanner 150 of Figures 1 and 2. Referring now to
Figures 2
and 3A, the exemplary standard 300 can be manufactured with a known set of
physical
characteristics. The standard 300 may thus be expected to stimulate sensors
205, 255
inside of tube scanner 150 to produce known response signals according to the
known
p hysical properties of the tubing standard 300. This can be considered the
"expected
- ;an" of standard 300. When the tube scanner 150 is used to scan the standard
300,
t ne resulting signals from the sensors 205, 255 can be considered the "actual
scan" of
he standard 300 by those sensors 205, 255 at that time. Deviation between the
'expected scan" and the "actual scan" represents the drift, offset, error,
noise, artifacts,
or other aberration exhibited by the sensors 205, 255 within the tube scanner
150. This
deviation is what is sought to be removed, or substantially minimized, by the
application
of a calibration function by the calibration module 225.
A region 330 of the standard 300 having various wall thicknesses may be used
to
exercise and calibrate the rod-wear sensor 205. A region 360 of the standard
300
having various depths, widths, and structures of wall-pitting features or
grooves may be
used to exercise and calibrate the pitting sensor 255. While regions 330 and
360 of the
tubing standard 300 may be substantially circularly symmetrical, region 370 of
the
tubing standard 300 may contain vertical features or grooves which introduce a
13
CA 02583059 2014-01-10
rotational aspect to the tubing standard 300. Thus the expected scan of the
tubing
standard 300 will differ as a function of the angle at which tubing standard
300 is drawn
through tube scanner 150. This rotationally variant tube region 370 is
discussed in more
detail below and illustrated in Figure 3B.
When inserted into the tube scanner 154 for calibration purposes, the standard
300 may be aligned using an index marker 310. The index marker 310 allows the
standard 300 to be scanned in a consistent manner that is beneficial to the
calibration
process because the actual scan can be synchronized with, or matched up to,
the
expected scan more readily. The index marker 310 may be painted onto, molded
or
machined into, or externally affixed to the standard 300. One skilled in the
mechanical
or manufacturing arts will appreciate various other embodiments of the index
marker
310. Additionally, the standard 300 may by operated without alignment via the
index
marker 310 and synchronization maybe achieved by controller 250 or computer
130
using correlation to match up expected features of the standard 300 as
identified within
the scan data.
Figure 3B illustrates a horizontal cross-section of the rotationally variant
region
370 of an exemplary tubing standard 300 disposed with a circular array of
transducer
elements 380A-H. Referring now to Figures 2, 3A and 3B, the rotational aspect
region
370 of exemplary standard 300 can be manufactured with vertical features or
grooves
390. These vertical grooves 390 introduce a rotationally variant scan of the
standard
300 in the region 370 of rotational variance. This is in contrast to regions
330 and 360 of
tubing standard 300 which may substantially display circular symmetry. Sensor
transducers, such as 210 and 260 shown in Figure 2 may be physically arranged
as an
array of transducer elements 380A-H disposed around the measurement zone 155.
Vertical grooves 390 in tubing standard 300 may be used to isolate the
response of
each of the transducer elements 380A-H. For example, in the orientation
illustrated in
Figure 3B, the groove 390 would be detected as a thinner wall measurement at
transducer element 380E compared to the other seven transducer elements 380A-
D,
380E-H. However if the tubing standard 300 were being inserted or extracted at
an
orientation rotated ninety degrees clockwise (as viewed in Figured 3B) then
groove 390
would be detected by transducer 3800, This rotational variance in the scan of
region
14
CA 02583059 2014-01-10
370 of tubing standard 300 maybe used to individually calibrate the sensor
elements
38QA-H circularly disposed around the measurement zone 155. Rotational
variance in
the scan of region 370 of the tubing standard 300 may also be used to identify
individually malfunctioning or faulty sensor elements 380A-H. Further
exploitation of
these rotational variances in the calibration scanning are elaborated in the
process
flowchart illustrated in Figure 5 below.
The physical design of the tubing standard 300 is specifically intended to
represent features spanning the full range of pits, grooves and wall thickness
that are
measurable by the sensors 205, 255 within the tube scanner 150. When used as a
calibration standard, these varied qualities may allow the tube scanner 150 to
be
calibrated over its full domain of operation. The two sensors 205, 255 of the
tube
scanner 150 are intended to be exemplary and not limiting. The tube scanner
150 may
include other tube scanning sensors in various combinations. Similarly, the
circular
disposition of sensor elements 380A-H is intended to be exemplary and non-
limiting.
Sensor arrays of more or less than eight elements or arrangements other than
the
circular example may be employed within tube scanner 150.
Processes for an exemplary embodiment of the present invention will be
discussed below with reference to Figures 4, 5 and 6. An exemplary embodiment
of the
present invention can include one or more computer programs or computer-
implemented methods that implement functions or steps described herein and
illustrated
in the exemplary flowcharts of Figures 4, 5 and 6. However, it should be
apparent that
there could be many different ways of implementing the invention in computer
programming, and the invention should not be construed as limited to any one
set of
computer program instructions. Further, a skilled programmer would be able to
write
such a computer program to implement the disclosed invention without
difficulty based
on the exemplary system architectures and flowcharts and the associated
description in
the application text, for example.
Therefore, disclosure of a particular set of program code instructions is not
considered necessary for an adequate understanding of how to make and use the
invention. The inventive functionality of any claimed process, method, or
computer
CA 02583059 2014-01-10
program will be explained in more detail in the following description in
conjunction with
the remaining figures illustrating representative functions and program flow.
Certain steps in the processes described below must naturally precede others
for
the present invention to function as described. However, the present invention
is not
limited to the order of the steps described if such order or sequence does not
alter the
functionality of the present invention in an undesirable manner. That is, it
is recognized
that some steps may be performed before or after other steps or in parallel
with other
steps.
Turning now to Figure 4, this figure illustrates a flowchart of an exemplary
process 400 for scanning tubing that is being inserted into or extracted from
an oil well
175 and for calibrating the tube scanner 150 using a tube standard 300 within
the
operating environment of the exemplary workover rig 140 and tube scanner 150
of
Figures 1 and 2. Now referring to Figures 1, 2 and 4, the exemplary method 400
begins
at the START step and proceeds to step 420A where an oil field service crew
calibrates
the tube scanner 150 using the tubing standard 300. This calibration is
elaborated
below in sub-process 420 of Figure 5.
At step 440, the crew operates the tube scanner 150. Operating the tube
scanner
150 may include scanning tube segments 125 being extracted from, or inserted
into, the
well 175. Scanning tube segments 125 typically includes collecting, within
controller
250, computer 130, or both, the digitized signals from sensor electronics,
such as 220
or 270. Mechanical speed, velocity, or positional information may also be
collected from
the encoder 115. This mechanical information may assist in relating the
collected
sensor data with the physical area of tubing 125 being sampled and each snap-
shot.
The calibration module 225 may, in real-time, apply the calibration function
obtained
during the initial calibration 420A to the scan data collected during the
scanner
operation in step 440.
At step 420B, the crew calibrates the tube scanner 150 using the tubing
standard
300. This calibration is elaborated below in sub-process 420 of Figure 5. At
step 480,
the calibration module 225 may use this post-operation calibration to validate
that the
tube scanner 150 is still in calibration and was thus likely to have remained
in calibration
throughout the tube scanning operation of step 440. If the post-operational
calibration
16
CA 02583059 2014-01-10
420B indicates that the tube scanner 150 has drifted out of calibration, the
calibration
module 225 may adjust the data collected during the tube scanning operation in
step
440 according to the new calibration or the calibration module 225 may simply
flag the
data collected during the tube scanning operation in step 440 to be examined
more
closely in light of the post-operation calibration 420B.
Process 400 may provide for improved data collection during tube scanning
operation 440 since the tube scanner 150 is calibrated in step 420A just prior
to being
operated and then calibrated again in step 420B just after operation. After
the post-
operational calibration, the calibration module 225 may verify that the tube
scanner 150
is still in calibration and it may react accordingly if tube scanner 150 has
drifted out of
calibration. It should be appreciated that in addition to this exemplary
embodiment
where calibration occurs before operation and after operation, the calibration
steps may
take place one or more times during the operation of the tube scanner 150 at
the same
well. Such interspersed scanner calibration can be employed in the field when,
for
example, the service crew has an increased need for scan accuracy, or is
concerned
that the tube scanner 150 is not maintaining calibration for extended periods
of
operation due to, for example, vibrations or thermal fluctuations.
Turning now to Figure 5, this figure illustrates a flowchart of an exemplary
sub-
process 420 for calibrating a tube scanner 150 using a tube standard 300 and
stored
information about the standard. This exemplary sub-process elaborates the
steps
described in the calibration steps 420A and 420B of Figure 4.
17
CA 02583059 2007-03-26
08876.105047
At step 510, the oil field service crew inserts tubing calibration standard
300 into
tube scanner 150. At step 520 the tubing standard 300 is aligned with the tube
scanner
150 using the index marker 310 of tubing standard 300. Once the standard 300
is aligned
into the tube scanner 150, the process proceeds at step 540 where the crew
draws the
calibration tubing standard 300 through the tube scanner 150 while the tube
scanner 150
samples scan data describing the tubing standard 300. This scan data may be
considered
the "actual scan" in contrast to stored information describing the known
physical
characteristics of standard 300. This stored information may be considered the
"expected
scan" as it represents an idealization of what tube scanner 150 would, when
perfectly
calibrated, scan from the standard tubing 300.
At decision step 543, it is determined if additional partial rotations of
tubing
standard 300 are required. As discussed above and illustrated in Figure 3B,
partial
rotation of the tubing standard 300 relates to the vertical feature 390 and to
the isolation
of individual transducer elements 380A-H within a sensor transducer (such as
210 or
260) arranged as a circular array. If the circular array of transducer
elements 380A-H
includes eight elements, as illustrated in Figure 3B, and it is desirable to
isolate each
element then each partial rotation may be of 45 degrees and there may be seven
such
partial rotations interleaved between a total of eight scans of the tubing
standard 300
through tube scanner 150. For varying numbers of circularly disposed
transducer
elements 380, the number of partial rotations and scans may be the same as the
number of
transducer elements 380 (as in the example just given). Alternatively, the
number of
partial rotations may be more or less than the number of transducer elements
380.
Whatever the total number of partial rotations intended to fully exercise the
tuber scanner
150, decision step 543 evaluates if the total number of partial rotations has
been
completed or if additional partial rotations are required to be scanned.
If decision step 543 determines that no additional partial rotations are
required,
then the "NO" branch is followed to step 550, otherwise, the "YES" branch is
followed to
step 546, where the partial rotation is carried out by the crew prior to
beginning the next
tube scan by returning to step 510. The amount of each partial rotation is, in
the simplest
18
CA 02583059 2014-01-10
preferred implementation, three hundred and sixty degrees divided by the total
number
of partial rotations. This approach would evenly space the partial rotation
scans around
the circle describing the horizontal cross-section of the measurement zone
155. Such
even spacing of scans around the standard tubing 300 is exemplary and non-
limiting.
Other measures of partial rotation can be acceptable or even desirable.
At step 546, the crew may gauge the angle of the partial rotation using an
external instrument, or by using angle markings on or within tube scanner 150,
tubing
standard 300, or index marker 310. The angle of partial rotation separating
each scan of
a rotational set may be entered or verified by the crew using the computer
130. This
angular displacement information may be used by the calibration module 225 in
making
the calibration computations. After the first transition through step 543, the
second and
later passes through step 540 within the same rotational set of scans may be
simplified
to only include scanning the vertical feature region 370 of tubing standard
300 through
the tube scanner 150. This simplification may be possible because only the
vertical
feature region 370 of the tubing standard 300 varies with rotational angle.
Confining
subsequent scans to this region 370 can reduce the total amount of time
required to
calibrate the tube scanner 150.
At step 550, calibration module 225 computes a transform that can act upon the
actual scan to yield, or approximate, the expected scan. This transform can be
considered a calibration function for the tube scanner 150. For example, if
the values in
the actual scan are all five less than the expected scan, then a calibration
function may
be to add five to all measured values. As a second example, if values in the
actual scan
are one third of those in the expected scan, a calibration function may be to
multiply all
measured values by three. These linear examples of calibration functions are
intended
to be exemplary and not limiting. One skilled in the control systems or signal
processing
arts will appreciate that the calibration function may be linear or nonlinear;
may operate
in time, frequency, phase, or other domain; may be static; or may be adaptive
according
to the minimization of one or more of various adaptation metrics.
19
CA 02583059 2007-03-26
08876.105047
At step 570, the transform, or calibration function, computed at step 550 may
be
stored for use by the calibration module 225 and may be applied to data
scanned during
operation of the tube scanner 150. Application of the calibration function to
data scanned
by the tube scanner 150 may remove, or reduce, deviation from the ideal
operation of the
tube scanner 150. Thus, tube scanner 150 may be considered to be calibrated.
As such,
operation of tube scanner 150 upon the tubing standard 300 would result in
scan data
substantially approximating the expected scan data. In this calibrated state,
the tube
scanner 150 may generate scan data during a scan of a tubing segment 125 that
is
substantially indicative of the actual physical properties of the tubing
segment 125 and
not including drift, noise, offset, or other artifact components to an extent
that the scan
data would be less useful for decision making regarding the tubing segment
125.
Turning now to Figure 6, this figure illustrates a flowchart of an exemplary
process 600 for calibrating a tube scanner 150 using coupling joints in a
string of tubing
125. Instead of relying upon a calibration standard tubing 300, process 600
may use the
scan data from the actual tubing 125 being operated upon by the tube scanner
150 to
calibrate the tube scanner 150. It should be appreciated that tubing standard
calibration,
such as illustrated in processes 400 and 420 and coupling joint calibration,
such as
illustrated by process 600, are not mutually exclusive calibration techniques
and they may
be used in combination or alternatively at different phases of scanner
operation.
Now referring to Figures 1, 2, and 6, the exemplary process 600 begins at step
610, where the tube segments being scanned are drawn, by the crew, through the
tube
scanner 150 while the tube scanner 150 collects, within controller 250,
computer 130, or
both, the digitized signals from sensor electronics, such as 220 or 270.
Mechanical
speed, velocity, or positional information may also be collected from the
encoder 115.
This mechanical information may assist in relating the collected sensor data
with the
physical area of tubing being sampled and each snap-shot.
At decision step 620, calibration module 225 determines whether or not a
collar
locator is in use. A collar locator 275 is an instrument that indicates when a
coupling
joint collar is being scanned. If a collar locator 275 is in use, the "YES"
branch is
CA 02583059 2007-03-26
08876.105047
followed to step 630, where the calibration module 225 uses the indications
from the
collar locator 275 to identify the coupling joints within the data scanned at
step 610. If a
collar locator 275 is not in use, the "NO" branch is followed to step 640
where the
calibration module 225 identifies the coupling joints in the scan data using
peaks in the
data occurring at approximately thirty foot intervals. Each tubing segment
is
approximately thirty feet long and the scan data will peak, or saturate, at
the times in the
scan when a collar, or coupling joint, is passing within the measurement zone
155.
Once the coupling joints are identified within the scan data at either step
630 or
640, the process 600 continues to step 660 where the scan data is scaled up or
down to
equalize the scan amplitudes of all of the scanned coupling joints. Since the
tube scanner
150 may saturate and provide a peak measurement at a coupling joint, scaling
the data as
to equalize all of the coupling joint regions may remove any drift errors
introduced in the
data during the scanning operation.
Using either the tubing standard process 400 (along with tubing standard 300)
or
the coupling joint equalization process 600, the present invention can
calibrate a tube
scanner 150. Use of such a calibrated tube scanner 150 can increase
correctness and
consistency in the scanning of tubing 125 over the use of a non-calibrated
tube scanner.
Correctness and consistency can benefit the art when the results of tube scans
are used in
making important decisions concerning whether or not a segment of tubing need
be
discarded due to excessive wear or in making decisions concerning the type and
amounts
of chemicals used in a well.
21