Note: Descriptions are shown in the official language in which they were submitted.
DEMANDE OU BREVET VOLUMINEUX
LA PRESENTE PARTIE DE CETTE DEMANDE OU CE BREVET COMPREND
PLUS D'UN TOME.
CECI EST LE TOME 1 DE 2
CONTENANT LES PAGES 1 A 30
NOTE : Pour les tomes additionels, veuillez contacter le Bureau canadien des
brevets
JUMBO APPLICATIONS/PATENTS
THIS SECTION OF THE APPLICATION/PATENT CONTAINS MORE THAN ONE
VOLUME
THIS IS VOLUME 1 OF 2
CONTAINING PAGES 1 TO 30
NOTE: For additional volumes, please contact the Canadian Patent Office
NOM DU FICHIER / FILE NAME:
NOTE POUR LE TOME / VOLUME NOTE:
CA 02585525 2007-04-26
WO 2005/103298 PCT/US2005/013247
METHOD FOR DETECTING ncRNA
Inventor: Jian Han, M.D., Ph.D.
BACKGROUND
The general basis of cancer is the loss of cell growth control mechanisms and
the resulting
abnormal proliferation of cells. Traditionally, a universal paradigm in
oncogenesis is the
accumulation of mutations in the coding or regulatory regions of cellular
genes such as oncogenes
and tumor suppressor genes. These mutations lead to perturbations of
the_normal cellular signaling
processes that govern cellular proliferation and development. However, recent
research has
revealed a new class of RNAs termed non-coding RNAs (ncRNA) (also referred to
as functional
RNA, or fRNA). ncRNAs include a variety of RNA molecules including, but not
limited to,
miRNA (microRNA), rRNA (ribosomal RNA), siRNA (small interfering RNA), snRNA
(small
nuclear RNA), snmRNA (small non-mRNA), snoRNA (small nucleolar RNA) and stRNA
(small
temporal RNA). The functions of these ncRNAs are diverse and are still being
determined. Many
of the ncRNA molecules interact with proteins to form ribonucleoprotein (RNP)
complexes.
miRNA has emerged as one of the more intriguing members of the ncRNA class.
miRNA
has been determined to be important for cellular growth, development and
homeostasis and
research points to the involvement of these miRNAs in a variety of disease
states, such as cancer.
miRNAs are short nucleotide transcripts cleaved from a larger hairpin
precursor. In certain
embodiments, the miRNA are 19-23 nucleotides in length. Research suggests that
the Dicer
protein and related proteins are involved in the cleavage of the RNA hairpin
precursor to form the
miRNAs (Hutvagner et al., Science 293: 834-838, 2001; Ketting et al., Gene &
Development. 15:
2654-2659, 2001). Many miRNAs, often with highly conserved sequences, are
present in the
genomes of organisms, such as, but not limited to, Caenorhabditis elegans,
Drosophila, rats, mice,
and humans (Lagos-Quintata et al., Science 294: 853-858 2001; Lagos-Quintata
et al., Curr Biol
12, 735-739, 2002; Lee and Ambros Science 294: 862-86 2001; Mourelatos et al.
Gene &
Development. 16: 720-7282002; Dostie et al. RNA 9: 180-186, 2003). In some
instances, the
miRNAs are organized in the genome as clusters, sometimes separated by
intervals as short as a
few nucleotides.
The roles proposed for miRNAs are diverse. miRNAs are postulated to be
involved in
regulation of mRNA stability and translation, heterochromatin formation,
genome rearrangement,
and DNA excision (Baulcombe Science 297:2002-2003, 2002). In C. elegans,
miRNAs coordinate
the translation of heterochromic genes (Banerjee et al., BioEssays, 24: 119-
129, 2002). Two C.
elegans miRNAs, lin-4 and let-7, control developmental timing by forming
imperfect base pairing
1
CA 02585525 2007-04-26
WO 2005/103298 PCT/US2005/013247
with elements within the 3' UTR of target mRNAs and attenuating their
translation (Lee et al., Cell
75:843-854, 1993; Wightman et al., Cell. 75(5):855-62, 1993). A specific miRNA
in As abidopsis
is known to direct the cleavage of transcripts encoding several putative
transcription factors (Llave
et al., Science, 297: 2053-2056, 2002). The Drosophila bantam gene encodes a
miRNA that
regulates cell proliferation and the pro-apoptotic gene hid (Brennecke et al.,
Cell, 113: 25-36,
2003). Evidence supporting the notion that miRNAs are an important class of
regulatory molecule
is growing.
Given the fundamental biological processes that are regulated by miRNAs and
the
knowledge that many of these processes are altered in a variety of human
conditions, it is important
to determine whether miRNAs play a role in these conditions. For example,
miRNAs have
recently been implicated in carcinogenesis and development and differentiation
of numerous cell
types.
Metzler et al (Gene Chromosomes Cancer, 39(2): 167-9, 2004) reported recently
that mir-
155/bic RNA expression is up-regulated significantly in children with Burkitts
Lymphoma. Recent
studies by Michael et al (Mol Cancer Res. 1(12), 882-91, 2003) has shown that
specific miRNAs
shown reduced accumulation in colorectal neoplasia. Calin et al (Proc Natl
Acad Sci U S A.,
99(24):15524-9, 2002) found an association between chronic lymphocytic
leukemia (CLL) and
deletions in a region of chromosome 13, which contains the coding regions for
the miRNAs miR-
15 and miR-16. They found that these miRNAs are either absent, or down-
regulated, in a majority
of CLL specimens (-68%). Hemizygous and/or homozygous loss at 13q14 constitute
the most
frequent chromosomal abnormality in CLL. Deletions at this region also occur
in approximately
50% of mantle cell lymphomas, in 16-40% of multiple myelomas, and in 60% of
prostate cancers,
suggesting the involvement of one or more tumor suppressor genes at this
locus. Although several
groups have performed detailed genetic analysis, including extensive loss of
heterozygosity (LOH)
analysis, mutation, and expression studies, no consistent involvement of any
of the genes located in
the deleted region has been demonstrated. If loss of the 13q14 miRNA R-15 and
R-16 locus is key
for the genesis of CLL, then these data by Calin et al are consistent with the
idea that a miRNA
may act as a tumor suppressor.
It is also possible that cancer could result from translocations of oncogene
into miRNA loci.
One such potential example of this is the translocation of MYC into the miRNA
mir-142 loci,
which causes an aggressive B cell leukemia due to strong up-regulation of MYC
expression
(Gauwerky et al., Proc Natl Acad Sci U S A 86, 8867-8871, 1989). The MYC gene
translocated
only 4 nucleotides downstream of the mir-142 3' end, and is likely under
control of the upstream
miRNA promoter. Alignment of mouse and human mir-142 containing EST sequences
indicates
-20 nucleotide conserved sequence element downstream of the mir-142 hairpin,
which is lost in the
2
CA 02585525 2007-04-26
WO 2005/103298 PCT/US2005/013247
translocation (Lagos-Quintana et al., Curr. Biol. 12:735-739, 2002). It was
suggested that the
absence of this conserved downstream sequence element in the putative mir-
142/MYC fusion
prevented the recognition of the transcript as a miRNA precursor to be
properly processed, and
therefore may have caused accumulation of fusion transcripts and
overexpression of MYC. Thus
there are multiple avenues for miRNA involvement in disease states, such as
cancer, and the
identification of miRNAs will likely help us to understand the cooperation of
miRNA mechanisms
in the biochemical mechanisms underlying the disease states.
Sempere et al. (Genome Biol. 5(3):R13. Epub 2004 Feb 16, 2004) recently
reported the
identification of a subset of brain-expressed miRNAs whose expression
behaviour is conserved in
both mouse and human differentiating neurons. This data suggests that these
miRNAs play a role
in normal mammalian neuronal development and/or fiinction. Furthermore,
Houbaviy (Dev Cell.
5(2):351-8, 2003) identified a group of miRNAs in undifferentiated and
differentiated mouse
embryonic stem cells, with some of the miRNAs being specifically restricted to
stem cells. The
repression of these embryonic-specific miRNAs is repressed when the embryonic
stem cells beings
to differentiate. This suggests a role for miRNAs in the maintenance of the
pluripotent cell state
and direction of early mammalian development.
Approximately 220 miRNAs been identified in humans and many of the identified
miRNAs
have been associated with important biological functions
(http://www.salzger.ac.uk). By
bioinformatics approach, Bartel and Burge (2003) estimated that up to 1% of
the human genome
may code for miRNAs. The roles of miRNA played in normal tissue development
and cellular
functions are just beginning to be explored. However, discoveries in the ncRNA
field are severely
hindered by the lack of efficient analytical tools. The timely development of
a powerful tool to aid
the study of ncRNA, such as miRNA, molecules is therefore needed. The present
disclosure
provides such an analytical tool for the analysis of ncRNAs. The present
disclosure provides
methods describing the detection and analysis of miRNAs. However, the methods
of the present
disclosure may also be applied to other ncRNAs as would be obvious to one of
ordinary skill in the
art.
BRIEF DESCRIPTION OF THE FIGURES
FIG. 1 shows a pictorial representation of one embodiment of the miRNA
detection method of the
present disclosure. In this embodiment, the capture oligonucleotides are
coupled to a solid,
internally color-coded microsphere (which serves as the substrate and contains
the first signal tag).
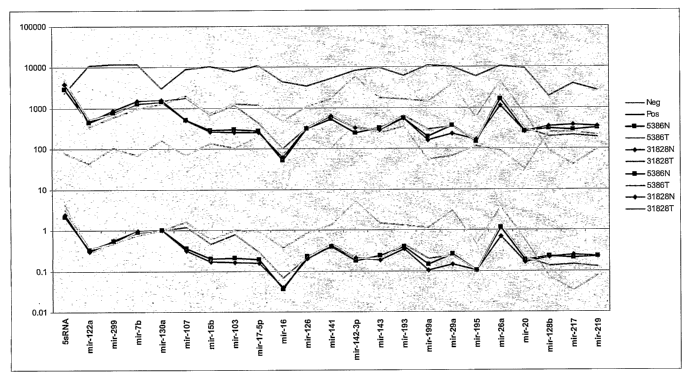
FIG. 2 shows the profiling of selected miRNA species from two pair matched
samples (5386N and
5386T; 31828N and 31828T) of RNA obtained from normal breast tissue and breast
cancer tissue
derived from a single subject. On top half of the figure, the Y axis indicate
the MFI of each miRNA
3
CA 02585525 2007-04-26
WO 2005/103298 PCT/US2005/013247
detected; on the bottom half of the figure, the Y axis shows the normalized
readings for each
miRNA detected. The X axis shows the miRNA species detected.
FIG. 3 shows the profiling of selected miRNA species from RNA obtained from
normal breast
tissue and breast cancer tissue. On top half of the figure, the Y axis
indicate the MFI of each
miRNA detected; on the bottom half of the figure, the Y axis shows the
normalized MFI readings
for each miRNA detected. The X axis shows the miRNA species detected.
FIG. 4 shows the profiling of selected miRNA species from RNA obtained from
normal neuronal
cells and selected glioma cell lines. The Y axis indicates the MFI of each
miRNA detected and the
X axis indicates the miRNA species detected.
FIG. 5 shows the profiling of selected miRNA species from RNA obtained from
normal neuronal
cells and selected glioma cell lines. The Y axis shows the normalized MFI
readings for each
miRNA detected and the X axis indicates the miRNA species detected.
DETAILED DESCRIPTION
Prior Art Methods for ncRNA Detection
The art currently relies on a variety of traditional detection methods to
detect ncRNAs. The
currently used assays include the use of Northern blots, array based methods
and RNAse protection
assays. The use of a Northern blots to detect ncRNAs generally requires 15-20
g of total RNA for
an analysis and is used primarily for the study of one particular ncRNA. The
total RNA (or RNA
enriched by size fractionation) is run on a standard gel and transferred onto
membrane. Labeled
probe complementary to the RNA species to be detected, such as a radio-labeled
probe, is used to
hybridize to the desired RNA species for specific detection. This method is
time consuming, labor
intensive and demands large quantities of total RNA. In addition, one
hybridization could only
study the expression of one particular ncRNA or a small numbers of ncRNA if
the length of the
miRNAs was different enough to provide separation. Although the membrane can
be striped and
reused to study other RNA species, multiple usage of a membrane makes it
difficult to compare
results acquired between assays.
Krichevsky et al (RNA, 9(10):1274-81, 2003; Erratum in: RNA, 10(3):551. 2004)
reported the
use of a printed array to study the expression of ncRNA, specifically miRNAs.
Tri-mer
oligonucleotides (complementary to the miRNAs to be analyzed) of 54-72
nucleotides in length at
final concentration of 7 M were spotted on the GeneScreen Plus (NEN)
membrane. For each
experiment, 5-10 g of miRNA from brain tissue was used as probes. The miRNA
probes were
labeled with 733 P dATP (3000 Ci/mmole) by T4 polynucleotide kinase. The
hybridization reaction
usually occurs over night and requires extensive washes for optimal
specificity. While the printed
array method can analyze the expression of multiple miRNAs in one assay, its
specificity and
4
CA 02585525 2007-04-26
WO 2005/103298 PCT/US2005/013247
sensitivity are limited by sample preparation, probe labeling efficiency,
hybridization and washes.
Because many miRNAs share large homologous conserved sequences, especially
those belong to
the same family, the detection specificity of using the printed array is
severely limited.
The RNase protection assay is a solution-based hybridization method for neRNA
analysis,
such as miRNA analysis (www.ainbion.com). In this method, miRNAs were detected
with a 29
nucleotide radiolabeled probe prepared by in vitro transcription (IVT). The
probe carries a 10
nucleotide sequence at its 5'end that is not complementary to the miRNA
sequence and is cleavable
by RNases. After incubation at 42 C for 15 hours, reactions were treated with
RNases A and T1 for
at least 30 min at 37 C. Protected fragments were recovered by precipitation
and analyzed on a
denaturing polyacrylamide gel. The solution hybridization method is 10 times
more sensitive than
Northern and can detect miRNAs from 1 g of total RNA. However, it still
requires the preparation
of radiolabeled IVT probes and the readout step may require that multiple
denaturing
polyacrylamide gels be run since each gel could differentiate only miRNAs of
different sizes.
All three commonly used methods described above are subject to the same set of
limitations.
Each of the methods is labor intensive as they require labor intensive and
time consuming steps
such as radioactive labeling of probes, overnight hybridization, denaturing
gel electrophoresis,
extensive washing steps, x-ray film exposure and image digitalization for
quantitative analysis.
Furthermore, other than the printed array method, the methods described are
limited in the analysis
of multiple miRNAs in a simultaneous manner and are not suited for expression
profiling analysis.
The assay described herein will not require the labor intensive steps
described above, such as probe
manufactures, and the entire assay can be completed in one hour.
In addition, the methods described above lack the sensitivity to detect small
quantities of
ncRNA. Usually 10-20 g total RNA is required to detect a given ncRNA species.
At this
sensitivity, a laboratory will have to allocate significant resources for
sample RNA preparation. As
the results in the Examples section below demonstrate, the neRNA detection
method disclosed can
detect the expression of RNA species using as little as 50 ng of total RNA.
Finally, the methods described above and currently used in the art lack the
specificity
required to differentiate between the highly homologous ncRNA species. Many
ncRNAs, such as
miRNAs, share extensive sequence homology and are classified into families.
Often only one
nucleotide base differs among the ncRNA family members. Such homology makes it
very difficult
for Northern blot or array-based methods to differentiate highly conserved
ncRNA family
members. The use of short LAN spiked oligonucleotides as described herein
significantly increases
the specificity of detection and makes it possible to detect even a single
nucleotide base difference
among ncRNA species.
Overview of ncRNA Detection Methodology
5
CA 02585525 2007-04-26
WO 2005/103298 PCT/US2005/013247
The present disclosure describes a method for the efficient detection of ncRNA
molecules
(which may be referred to herein as a "target RNA"). As used in this
specification, ncRNA is
meant to define any small RNA molecule and specifically includes, but is not
limited to, miRNA,
siRNA, and stRNA. In one embodiment, ncRNAs have a length of 5 to 500
nucleotides. In an
alternate embodiment, the ncRNAs have a length of 5 to 100 nucleotides. In yet
another alternate
embodiment, the ncRNAs have a length of 5 to 40 nucleotides. The method of the
present
disclosure can be used to detect any known or unknown ncRNA molecule. In one
embodiment, the
disclosed method is used to detect miRNA molecules. For the purpose of
exemplifying the method
claimed, the disclosed method is used to detect the presence of miRNA
molecules. However, the
present method is not limited in application to the detection of miRNA
molecules only and should
be understood to include the detection of any ncRNA molecule.
The detection methods disclosed herein may be used in a variety of
applications. In one
embodiment, the detection methods disclosed may be used to generate a profile
the various ncRNA
species present in a sample from a subject. In a specific embodiment, the
ncRNA is a miRNA.
The unique and novel approach to ncRNA detection as disclosed in the present
application allows
for the first time the analytical power to profile multiple ncRNA species in
an efficient, non-labor
intensive method.
In an alternate embodiment, the detection methods disclosed may be used to
profile the
various ncRNA species present in a given disease or condition, such as but not
limited to cancer, to
create a ncRNA signature for the disease state or condition. In one approach,
a first sample is
obtained that is characterized as having a particular disease or condition and
the ncRNA profile is
determined; a second sample is obtained that is characterized as being free
from a particular disease
state or condition and the ncRNA profile is determined. Multiple first and
second samples may be
obtained if desired. The ncRNA profiles from the first and second samples are
compared, and the
ncRNAs that show differences (such as increased expression or decreased
expression) are noted.
These ncRNA species constitute the ncRNA signature for the disease or
condition. In a specific
embodiment, the ncRNA is a miRNA. The first and second samples may be obtained
from the
same subject or from separate subjects. In one embodiment, the first and
second samples are
obtained from the same subject. In a particular application, the ncRNA
signature may be correlated
with a characteristic of the disease or condition by selecting first and/or
second samples that exhibit
the desired characteristics. The characteristics of the disease or condition
include, but are not
limited to, the state of advancement/progression of the disease or condition,
and the responsiveness
of the disease or condition to a particular medication, treatment regimen or
therapy. For example,
assume the disease or condition is breast cancer. The first sample can be a
sample(s) from breast
tumors that are responsive to drug A; the second sample(s) can be normal
breast tissue. The
6
CA 02585525 2007-04-26
WO 2005/103298 PCT/US2005/013247
ncRNA signature can be determined. The process can be repeated as above,
except that the first
sample(s) are from breast tumors that are responsive to drug B. By comparing
the ncRNA profiles
obtained, ncRNA signatures can be obtained that are correlated with drug
responsiveness.
The ncRNA signature for a disease or condition may be utilized in a number of
ways. The
neRNA profile from a subject can be compared to the ncRNA signature for the
given disease or
condition. In this manner the comparison can be used to classify a subject as
having the particular
disease or condition or being at risk for the particular disease state of
condition. In addition, the
comparison may be used to determine the potential responsiveness to a
medication, treatment
regimen or therapy. Furthermore, the comparison may be used to determine the
state of
progression of the disease or condition in the subject. In addition, the ncRNA
signature for the
disease or condition may be used to monitor the progression of the disease or
condition. Also, the
ncRNA signature for a disease or condition may be used to monitor the efficacy
of a medication,
treatment regimen or therapy.
In yet another embodiment, the detection methods disclosed may be used to
identify
potential drug targets for the treatment of a disease or condition. As
discussed above, ncRNA
signatures for a particular disease or condition may be created. By
determining the identity of the
ncRNA species that characterize a particular disease or condition, the
identity of molecular targets
involved in the molecular pathways responsible for the disease state or
condition may be identified.
These molecular targets may provide novel therapeutic candidates for drug
development for the
treatment and/or prevention of the disease or condition. In such a method, the
ncRNA signature for
a disease or condition is obtained as described above. The ncRNA molecules
that characterize the
disease or condition are noted. The identity of the ncRNA molecules is used to
determine the
molecular targets involved in the molecular pathways of the disease or
condition. In a specific
embodiment, the ncRNA is a miRNA.
The detection method described may use modified nucleotides to enhance the Tm
of the
capture and detection oligonucleotides with their complementary sequences on
the target RNA.
Various modified nucleotides sufficient for this purpose are known in the art.
In one embodiment,
the modified nucleotides are locked nucleic acids, or LNATM. In an alternate
embodiment the
modified nucleotides may comprise peptide nucleic acids (PNA). Other modified
nucleotides may
be used as are known in the art or as are developed in the art. The use of
modified nucleotides to
enhance Tm in the capture and detection oligonucleotides described below
provides for increased
specificity and sensitivity of target RNA detection. Furthermore, through the
incorporation of one
or modified nucleotides into the capture and detection oligonucleotides of the
disclosure (as
described in more detail below), the Tm of binding of the capture and
detection oligonucleotides to
their complementary sequences on the target RNA can be engineered to be about
the same. As used
7
CA 02585525 2007-04-26
WO 2005/103298 PCT/US2005/013247
herein, a LNA base or nucleotide, refers to a bicyclic nucleic acid where a
ribonucleoside is linked
between the 2'-oxygen and the 4'-carbon atoms with a methylene unit.
Oligonucleotides containing
LNA nucleotides exhibit unprecedented thermal stabilities towards
complementary DNA and
RNA. On average, each modified (spiked) LNA nucleotide will increase the Tm
for a LNA:RNA
hybrids by 7.3 C. The high binding affinity of LNA containing oligonucleotides
allows for the use
of shorter oligonucleotide sequences for use as probes and makes LNA
containing oligonucleotides
excellent probes for mismatch discrimination.
LNA oligonucleotides can be synthesized by standard phosphoramidite chemistry
using
DNA-synthesizers. LNA can be mixed with DNA, RNA as well as other nucleic acid
analogs. It
can be synthesized with biotin, Cy dyes or other dyes as is known in the art.
LNA containing
oligonucleotides are water-soluble and basepair with DNA and RNA with
exceptionally high
thermal stability. Exiqon (Demark) has developed software for predicting the
melting behavior and
Tm of LNA containing oligonucleotides and for assisting in the design of LNA
containing
oligonucleotides. Furthermore, since LNA containing oligonucleotides can
hybridize with both
RNA and DNA molecules, any type of nucleic acid can be detected using the
method described
herein. When a double stranded RNA or DNA molecule is to be detected, it may
be required to
denature the double stranded molecules before the hybridization steps
described herein.
General Description of ncRNA Detection Methodology
The detection method comprises the use of a capture oligonucleotide and a
detection
oligonucleotide. The capture oligonucleotide comprises a first signal
generator to produce a first
detectable signal and the detection oligonucleotide comprises a second signal
generator to produce
a second detectable signal. The first and second detectable signals may be any
signal that can be
detected using commercially available devices. The first and second detectable
signals may be an
emission of a given wavelength (such as but not limited to light to produce an
optical signature), a
change in electrical properties such as conductivity, or a change in the
electromagnetic or chemical
properties. In one embodiment, the first and second detectable signals are
optical signatures. In
one embodiment, the optical signature is generated using a chromophore, a
flourophore or any
other reagent capable of generating an optical signature. A variety of optical
signatures may be
created by mixing different chromophores or flourophores or usiing different
concentrations
(intensities) of the same. The first and second detectable signals are capable
of being detected in
the presence of one another. The first and second detectable signals may be
associated directly or
indirectly with the capture oligonucleotide and the detection oligonucleotide,
respectively. In one
embodiment, the first detectable signal on the capture oligonucleotide is a
microsphere capable of
generating said first detectable signal. In a specific application, the
microsphere is a color-coded
microsphere, such as the microspheres manufactured by Luminex (Austin, Texas).
The Luminex
8
CA 02585525 2007-04-26
WO 2005/103298 PCT/US2005/013247
technology and related technologies are described in the art and in US Patent
Nos. 6,524,473,
6,514,295, 6,449,562, 6,411,904, 6,366,354, 6,268,222, 6,139,800, 6,057,107,
6,046,807 and
5,736,330. The capture oligonucleotide may be coupled to the microsphere by
covalent or non-
covalent means. The capture and detection oligonucleotides are specific to a
target RNA of interest
(such as a miRNA), allowing the detection of any known target RNA species with
the appropriate
design of the capture and detection oligonucleotides. Each of the components
of the method is
described in more detail below.
Any target RNA species may be targeted for detection. The only requirement is
that at least
a portion of the sequence of the target RNA is known. The entire sequence of
the target RNA need
not be know, so long as the known sequence is of a sufficient length to
hybridize to the detection
and capture oligonucleotides as described below. In one embodiment, the entire
sequence of the
target RNA is known.
For each target RNA species targeted for detection, a specific capture
oligonucleotide is
designed. The first detectable signal generated by the first signal generator
is used to identify the
capture oligonucleotide throughout the method, and therefore, to determine the
identity of the
target RNA bound by the capture oligonucleotide. In one embodiment, the first
detectable signal
may comprise an optical signature. In one embodiment, when the first
detectable signal is an
optical signature, the optical signature may be contained in a microsphere. In
alternate
embodiment, the first detectable signal may be a pre-determined position, such
as may be the case
when the capture oligonucleotide is attached to a pre-printed array or the
like.
The capture oligonucleotide comprises a short nucleic acid sequence
complementary to at
least a portion of the sequence of the target RNA species to be detected
(termed the "capture
sequence"). In one embodiment, the length of the capture oligonucleotide is
from 6 to 14
nucleotides. In a further embodiment, the length of the capture
oligonucleotide is 8-12 nucleotides.
In yet another embodiment, the length of the capture oligonucleotide is 12
nucleotides. The length
of the capture sequence corresponds to the length of the capture
oligonucleotide. The capture
oligonucleotide may contain one or more modified nucleotides, such as LNA
nucleotides, to
enhance binding specificity and binding efficiency. In one embodiment, at
least 1 nucleotide bases
of the capture oligonucleotide is a modified nucleotide. In an alternate
embodiment, at least 2-4
nucleotide bases of the capture oligonucleotide are modified nucleotides. In
yet another alternate
embodiment, at least 5 nucleotide bases of the capture oligonucleotide are
modified nucleotides.
The modified nucleotides may be spaced apart within the nucleotide sequence of
the capture
oligonucleotide, may be contiguous in the nucleotide sequence of the capture
oligonucleotide, or a
combination of the foregoing. In yet another embodiment, the capture
oligonucleotide does not
contain any modified nucleotides. In certain cases where the GC content of the
of the capture
9
CA 02585525 2007-04-26
WO 2005/103298 PCT/US2005/013247
sequence is high enough, the Tm of a capture oligonucleotide having a length
as described above
will be sufficient to achieve the specificity and sensitivity of
hybridization.
In one embodiment, the nucleotide sequence of the capture oligonucleotide is
100%
complementary to the nucleotide sequence of the capture sequence of the target
RNA species to be
detected. In an alternate embodiment, the nucleotide sequence of the capture
oligonucleotide
contains at least one mismatched base as compared to the nucleotide sequence
of the capture
sequence of the target RNA species to be detected.
The capture oligonucleotide may further comprise a spacer sequence to allow
the efficient
attachment to the substrate. The spacer sequence is not be complementary to
the capture sequence
and may be comprised of a nucleic acid component, a non-nucleic acid component
or a
combination of nucleic acid and non-nucleic acid components. In one
embodiment, the spacer is a
nucleic acid sequence that is not complementary to a sequence to be detected.
In an alternate
embodiment, the spacer is a carbon based spacer of 6-15 carbons in length. The
capture sequence
may be located at any convenient position on the target RNA molecule to be
detected. In one
embodiment, the capture sequence is located toward the 5' end of the target
RNA molecule. The
position toward the 5' end of the target RNA molecule may be defmed such that
the capture
sequence contains the 5' most nucleotide of the target RNA molecule or may be
defined such that
the capture sequence omits one or more of the 5' most nucleotides of the
target RNA molecule. In
an alternate embodiment, the capture sequence is located at the 3' end of the
target RNA. The
position toward the 3' end of the target RNA molecule may be defined such that
the capture
sequence contains the 3' most nucleotide of the target RNA molecule or may be
defined such that
the capture sequence omits one or more of the 3' most nucleotides of the
target RNA molecule.
The length of the capture oligonucleotide will correspond to the length of the
capture sequence, as
discussed above. In yet another alternate embodiment, the capture sequence is
located in the
middle portion of the target RNA molecule.
The detection oligonucleotide comprises a short nucleotide sequence
complementary to at
least a portion of the nucleotide sequence (termed the "detection sequence")
of the target RNA
species to be detected. In one embodiment, the length of the detection
oligonucleotide is from 6 to
14 nucleotides. In a further embodiment, the length of the capture
oligonucleotide is 8-12
nucleotides. In yet another embodiment, the length of the capture
oligonucleotide is 10
nucleotides. The detection oligonucleotide may contain one or more modified
nucleotides, such as
LNA nucleotides, to enhance binding specificity and binding efficiency. In one
embodiment, at
least 1 nucleotide base of the detection oligonucleotide is a modified
nucleotide. In an alternate
embodiment, at least 2-4 nucleotide bases of the detection oligonucleotide are
modified
nucleotides. In yet another alternate embodiment, at least 5 nucleotide bases
of the detection
CA 02585525 2007-04-26
WO 2005/103298 PCT/US2005/013247
oligonucleotide are modified nucleotides. The modified nucleotides may be
spaced apart within the
nucleotide sequence of the detection oligonucleotide, may be contiguous in the
nucleotide sequence
of the detection oligonucleotide, or a combination of the foregoing. In yet
another embodiment,
the detection oligonucleotide does not contain any modified nucleotides. In
certain cases where the
GC content of the of the detection sequence is high enough, the Tm of a
detection oligonucleotide
having a length as described above will be sufficient to achieve the
specificity and sensitivity of
hybridization.
One end of the detection oligonucleotide comprises a second signal generator
to produce a
second detectable signal. The second detectable signal is detectable in the
presence of the first
detectable signal. The simultaneous detection of the first and second
detectable signals is required
to generate a positive identification of a given target RNA. The second
detectable signal may
comprise an optical signature. The second signal generator may be directly
attached to the
detection oligonucleotide. Alternatively, the second signal generator may be
indirectly attached to
the detection oligonucleotide, such as through the use of complementary
binding pairs.
Complementary binding pairs are meant to refer to binding pairs such as
biotin/streptavidin,
biotin/avidin and other such complexes as may be known in the art. The
complementary binding
pairs may also include chemical moieties, organic moieties or complementary
amino acid or
nucleic acid sequences. A variety of optical signatures may be created by
mixing different
chromophores or flourophores or using different concentrations (intensities)
of the same.
In one embodiment, the nucleotide sequence of the detection oligonucleotide is
100%
complementary to the detection sequence of the target RNA species to be
detected. In an alternate
embodiment, the nucleotide sequence of the detection oligonucleotide contains
at least one
mismatched base as compared to the nucleotide sequence of the detection
sequence of the target
RNA species to be detected. The detection sequence may be located at any
convenient position on
the target RNA molecule. In one embodiment, the detection sequence is located
toward the 5' end
of the target RNA molecule. The position toward the 5' end of the target RNA
molecule may be
defined such that the detection sequence contains the 5' most nucleotide of
the target RNA
molecule or may be defined such that the detection sequence omits one or more
of the 5' most
nucleotides of the target RNA molecule. In an alternate embodiment, the
detection sequence is
located at the 3' end of the target RNA. The position toward the 3' end of the
target RNA
molecule may be defined such that the detection sequence contains the 3' most
nucleotide of the
target RNA molecule or may be defined such that the detection sequerice omits
one or more of the
3' most nucleotides of the target RNA molecule. The length of the detection
sequence will
correspond to the length of the detection oligonucleotide selected, as
discussed above. In yet
11
CA 02585525 2007-04-26
WO 2005/103298 PCT/US2005/013247
another alternate embodiment, the detection sequence may be located in the
middle portion of the
target RNA molecule.
In one embodiment, the detection sequence is selected so that there is no
overlap between
the detection sequence and the capture sequence. Therefore, in one embodiment
if the capture
sequence is located toward the 5' end of the target RNA molecule, the
detection sequence is
located toward the 3'end of the target RNA molecule. Likewise, in an alternate
embodiment, if the
capture sequence is located toward the 3' end of the target RNA molecule, the
detection sequence
is located toward the 5' end of the target RNA molecule.
In one embodiment, the capture oligonucleotides and the detection
oligonucleotides have
substantially the same Tm on binding to the capture and detection sequences,
respectively. By
substantially the same Tm on binding it is meant that the Tm for binding of
the capture
oligonucleotide to the capture sequence and the binding of the detection
oligonucleotide to the
detection sequence differ by 1-5 degrees Celsius. In one embodiment, the Tms
differ by 1-3
degrees Celsius. In an alternate embodiment, the Tms differ by 1-2 degrees
Celsius. In still
another embodiment, the Tms differ by 1 degree Celsius. By having the Tm
values for binding
between the capture oligonucleotide and the capture sequence and the detection
oligonucleotide
and the detection sequence being substantially the same, the sensitivity of
the detection reaction
can be significantly increased without sacrificing specificity of detection.
Exiqon (Demark) has
developed software for predicting the melting behavior and Tm of LNA
containing
oligonucleotides and for assisting in the design of LNA containing
oligonucleotides. In one
embodiment, the length and composition (including the incorporation of
modified nucleotides, if
used) of the capture and detection oligonucleotides are selected so that the
capture and detection
oligonucleotides will have similar Tm values for hybridization to the capture
sequences and
detection sequences, respectively of the target RNA.
In certain embodiments, it will be advantageous to detect a family of related
target RNA
species in a single reaction. Such family members often share high homology
over significant
lengths of the target RNA (Examples are provided below for the detection of
related miRNA
species). Where the detection of a family of related target RNA species is
desired, the capture
oligonucleotide or the detection oligonucleotide may have the same nucleotide
sequence for one or
more of the related target RNA species to be detected (see Table 1 in Example
1). In certain other
embodiments where the target RNA species to be detected do not share homology,
the capture
oligonucleotide and/or the detection oligonucleotide may have different
nucleotide sequences for
each target RNA.
The present method envisions that more than one target RNAs may be detected in
a single
detection reaction. Therefore, a plurality of capture oligonucleotides and
detection
12
CA 02585525 2007-04-26
WO 2005/103298 PCT/US2005/013247
oligonucleotides can be used to recognize capture sequences and detection
sequences, respectively,
on a plurality of target RNA species in the same detection reaction. Where
multiple target RNA
species are to be detected in a single detection reaction, the lengths of the
capture oligonucleotides
and/or detection oligonucleotides may be different or may be the same, the
number of modified
nucleotides incorporated into the nucleotide sequence of the capture
oligonucleotide and/or
detection oligonucleotides may be different or the same, and the location of
the capture sequence
and /or detection sequences on the target RNA species to be detected may be
different or the same.
In the detection method disclosed, sample RNA is obtained from a source. The
sample
RNA contains at least one target RNA species to be analyzed. The source may be
any source
containing RNA. The source may be human, plant, animal (including eukaryotic
and prokaryotic
organisms) or viral. The sample RNA may be taken from a tissue, blood, saliva
or other excretion.
The source may be cell line derived from a human, plant or animal. In one
embodiment, more than
one sample may be obtained from the source. In this embodiment, one sample may
be taken from
a tissue characterized as having a disease and the one sample may be taken
from a tissue
characterized as not having the disease. Methods for isolating RNA are known
in the art. The
sample RNA may be total RNA. Alternatively, the sample RNA may be
fractionated, purified or
partially purified. In one embodiment, the sample RNA is fractionated
according to size to remove
higher molecular weight RNA components. The fractionation may be accomplished
by any
method known in the art, such as chromatographic methods. In another alternate
embodiment,
whole cell lysate may be used without requiring purification of RNA.
The detection method may be carried out in a variety of embodiments. In one
embodiment,
the sample RNA containing the target RNA(s) to be detected is mixed with and
incubated with the
capture oligonucleotides and the detection oligonucleotides to allow the
simultaneous hybridization
between the capture oligonucleotide and the capture sequence and the detection
oligonucleotide
and the detection sequence on the target RNA species to be detected. The
product of this reaction
is a complex (the "detection complex") consisting of the capture
oligonucleotide and the detection
oligonucleotide bound to the target RNA species via the capture and detection
sequences
respectively. In an alternate embodiment, the sample RNA containing the target
RNA(s) to be
detected is mixed with and incubated with the capture oligonucleotides to
allow the hybridization
between the capture oligonucleotide and the capture sequence on the target RNA
species to be
detected. A wash step may be preformed. Subsequently, the detection
oligonucleotides are
incubated with the capture oligonucleotide/target RNA complex to allow
hybridization between the
detection oligonucleotide and the detection sequence on the target RNA species
to be detected to
form the detection complex.
13
CA 02585525 2007-04-26
WO 2005/103298 PCT/US2005/013247
A variety of hybridization conditions may be used. In one embodiment, the
hybridization
reactions take place in solution (meaning that the capture and detection
oligonucleotide sequences
and the target RNA are free in solution) in the presence of a hybridization
buffer. IN an alternate
embodiment, at least one of the detection or capture oligonucleotides are
bound to a substrates,
such as a chip or other solid support. In one embodiment, the hybridization
conditions comprise
incubation for an appropriate period of time at an appropriate temperature
(such as at 52 C for 1
hour) in 1X TMAC buffer (3M TMAC, 0.1% Sarkosyl, 50mM Tris-HC1 pH 8.0, 4mM
EDTA pH
8.0). TMAC buffer offers the advantage that hybridization properties are
determined primarily by
the oligonucleotide length and is independent of base composition, so that
single-base mismatches
are easily detected under a standard set of conditions. However, other
hybridization buffers may be
used. In alternate embodiments, the hybridization buffer may be 1 x SSCT
(1xSSC containing
0.05% (vlv) Tween 20) or of sodium phosphate buffer (50mmol/L sodium phosphate
buffer, pH
7.0, 0.1 mL/lOOmL Tween 20) or other hybridization buffers known in the art.
In addition,
hybridization times (see Table 4 in Example 1) and hybridization temperatures
may be varied as
discussed below and as is known in the art. For example, the hybridization
time may be decreased
to 10 minutes or less (see Table 5 in Example 1 below). A 10 minute
hybridization time produced
a signal that was approximately 70% of that observed during a 1 hour
hybridization period.
Therefore, the hybridization times may be varied as would be obvious to one of
skill in the art
depending on the required sensitivity of the detection reaction.
In the embodiment, where the capture oligonucleotides are conjugated to a
microsphere or a
substrate (such as a chip or other solid support ), the density of the capture
oligonucleotides on the
microsphere or substrate may also be varied. The density of the capture
oligonucleotide on the
microsphere or substrate may influence capture efficiency. The density of the
capture
oligonucleotides may range from 104 to 109 capture oligonucleotides/
microsphere or substrate. In
one embodiment, density of the capture oligonucleotides may range from 106 to
108. For shorter
target RNAs, such as miRNAs, the density of the capture oligonucleotide will
be less of a concern
than for larger nucleic acid molecules as the smaller RNA molecules may have
easier access to the
capture oligonucleotides conjugated to the substrate. Likewise, the
concentration of the detecting
oligonucleotides may be varied. In one embodiment, the detection
oligonucleotides are used in an
excess as compared to the miRNA target specie(s). In the experiments described
in the Examples
section below, the detection oligonucleotides are used at a concentration of
10 pmol. However,
other concentrations may be used as would be obvious to those skilled in the
art. In general, the
concentration of detection oligonucleotides is selected so as to minimize
background caused by
excess detection oligonucleotide.
14
CA 02585525 2007-04-26
WO 2005/103298 PCT/US2005/013247
The concentration of the capture and detection oligonucleotides may be varied
in order to
increase or decrease the sensitivity of the detection reaction. For example,
if it is desired to detect a
plurality of target RNAs, one or more of these target RNAs may be present in
significantly
different concentrations. In order to keep the signals detected in the linear
range, it may be
desirable to decrease the signal generated for a particular target RNA by
decreasing the
concentration of the appropriate capture and detection oligonucleotides.
Likewise, it may be
desirable to increase the signal for a particular target RNA. In this case the
concentration of
capture and detection oligonucleotides for the appropriate target RNA may be
increased.
After hybridization between a target RNA to be detected and the capture and
detection
oligonucleotides, the resulting detection complex is centrifuged to pellet the
detection complex. In
this manner, excess detection oligonucleotide and RNA components may be
removed. The excess
liquid is removed. Wash steps using commonly known washing buffers may be
performed if
desired. However, the results in the Example section below were conducted
without wash steps.
The detection complex may then be subject to detection. Reagents required for
the visualization of
the first and/or second detectable signals may be added prior to the detection
reaction if required.
In one embodiment, a fluorescent moiety (such as PE) is linked to one part of
a complementary
binding pair (such as streptavidin) and added for binding to the other
component of the
complementary binding pair on the detection oligonucleotide (such as biotin).
The detection
reaction detects the first detectable signal and the second detectable signal.
Therefore, the identity
of the capture oligonucleotide is given by the detectable signal (and
therefore, the identity of the
target RNA species bound to the capture oligonucleotide) and the presence of a
target RNA in the
detection complex is determined by the second detectable signal associated
with the detection
oligonucleotide. The second detectable signal may be the same for each
detection oligonucleotide.
The method of detection of the first and second signal tags will vary
depending on the nature of
said tags as is known in the art. In one embodiment, first and second
detectable signals are
fluorescent signals and the detection method involves an automated, high
throughput detection
platform.
In a more specific embodiment, the first detectable signal is a internally
color-coded
microsphere utilizing the X-Map technology developed by Luminex with the
internally color-coded
microsphere serving as the first detectable signal, the second detectable
signal is a fluorescent
streptavidin-PE label and the automated, high throughput detection platform is
the Luminex
platform (such as but not limited to the Luminex 100 instrument). At least 100
target RNA can be
analyzed in a single assay. By performing multiple assays, the number of
target RNAs to be
analyzed is infinite.
CA 02585525 2007-04-26
WO 2005/103298 PCT/US2005/013247
The presence of target RNA in the sample can be measured as a function of the
fluorescent
intensity. In this embodiment, the reaction mixture is injected into the
Luminex platform which
uses microfluidics to align the microspheres in single file where lasers
illuminate the colors inside
the microsphere (i.e., the first detectable signal) and on the surface of each
microsphere (i.e. the
second detectable signal). For each color-coded microsphere, the Luminex
platform records 100
separate readings to take an average for data reporting. From a statistical
point of view, that is 100
data points per target to be detected. Advanced optics captures the color
signals. Finally, digital
signal processing translates the signals into real-time, quantitative data for
each reaction.
Appropriate controls may also be added to the detection method. Many types of
internal
and external controls may be employed as is known in the art. An internal
control will allow an
investigator to normalize and compare data regarding target RNA levels at
different time points
(such as before and after a treatment protocol) and to normalize the
variations introduced by the
sample handling process. The internal control may be selected to mimic the
characteristics of the
target RNA to be detected. In one embodiment, the internal control is 5S or
5.8S rRNA. Both 5S
and 5.8S rRNA are ubiquitously expressed and are small RNA molecules. Capture
and detection
oligonucleotides will be prepared for the internal controls in the same manner
as for target RNA
molecules. Furthermore, if the expression level for the internal control is
too high to be compared
with the target RNA to be detected, the system may be modified to make the
detection of the
internal control less sensitive (i.e. by adding more internal control-specific
beads to the reaction, by
decreasing the number of capture oligonucleotides specific for the internal
control/substrate or by
adding unlabeled, un-conjugated capture oligonucleotides to the reaction
mixture).
External controls (standards) may also be included. The external control is
used to
normalize data and cancel out variations introduced by the Luminex machine and
the detection
system. In one embodiment, four to five specific oligonucleotides will be
coupled to different
substrate molecules (such as different color-coded microspheres). The
oligonucleotides either
contain the second signal tag or are able to bind the second signal tag as
discussed above. Different
amounts of each oligonucleotide will be added for different standards. For
example, for Standard A
(StdA), 0.1 fmol of biotin labeled probe will be used; for StdB, 1 fmol; for
StdC, 10 fmol: and for
StdD, 100 fmol. The mean fluorescent intensity of each standard can be
acquired, along with all the
target RNA molecules to be detected. The relative concentration of the
standards, as well as the
target RNAs, can be measured.
The results described in the Examples below show that the method disclosed is
a very
efficient tool for the detection of small target RNA molecules. The method
described combines the
use of a high throughput detection platform with the enhanced hybridization
specificity and
sensitivity of modified nucleotides. With the appropriate design of the
capture and detection
16
CA 02585525 2007-04-26
WO 2005/103298 PCT/US2005/013247
oligonucleotides, multiple target RNA molecules can be studied in one
experiment. As a result, the
expression pattern or profile of a number of target RNA molecules can be
studied. Compared to
existing methods, the present detection method disclosed is more about 100
times more sensitive
than routinely used Northern blot method. Only 50-100ng of total RNA is
required for a
multiplexed analysis. Furthermore, the present detection method disclosed is
more specific than
existing methods as a result of the use of modified oligonucleotides and
liquid phase hybridization
format. The present detection method disclosed is also easy to use, requires
no labeling of
oligonucleotides or sample nucleotide sequences, no amplification of the
target RNA molecules
and can be completed in as little as 1 hour.
Defmitions
The terms "prevention", "prevent", "preventing", "suppression", "suppress" and
"suppressing" as used herein refer to a course of action (such as
administering a compound or
pharmaceutical composition) initiated prior to the onset of a clinical symptom
of a disease state or
condition so as to prevent or reduce a clinical manifestation of the disease
state or condition. Such
preventing and suppressing need not be absolute to be useful.
The terms "treatment", "treat" and "treating" as used herein refers a course
of action (such
as administering a compound or pharmaceutical composition) initiated after the
onset of a clinical
symptom of a disease state or conditioii so as to eliminate or reduce a
clinical manifestation of the
disease state or condition. Such treating need not be absolute to be useful.
The term "in need of treatment" as used herein refers to a judgment made by a
caregiver
that a patient requires or will benefit from treatment. This judgment is made
based on a variety of
factors that are in the realm of a caregiver's expertise, but that includes
the knowledge that the
patient is ill, or will be ill, as the result of a condition that is treatable
by a method or compound of
the disclosure.
The term diagnosing as used herein refers to a judgment made by a caregiver
that a patient
has a specific disease or condition. This judgment is made based on a variety
of factors that are in
the realm of a caregiver's expertise and may include the use of the methods
disclosed herein.
The term "in need of prevention" as used herein refers to a judgment made by a
caregiver
that a patient requires or will benefit from prevention. This judgment is made
based on a variety of
factors that are in the realm of a caregiver's expertise, but that includes
the knowledge that the
patient will be ill or may become ill, as the result of a condition that is
preventable by a method or
compound of the disclosure.
The term "individual", "subject" or "patient" as used herein refers to any
animal, including
mammals, such as mice, rats, other rodents, rabbits, dogs, cats, swine,
cattle, sheep, horses, or
primates, and humans. The term may specify male or female or both, or exclude
male or female.
17
CA 02585525 2007-04-26
WO 2005/103298 PCT/US2005/013247
EXAMPLES
Example 1- Detection of synthetic miRNA molecules
The methods of the present disclosure were used to analyze 4 closely related
ncRNAs, in
this example the miRNAs Let-7a, Let-7b, Let-7c, and Let-7g (the sequence of
each miRNA is
shown in Table 1 along with relevant SEQ ID NOS.). The Let-7a, Let-7b, Let-7c,
and Let-7g
miRNAs belong to a conserved miRNA family and the 10 nucleotides on the 5' end
of each
miRNA are conserved. There are minor sequence differences at the 3' end of the
miRNAs.
The Let-7a, Let-7b, Let-7c, and Let-7g miRNAs were synthesized by MWG (High
Point,
NC) and their sequences confirmed. The LNA spiked capture oligonucleotides and
detection
oligonucleotides for Let-7a, Let-7b, Let-7c, and Let-7g were prepared by
Phoenix Biotechnologies
(Huntsville, AL). The sequences of capture and detection oligonucleotides used
for each miRNA
are also given in Table 1 along with relevant SEQ ID NOS. The capital letters
in the respective
sequences indicates a LNA base. It should be noted that the nucleotide
sequences indicated for the
capture oligonucleotides can be modified by adding a spacer group, said spacer
group being a
carbon based linker (such as, but not limited to, a C6 or a Cl2 linker), a
nucleotide sequence (such
as, but not limited to, aacgcgtata and tacgcgtata, SEQ ID NOS. 94 and 95), or
a combination of the
foregoing. In one embodiment, the C6 and C12 linkers are used in combination
with the nucleotide
sequences disclosed in the previous sentence. The predicted Tm for the capture
oligonucleotide/capture sequence and the detection oligonucleotide/detection
can be predicted.
The Tms for the complexes were selected to be substantially equivalent through
the use of a
computer program available from Exiqon (Demark). Color-coded microspheres were
purchased
form Luminex Corporation (Austin, TX).
In this example, the capture oligonucleotides were designed to hybridize to
the 3' end of the
desired target miRNAs and the detection oligonucleotides were designed to
hybridize to the 5' end
of the desired target miRNAs. In this example, the detection oligonucleotides
were labeled with a
biotin tag at their 3' end to allow interaction with the second detectable
signal (which was
conjugated to a streptavidin group). Furthermore, a C12 linker sequence was
added to the 5' end of
each capture oligonucleotide to allow for coupling of the detection
oligonucleotides to the
microspheres The first detectable signal). The capture oligonucleotides were
coupled to the
microspheres using the manufacturer's recommended protocol as described below
in the Methods.
The detection methodology used in this example is as follows. Sample RNA, in
this
example the synthetically produced Let-7a, Let-7b, Let-7c and Let-7g miRNAs,
is added to 1X
TMAC buffer (3M TMAC, 0.1% Sarkosyl, 50mM Tris-HCI pH 8.0, 4mM EDTA pH 8.0) at
various concentrations as indicated in the tables below. To this reaction tube
was added capture
oligonucleotides coupled to Luminex microspheres and detection
oligonucleotides for each miRNA
18
CA 02585525 2007-04-26
WO 2005/103298 PCT/US2005/013247
species to be detected as shown in Table 1 specific. Equal numbers of
microspheres (3000) coupled
to capture oligonucleotides were added, with approximately 106 to 108 capture
oligonucleotides per
microsphere (the total concentration of capture oligonucleotide was
approximately 0.5 pmol). The
detection oligonucleotides were each added at concentration of 10 pmol. The
mixture was
incubated at 52 C for 1 hour, or the times indicated below, in 1X TMAC buffer
to allow
hybridization between the sequences of the capture oligonucleotides and their
respective capture
sequences and the detection oligonucleotides and their respective capture
sequences. After the 1
hour hybridization, the mixture was centrifuged at 15,000 RPM for 2 minutes
(room temperature)
to pellet the detection complex. The excess liquid was aspirated and 60 1 of
diluted straptavidin-
PE cpnjugate was added. The streptavidin-PE conjugate was incubated with the
detection complex
for 10 minutes at 52 C to allow binding of the streptavidin-PE conjugate to
the biotin tag on the
detection oligonucleotides. At the end of the incubation, the mixture was read
on a Luminex 100
platform. The entire detection reaction as described can be completed in 90
minutes. As discussed
above, the conditions described can be modified.
Tables 2-5 show the specificity and sensitivity of the miRNA detection method
disclosed.
The colunins in Tables 2-5 represent the particular capture and detection
oligonucleotide added to
the reaction mixture to detect a specific target RNA (indicated as Let-7a, Let-
7b, Let-7c and Let-
7g). The rows in Tables 2-5 indicates the specific target RNA added to the
reaction mixture and
the concentration of the target RNA. (each row represents an individual
detection reaction). The
sequences of each capture and detection oligonucleotide and the synthetic
miRNAs are shown in
Table 1. The row indicated as "no template" indicates no synthetic miRNA (the
target RNA) was
added to the reaction and serves as a negative control and background reading.
To normalize the
data, a percentage value of the signal for a target miRNA is calculated by
dividing the specific
signal obtained for a particular target miRNA reaction by the total signal
from that sample (termed
a "normalization ratio"). Those signals greater than 35% of the total signal
are highlighted.
In the results shown in Table 2, Let-7a, Let-7b, Let-7c and Let-7g synthetic
miRNAs were
added at 100, 80, 60, and 40 finol each. The detection oligonucleotides were
each added at a
concentration of 10 pmol. In rows 2-5, 100 fmol of Let-7a, Let-7b, Let-7c, and
Let-7g synthetic
miRNAs were added; rows 6-9, 80 fmol of Let-7a, Let-7b, Let-7c, and Let-7g
synthetic miRNAs
were added; rows 10-13, 60 fmol of Let-7a, Let-7b, Let-7c, and Let-7g
synthetic miRNAs were
added; and rows 14-17, 40 finol of Let-7a, Let-7b, Let-7c, and Let-7g
synthetic miRNAs were
added. As can be seen in Table 2, the detection of each miRNA species was very
specific, with
60% to 91% of the signal detected in a reaction being from the specific target
miRNA to be
detected. The negative control/background reactions were minimal as shown in
row 1 of Table 2.
19
CA 02585525 2007-04-26
WO 2005/103298 PCT/US2005/013247
At 40 fmol concentration of the target miRNA species, sensitive and specific
detection is
observed. For Let-7a- 81% of the signal detected in the sample was from the
specific target
miRNA to be detected. For Let-7b and Let-7c, 76% of the signal detected in the
sample was from
the specific target miRNA to be detected. For Let-7g, 91 % of the signal
detected in the sample was
from the specific target miRNA to be detected. This sensitive and specific
detection is observed
despite the strong sequence homology of the miRNA species detected in the
reaction. The
sequence of Let-7b and Let-7c differ by only 1 nucleotide. The sequence of Let-
7b and Let-7a
differ by two nucleotides. The sequence of Let-7b and Let-7g differ by 5
nucleotides.
The data described for the 40 fmol miRNA concentration is indicative of the
data obtained
at the other miRNA concentrations as can be seen in Table 2. The data in Table
2 indicates that by
decreasing the concentration of the miRNA target, specificity was increased
slightly.
Table 3 shows the results of the detection assay where the miRNA targets are
used
concentrations of 10, 1 and 0.1 finol. The results shown in Table 3 mirror
those shown in Table 2,
indicating that detection specificity can be maintained at miRNA
concentrations as low as 0.1 finol.
At 0.1 fmol, for Let-7a, Let-7b, Let-7c and Let-7g, 70%, 81%, 77% and 91%,
respectively, of the
signal detected in each sample were from the specific target miRNA to be
detected.
Table 4 shows the effect of varying the hybridization time of the detection
oligonucleotides
coupled to the microspheres and the capture oligonucleotides with the miRNAs
to be detected. In
the results shown in Tables 2 and 3, a 1 hour hybridization time was used. In
table 4, incubation
times of 10 minutes, 30 minutes and 60 minutes were compared. The
concentration of the Let-7a,
Let-7b, Let-7c and Let-7g target miRNAs used in this experiment was 50 finol.
As can be seen in
table 4, decreasing the hybridization time to 10 minutes still resulted in
good specificity and
sensitivity. The signals detected using the 10 minute hybridization reaction
were approximately
70% of the signal obtained during the 1 hour hybridization.
To verify the repeatability of the detection method, samples were processed in
triplicate as
described above and the results compared. In this experiment, the
concentration of the Let-7a, Let-
7b, Let-7c and Let-7g target miRNAs was 50 fmol, the detection
oligonucleotides were used at a
concentration of 10 pmol and a hybridization time of 60 minutes was used.
Table 5 shows the
results of the detection. As can be observed, the repeatability of the
detection method is excellent
with an average CV of only 1.7%.
Example 2- miRNA profiling of total RNA from rat brain.
In this example, the ability of the detection method disclosed to detect
various miRNAs
present in a natural RNA source was examined. In this example, the RNA source
was a rat brain.
The detection method used in the experiments described in Example 2 was
identical to the method
used in Example 1, with the exception that the sample RNA was RNA extracted
from rat brain by
CA 02585525 2007-04-26
WO 2005/103298 PCT/US2005/013247
standard methodologies rather than synthetically produced miRNAs. The sequence
of the capture
and detection oligonucleotides is that shown in Table 1. The sample RNA was
either column
purified to enrich the percentage of small mRNAs or used as total RNA without
purification steps.
As above, the columns in Tables 6-7 represent the particular capture and
detection oligonucleotides
added to the reaction mixture specific for a given target RNA (indicated as
Let-7a, Let-7b, Let-7c
and Let-7g). The rows in Tables 6-7 indicates sample RNA added to the reaction
mixture and the
concentration at which sample RNA was added (each row represents an individual
detection
reaction). The results of the detection are shown in Tables 6 and 7.
The results in Table 6 show that the detection method disclosed is able to
detect the
presence of miRNA molecules from size fractionated (indicated as purified) and
total RNA. Row 1
is a negative control (no RNA added to the reaction). Rows 2-4 indicate total
RNA at 4 g, 400 ng
and 40 ng, respectively, was added to the reaction mixture. In rows 5-7,
column purified RNA
enriched in small RNAs at 400 ng, 40 ng and 4 ng, respectively, was added to
the reaction mixture.
Rows 8-11 were positive controls where 50 fmol of specific target synthetic
miRNA was added to
the reaction mixture. The detection oligonucleotides were added at 10 pmol.
The results in Table 6
show that miRNAs could be detected in RNA preparations enriched in small RNAs
as well as in
total RNA (without enrichment for small RNAs). With the increased sensitivity
of the detection
method disclosed, enrichment of the RNA from the source is not required.
To explore the limits of sensitivity of the miRNA detection method, the total
RNA
preparations were diluted to concentrations of 1600, 800, 400, 200, 100 and 50
ng in rows 1-6
respectively. As before, detection oligonucleotide was added at a
concentration of 10 pmol. As
can be seen in Table 7, the sensitivity of the detection method is maintained
down to concentrations
of 50 ng total RNA. The specificity of the reaction was also maintained as can
be seen by
comparing the normalization ratios obtained in Tables 6 and 7.
Example 3- miRNA profiling with mixed synthetic miRNAs
In this example, the ability of the detection reaction to detect various
miRNAs present in
mixed sample of synthetic miRNAs was examined. As with Example 1, the miRNAs
were
synthetically produced and the sequence of each miRNA is that shown in Table
1. The detection
method used in the experiments described in Example 3 was identical to the
method used in
Example 1. As above, the columns in Table 8 represent the particular capture
and detection
oligonucleotides added to the reaction mixture specific for a given target RNA
(indicated as Let-7a,
Let-7b, Let-7c and Let-7g). The rows in Table 8 indicate which the target
miRNA was added to
the reaction mixture and the concentration at which each was added (eaah row
represents a separate
reaction). The sequences of each capture and detection oligonucleotide and the
synthetic miRNAs
are shown in Table 1.
21
CA 02585525 2007-04-26
WO 2005/103298 PCT/US2005/013247
Table 8 shows the assay specificity and sensitivity with mixed synthetic
miRNAs. Row 1 is
a negative control. Rows 2-4 are specific for Let-7a, Let-7b and Let-7c,
respectively (each added at
fmol). Row 5 represents a mixture of lOfinol of Let-7a together with lOfrnol
of Let-7b. Row 6
represents a mixture of 10fmol of Let-7a together with 5finol of Let-7b. Row 7
represents a
mixture of 5 fmol of Let-7a together with l0fmol of Let-7b. Similar
combinations were tested for
10 Let-7a and. Let-7c (rows 8-10), and Let-7b and Let-7c (rows 11-13). As can
be seen in Table 8, the
signals detected correlated with the amount of miRNA target present in the
reaction. While the
results do indicate some cross hybridization (especially between highly
homologous miRNAs such
as Let-7b and Let-7c which differ in sequence by 1 nucleotide), this result
indicates that the
expression levels of various miRNAs can be monitored using the method
disclosed.
Example 4- Generation of a ncRNA Signature for Breast Cancer
As discussed above, the methods of the present disclosure may be used to
generate a
ncRNA signature for a disease or condition. This example illustrates an
example of a ncRNA
signature generated for breast cancer where the ncRNA is a miRNA. In this
exainple, patient RNA
samples were purchased from Asterand (Detroit, Michigan; www.asterand.com).
The patient RNA
samples contained the target miRNAs. Tissue samples from a patient were laser
micro-dissected
and total RNA from the samples was extracted as described by the manufacturer.
In two cases, pair
matched samples were purchased, meaning that in addition to a cancer sample, a
non-cancerous
RNA sample from the breast (from the same subject) was also obtained. The non-
cancerous RNA
sample served as a baseline for miRNA expression. The pair matched samples
used in the
following example are designated 5386N (normal breast RNA sample from patient
ID NO. 5386),
5386T (breast cancer RNA sample from patient ID NO. 5386), 31828N (normal
breast RNA
sample from patient ID NO. 31828), 31828T (breast cancer RNA sample from
patient ID NO.
31828). In addition to the pair matched samples, addition RNA samples from
breast tumor were
also purchased and designated 5387T, 17260T, 4591T, 11793T, 12595T, 14292T,
and 17054T.
miRNA profiles were determined for each RNA sample.
In an initial screen, over 100 miRNA molecules were screened for each RNA
sample
obtained and a miRNA profile for each sample was created. The miRNAs analyzed
included: let-
7a, let-7b, let-7c, let-7d, let-7e, let-7f, let-7g, let-7i, miR-1, miR-100,
miR-101, miR-lOlb, miR-
103, miR-105, miR-106a, miR-106b, miR-107, miR-10a, miR-lOb, miR-122a, miR-
124a, miR-
124a, miR-125a, miR-125b, miR-125b, miR-126, miR-127, miR-128a, miR-128b, miR-
129, miR-
130a, miR-130b, miR-131, miR-132, miR-133, miR-134, miR-135, miR-135b, miR-
136, miR-137,
miR-138, miR-139, miR-140, miR-141, miR-142-3p, miR-142-5p, miR-143, miR-144,
miR-145,
miR-146, miR-147, miR-148a, miR-148b, miR-149, miR-149, miR-150, miR-151, miR-
152, miR-
153, miR-153, miR-154, miR-155, miR-15a, miR-15b, miR-16, miR-17-3p, miR-17-
5p, miR-178,
22
CA 02585525 2007-04-26
WO 2005/103298 PCT/US2005/013247
miR-18, miR-181a, miR-181b, miR-181c, miR-182,miR-183 ,miR-184 ,miR-185, miR-
186, miR-
187, miR-188, miR-189, miR-190,miR-191, miR-192, miR-193, miR-194, miR-195,
miR-196,
miR-197, miR-198, miR-199a, miR-199b, miR-19b, miR-20, miR-200a, miR-200b, miR-
200c,
miR-201, miR-202, miR-203, miR-204, miR-205, miR-206, miR-207, miR-208, miR-
21, miR-210,
miR-211, miR-212, miR-213, miR-214, miR-215, miR-216, miR-217, miR-218, miR-
219, miR-22,
miR-220, miR-221, miR-222, miR-223, miR-224, miR-23a, miR-23b, miR-24, miR-25,
miR-26a,
miR-26b, miR-27a, miR-27b, miR-28, miR-290, miR-291-3p, miR-291-5p, miR-292-
3p, miR-292-
5p, miR-293, miR-294, miR-295, miR-296, miR-297, miR-298, miR-299, miR-29a,
miR-29b,
miR-29c, miR-300, miR-301, miR-30, miR-30a, miR-30b, miR-30c, miR-30d, miR-
30e, miR-31,
miR-32, miR-320, miR-321, miR-322, miR-323, miR-324-3p, miR-324-5p, miR-325,
miR-326,
miR-328, miR-329, miR-33, miR-330, miR-331, miR-337, miR-338, miR-339, miR-
340, miR-341,
miR-342, miR-344, miR-344, miR-345, miR-346, miR-34a, miR-34b, miR-34c, miR-
350, miR-
351, miR-7, miR-7b, miR-9, miR-92, miR-93, miR-95, miR-96, miR-98, miR-99a,
miR-99b, miR-
336, and miR-349. 5sRNA was also examined.
Pairs of detection and capture oligonucleotides specific for the detection of
each miRNA
molecule were also synthesized. Each of the capture oligonucleotides was 10-12
nucleotides in
length and contained an average of 3-4 LNA-modified nucleotides. The capture
sequence was
located on the 3' end of the target miRNA molecules. The capture
oligonucleotides were
synthesized and covalently coupled to color coded Luminex beads (per
manufacturer's
instructions). Each of the detection oligonucleotides were 8-10 nucleotides in
length and contained
and average of 2-3 LNA-modified nucleotides. Each detection oligonucleotide
comprised a biotin
tag on its 3' end. The detection sequence was located on the 5' end of the
target miRNA molecule.
The position and number of LNA-residues in each capture oligonucleotide and
detection
oligonucleotide were designed to give a T,,, of 45 C for hybridization based
on an online software
tool provided by Exiqon (http://lna-tm.com/).
The 114 pairs of capture and detection oligonucleotides were divided into 10
separate
multiplex reactions. Each multiplex reaction contained 10 sets of capture and
detection
oligonucleotides specific for 10 distinct target miRNA molecules and 1 g of
total RNA from each
of the above referenced patient RNA samples. For each target miRNA to be
detected, about 3000
beads (containing -0.5 pmol of capture oligonucleotide) and 0.5 pmol detection
oligonucleotide
were added in hybridization buffer (1X TMAC buffer, Sigma). The capture and
detection
oligonucleotides were added at the same time. The reaction was run at 45 C for
1 hr. The target
miRNA/capture oligonucleotide/detection oligonucleotide complexes were
collected by
centrifugation and excess liquid removed. Streptavidin-PE solution (Prozyme
PJ/70S) was added
23
CA 02585525 2007-04-26
WO 2005/103298 PCT/US2005/013247
per manufacturer's instructions and incubated for 10 min at 45 C. Samples were
immediately read
on the Luminex- 100 detection platform (Luminex, Austin, Texas).
Separate miRNA profiles were obtained from each of the RNA samples discussed
above.
The data from the miRNA profile analysis was analyzed. A subset of the target
miRNA molecules
was identified for further analysis. The nucleotide sequences for the miRNA
molecules identified
for further analysis and the nucleotide sequences of the capture and detection
oligonucleotides for
each of these miRNA molecules is shown in Table 1, along with the relevant SEQ
ID NOS. The
capital letters in the respective sequences indicates a LNA base. It should be
noted that the
nucleotide sequences indicated for the capture oligonucleotides can be
modified by adding a spacer
group as described in Example 1 above.
The raw data for these miRNA species is shown in Table 9 (with data expressed
as mean
fluorescent intensity, MFI). As can be seen in Table 9, several miRNA species
showed differential
expression between the normal breast tissue samples and the breast cancer
samples. In addition,
several miRNA species showed relatively constant expression between normal and
breast cancer
samples. These miRNA species can be used as internal references or internal
controls to normalize
the data if desired. Table 10 sliows the data normalized to the mir-130a
miRNA. To obtain the
normalized reading, the MFI for each miRNA detected was divided by
corresponding mir-130a
MIF value. Although not required, the use of an internal reference allows
differences between
samples to be accounted for.
In Tables 9 and 10, the rows designate the miRNA target detected and the
columns
designate the patient RNA sample being analyzed. Neg represents a negative
control where no
sample RNA was added and Pos indicates a positive control (Table 9). As can be
seen from Tables
9 and 10, the following target miRNA molecules showed altered expression
between normal and
cancer samples: mir-107, mir-15b, mir-103, mir-17-5p, mir-16, mir-126, mir-
141, mir-142-3p, mir-
143, mir-193, mir-199a, mir-29a, mir-195, mir-26a, mir-20, mir-128b, mir-217
and mir-219. As
discussed above, the expression of mir-122a, mir299, mir-7b and mir130a
remained essentially
constant between normal and cancer samples.
Furthermore, the target miRNA molecules comprising the breast cancer miRNA
signature
can be further subdivided. For Example, as shown in FIGS. 2 and 3, mir-107,
mir-15b and mir-103
showed altered (in this case increased) expression in all the breast cancer
samples as compared to
normal samples. However, mir-17-5p, mir-16, mir-126, mir-141, mir-142-3p, mir-
143, mir-193,
mir-199a, mir-29a, mir-195, mir-26a, mir-20, mir-128b, mir-217 and mir-219
showed mixed
results depending on the breast cancer sample analyzed. mir-17-5p, mir-16, mir-
126, mir-141, mir-
142-3p, mir-143, mir-193, mir-199a, mir-29a, mir-195, mir-26a, mir-20, mir-
128b, mir-217 and
mir-219 showed altered expression as compared to normal samples in the 5386T,
12595T, 14292T,
24
CA 02585525 2007-04-26
WO 2005/103298 PCT/US2005/013247
11793T and 17054T breast cancer samples. For example, mir-142-3p showed
increased expression
in the above breast cancer samples, while mir-219 showed decreased expression
in the above breast
cancer samples. In contrast, mir-17-5p, mir-16, mir-126, mir-141, mir-142-3p,
mir-143, mir-193,
mir-199a, mir-29a, mir-195, mir-26a, mir-20, mir-128b, mir-217 and mir-219
essentially mirrored
the miRNA profile of the normal breast tissue samples in the 5387T, 17260T,
and 4591T breast
cancer samples.
This data suggests that a breast cancer miRNA signature comprises at least mir-
107, mir-
15b and mir-103. Other miRNA species may be included in the breast cancer
miRNA signature as
indicated in Tables 9 and 10 and FIGS. 2 and 3. The differences observed in
the remaining
miRNA species may be due to differences in the state of progression of the
breast cancer from
which the sample was taken or due to other molecular differences. The
differences in expression
patterns may be a useful diagnostic tool for sub-classification of breast
cancer patients, since the
miRNA profiles fell into two distinct groups. The miRNA profiles for samples
11793T, 12595T,
14292T, and 17054T are similar to that of the 5386T, while the miRNA profiles
for samples
5387T, 17260T, and 4591T are similar to that of the 31828T.
The present example demonstrates that using the ncRNA detection methods
disclosed,
ncRNA profiles (in this case miRNA) can be generated and that the ncRNA
profiles may be used to
create a ncRNA signature for a particular disease or condition (in this case,
breast cancer). In
addition, the ncRNA signature can sub-classify breast cancer samples based on
the expression
profile of the ncRNA species (in this case miRNA) as shown in FIG. 3. A
patient ncRNA profile
may be obtained as described and compared to the ncRNA signature for the
disease in order to
diagnose said patient with a disease or condition, or at risk for said disease
or condition. Each
ncRNA in the ncRNA signature is examined against the patient ncRNA profile to
make the
diagnosis. The diagnosis may be made by comparing the ncRNA levels in the
patient profile
against the ncRNA levels in the ncRNA signature. Therefore, it can be
determined if each ncRNA
value suggests a diagnosis or whether one or more of such ncRNA value suggests
a diagnosis.
This determination can be made by a visual analysis of the data, applying a
cut-off/threshold value
for each ncRNA or through the use of statistical models (such as but not
limited to the model
described in Example 6 below).
Example 5- Generation of a ncRNA Signature for Glioma
This example illustrates an example of a ncRNA signature generated for glioma
where the
ncRNA is a miRNA. In this example, RNA samples were obtained from a series of
glioma cell
lines and a normal neuronal cell line. RNA extracted was accomplished using
standard
methodology. The glioma cell lines used were LN-215, LN-340, U343MG, U373MG,
LN401,
LN405, LN464 and U87MG. These cell lines are described in Ishii et al (Brain
Pathol. 9:469-479,
CA 02585525 2007-04-26
WO 2005/103298 PCT/US2005/013247
1999). In addition, a normal neuronal cell line, designated HA, served as a
baseline for miRNA
expression. The miRNA detection methods described in Example 4 were used in
this example.
miRNA profiles were obtained from RNA samples from each of the cell lines
discussed
above. The data from the miRNA profile analysis was analyzed. A subset of the
114 target
miRNA molecules was identified for further analysis. The raw data for these
miRNA species is
shown in Table 11 (with data expressed as mean fluorescent intensity, MFI). As
can be seen in
Table 11, several miRNA species showed differential expression between the
normal neuronal cell
line and the glioma cell lines. In addition, several miRNA species showed
relatively constant
expression between the normal neuronal cell line and the glioma cell lines.
These miRNA species
can be used as internal references or internal controls to normalize the data
if desired. Table 12
shows the data normalized to the mir-130a miRNA. To obtain the normalized
reading, the MFI for
each miRNA detected was divided by corresponding mir-130a MFI value. Although
not required,
the use of an internal reference allows differences between samples to be
accounted for.
In Tables 11 and 12, the rows designate the miRNA target detected and the
columns
designate the RNA sample being analyzed. Neg represents a negative control
where no sample
RNA was added and Pos indicates a positive control (Table 11). As can be seen
from Tables 11 and
12, the following target miRNA molecules showed altered expression between the
normal neuronal
cell line and the glioma cell lines: mir-141, mir-143, mir-23b, mir-15b, mir-
293, mir-17-p3 and
mir-320. The expression of mir-17-5p, mir214 and mirl30a remained essentially
constant between
the normal neuronal cell line and the glioma cell lines.
FIGS. 4 and 5 show the graphical representations of the miRNA profiles for the
cell lines
examined in this example. FIG. 4 shows the data plotted as a function of MFI
(y axis), while FIG.
5 shows the same data plotted using MFI values normalized to the MFI value of
mir-130a (y axis).
The x axis of both figures represents the miRNA species being detected. As can
be seen, mir-141,
mir-143, mir-23b, mir-15b, mir-293, mir-17-p3 and mir-320 showed altered (both
increased and
decreased) expression in essentially all of the glioma cell lines as compared
to normal neuronal
sample.
This data suggests that a glioma miRNA signature comprises at least mir-141,
mir-23b, mir-
293, mir-17-3p and mir-320. Other miRNA species may be included in the breast
cancer miRNA
signature as indicated in Tables 11 and 12 and FIGS. 4 and 5. The differences
observed in the
remaining miRNA species (such as mir-143 and mir-15b) may be due to
differences in the state of
progression of the breast cancer from which the sample was taken or due to
other molecular
differences.
26
CA 02585525 2007-04-26
WO 2005/103298 PCT/US2005/013247
The present example demonstrates that using the neRNA detection methods
disclosed,
ncRNA profiles (in this case miRNA) can be generated and that the ncRNA
profiles may be used to
create a neRNA signature for a particular disease or condition (in this case,
glioma).
Example 6- Statistical Methods for ncRNA Signatures
In order to utilize the power of the ncRNA signatures described herein, a
statistical
approach may be applied to the data generated. A number of statistical
approaches may be
used. In one embodiment, a likelihood ratio is used to describe the ncRNA
signature for a
given disease or condition and/or to classify a subject as having/susceptible
to or not
having/not susceptible to the disease or condition. In this approach, the
assumption is made
that the population distribution of the miRNA level is approximate to a
Gaussian
distribution function. In calculating likelihood ratios, the Gaussian 'height'
is used instead
of the probability:
f(X)...~..
In equation 1, f(x) is the Gaussian height for the applied parameter x (x may
be a normal or
abnormal population); is the population mean for parameter x and a is the
population
standard deviation. Equation 1 can be examined in three parts. On the left
hand side of the
equation the expression 1/(BNP7r) controls the maximum height of the Gaussian
peak. The
central portion involving 'e' converts the output of the third section of the
equation into the
correctly shaped envelope. The final section calculates a standard deviation
defining how
far from the centre of the population distribution, the value x lies. This
value is also known
as the "Mahalanobis distance".
The Gaussian heights for each signature miRNAs are deternlined for 'normal'
and
'abnormal' parameters (see graph below). Note that 1 and 2 are the
population specific
mean. The l value is used to calculate the Gaussian height of a miRNA level
for the
normal population, and the 2 value is used to calculate the Gaussian height
of a miRNA
level in the abnormal population.
27
CA 02585525 2007-04-26
WO 2005/103298 PCT/US2005/013247
N,
Distribution of A2 Distribution of
Normal Group Abnormal Group
N2
p, P Z [Analyte]
The graph above shows two scenarios: In case 1, the ratio of the height on the
'normal' curve and the height on the 'abnormal' curve (Nt /At) is
approximately 4; for case
two (N2 /A2) the ratio is approximately 0.25. In another words, if the miRNA
level
measured from a patient is close to the "normal" mean, it is most likely that
the patient is
normal (not characterized as having a given disease or condition); if,
however, the miRNA
level is close to the mean of the "abnormal" population, then, the subject is
most likely
abnormal (characterized as having or sat risk for the disease or condition).
Therefore, the
likelihood ratio indicates the probability that a given subject is suffering
from or at risk for
a given disease or condition based on the levels of certain ncRNA molecules
identified in
the subjects profile.
One advantage of using Gaussian heights is the capability of combining the
predictive power of multiple, independent miRNAs levels obtained in the
profile of a
subject. The combined likelihood, or probability, that a subject is suffering
from or at risk
for a disease or condition can be calculated using equation (2). In Equation
(2), LRt
represents the summed Gaussian height for the abnormal population and LRn
represents the
summed Gaussian height for the normal population
Probability = (LRt)/(LRt+LRn) 2
where LRt=LR1t*LR2t*LR3t...LRnt, and LRn=LRIn*LR2n*LR3n...LRnn.
In order to demonstrate the application of this statistical approach, the
normalized
data obtained for mir-130a, mir-107, mir-15b and mir-103 as described in
Example 4 (Table
10) is used. From the normalized data, the means and standard deviation values
for the
cancer and normal samples (the populations) are determined. In this example,
the standard
deviation for the normal samples was set to 0.2000. The Gaussian height values
for mir-
107, mir-15b, and mir-103 are calculated for each of the samples. First, the
mean and
standard deviation values for the normal samples are used to obtain the
"normal" Gaussian
heights; then, the mean and standard deviation values for the breast cancer
samples to
obtain the "abnormal" Gaussian heights. The likelihood ratio is generated as
the ratio
between the GH-Abnormal and GH-Normal. Once the individual likelihood ratios
are
28
CA 02585525 2007-04-26
WO 2005/103298 PCT/US2005/013247
established, a combined risk factor or probability factor (indicative of
whether an individual
is suffering from or at risk for a disease/condition) is determined by
multiplying the
individual likelihood ratios determined for each miRNA species in a subjects
profile. The
calculations described above are shown in Table 13.
Example 7- Determination of Potential Therapeutic Targets Identified by ncRNA
Profiling
As described above, the detection methods disclosed may be used to identify
potential drug
targets for the treatment of a disease or condition. ncRNA signatures for a
particular disease or
condition may be created. By determining the identity of the ncRNA species
that characterize a
particular disease or condition, the identity of molecular targets involved in
the molecular pathways
responsible for the disease state or condition may be identified. For example,
miRNA molecules
have been known to regulate gene expression by either degrading mRNA for a
protein and/or
interfering with the transcription of a protein. These molecular targets may
provide novel
therapeutic candidates for drug development for the treatment and/or
prevention of the disease or
condition. In such a method, the ncRNA signature for a disease or condition is
obtained as
described above. The ncRNA molecules that characterize the disease or
condition are noted. The
identity of the ncRNA molecules is used to determine the molecular targets
involved in the
molecular pathways of the disease or condition. In a specific embodiment, the
ncRNA is a
miRNA.
A computer program may be used to compare the sequence of one or more ncRNA
molecules in the ncRNA signature to commercially available or proprietary
databases containing
genomics information to identify targets to which a ncRNA molecule may bind.
Such a target is a
potential therapeutic candidate for drug development. Any program/software
capable of
performing the comparison may be used. In this example, a publicly available
algorithm was used
to carry out the comparison (Enright et al. PLoS Biol 2(11): e363)
In order to demonstrate the application of this method, the normalized data
obtained for
mir-107, mir-15b and mir-103 as described in Example 4 (Tables 9 andl0 and
FIGS. 2 and 3) is
used. Example 4 identified mir-107, mir-15b and mir-103 as comprising a miRNA
signature for
breast cancer. The sequences of these miRNA molecules were queried against a
genomic database
containing nucleic acid sequence information to identify targets containing
sequences to which the
identified miRNA molecule might bind. A number of potential targets were
identified as listed in
Table 14. It should be noted that Table 14 is a partial list of candidate
therapeutic targets.
As can be seen from Table 14, certain proteins are identified as candidate
therapeutic
targets for each of mir- 107, mir-15b and mir- 103 (such as TAR DNA-binding
protein 43), while
other proteins are identified as candidate therapeutic targets for a subset of
these miRNA molecules
(for example, MAP-lA is identified by mir-103 and mir-107, bi:tt not by mir-
15b). The
29
CA 02585525 2007-04-26
WO 2005/103298 PCT/US2005/013247
identification of target by utilization of this approach can yield insight
into targets involved in the
molecular mechanism of the disease or condition and can provide novel
candidates for drug
development.
DEMANDE OU BREVET VOLUMINEUX
LA PRESENTE PARTIE DE CETTE DEMANDE OU CE BREVET COMPREND
PLUS D'UN TOME.
CECI EST LE TOME 1 DE 2
CONTENANT LES PAGES 1 A 30
NOTE : Pour les tomes additionels, veuillez contacter le Bureau canadien des
brevets
JUMBO APPLICATIONS/PATENTS
THIS SECTION OF THE APPLICATION/PATENT CONTAINS MORE THAN ONE
VOLUME
THIS IS VOLUME 1 OF 2
CONTAINING PAGES 1 TO 30
NOTE: For additional volumes, please contact the Canadian Patent Office
NOM DU FICHIER / FILE NAME:
NOTE POUR LE TOME / VOLUME NOTE: