Note: Descriptions are shown in the official language in which they were submitted.
CA 02589247 2007-05-25
WO 2006/058878 PCT/EP2005/056299
AGING BIOMARKER
The present invention relates to a marker that can be used as aging biomarker.
More
specifically, the present invention relates to the analysis of N-glycans in
serum and its relation
to the virtual age of the subject. This aging biomarker can be used to study
the effect of
medication, food compounds and/or special diets on the wellness and virtual
age of animals,
including humans.
Aging, a process involving multiple genes acting through complex pathways, is
not yet fully
understood in molecular and cellular terms. In humans, the aging process seems
to be
primarily under genetic control, and age-dependent diseases develop on this
background as a
consequence of other factors. Due to the rapidly increasing number of elderly
people in many
countries, there is a need for innovative treatments for age-related diseases.
However,
considering the low number of aging-related genes identified, a widely
accepted model of aging
has yet to be established. Therefore, in addition to studying aging
mechanisms, the
identification of candidate aging biomarkers to measure age-related changes
may be of great
value not only to gerontologists, but also to people in general, by preventing
aging-related
diseases through development of anti-aging medicines.
It is well known that the N-linked oligosaccharides of glycoproteins play
important biological
roles by influencing the functions of glycoproteins. They are important to
initiation of various
cellular recognition signals that are essential for the maintenance of the
ordered social life of
each cell within a multi-cellular organism. The sugar chains have
characteristic features based
on the structural multiplicity formed from a limited number of saccharide
units. Although many
studies reported the importance of the structural changes of glycans during
development, little
information is available on the changes in glycans during aging. Because the
biosynthesis of
glycans is not controlled by interaction with a template but depends on the
concerted action of
glycosyltransferases, the structures of glycans are much more variable than
those of proteins
and nucleic acids. Therefore, the structures of glycans can be easily altered
by the
physiological conditions of the cells. Accordingly, age-related alterations of
the glycans are
relevant to the understanding of the physiological changes found in aged
individuals. It is
important to determine the molecular events that occur in glycoconjugates
during aging.
Determination of the changes in the concentrations of N-glycan is fundamental
to the discovery
of valid biomarkers associated with biological processes such as aging and age-
related
diseases. Indeed, Robinson et al. (2003) disclosed a differential protein
expression and
glycosylation pattern in membrane proteins from premature aging Hutchinson-
Gilford progeria
syndrome fibroblasts. Shikata et al. (1998) showed that the N-glycosylation of
IgG is age
related, but only in female IgG samples. Notwithstanding these findings, there
is still a need for
1
CA 02589247 2007-05-25
WO 2006/058878 PCT/EP2005/056299
a reliable and simple biomarker that can be used to evaluate aging, and the
effect of diseases
or compounds on the virtual age of a subject.
Surprisingly, we found that the serum concentrations of N-linked sugar
structures changes
during aging in human, mouse and rat and that N-glycan profiling could be used
as an aging
biomarker to predict the condition of human and animal health. These changes
of N-linked
sugar structures in serum are independent from the changes induced by IgG.
A first aspect of the invention is the use of the serum N-glycan profile as a
biomarker for aging.
In the general population the N-glycan profiles of serum samples with and
without IgG evolve
in a similar way. However, as it is known that the N-glycan profile of IgG is
affected by
diseases such as rheumatoid arthritis (Axford et al., 1992; Gornik et al.,
1999). Therefore, in
some cases, analysis of serum after removal of the IgG fraction may be
preferred.
In this invention, we demonstrated that the serum N-glycan profile is species
dependent, with
age related peaks that are specific for a defined species. Therefore, another
aspect of the
invention is the use of agalacto N-glycans (peak 1: agalacto, core-a-1,6-
fucosylated
biantennary and 2: bisected, agalacto, core-a-1,6-fucosylated biantennary) and
galactosylated,
fucosylated biantennary N-glycan (peak 6: bigalacto, core-a-1,6-fucosylated
biantennary) as
biomarker for aging in human
Still another aspect of the invention is the use of serum N-glycan profile to
test the effect of
medication, food and/or diet on the virtual age of animals. Indeed, the N-
glycan profile may be
especially interesting to test the effect of dietary compounds and/or
medication on the global
health condition of an animal, including humans. The global health condition
can be described
then as a virtual age, as defined below. In a similar way, the N-glycan
profile can be used to
test the effect of chemical compounds on the global health conditions.
Chemical compounds to
be tested may be, as a non-limiting example, compounds that may be released in
the
environment, either deliberately, such as insecticides, fungicides or
herbicides, or indirectly,
such as solvents used in paintings.
Another aspect of the invention is a method for determining the virtual age of
an animal,
comprising a) obtaining a serum sample of said animal b) releasing the N-
glycan fraction from
the glycoproteins c) analyzing the N-glycan pattern and d) determining the
virtual age
according to selected N-glycans representative for the virtual age of the
species. Preferably,
the release of the N-glycan fraction is realized by a sialidase treatment and
N-glycan samples
are analysed using a DNA-sequencer.
DEFINITIONS
Aging as used here doesn't refer to the real age, but to the condition of the
human of animal
tested, and therefore the aging biomarker refers to a virtual age.
2
CA 02589247 2007-05-25
WO 2006/058878 PCT/EP2005/056299
Virtual age: The virtual age of an animal (including humans) after a treatment
is determined by
comparing the N-glycan profile of the treated animal with a non-treated
control group. As N-
glycan profiles differ from species to species, representative age related
peaks are defined for
the animal species tested. For humans, age related peaks are the agalactoside
N-glycans
(peak 1 and 2) and the galactosylated, fucosylated biantennary fraction (peak
6). Using the
age calibration curve of the representative peak or peaks of the non-treated
animal, the virtual
age of the treated animal can be determined.
Treatment as used here can be any treatment influencing age, such as, but not
limited to,
treatment with a chemical compound, influence of medication, food and/or diet.
Supplying the
compound or the medication can be in any way, including but not limited to
oral supply, supply
by inhalation, supply by injection or application on the skin.
BRIEF DESCRIPTION OF THE FIGURES
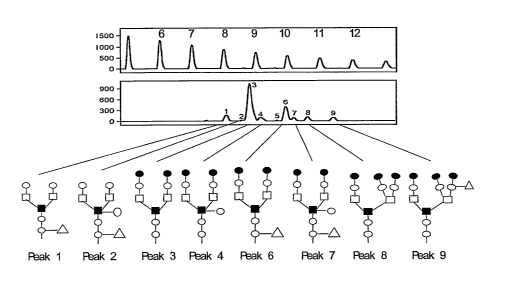
Figure 1: N-glycan profile from total human serum. Nine peaks are clearly
visible in the full
detected range. The structure of the compounds represented by the peaks is
indicated. Peak
1: agalacto, core-a-1,6-fucosylated biantennary; Peak 2: bisected, agalacto,
core-a-1,6-
fucosylated biantennary; Peak 3: bi-R-1,4-galacto, core-a-1,6-fucosylated
biantennary; Peak 4:
bisected bi-R-1,4-galacto, biantennary; Peak 6: bi-R-1,4-galacto, core-a-1,6-
fucosylated
biantennary; Peak 7: bisected, bi-R-1,4-galacto, core-a-1,6-fucosylated
biantennary; Peak 8:
tri-R-1,4-galacto, 2,4-branched triantennary; Peak 9: trigalactos, branched
fucosylated
triantennary.
=: P-linked galactose; o: P-linked GIcNAc; ~: a-linked mannose; ~: P-linked
mannose;
A: a-1,6-linked fucose
Figure 2: Evolution of the N-glycan peaks in human serum in function of the
age. The results
are separately shown for male and subjects. Individual points are indicated,
as well as the
general trend.
Figure 3: The sum of the evolution of the N-glycan peaks in human serum in
function of the
age. A: total agalactosylated N-glycan: B: total bisecting N-glycan. C: total
core fucosylated N-
glycan. D: sum of Peak 1 and Peak 2.
Figure 4: N-glycan profile from serum without IgG and from IgG, indicating a
different profile.
Maltooligosaccharide reference (top), electropherogram of desialylated N-
glycan derived from
proteins in the serum without IgG (middle) and in the IgG (bottom).
Figure 5: Evolution of the N-glycan peaks in human serum without IgG and from
IgG in
function of the age.
3
CA 02589247 2007-05-25
WO 2006/058878 PCT/EP2005/056299
Figure 6: Evolution of the N-glycan peaks in isolated IgG from humans in
function of the age
for rheumatoid arthritis patients (RA), Werner syndrome patients (WRN) and a
male control
group (CON). The line indicates the evolution in the control group.
Figure 7: Evolution of the N-glycan peaks in human serum in function of the
age for
rheumatoid arthritis patients (RA), Werner syndrome patients (WRN) and a male
control group
(CON)
Figure 8: Comparison between the N-glycan analysis of peak 5 and peak 6 of RA
patients,
WRN and male control. N-glycan analysis and ROC curve in total serum (left)
and IgG (right).
Figure 9: Comparison N-glycan profile in serum among human, rat and mouse,
indicating a
species-specific N-glycan profiling pattern. The peak number corresponds to
the number of N-
glycan from human serum. The mice-specific N-glycan peaks are indicated as mP2
and mP8,
whereas the rat-specific are rP2, rP4 and rP10.
Figure 10: Evolution of the N-glycan peaks in CR mice serum in function of the
age.
Figure 11: Evolution of the N-glycan peaks in CR rat serum in function of the
age.
Figure 12: N-glycan profile from rat sera treated with CCI4 and co-treated
with InterFeron-y.
Figure 13: Biochemical assay in serum from CCI4 exposed rat and InterFeron-y
coeffect.
EXAMPLES
Materials and Methods
Human sera samples
Healthy control samples were obtained from the Transfusion Center of the Red
Cross in
Ghent, Belgium, in accordance with Red Cross health standards (Negative for RA
and WRN).
A total of 100 blood samples were obtained from 10 female and 10 male donors
for each age
group (20, 30, 40, 50, 60 years).
Rheumatoid arthritis patients
Sera were obtained from 14 female patients (32 to 72 years) and 6 male
patients (30 to 67
years) (see Table 1) with rheumatoid arthritis. All patients had been
diagnosed by specialized
clinicians in the Rheumatology Department of the University Hospital, Ghent.
Wemer syndrome
One serum sample from a 45 year old male with Werner syndrome was provided by
Prof.
Antonio Federico (Universita degii Studi di Siena, Siena, Italy).
Animals and blood sampling
Female C57BL/6 mice were obtained from Iffa-Credo (Saint Germain-sur-
I'Arbresle, France) at
the age of 8-10 weeks. Hsp70.1-1- mice were bred as homozygotes in our
facilities (Van Molle
4
CA 02589247 2007-05-25
WO 2006/058878 PCT/EP2005/056299
et al., 2002). Mice were kept in a temperature-controlled, air-conditioned
animal house with 14-
h light/dark cycles; they received food and water ad libitum.
Blood samples were obtained from the mice repeatedly at different ages. About
50-100 NI were
obtained from each mouse from the retro-orbital plexus (behind the eye) with a
capillary. The
5 blood samples were left to clot for 30 min at 37 C, placed at 4 C for at
least 1 h, and then
centrifuged for 10 min at maximum speed. The sera were removed and stored at -
20 C.
Caloric restrict animals
Sera from mice and rats fed al libitum (AL) and a food restricted diet (CR)
were purchased
10 from the National Institution on Aging (NIA) (MD, USA). Sera from male
BALB/c/AL and
BALB/c/CR were obtained at age 12, 20, and 24 months, whereas sera from male
F344/AL
and F344/CR at age 18, 24, and 28 months. The animals fed ad libitum had free
access to the
diet (NIH-31; Purina Mill, Inc., Richmond, IN). The food restrict animals
(CRs) were fed a
special NIH-31 fortified formula, which was enriched with vitamins but 40%
less calories as
compared with the animal fed al libitum (Guo et al., 2002).
Purification of immunoglobulin from serum
The immunoglobulins were purified with the kit of ImmunoPure Immobilized
Protein L (Pierce)
by following the protocol supplement by the producer with slightly
modification. A mixture of 10
l of serum, 40 l of Protein L and 130 l of PBS was loaded on the membrane of
Multiscreen-
HV 96-well plate. Then washed eight times with 300 l of PBS. The antibodies
were eluted two
times with 100 l of 0.1 M glycine PH2 and were used for N-glycan analysis.
N-glycan analysis using DNA-sequencer
Processing of protein N-glycan samples had been described previously
(Callewaert et al.,
2001).
The glycoproteins were denatured by addition of at least 2 volumes RCM buffer
(8 M urea, 360
mM Tris, pH 8.6, 3.2 mM EDTA) to each sample in a final volume of at least 50
l, and the
samples were then placed at 50 C for 1 h. The N-linked glycans present on the
serum proteins
in 5 l of serum were released after binding the protein to an Immobilon P-
lined 96-well plate.
They were then derivatized with APTS (Molecular Probes, Eugene, CA, USA) and
analyzed on
an ABI 377A DNA sequencer (Applied Biosystems).
Data analysis
Data analysis was performed using the Genescan 3.1.2 software (Applied
Biosystems, Foster
City, CA, USA). We used the same fluorescence-overlap correction matrix that
was used for
5
CA 02589247 2007-05-25
WO 2006/058878 PCT/EP2005/056299
DNA sequencing using BigDye dye terminators on our machine. Quantification
analysis was
carried out using SPSS 11.0 software.
Example 1: Glycomic serum profile from human sera
This study used 100 human serum samples from five age groups (20, 30, 40, 50
and 60
years). Each age group consisted of 10 males and 10 females. N-glycan proteins
were isolated
and purified. The samples were digested with sialidase, and the N-glycan
profiles of the
different age and sex groups were analyzed by DSA-FACE. Quantification of the
N-glycans
was represented as peak heights of the 9 peaks (Fig. 1) that had been verified
previously
(Callewaert et aL, 2004). The data were analyzed statistically by median and
inter-quartile
ranges for the 9 peaks over the 5 groups. The sizes of the peaks, representing
the
concentrations of the oligosaccharide structures, were examined statistically
for evidence of
correlation between N-glycans and aging. As shown in Fig. 2, the trend was for
P1 and P2 to
increase gradually with age, and for P6 to decrease. These three variables
could be used as
aging biomarkers to evaluate the state of health.
To investigate the characteristics of a variable composed of the heights of
peaks P1, P2, P6
and P7 for core fucose, of peaks P1 and P2 for agalactose, and P2 and P7 for
bisecting
GIcNAc residue, the peak heights were added (Figure 3). The mean level of
agalactosylated
biantennary (P1 plus P2) and bisected GIcNAc residue was significantly
increased (Fig. 3A, B),
whereas the mean extent of core fucosylation remained unaltered (Fig. 3C).
Moreover, the
increased bisecting biantennary (P2 +P4+P7) (Fig. 3C) was due to the Peak 2,
as Peak 4 and
7 remained constant (Fig. 2).
Peak 1 is the biantennary, agalacto, core-a-1,6-fucosylated glycan. Its
upregulation reflects of
decreased galactosylated core-a-1,6-fucosylated biantennary (P6) as showed in
Figure 3D.
Peak 2 represents the bisected, agalacto core-a-1,6-fucosylated structure. The
increase of
Peak 2 is a combination of undergalactosylation and increased bisected
biantennary of the
serum glycoproteins.
Example 2: N-glycan progling of human antibodies
Glycan proteins are key components of the immune system effectors. The sugar
structures
attached to immunoglobulins are important in the synthesis, stability,
recognition and
regulation of these proteins, and in many of their diverse interactions. To
evaluate changes in
the concentration of N-glycans during the aging process, we examined the N-
glycan profiles of
immunoglobulin, and of serum depleted of immunoglobulin. The antibodies were
purified using
Protein L agarose, which binds Ig (see M&M). N-glycan profiling was performed
by DSA-FACE
and shown in Fig. 4. Although N-glycan profiles are tissue specific, the seven
sugar structures
were present in both serum and immunoglobulin. In agreement with previous
reports, the
6
CA 02589247 2007-05-25
WO 2006/058878 PCT/EP2005/056299
major N-glycan structure attached to antibodies is fucosylated bi-
galactosylated biantennary
(P6), whereas bi-galactosylated biantennary (P3) is most abundant in total
serum (Fig. 1 and
4). As shown in Figure 5, the sizes of the peaks in total serum and in serum
without antibodies
were similar. This indicates that the relative concentration of sugar
structures in the total serum
is not altered by that of the antibodies. Interestingly, the glycan profile of
antibodies was similar
to that of total serum in displaying increases in P1 and P2 and a decrease in
P6. In addition,
the decrease abundance of P3 was evidenced only in the IgG but not in the
total serum or
serum without IgG (Fig. 6).
Example 3: N-glycan progling in Rheumatoid Arthritis (RA) patients
Inflammation is a response of living tissue to mechanical, chemical or
immunological
challenge. Normal aging often results in the excessive production of
autoimmune factors that
destroy joint cartilage and other tissues in the body. Rheumatoid arthritis
(RA) is an age-
related disease that affects about 1% of the population worldwide.
Abnormalities of both
humoral and cellular immunity have been implicated in initiating and
maintaining the chronicity
of inflammation in this disease. Glycosylation changes, especially increased
nongalactosylation and reduced a-1,6-linked core fucose on IgG, have been well
documented
in RA (Axford et aL, 1992; Gornik et aL, 1999). The finding of interesting
changes in the
glycosylation states of serum IgG of patients with RA led to a heightened
interest that
generated an enormous volume of data suggesting that RA may be a dysregulated
glycosylation disease. To provide new insights into RA pathogenesis, we
analyzed the N-
glycan profiles of 20 RA patients, and compared them to reference profiles
from healthy blood
donors. As shown in Fig. 7, the concentrations of the sugar structures P5 and
P6 are
dramatically changed; the former is increased whereas the latter is decreased
compared to
healthy controls. The other peaks were similar to those in age-matched healthy
controls. In the
antibody fraction, however, a greater degree of alteration in the structure of
sugars in RA
disease was evidenced by decreases of P3, P4, P5 and P6, and an increase of P7
(Fig. 6).
The means of variables P5 and P6 in RA cases were clearly different from those
in controls,
indicating a significant influence of RA on N-glycan parameters in total serum
and IgG. These
differences were evaluated by non-parametric Receiver Operating Curve (ROC)
analysis. The
result of ROC analysis indicates a classification efficiency, as measured by
the Area Under the
Curve (AUC), of 0.086 for P5 and 0.163 for P6 in the antibodies, and 0.911 for
P5 and 0.160
for P6 in total serum (Fig. 8).
Example 4: N-glycan progling in Werner syndrome (WRN) patients
Werner syndrome is an inherited disease characterized by the premature
appearance of
features of normal aging in young adults. The molecular role of WRN therefore
remains to be
7
CA 02589247 2007-05-25
WO 2006/058878 PCT/EP2005/056299
proven, as does any role it might have in the aging process in general. To
evaluate the
relationship between Werner syndrome and aging, and to evaluate our aging
biomarker, we
analyzed the N-glycan profile from one WRN patient and compared it to those of
the control
groups. N-glycan profiling was perfumed on immunoglobulin (Fig. 6) and total
serum (Fig. 7).
As expected, the concentrations of several sugars in the patient were
dramatically altered
compared to age-matched controls, to an extent even greater than that in the
old age group in
this study (age 60 year). In total serum, P1, P2, P4 and P5 were increased,
whereas P3 and
P6 were decreased (Fig. 7). However, P1, P2, P3 and P6 in immunoglobulin and
in serum
displayed the same patterns of change (Fig. 6 and 7). The change in
immunoglobulin P4 was
opposite to that seen in serum, but P5 was not altered. The changes observed
in several
peaks in WRN are consistent with those seen in the RA samples, indicating the
value of N-
glycan profiling as a general aging biomarker.
Example 5: effect of calorie restriction on the serum N-glycan progle in mice
and rats
Numerous studies have established that caloric restriction (CR) is the most
effective
mechanism to lengthen life and to delay the onset of various age-related
diseases in rodents
by applying calorie restriction (CR) at 30-50% below ad libitum levels (Ingram
et aL, 2004; Cui
et aL, 2004). The basic mechanisms by which CR extends longevity and reduces
susceptibility
to diseases are not yet fully understood. In order to text biomarker of aging,
the sera from mice
and rats fed al libitum (AL) and a food restricted diet (CR) were analysis for
N-glycan profiling.
Several sugar structures were found different from human and marked as either
mice-specific
or rat-specific peak (such as mP2 and mP8 in mice; rP2, rP4, rP8 and rPlO in
rat), though they
need further verified (Fig. 9). This observation is in agreement with the
knowledge that N-
linked sugar structures are species dependent. The N-glycan profile analyses
were showed in
Figure 10 for CR mice and Figure 11 for CR rat. We found that the trends of
several peaks
from CR animals differ or apart from AL animals. Moreover, the change of N-
glycan
concentration is also species-specific.
Example 6: effect of CCl4 treatment on the serum N-glycan progle of rats
The repeated administration of CCI4 is widely employed as an animal model of
human hepatic
fibrosis/cirrhosis. In order to evaluate whether the sugar marker has high
predictive values for
the liver damage, we tested N-glycan profiling on the CCI4 treated, co-treated
with INF-y and
control rat groups (Wistar). Take into account that N-glycosylation in animals
is species-
specific, we therefore profiled the N-linked glycan to get a fingerprinting in
rat serum. A
desialylated N-glycan profile on rats showed at least 10 major peaks (Fig. 9).
N-glycan peaks
of P1, P3, P5, P6, P7, P9 are consistent with that of human. However, four
peaks (rP2, rP4,
rP8 and rP10) are rat-specific N-linked sugars.
8
CA 02589247 2007-05-25
WO 2006/058878 PCT/EP2005/056299
As shown in Figure 12, six peaks reveled the changes of the trends either
increased or
decreased in the CCI4 treated rat group compare to the control group. The INF-
y group
showed less slop changes than CCI4-group, indicating a protection of liver
damage. The P7,
rP8, P9 and rPlO in the CCI4 and INF groups revealed low fluorescence
intensity and they
consistent with control group.
Moreover, the rat serum alanine aminotransferase activity (ALAT), aspartate
aminotransferase
activity (ASAT) and total bilirubin concentration (TBiI) were analysed using
routine photometric
tests on a Hitachi 747 analyser (Boehringer Mannheim GmbH, Diagnostica) for
subsequent
assessment of hepatic injury and liver function, respectively. Surprisingly,
the levels of liver
enzymes ALAT, ASAT and bilirubin were significantly raised at Week 12 after
administration of
CCI4 (Fig. 13). It also showed that the liver damage causing by CCL4 treatment
was partially
protected by the dose of INF-y, as indicated decreasing levels of bilirubin,
ALAT and ASAT at
Week12.
Taken together, N-glycan profile between CCI4 group and control group showed
different
trends at stage Week 9, some peaks (P4 and P5) even in Week 6, whereas the
biochemical
test only revealed liver damage caused by CCI4 at a relatively later stage,
Week 12. This result
demonstrates more sensitivity of N-glycan test for cell cytotoxicity and liver
damage than the
biochemical test.
9
CA 02589247 2007-05-25
WO 2006/058878 PCT/EP2005/056299
TABLES
Table 1:
id sex age RF
Ra 146 v 72 n
Ra 248 v 32 n
Ra 212 m 30 n
Ra 226 v 51 n
Ra 58 v 35 n
Ra 61 v 57 p
Ra 99 m 67 p
Ra 117 v 48 p
Ra 85 v 62 p
Ra 147 n 48 p
Ra 222 v 58 p
Ra 105 v 63 p
Ra 13 v 63 p
Ra 3 m 51 p
Ra 36 m 57 p
Ra37 v 41 p
Ra 365 m 60 p
Ra 325 v 68 p
Ra 184 v 64 p
Ra 53 v 46 p
RF: Rheumatoid factor.
RA patients provided by Dr. F. De Keyser, Afdeling Reumatologie, UZ
CA 02589247 2007-05-25
WO 2006/058878 PCT/EP2005/056299
REFERENCES
- Axford JS, Sumar N, Alavi A, Isenberg DA, Young A, Bodman KB, Roitt IM:
Changes in
normal glycosylation mechanisms in autoimmune rheumatic disease. J Clin Invest
1992;89:1021-1031.
- Callewaert N, Geysens S, Molemans F, Contreras R: Ultrasensitive profiling
and
sequencing of N-linked oligosaccharides using standard DNA-sequencing
equipment.
Glycobiology 2001;11:275-281.
- Cui Z, Willingham MC: The effect of aging on cellular immunity against
cancer in
SR/CR mice. Cancer Immunol Immunother 2004;53:473-478
- Guo Z, Mitchell-Raymundo F, Yang H, Ikeno Y, Nelson J, Diaz V, Richardson A,
Reddick R: Dietary restriction reduces atherosclerosis and oxidative stress in
the aorta
of apolipoprotein E-deficient mice. Mech Ageing Dev 2002;123:1121-1131
- Ingram DK, Anson RM, de Cabo R, Mamczarz J, Zhu M, Mattison J, Lane MA, Roth
GS: Development of calorie restriction mimetics as a prolongevity strategy.
Ann N Y
Acad Sci 2004;1019:412-423.
11