Note: Descriptions are shown in the official language in which they were submitted.
DEMANDE OU BREVET VOLUMINEUX
LA PRESENTE PARTIE DE CETTE DEMANDE OU CE BREVET COMPREND
PLUS D'UN TOME.
CECI EST LE TOME 1 DE 2
CONTENANT LES PAGES 1 A 38
NOTE : Pour les tomes additionels, veuillez contacter le Bureau canadien des
brevets
JUMBO APPLICATIONS/PATENTS
THIS SECTION OF THE APPLICATION/PATENT CONTAINS MORE THAN ONE
VOLUME
THIS IS VOLUME 1 OF 2
CONTAINING PAGES 1 TO 38
NOTE: For additional volumes, please contact the Canadian Patent Office
NOM DU FICHIER / FILE NAME:
NOTE POUR LE TOME / VOLUME NOTE:
CA 02589782 2007-05-29
WO 2006/060653 PCT/US2005/043620
1
LUNG CANCER PROGNOSTICS
FIELD OF THE fNVENTION
This invention relates to prognostics for lung cancer based on the gene
expression
profiles of biological samples.
BACKGROUND
Lung cancer is the leading cause of cancer deaths in developed countries
killing
about 1 million people worldwide each year. An estimated 171,900 new cases are
expected in 2003 in the US, accounting for about 13% of all cancer diagnoses.
Non-small cell lung cancer (NSCLC) represents the majority (-75%) of
bronchogenic
carcinomas while the remainder is small cell lung carcinomas (SCLC). NSCLC is
comprised of three main subtypes: 40% adenocarcinoma, 40% squamous, and 20%
large cell cancer. Adenocarcinoma has replaced squamous cell carcinoma as the
most
frequent histological subtype over the last 25 years, peaking the early
1990's. This
may be associated with the use of "low tar" cigarettes resulting in deeper
inhalation of
cigarette smoke. Wingo et al. (1999). The overall 10-year survival rate of
patients
with NSCLC is a dismal 8-10%.
Approximately 25-30% of patients with NSCLC have stage I disease and of these
35-50% will relapse within 5 years after surgical treatment. Depending upon
stage,
adenocarcinoma has a higher relapse rate than squamous cell carcinoma with
approximately 65% and 55% of SCC and adenocarcinoma patients surviving at 5
years, respectively. Mountain et al. (1987). Currently, it is not possible to
identify
those patients with a high risk of relapse. The ability to identify high-risk
patients
among the stage I disease group will allow for the consideration of additional
therapeutic intervention leading to the potential for improved survival.
Indeed, recent
clinical trials have shown that adjuvant therapy following resection of lung
tumors
can lead to improved survival. Kato et al. (2004). Specifically, Kato et al.
demonstrated that adjuvant chemotherapy with uracil-tegafur improves survival
among patients with completely resected pathological stage I adenocarcinoma,
particularly T2 disease.
Microarray gene expression profiling has recently been utilized to define
prognostic signatures in patients with lung adenocarcinomas, (Beer et al.
(2002))
however, no large studies have investigated gene expression profiles of
prognosis in
the squamous cell carcinoma population. Here, we have profiled 134 SCC samples
CA 02589782 2007-05-29
WO 2006/060653 PCT/US2005/043620
2
and 10 normal matched lung samples on the Affymetrix U 133A chip. Hierarchical
clustering and Cox modeling has identified genes that correlate with patient
prognosis. These signatures can be used to identify patients who may benefit
from
adjuvant therapy following initial surgery.
SUMMARY OF THE INVENTION
The present invention provides a method of assessing lung cancer status by
obtaining a biological sample from a lung cancer patient; and measuring
Biomarkers
associated with Marker genes corresponding to those selected from Table 1,
Table 4,
Table 5 or Table 7 where the expression levels of the Marker genes above or
below
pre-determined cut-off levels are indicative of lung cancer status.
The present invention provides a method of staging lung cancer patients by
obtaining a biological sample from a lung cancer patient; and measuring
Biomarkers
associated with Marker genes corresponding to those selected from Table 1,
Table 4,
Table 5 or Table 7 where the expression levels of the Marker genes above or
below
pre-deterinined cut-off levels are indicative of the lung cancer stage.
The present invention provides a method of determining lung cancer patient
treatment protocol by obtaining a biological sample from a lung cancer
patient; and
measuring Biomarkers associated with Marker genes corresponding to those
selected
from Table 1, Table 4, Table 5 or Table 7 where the expression levels of the
Marker
genes above or below pre-determined cut-off levels are sufficiently indicative
of risk
of recurrence to enable a physician to determine the degree and type of
therapy
recommended to prevent recurrence.
The present invention provides a method of treating a lung cancer patient by
obtaining a biological sample from a lung cancer patient; and measuring
Biomarkers
associated with Marlcer genes corresponding to those selected from Table 1,
Table 4,
Table 5 or Table 7 where the expression levels of the Marker genes above or
below
pre-determined cut-off levels are indicate a high risk of recurrence and;
treating the
patient with adjuvant therapy if they are a high risk patient.
The present invention provides a method of determining whether a lung cancer
patient is high or low risk of mortality by obtaining a biological sample from
a lung
cancer patient; and measuring Biomarlcers associated with Marker genes
corresponding to those selected from Table 4 where the expression levels of
the
Marker genes above or below pre-determined cut-off levels are sufficiently
indicative
CA 02589782 2007-05-29
WO 2006/060653 PCT/US2005/043620
3
of risk of mortality to enable a physician to determine the degree and type of
therapy
recommended.
The present invention provides a method of generating a lung cancer prognostic
patient report by determining the results of any one of the methods described
herein
and preparing a report displaying the results and patient reports generated
thereby.
The present invention provides a composition comprising at least one probe set
selected from the group consisting of: Marker genes corresponding to those
selected
from Table 1, Table 4, Table 5 or Table 7.
The present invention provides a kit for conducting an assay to determine lung
cancer prognosis in a biological sample comprising: materials for detecting
isolated
nucleic acid sequences, their complements, or portions thereof of a
combination of
genes selected from the group consisting of Marker genes corresponding to
those
selected from Table 1, Table 4, Table 5 or Table 7.
The present invention provides articles for assessing lung cancer status
comprising: materials for detecting isolated nucleic acid sequences, their
complements, or portions thereof of a combination of genes selected from the
group
consisting of Marker genes corresponding to those selected from Table 1, Table
4,
Table 5 or Table 7.
The present invention provides a microarray or gene chip for performing the
metliod described herein.
The present invention provides a diagnostic/prognostic portfolio comprising
isolated nucleic acid sequences, their complements, or portions thereof of a
combination of genes selected from the group consisting of Marker genes
corresponding to those selected from Table 1, Table 4, Table 5 or Table 7.
BRIEF DESCRIPTION OF THE DRAWINGS
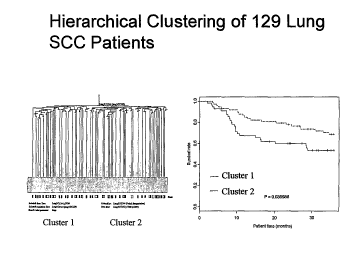
Figure 1 depicts hierarchical clustering of 1291ung SCC patients.
Figure 2 depicts plots of AUC vs. number of genes.
Figure 3 depicts error rates of LOOCV vs various cutoffs in the 65-sample
training set.
Figure 4 depicts Kaplan Meier plots of the 50-gene signature in the testing
set.
Figure 5 depicts unsupervised clustering identifies epidermal differentiation
pathway as being down-regulated in high-risk patients. A. Clustering of
patients
based on top 121 showed two clusters of patients. The majority of genes in
cluster 1
were down-regulated (green). B. List of 20 genes associated with epidermal
CA 02589782 2007-05-29
WO 2006/060653 PCT/US2005/043620
4
differentiation pathway. C. Kaplan Meier curve of clustered patient groups
defined
by the 20 epidermal-related genes.
Figure 6 depicts verification of gene expression data using real-time RT-PCR.
Four genes (NTRK2, FGFR2, VEGF, KRT 13) were selected for RT-PCR.
Expression correlate very well with Affymetrix chip data (R=0.71-0.96).
DETAILED DESCRIPTION OF THE INVENTION
Non-small cell lung cancer (NSCLC) represents the majority (-75%) of lung
carcinomas and is comprised of three main subtypes: 40% squamous, 40%
adenocarcinoma, and 20% large cell cancer. Approximately 25-30% of patients
with
NSCLC have stage I disease and of these 35-50% will relapse within 5 years
after
surgical treatment. Current histopathology and genetic biomarkers are
insufficient for
identifying patients who are at a high risk of relapse. As described in the
present
invention, 129 primary squamous cell lung carcinomas and 10 matched normal
lung
tissues were profiled using the Affymetrix U133A gene chip. Unsupervised
hierarchical clustering identified two clusters of patients with lung
carcinoma that had
no correlation with stage of disease but had significantly different median
overall
survival (p = 0.036). Cox proportional hazard models were then utilized to
identify an
optimal set of 50 genes (Table 1) in a 65 patient training set that
significantly
predicted survival in a 64 patient test set. This signature achieved 52%
specificity and
82% sensitivity and provided an overall predictive value of 71 %. Kaplan-Meier
analysis showed clear significant stratification of high and low risk patients
(p =
0.0075). The identification of prognostic signatures allows identification of
patients
with high-risk squamous cell lung carcinoma who could benefit from adjuvant
therapy following initial surgery.
Table 1
SEQ ID NO: Rank SEQ ID NO: Rank SEQ ID NO: Rank SEQ ID NO: Rank
228 1 18 14 4 27 279 40
284 2 79 15 310 28 280 41
76 3 230 16 42 29 267 42
124 4 416 17 10 30 189 43
281 5 409 18 80 31 103 44
86 6 78 19 12 32 194 45
303 7 420 20 440 33 268 46
311 8 58 21 75 34 252 47
443 9 53 22 60 35 461 48
287 10 254 23 63 36 372 49
13 11 91 24 283 37 414 50
CA 02589782 2007-05-29
WO 2006/060653 PCT/US2005/043620
378 12 271 21 29 31
362 13 446 26 221 39
A Biomarker is any indicia of the level of expression of an indicated Marker
gene.
The indicia can be direct or indirect and measure over- or under-expression of
the
gene given the physiologic parameters and in comparison to an internal
control,
normal tissue or another carcinoma. Biomarkers include, without limitation,
nucleic
5 acids (both over and under-expression and direct and indirect). Using
nucleic acids as
Biomarkers can include any method known in the art including, without
limitation,
measuring DNA amplification, RNA, micro RNA, loss of heterozygosity (LOH),
single nucleotide polymorphisms (SNPs, Brookes (1999)), microsatellite DNA,
DNA
hypo- or hyper-methylation. Using proteins as Biomarkers can include any
method
known in the art including, without limitation, measuring amount, activity,
modifications such as glycosylation, phosphorylation, ADP-ribosylation,
ubiquitination, etc., imunohistochemistry (IHC). Other Biomarkers include
imaging,
cell count and apoptosis markers.
The indicated genes provided herein are those associated with a particular
tumor
or tissue type. A Marker gene may be associated with numerous cancer types but
provided that the expression of the gene is sufficiently associated with one
tumor or
tissue type to be identified using the algorithm described herein to be
specific for a
lung cancer cell, the gene can be used in the claimed invention to determine
cancer
status and prognosis. Numerous genes associated with one or more cancers are
known in the art. The present invention provides preferred Marker genes and
even
more preferred Marker gene combinations. These are described herein in detail.
A Marker gene corresponds to the sequence designated by a SEQ ID NO when it
contains that sequence. A gene segment or fragment corresponds to the sequence
of
such gene when it contains a portion of the referenced sequence or its
complement
sufficient to distinguish it as being the sequence of the gene. A gene
expression
product corresponds to such sequence when its RNA, mRNA, or cDNA hybridizes to
the composition having such sequence (e.g. a probe) or, in the case of a
peptide or
protein, it is encoded by such mRNA. A segment or fragment of a gene
expression
product corresponds to the sequence of such gene or gene expression product
when it
contains a portion of the referenced gene expression product or its complement
sufficient to distinguish it as being the sequence of the gene or gene
expression
product.
CA 02589782 2007-05-29
WO 2006/060653 PCT/US2005/043620
6
The inventive methods, compositions, articles, and kits of described and
claimed
in this specification include one or more Marker genes. "Marker" or "Marker
gene" is
used throughout this specification to refer to genes and gene expression
products that
correspond with any gene the over- or under-expression of which is associated
with a
tumor or tissue type. The preferred Marker genes are described in more detail
in
Table 8.
The present invention provides a method of assessing lung cancer status by
obtaining a biological sample from a lung cancer patient; and measuring
Biomarkers
associated with Marker genes corresponding to those selected from Table 1,
Table 4,
Table 5 or Table 7 where the expression levels of the Marker genes above or
below
pre-determined cut-off levels are indicative of lung cancer status.
The present invention provides a method of staging lung cancer patients by
obtaining a biological sample from a lung cancer patient; and measuring
Biomarkers
associated with Marker genes corresponding to those selected from Table 1,
Table 4,
Table 5 or Table 7 where the expression levels of the Marker genes above or
below
pre-determined cut-off levels are indicative of the lung cancer stage. The
stage can
correspond to any classification system, including, but not limited to the TNM
system
or to patients with similar gene expression profiles.
The present invention provides a method of determining lung cancer patient
treatment protocol by obtaining a biological sample from a lung cancer
patient; and
measuring Biomarkers associated with Marker genes corresponding to those
selected
from Table 1, Table 4, Table 5 or Table 7 where the expression levels of the
Marker
genes above or below pre-determined cut-off levels are sufficiently indicative
of risk
of recurrence to enable a physician to determine the degree and type of
therapy
recommended to prevent recurrence.
The present invention provides a method of treating a lung cancer patient by
obtaining a biological sample from a lung cancer patient; and measuring
Biomarkers
associated with Marker genes corresponding to those selected from Table 1,
Table 4,
Table 5 or Table 7 where the expression levels of the Marker genes above or
below
pre-determined cut-off levels are indicate a high risk of recurrence and;
treating the
patient with adjuvant therapy if they are a high risk patient.
The present invention provides a method of determining whether a lung cancer
patient is high or low risk of mortality by obtaining a biological sample from
a lung
cancer patient; and measuring Biomarlcers associated with Marker genes
CA 02589782 2007-05-29
WO 2006/060653 PCT/US2005/043620
7
corresponding to those selected from Table 4 where the expression levels of
the
Marker genes above or below pre-determined cut-off levels are sufficiently
indicative
of risk of mortality to enable a physician to determine the degree and type of
therapy
recommended.
In the above methods, the sample can be prepared by any method known in the
art
including, but not limited to, bulk tissue preparation and laser capture
microdissection. The bulk tissue preparation can be obtained for instance from
a
biopsy or a surgical specimen.
In the above methods, the gene expression measuring can also include measuring
the expression level of at least one gene constitutively expressed in the
sample.
In the above methods, the specificity is preferably at least about 40% and the
sensitivity at least at least about 80%.
In the above methods, the pre-determined cut-off levels are at least about 1.5-
fold
over- or under- expression in the sample relative to benign cells or normal
tissue.
In the above methods, the pre-determined cut-off levels have at least a
statistically
significant p-value over-expression in the sample having metastatic cells
relative to
benign cells or normal tissue, preferably the p-value is less than 0.05.
In the above methods, gene expression can be measured by any method known in
the art, including, without limitation on a microarray or gene chip, nucleic
acid
amplification conducted by polymerase chain reaction (PCR) such as reverse
transcription polymerase chain reaction (RT-PCR), measuring or detecting a
protein
encoded by the gene such as by an antibody specific to the protein or by
measuring a
characteristic of the gene such as DNA amplification, methylation, mutation
and
allelic variation. The microarray can be for instance, a eDNA array or an
oligonucleotide array. All these methods and can further contain one or more
internal
control reagents.
The present invention provides a method of generating a lung cancer prognostic
patient report by determining the results of any one of the methods described
herein
and preparing a report displaying the results and patient reports generated
thereby.
The report can further contain an assessment of patient outcome and/or
probability of
risk relative to the patient population.
The present invention provides a composition comprising at least one probe set
selected from the group consisting of: Marker genes corresponding to those
selected
from Table 1, Table 4, Table 5 or Table 7.
CA 02589782 2007-05-29
WO 2006/060653 PCT/US2005/043620
8
The present invention provides a kit for conducting an assay to determine lung
cancer prognosis in a biological sample comprising: materials for detecting
isolated
nucleic acid sequences, their complements, or portions thereof of a
combination of
genes selected from the group consisting of Marker genes corresponding to
those
selected from Table 1, Table 4, Table 5 or Table 7. The kit can further
comprise
reagents for conducting a microarray analysis, and/or a medium through which
said
nucleic acid sequences, their complements, or portions thereof are assayed.
The present invention provides articles for assessing lung cancer status
comprising:
materials for detecting isolated nucleic acid sequences, their complements, or
portions
thereof of a combination of genes selected from the group consisting of Marker
genes
corresponding to those selected from Table 1, Table 4, Table 5 or Table 7. The
articles can fiirther contain reagents for conducting a microarray analysis
and/or a
medium through which said nucleic acid sequences, their complements, or
portions
thereof are assayed.
The present invention provides a microarray or gene chip for performing the
method of claim 1, 2, 5, 6 or 7. The microarray can contain isolated nucleic
acid
sequences, their complements, or portions thereof of a combination of genes
selected
from the group consisting of Marker genes corresponding to those selected from
Table 1, Table 4, Table 5 or Table 7. Preferably, the microarray is capable of
measurement or characterization of at least 1.5-fold over- or under-
expression.
Preferably, the microarray provides a statistically significant p-value over-
or
under-expression. Preferably, the p-value is less than 0.05. The microarray
can
contain a cDNA i rray or an oligonucleotide array and/or one or more internal
control
reagents.
The present invention provides a diagnostic/prognostic portfolio comprising
isolated nucleic acid sequences, their complements, or portions thereof of a
combination of genes selected from the group consisting of Marker genes
corresponding to those selected from Table 1, Table 4, Table 5 or Table 7.
Preferably, the portfolio is capable of measurement or characterization of at
least
1.5-fold over- or under-expression. Preferably, the portfolio provides a
statistically
significant p-value over- or under-expression. Preferably, the p-value is less
than
0.05.
The mere presence or absence of particular nucleic acid sequences in a tissue
sample has only rarely been found to have diagnostic or prognostic value.
CA 02589782 2007-05-29
WO 2006/060653 PCT/US2005/043620
9
Information about the expression of various proteins, peptides or mRNA, on the
other
hand, is increasingly viewed as important. The mere presence of nucleic acid
sequences having the potential to express proteins, peptides, or mRNA (such
sequences referred to as "genes") within the genome by itself is not
determinative of
whether a protein, peptide, or mRNA is expressed in a given cell. Whether or
not a
given gene capable of expressing proteins, peptides, or mRNA does so and to
what
extent such expression occurs, if at all, is determined by a variety of
complex factors.
Irrespective of difficulties in understanding and assessing these factors,
assaying gene
expression can provide useful information about the occurrence of important
events
such as tumorogenesis, metastasis, apoptosis, and other clinically relevant
phenomena. Relative indications of the degree to which genes are active or
inactive
can be found in gene expression profiles. The gene expression profiles of this
invention are used to provide diagnosis, status, prognosis and treatment
protocol for
lung cancer patients.
Sample preparation requires the collection of patient samples. Patient samples
used in the inventive method are those that are suspected of containing
diseased cells
such as cells taken from a nodule in a fine needle aspirate (FNA) of tissue.
Bulk
tissue preparation obtained from a biopsy or a surgical specimen and Laser
Capture
Microdissection (LCM) are also suitable for use. LCM technology is one way to
select the cells to be studied, minimizing variability caused by cell type
heterogeneity.
Consequently, moderate or small changes in Marker gene expression between
normal
or benign and cancerous cells can be readily detected. Samples can also
comprise
circulating epithelial cells extracted from peripheral blood. These can be
obtained
according to a number of methods but the most preferred method is the magnetic
separation technique described in U.S. Patent 6,136,182. Once the sample
containing
the cells of interest has been obtained, a gene expression profile is obtained
using a
Biomarlcer, for genes in the appropriate portfolios.
Preferred methods for establishing gene expression profiles include
determining
the amount of RNA that is produced by a gene that can code for a protein or
peptide.
This is accomplished by reverse transcriptase PCR (RT-PCR), competitive RT-
PCR,
real time RT-PCR, differential display RT-PCR, Northern Blot analysis and
other
related tests. While it is possible to conduct these techniques using
individual PCR
reactions, it is best to amplify complementary DNA (cDNA) or complementary RNA
(cRNA) produced from mRNA and analyze it via microarray. A number of different
CA 02589782 2007-05-29
WO 2006/060653 PCT/US2005/043620
array configurations and methods for their production are known to those of
skill in
the art and are described in U.S. Patents such as: 5,445,934; 5,532,128;
5,556,752;
5,242,974; 5,384,261; 5,405,783; 5,412,087; 5,424,186; 5,429,807; 5,436,327;
5,472,672; 5,527,681; 5,529,756; 5,545,53 1; 5,554,501; 5,561,071; 5,571,639;
5 5,593,839; 5,599,695; 5,624,711; 5,658,734; and 5,700,637.
Microarray technology allows for the measurement of the steady-state mRNA
level of thousands of genes simultaneously thereby presenting a powerful tool
for
identifying effects such as the onset, arrest, or modulation of uncontrolled
cell
proliferation. Two microarray technologies are currently in wide use. The
first are
10 cDNA arrays and the second are oligonucleotide arrays. Although differences
exist in
the construction of these chips, essentially all downstream data analysis and
output
are the same. The product of these analyses are typically measurements of the
intensity of the signal received from a labeled probe used to detect a cDNA
sequence
from the sample that hybridizes to a rntcleic acid sequence at a known
location on the
microarray. Typically, the intensity of the signal is proportional to the
quantity of
cDNA, and thus mRNA, expressed in the sample cells. A large number of such
techniques are available and useful. Preferred methods for determining gene
expression can be found in US Patents 6,271,002; 6,218,122; 6,218,114; and
6,004,755.
Analysis of the expression levels is conducted by comparing such signal
intensities. This is best done by generating a ratio matrix of the expression
intensities
of genes in a test sample versus those in a control sample. For instance, the
gene
expression intensities from a diseased tissue can be compared with the
expression
intensities generated from benign or normal tissue of the same type. A ratio
of these
expression intensities indicates the fold-change in gene expression between
the test
and control samples.
Gene expression profiles can also be displayed in a number of ways. The most
common method is to arrange raw fluorescence intensities or ratio matrix into
a
graphical dendogram where columns indicate test samples and rows indicate
genes.
The data are arranged so genes that have similar expression profiles are
proximal to
each other. The expression ratio for each gene is visualized as a color. For
example,
a ratio less than one (indicating down-regulation) may appear in the blue
portion of
the spectrum while a ratio greater than one (indicating up-regulation) may
appear as a
color in the red portion of the spectrum. Commercially available computer
software
CA 02589782 2007-05-29
WO 2006/060653 PCT/US2005/043620
11
programs are available to display such data including "GENESPRING" from
Silicon
Genetics, Inc. and "DISCOVERY" and "INFER" software from Partek, Inc.
In the case of measuring protein levels to determine gene expression, any
method
known in the art is suitable provided it results in adequate specificity and
sensitivity.
For example, protein levels can be measured by binding to an antibody or
antibody
fragment specific for the protein and measuring the amount of antibody-bound
protein. Antibodies can be labeled by radioactive, fluorescent or other
detectable
reagents to facilitate detection. Methods of detection include, without
limitation,
enzyme-linked immunosorbent assay (ELISA) and immunoblot techniques.
Modulated Markers used in the methods of the invention are described in the
Examples. The genes that are differentially expressed are either up regulated
or down
regulated in patients with various lung cancer prognostics. Up regulation and
down
regulation are relative terms meaning that a detectable difference (beyond the
contribution of noise in the system used to measure it) is found in the amount
of
expression of the genes relative to some baseline. In this case, the baseline
is
determined based on the algorithm. The genes of interest in the diseased cells
are
then either up- or down-regulated relative to the baseline level using the
same
measurement method.
Diseased, in this context, refers to an alteration of the state of a body that
interrupts or disturbs, or has the potential to disturb, proper performance of
bodily
functions as occurs with the uncontrolled proliferation of cells. Someone is
diagnosed
with a disease when some aspect of that person's genotype or phenotype is
consistent
with the presence of the disease. However, the act of conducting a diagnosis
or
prognosis may include the determination of disease/status issues such as
determining
the likelihood of relapse, type of therapy and therapy monitoring. In therapy
monitoring, clinical judgments are made regarding the effect of a given course
of
therapy by comparing the expression of genes over time to determine whether
the
gene expression profiles have changed or are changing to patterns more
consistent
with normal tissue.
Genes can be grouped so that information obtained about the set of genes in
the
group provides a sound basis for making a clinically relevant judgment such as
a
diagnosis, prognosis, or treatment choice. These sets of genes make up the
portfolios
of the invention. As with most diagnostic markers, it is often desirable to
use the
fewest number of markers sufficient to make a correct medical judgment. This
CA 02589782 2007-05-29
WO 2006/060653 PCT/US2005/043620
12
prevents a delay in treatment pending further analysis as well unproductive
use of
time and resources.
One method of establishing gene expression portfolios is through the use of
optimization algorithms such as the mean variance algorithm widely used in
establishing stock portfolios. This method is described in detail in US patent
publication number 20030194734. Essentially, the method calls for the
establishment
of a set of inputs (stocks in financial applications, expression as measured
by intensity
here) that will optimize the return (e.g., signal that is generated) one
receives for using
it while minimizing the variability of the return. Many commercial software
programs are available to conduct such operations. "Wagner Associates Mean-
Variance Optimization Application," referred to as "Wagner Software"
throughout
this specification, is preferred. This software uses functions from the
"Wagner
Associates Mean-Variance Optimization Library" to determine an efficient
frontier
and optimal portfolios in the Markowitz sense is one option. Use of this type
of
software requires that microarray data be transformed so that it can be
treated as an
input in the way stock return and risk measurements are used when the software
is
used for its intended financial analysis purposes.
The process of selecting a portfolio can also include the application of
heuristic
rules. Preferably, such rules are formulated based on biology and an
understanding of
the technology used to produce clinical results. More preferably, they are
applied to
output from the optimization method. For example, the mean variance method of
portfolio selection can be applied to microarray data for a number of genes
differentially expressed in subjects with cancer. Output from the method would
be an
optimized set of genes that could include some genes that are expressed in
peripheral
blood as well as in diseased tissue. If samples used in the testing method are
obtained
from peripheral blood and certain genes differentially expressed in instances
of cancer
could also be differentially expressed in peripheral blood, then a heuristic
rule can be
applied in which a portfolio is selected from the efficient frontier excluding
those that
are differentially expressed in peripheral blood. Of course, the rule can be
applied
prior to the formation of the efficient frontier by, for example, applying the
rule
during data pre-selection.
Other heuristic rules can be applied that are not necessarily related to the
biology
in question. For example, one can apply a rule that only a prescribed
percentage of
the portfolio can be represented by a particular gene or group of genes.
Commercially
CA 02589782 2007-05-29
WO 2006/060653 PCT/US2005/043620
13
available software such as the Wagner Software readily accommodates these
types of
heuristics. This can be useful, for example, when factors other than accuracy
and
precision (e.g., anticipated licensing fees) have an impact on the
desirability of
including one or more genes.
The gene expression profiles of this invention can also be used in conjunction
with other non-genetic diagnostic methods useful in cancer diagnosis,
prognosis, or
treatment monitoring. For example, in some circumstances it is beneficial to
combine
the diagnostic power of the gene expression based methods described above with
data
from conventional markers such as serum protein markers (e.g., Cancer Antigen
27.29
("CA 27.29")). A range of such markers exists including such analytes as CA
27.29.
In one such method, blood is periodically taken from a treated patient and
then
subjected to an enzyme immunoassay for one of the serum markers described
above.
When the concentration of the marker suggests the return of tumors or failure
of
therapy, a sample source amenable to gene expression analysis is taken. Where
a
suspicious mass exists, a fine needle aspirate (FNA) is taken and gene
expression
profiles of cells taken from the mass are then analyzed as described above.
Alternatively, tissue samples may be taken from areas adjacent to the tissue
from
which a tumor was previously removed. This approach can be particularly useful
when other testing produces ambiguous results.
Kits made according to the invention include formatted assays for determining
the
gene expression profiles. These can include all or some of the materials
needed to
conduct the assays such as reagents and instructions and a medium through
which
Biomarkers are assayed.
Articles of this invention include representations of the gene expression
profiles
useful for treating, diagnosing, prognosticating, and otherwise assessing
diseases.
These profile representations are reduced to a medium that can be
automatically read
by a machine such as computer readable media (magnetic, optical, and the
like). The
articles can also include instructions for assessing the gene expression
profiles in such
media. For example, the articles may comprise a CD ROM having computer
instructions for comparing gene expression profiles of the portfolios of genes
described above. The articles may also have gene expression profiles digitally
recorded therein so that they may be compared with gene expression data from
patient
samples. Alternatively, the profiles can be recorded in different
representational
format. A graphical recordation is one such format. Clustering algorithms such
as
CA 02589782 2007-05-29
WO 2006/060653 PCT/US2005/043620
14
those incorporated in "DISCOVERY" and "INFER" software from Partek, Inc.
mentioned above can best assist in the visualization of such data.
Different types of articles of manufacture according to the invention are
media or
formatted assays used to reveal gene expression profiles. These can comprise,
for
example, microarrays in which sequence complements or probes are affixed to a
matrix to which the sequences indicative of the genes of interest combine
creating a
readable determinant of their presence. Alternatively, articles according to
the
invention can be fashioned into reagent kits for conducting hybridization,
amplification, and signal generation indicative of the level of expression of
the genes
of interest for detecting cancer.
The invention is fiirther illustrated by the following non-limiting examples.
All
references cited herein are hereby incorporated herein.
Examples: Genes analyzed according to this invention are typically related to
full-length nucleic acid sequences that code for the production of a protein
or peptide.
One skilled in the art will recognize that identification of full-length
sequences is not
necessary from an analytical point of view. That is, portions of the sequences
or
ESTs can be selected according to well-known principles for which probes can
be
designed to assess gene expression for the corresponding gene.
Example 1
Methods
Patient population
134 fresh frozen, surgically resected lung SCC and 10 matched normal lung
samples from 133 individual patients (LS-71 and LS-136 were duplicate samples
from different areas of the same tumor) from all stages of squamous cell lung
carcinoma were evaluated in this study. These samples were collected from
patients
from the University of Michigan Hospital between October 1991 and July 2002
with
patient consent and Institutional Review Board (IRB) approval. Portions of the
resected lung carcinomas were sectioned and evaluated by the study pathologist
by
routine hematoxylin and eosin (H&E) staining. Samples chosen for analysis
contained greater than 70% tumor cells. Approximately one third of patients
(with
equal proportions for each stage) received radiotherapy or chemotherapy
following
surgery. Seventy-seven patients were lymph node negative. Follow-up data were
available for all patients. The mean patient age was 68:00 (range 42-91) with
approximately 45% of patients 70 years or older. One patient (LS-3) likely
died of
CA 02589782 2007-05-29
WO 2006/060653 PCT/US2005/043620
surgery-related causes and was therefore not utilized in identifying
prognostic
signatures. Also, three specimens had mixed histology and were also not
included in
prognostic profiling (LS-76, LS-84, LS-112).
Microarray Analysis
5 For isolation of RNA, 20 to 40 cryostat sections of 30 m were cut from each
sample, in total corresponding to approximately 100 mg of tissue. Before, in
between, and after cutting the sections for RNA isolation, 5 m sections were
cut for
hematoxylin and eosin staining to confirm the presence of tumor cells. Total
RNA
was isolated with RNAzoI B (Campro Scientific, Veenendaal, Netherlands), and
10 dissolved in DEPC (0.1 %)-treated H20. About 2 ng of total RNA was
resuspended in
10 l of water and 2 rounds of the T7 RNA polymerase based amplification were
performed to yield about 50 g of amplified RNA. Quality of RNA was checked
using the Agilent Bioanalyzer. The mean ribosomal ratio (28s/18s) for all
samples
was 1.5 (range: 1.0 - 2.1). Four micrograms of total RNA was amplified,
labeled and
15 aRNA was fragmented and hybridized to the Affymetrix U133A chip according
to the
manufacturer's instructions. Microarray data were extracted using the
Affymetrix
MAS 5 software. Global gene expression was scaled to an average intensity of
600
units. The data were then normalized using a spline quantile normalization
method.
Statistical Analysis
Three complimentary statistical methods were performed to identify the optimal
prognostic gene signature: Cox proportional-hazard regression modeling,
bootstrapping, and a leave 20 percent out cross validation (L200CV).
Univariate Cox proportional-hazard regression modeling was performed to
identify genes that were significantly associated with overall survival. The
Cox score
was defined as the sum of the selected gene's log2-based chip signals
multiplied by
their z scores from the Cox regression. Similarly, Cox scores were calculated
for
patients in the testing set with the same selected genes from the training
set. A series
of cutoffs (percentile of risk index for the patients in the training set) was
applied to
predict the clinical outcome of patients in the testing set by comparing the
patients'
Cox score in the testing set with a cutoff for the risk index. If a patient's
Cox score
was higher than the cutoff, the patient was classified as "high risk",
otherwise, it is put
in the "low risk" group.
Kaplan-Meier analysis was performed to explore the survival characteristics of
high-risk and low-risk patients. A cutoff of 3-year survival was employed
since the
CA 02589782 2007-05-29
WO 2006/060653 PCT/US2005/043620
16
majority of patients who will relapse in this population will have this occur
within 3
years. Kieman et al. (1993). Also many of these patients die due to non-cancer
related illnesses after 3 years. Kiernan et al. (1993). This rationale was
also
employed when performing Cox modeling.
The bootstrap method was also employed to provide a more stringent means of
defining prognostic genes. Using the same training and testing sets created
above, 65
samples were selected, with replacement from the training set, and then Cox
regression was performed on these samples. Each gene's P value and z score
were
recorded. This step was repeated 400 times thus giving 400 P values and z
scores for
each gene. For each gene, the top and bottom 5% of P values were removed and
then
the mean P value and the rank of each gene (based on the mean P value) were
defined.
Similarly, the top and bottom 5% z scores for each gene in the training set
were
removed and the sum of the remaining ones was calculated. Various numbers of
top
genes based on the mean P value were defined, their log2-based chip signal
were
multiplied with the sum of their z scores. This equated their Cox scores,
namely, the
risk index. The patients' Cox scores in the testing set was also calculated in
this
manner. Receiver operator characteristic (ROC) curves were drawn for patients
in the
training and testing sets and the area under the curve (AUC) values for each
gene
classifier was recorded. The AUC values were then plotted versus various
numbers of
gene classifiers to determine the optimal gene number that provides steady AUC
values in the training set.
A L200CV was also performed to confirm the optimal gene number of the
classifier. First samples were partitioned into 5 groups with the same or very
close
numbers of samples. Five pairs of training and testing sets was generated with
the
training set consisting of 80% of samples and the testing set consisting of
the
remaining 20%. Therefore each sample was chosen exactly once in a testing set.
Cox
regression modeling was performed to select the top prognostic genes (from 2
to 200)
in the training set and the selected genes were tested in the corresponding
testing set.
ROC was performed to calculate the AUC. The mean AUC of the 5 testing sets for
gene number from 2 to 200 was calculated. This was repeated 100 times and the
mean of 100 AUC's for gene numbers from 2 to 200 was then calculated. The mean
AUC versus gene number (2 to 200) was plotted and the optimal number of genes
in
the signature was selected.
CA 02589782 2007-05-29
WO 2006/060653 PCT/US2005/043620
17
Hierarchical clustering was performed with GeneSpring7.0 (Silicon Genetics) to
identify major clusters of patients and investigate their association with
patient co-
variates. Prior to clustering genes that had a coefficient of variation (CV)
smaller
than 0.3 (arbitrarily chosen) were removed so as to reduce the impact of genes
that
displayed minimal change in expression across the dataset. Thus a dataset with
11,101 genes was created for clustering analysis. The signal intensity of each
gene
was divided by the median expression level of that gene from all patients.
Samples
were clustered using Pearson correlation as measurement of similarity. Genes
were
clustered in the same way.
Results
Microarray profiling
141 of the 144 microarrays gave excellent data (% present > 40, scaling factor
<
10) while the remaining 3 samples (LS76, LS78, LS82) gave acceptable results
(%
present > 30, scaling factor < 15). Table 2 shows the clinical-pathological
staging of
the 134 SCC samples analyzed by microarray. All samples were included in
initial
clustering analysis. Genes were filtered from the dataset if they were not
called
present in at least 10% of all samples (including normal). This left 14,597
genes for
analysis.
Table 2: Patient samples by stage
Clinical Stage Number (%) Pathological Stage Number
la 28(20) Tl NO MO 27
lb 50(35) T2 NO MO 48
IIA 7(5) T1 N1 M0 6
IIB 31 (22) Tl N1 MO 30
IIIA 19 (14) T2 N2 MO 10
T3 NO M0 1
T3 N1 MO 3
T3 N2 M0 4
IIIB 5(4) T4 NO MO 1
T4N1MO 3
T4 N2 M0 1
Note. One duplicate stage Ilb, 77 lymph node negative samples
Unsupervised Hierarchical clustering
For unsupervised clustering the dataset was further filtered by removing genes
(CV<30%) that had low variation of expression across the entire dataset. The
134
SCC and 10 normal lung samples were initially clustered based on unsupervised
k-
means clustering of the remaining 11,101 genes. The normal lung samples had a
distinct profile from the carcinomas and clustered together. The 2 duplicate
SCC
CA 02589782 2007-05-29
WO 2006/060653 PCT/US2005/043620
18
samples (LS-71 and LS-136) clustered together demonstrating the
reproducibility of
the microarray analysis. Of the 133 unique patient carcinomas four were
removed
from further analysis since the patient either died due to surgery (LS3) or
the sample
had mixed histology (LS-76, LS-84, LS-112). When the 129 samples were
clustered
using the 11,101 genes two major clusters were formed, one with 55 patients
and the
other with 74 patients (Fig 1A). No significant association between tumor
stage,
differentiation, or patient gender and the two clusters was identified. There
were
approximately equal proportions of each stage present in both clusters
(cluster 1
consists of 31 stage I, 15 stage II and 9 stage III patients; cluster 2
consists of 42 stage
I, 18 stage II and 14 stage III patients). However, the patients in cluster 1
and 2
showed significantly separated survival curves (Fig 1 B, p = 0.036),
indicating that
expression profiles, irrespective of stage, existed that were associated with
overall
survival (Fig 1 B).
Identification of prognostic gene signatures
To identify genes that could further stratify early stage patients into good
and poor
prognostic groups several complimentary statistical analyses were performed.
This
included: 1) Cox modeling on a training set and validating prognostic
signatures on a
test set of samples; 2) bootstrapping; and 3) L200CV.
First, the 129 SCC samples were split into training and test sets with equal
number
of stages represented in both groups. Both groups showed similar overall
median
survival times. The 65-patient training set was analyzed using a bootstrapping
method (see Methods section) to determine the optimal number of genes to be
used in
the prognostic signature. When increasing numbers of genes was plotted versus
the
AUC from a receiver operator characteristic analysis it could be seen that the
signature performance began to plateau at around 50 genes (Fig 2A). A L200CV
procedure was used to confirm the optimal number of prognostic genes in the 65-
patient training set. The result showed that a signature has a stable
performance when
the nlunber of genes reaches 50. Therefore, the top ranked 50 genes would be
used as
the signature. The 50-gene classifier demonstrated overall predictive value of
70%
when used in the 64-patient test set (Fig 2B).
A LOOCV procedure was then used in the 65-patient training set to determine
the
optimal cutoff of the risk index. The error rates were calculated with various
cutoffs.
This indicated that cutoff at 58%ile gave the lowest error rate (Fig 3).
Therefore, the
58%ile of patients was used as the cutoff for determining survival. The
performance
CA 02589782 2007-05-29
WO 2006/060653 PCT/US2005/043620
19
of the prognostic signature was then examined in the testing set using this
cutoff. The
signature achieved 52.4% specificity and 81.8% sensitivity in the testing set
(Fig. 3).
Kaplan-Meier plot also showed good separation between predicted high-risk
group of
patients and low risk group of patients (p = 0.0075). Multivariate analysis
including
sex, differentiation, stage, tumor size, age, and lymph node status was
performed.
None of the parameters except for the 50-gene signature had a significant p-
value
(Table 3). Kaplan-Meier analysis was also performed using the 50-gene
signature and
a risk cutoff of 58%. The high-risk group was well separated from the low risk
group
in all patients (p = 0.0075, Fig. 4A) and when only those with stage 1 disease
were
tested (p = 0.029; Fig. 4B).
Table 3
Multivariate Analysis
Co-variate P-value
50 gene signature 0.01
Sex 0.24
Differentiation 0.66
Stage 0.41
T 0.91
Age 0.35
N 0.99
Example 2
Identification of a robust prognostic signature
Although we used a bootstrap method to avoid random sampling issues in the
training-testing method, a more robust prognostic signature might be
identified if we
use all 129 samples in the training set. Therefore, a gene signature was also
selected
by bootstrapping the entire 129-patient dataset. Genes were ranked based on
their
mean P value and the top 100 genes were identified (Table 4). Twenty-three of
these
genes were in common with the top 50 genes identified from the training-test
method.
We had data on time to relapse (TTR) for 16 patients. The mean TTR was 21.7
months with 88% of patients relapsing within 3 years. Since the majority of
patients
who die after 3 years die from non-cancer related causes we chose a cutoff of
36
months for classifying patients who will have a lung cancer-related death. Our
defined classifiers were tested with or without a 36-month cutoff. The
signatures had
a better performance in the testing set when a 3-year cutoff was employed.
Therefore,
a gene signature selected with the time limit is better than without the time
limit.
CA 02589782 2007-05-29
WO 2006/060653 PCT/US2005/043620
Table 4
SEQ ID NO: Rank SEQ ID NO: Rank SEQ ID NO: Rank SEQ ID NO: Rank
452 1 107 26 200 51 89 76
191 2 77 27 234 52 158 77
303 3 13 28 58 53 149 78
378 4 461 29 386 54 98 79
270 5 91 30 120 55 29 80
79 6 225 31 305 56 35 81
409 7 290 32 302 57 311 82
76 8 252 33 16 58 310 83
450 9 194 34 432 59 279 84
413 10 21 35 381 60 384 85
365 11 206 36 269 61 298 86
135 12 161 37 75 62 48 87
18 13 36 38 209 63 222 88
460 14 207 39 293 64 425 89
393 15 37 40 20 65 56 90
375 16 315 41 83 66 398 91
396 17 87 42 408 67 453 92
86 18 288 43 388 68 470 93
190 19 369 44 443 69 261 94
204 20 235 45 372 70 462 95
65 21 337 46 286 71 162 96
433 22 383 47 289 72 131 97
439 23 228 48 57 73 284 98
471 24 248 49 215 74 326 99
124 25 423 50 144 75 114 100
Example 3
Identification of a high-risk sub-group of SCC patients
The unsupervised hierarchical clustering described above identified two main
5 groups of patients that differed significantly in their overall survival. A
bootstrap
analysis performed on the two patient groups found 121 genes (non-unique)
whose
expression levels were significantly different between the high- and low-risk
groups
(p < 0.001, mean difference >3-fold; Table 5). Interestingly, the majority of
these
genes (118) were down-regulated in the high risk group (Fig 5A, cluster 1).
Pathway
10 analysis demonstrated that genes involved in epidermal development
functions,
including keratins and small-proline rich proteins, were significantly
enriched for in
this dataset. These data, shown in Table 6, indicate that there are two major
subtypes
of SCC one of which has a gene expression profile consistent with poor
differentiation and as such tends to be more aggressive. When the genes only
15 involved in epidermal differentiation (Fig 513) were used to cluster the
patient samples
the two prognostically differentiated groups were maintained (Fig 5C). These
data
indicate that there are two major subtypes of SCC one of which has a gene
expression
CA 02589782 2007-05-29
WO 2006/060653 PCT/US2005/043620
21
profile consistent with poor differentiation and as such tends to be more
aggressive.
The lack of expression of epidermal differentiation genes may be associated
with a
subgroup of tumors that are de-differentiated and therefore more aggressive.
Table 5 121 genes significantly different between low- and high-risk clusters
Dunn-Sidak p- Dunn-Sidak p- Dunn-Sidak p-
SEQ ID NO: value SEQ ID NO: value SEQ ID NO: value
47 4.069E-08 171 0 278 3.2363E-12
52 0.001779787 172 0 285 3.95638E-09
61 4.78438E-06 173 0 313 3.06803E-07
64 3.94295E-08 174 0 318 0
70 6.14897E-11 175 3.70691E-07 320 1.10983E-05
71 5.40462E-10 177 0.000964585 321 2.86717E-06
72 4.99526E-07 179 0.00023307 322 0
91 1.17801E-09 181 2.10853E-07 323 1.46054E-05
92 0 184 0.000261 324 2.65922E-05
93 1.51307E-07 185 1.22494E-09 331 0
94 0.00024053 186 0 332 1.77997E-10
97 3.25762E-06 188 8.3147E-08 333 0
101 0.000715044 192 0 341 3.60669E-08
102 4.042E-05 193 1.33552E-06 348 0.001219264
105 1.28648E-05 194 0 349 4.42435E-08
lll 4.10746E-07 195 8.04368E-07 353 0
112 0.000129644 196 0 357 9.21286E-05
115 7.6587E-08 198 1.78886E-07 358 2.91267E-09
118 4.67009E-05 213 0 360 1.67317E-09
121 7.48718E-09 214 0 366 0
123 1.61815 E-11 216 1.77997E-11 367 1.06791E-07
125 4.82759E-08 219 1.44447E-07 371 0
126 1.80901E-05 223 6.79057E-08 373 0.000736609
128 1.45634E-11 229 2.21201 E-09 397 1.53724E-10
132 0.000571137 231 0.000127662 402 0.001640004
134 3.42792E-07 232 0.000670091 405 1.89887E-05
138 2.83176E-10 233 0.000334014 407 0
140 4.93018E-08 236 0.000371339 418 7.28168E-11
141 9.06164E-11 237 5.35608E-10 419 1.13076E-08
142 1.73482E-08 238 0 424 2.83902E-05
145 0 243 0 426 0.001696015
146 8.6277E-05 245 1.5392E-07 429 2.33385E-05
148 1.68459E-07 246 3.77172E-06 435 2.53251E-06
156 8.93603E-05 251 9.51746E-06 445 8.59804E-08
159 0 253 1.61815E-12 457 0
160 7.24383E-06 257 7.19348E-07 458 0
166 4.46788E-05 259 3.2363E-12 459 0
167 1.61815E-12 260 0 463 9.60372E-09
168 3.2363E-12 262 0 468 4.52017E-06
CA 02589782 2007-05-29
WO 2006/060653 PCT/US2005/043620
22
170 5.27808E-08 263 1.61815E-12
Table 6. List of significantly enriched pathways
Gene. Gene.#.On GO.
GO.ID Count GO. Class . U133a Category p.value
8544 17 epidermal differentiation 56 P 7.31 E-12
6325 3 chromatin architecture 12 P 2.75E-04
7586 3 digestion 15 P 7.08E-04
7156 4 homophilic cell adhesion 39 P 0.004886
7148 3 cell shape and cell size control 28 P 0.007914
7565 3 pregnancy 28 P 0.007914
165 2 MAPKKKcascade 15 P 0.008242
6805 2 xenobiotic metabolism 15 P 0.008242
7169 3 receptor tyrosine kinase signaling 41 P 0.029293
6832 2 small molecule transport 29 P 0.049333
Example 4
Gene Expression Signatures for Prognosis of Lung Cancer.
Methods
Real-Time Quantitative RT-PCR
Total RNA samples were nonnalized by OD260. Quality testing included analysis
by capillary electrophoresis using a Bioanalyzer (Agilent). For aRNA, the
RibobeastTM 1-Round Aminoallyl-aRNA amplification kit (Epicentre) was used.
All
first-strand cDNA synthesis, second-strand cDNA synthesis, in vitro
transcription of
aRNA, DNase treatment, purification and other steps were performed according
to the
manufacturer's protocol. For each sample aRNA was reverse transcribed into
first-
stand cDNA and used for real-time quantitative RT-PCR. The first-strand cDNA
synthesis reaction contained, 100 ng of aRNA, 1 1 of 50 ng/ l T7-Oligo(dT)
primer,
0.25 l of 10mM dNTPs, 1 l of 5X SuperscriptTM III Reverse Transcriptase
Buffer,
0.25 l of 200 U/ l SuperscriptTM III Reverse Transcriptase (Invitrogen Corp),
0.25 1
of 100 mM DTT and 0.25 l of 0.3 U/ l RNase Inhibitor (Epicentre) in a total
reaction volume of 5 .l.
Real-time quantitative RT-PCR analyses were performed on the ABI Prism
7900HT sequence detection system (Applied Biosystems). Eachreaction contained
10 1 of 2X TaqMan Universal PCR Master Mix (Applied Biosystems), 5 gl of
cDNA template, and 1 l of 20X Assays-on-Demand Gene Expression Assay Mix
(Applied Biosystems) in a total reaction volume of 20 l. The PCR consisted of
an
UNG activation step at 50 C for 2 min and initial enzyme activation step at 95
C for
10 min, followed by 40 cycles of 95 C for 15 sec, 60 C for 1 min.
CA 02589782 2007-05-29
WO 2006/060653 PCT/US2005/043620
23
Immunohistochemistry
Immunohistochemistry (IHC) was performed on tissue microarrays containing 60
lung squamous cell carcinomas. Areas of the tumor that best represented the
overall
morphology were selected for generating a tissue microarray (TMA) block as
previously described by Kononen et al. (1998). All controls stained negative
for
background.
Pathway Analysis
Pathway analysis was performed by first mapping the genes on the Affy U133A
chip to the Biological Process categories of Gene Ontology (GO). The
categories that
had at least 10 genes on the U133A chip were used for subsequent pathway
analyses.
Genes that were selected from data analysis were mapped to the GO Biological
Process categories. Then the hypergeometric distribution probability of the
genes was
calculated for each category. A category that had a p-value less than 0.05 and
had at
least two genes was considered over-represented in the selected gene list.
Identification of core set of prognostic genes
Briefly, 400 random training sets of 65 patients were selected from the
1291ung
SCC patients. For each training set, Cox regression was performed to identify
significant genes at the 5% significance level (i.e. P < 0.05). 331 genes that
are
significant in more than 40% of the training sets are used as the core gene
sets. These
331 genes are shown in Table 7.
Microarray results verification
To confirm the microarray results we initially performed TaqMan R quantitative
RT-PCR on 4 genes (FGFR2, KRT13, NTRK2, and VEGF). The correlation between
the platforms ranged from 0.71 to 0.96 indicating the expression data were
reproducible.
Immunohistochemistry was then performed on tissue microarrays to confirm
expression of several of these proteins within the tumor cells. Various levels
of
expression of several keratins in addition to the tyrosine kinase proteins
FGFR2 and
NTKR2 in SCC cells was demonstrated.
Identification of a core set of prognostic genes
In the previous analysis a set of 50 genes was identified from a single
training set
of 65 patients. One problem with this approach is that the genes identified as
predictors of prognosis can be unstable since the molecular signature strongly
depends on the selection of patients in the training sets. The use of
validation by
CA 02589782 2007-05-29
WO 2006/060653 PCT/US2005/043620
24
repeated random sampling can avoid this instability. We therefore generated
400
random training sets of 65 patients from the 1291ung SCC patients and
performed
Cox regression to identify significant genes at the 5% significance level
(i.e. P <
0.05). 331 genes that were significant in more than 40% of the training sets
were
identified as a core set of prognostic genes in squamous cell lung cancer.
These genes
are SEQ ID NOs: in Table 7.
Table 7 331 Core genes
1 2 3 5 6 7 8 9 11
13 14 15 16 17 18 20 21 22
23 24 25 26 27 28 29 30 31
32 33 34 35 36 37 38 39 40
41 42 43 44 45 46 48 49 50
51 54 55 56 57 58 59 62 65
66 67 68 69 73 74 75 76 77
79 80 81 82 83 84 85 86 87
88 89 90 91 92 95 96 98 99
100 104 106 107 108 109 110 113 114
116 117 119 120 122 124 127 129 130
133 134 135 136 137 139 141 143 147
149 150 151 152 153 154 155 157 159
161 163 164 165 166 169 176 178 180
182 183 187 190 191 194 197 199 200
201 202 203 204 205 206 207 208 209
210 211 212 215 217 218 220 222 224
225 226 227 228 234 235 239 240 241
242 244 247 248 249 250 252 254 255
256 258 261 263 264 265 266 269 270
271 272 274 275 276 282 283 284 286
288 289 290 291 292 293 294 295 296
297 298 299 300 301 302 303 304 305
306 307 308 309 310 311 312 314 315
316 317 319 325 327 328 329 330 334
335 336 337 338 339 340 342 343 344
345 346 347 350 351 352 354 355 356
359 361 363 364 365 368 369 370 372
374 375 376 377 378 379 380 381 382
383 384 385 386 387 388 389 390 391
392 393 394 395 396 398 399 400 401
403 404 406 409 410 411 412 413 415
417 420 421 422 423 425 427 428 430
431 432 433 434 436 437 438 439 441
442 443 444 447 448 449 450 451 452
453 454 455 456 460 461 462 464 465
466 467 469 470 471 472 473
CA 02589782 2007-05-29
WO 2006/060653 PCT/US2005/043620
Although the foregoing invention has been described in some detail by way of
illustration and example for purposes of clarity of understanding, the
descriptions and
examples should not be construed as limiting the scope of the invention.
CA 02589782 2007-05-29
WO 2006/060653 PCT/US2005/043620
26
Table 8 SEQ ID NOs: and gene descriptions
1 1255_g_at guanylate cyclase activator lA (retina) GUCAIA L36861
2 200619_at splicing factor 3b, subunit 2 SF3B2 NM_006842
3 200650_s_at lactate dehydrogenase A LDHA NM_005566
4 200727_s_at ARP2 actin-related protein 2 homolog ACTR2 AA699583
200728_at ARP2 actin-related protein 2 homolog ACTR2 BE566290
6 200737_at phosphoglycerate kinase 1 PGK1 NM_000291
7 200795_at SPARC-like 1(mast9, hevin) SPARCLI NM_004684
8 200810_s_at cold inducible RNA binding protein CIRBP NM_001280
9 200811_at cold inducible RNA binding protein CIRBP NM_001280
200824_at glutathione S-transferase pi GSTP1 NM_000852
11 200836_s_at microtubule-associated protein 4 MAP4 NM_002375
12 200840_at lysyl-tRNA synthetase KARS NM_005548
13 200863_s_at RAB 11 A, member RAS oncogene family RAB 11 A A1215102
14 200893_at splicing factor, arginine/serine-rich 10 SFRS 10 NM_004593
200951_s_at cyclin D2 CCND2 AW026491
16 200970_s_at stress-associated endoplasmic reticulum SERP1 AL136807
protein 1
17 200993_at importin 7 IP07 AA939270
18 201003_x_at ubiquitin-conjugating enzyme E2 variant 1 UBE2V 1 NM_003349
19 201033_x_at ribosomal protein, large, P0 RPLPO NM_001002
201047_x_at RAB6A, member RAS oncogene family RAB6A BC003617
21 201067_at proteasome (prosome, macropain) 26S PSMC2 BF215487
subunit, ATPase, 2
22 201125_s_at integrin, beta 5 ITGB5 NM_002213
23 201151 s_at muscleblind-like MBNL1 BF512200
24 201152T_s_at muscleblind-like MBNL1 N31913
201154_x_at ribosomal protein L4 RPL4 NM_000968
26 201170_s_at basic helix-loop-helix domain containing, BHLHB2 NM 003670
class B, 2
27 201175_at thioredoxin-related transmembrane protein 2 TMX2 NM_015959
28 201236_s_at BTG family, member 2 BTG2 NM_006763
29 201251_at pyruvate kinase, muscle PKM2 NM_002654
201286_at syndecan l SDC1 Z48199
31 201287_s_at syndecan 1 SDC1 NM_002997
32 201351 s_at YMEl-like 1 YME1L1 AF070656
33 201353 s at bromodomain adjacent to zinc finger domain, BAZ2A AI653126
- - 2A
34 201361_at hypothetical protein MGC5508 MGC5508 NM_024092
201447_at TIA1 cytotoxic granule-associated RNA TIA1 H96549
binding
36 201448_at TIAl cytotoxic granule-associated RNA TIAl AL046419
binding transcript variant 1
37 201449_at TIA1 cytotoxic granule-associated RNA TIA1 AL567227
binding transcript variant 1
38 201545_s_at poly(A) binding protein, nuclear 1 PABPNI NM_004643
39 201623_s_at aspartyl-tRNA synthetase DARS BC000629
CA 02589782 2007-05-29
WO 2006/060653 PCT/US2005/043620
27
40 201667at gap junction protein, alpha I GJA1 NM_000165
41 201683xat chromosome 14 open reading frame 92 C 14orf92 BE783632
42 201718_s_at erythrocyte membrane protein band 4.1-like 2 EPB41L2 BF511685
43 201725_at chromosome 10 open reading frame 7 C l 0orf7 NM_006023
44 201779_s_at ring finger protein 13 RNF 13 AF070558
45 201780_s_at ring finger protein 13 RNF 13 NM_007282
46 201801_s_at solute carrier family 29 (nucleoside SLC29A1 AF079117
transporters), mem 1
47 201820_at keratin 5 KRT5 NM000424
48 201892_s_at IMP (inosine monophosphate) dehydrogenase IMPDH2 NM_000884
2
49 202006_at protein tyrosine phosphatase, non-receptor PTPN12 NM_002835
type 12
50 202170_s_at aminoadipate-semialdehyde dehydrogenase- AASDHPPT AF151057
phosphopantetheinyl transferase
51 202181_at KIAA0247 KIAA0247 NM_014734
52 202219_at solute carrier family 6, member 8 SLC6A8 NM_005629
53 202223_at integral membrane protein 1 ITM1 NM_002219
54 202253_s_at dynamin 2 DNM2 NM_004945
55 202288_at FK506 binding protein 12-rapamycin assoc. FRAP 1 U88966
pro 1
56 202349_at torsin family 1, member A (torsin A) TORlA NM_000113
57 202364_at MAX interactor 1 MXI1 NM005962
58 202397_at nuclear transport factor 2 NUTF2 NM 005796
59 202418_at Yipl interacting factor homolog YIF1 NM~020470
60 202471_s_at isocitrate dehydrogenase 3 (NAD+) g~nma IDH3G NM_~004135
61 202489_s_at FXYD domain-containing ion transport FXYD3 BC005238
regulator 3
62 202496_at autoantigen RCD-8 NM_014329
63 202503_s_at KIAA0101 gene product KIAA0101 NM_014736
64 202504_at ataxia-telangiectasia group D-associated TRIM29 NM_012101
protein
65 202530_at mitogen-activated protein kinase 14 MAPK14 NM_001315
66 202602_s_at HIV TAT specific factor 1 HTATSF1 NM_014500
67 202746_at integral membrane protein 2A ITM2A AL021786
68 202747_s_at integral membrane protein 2A ITM2A NM_004867
69 202753_at proteasome regulatory particle subunit P44S10 NM_014814
p44S 10
70 202755_s_at glypican 1 GPCl A1354864
71 202756_s_at glypican I GPC1 N1VI_002081
72 202831_at glutathione peroxidase 2 GPX2 NIVI_002083
73 202887_s_at DNA-damage-inducible transcript 4 DDIT4 NM_019058
74 202935_s_at SRY-box 9 SOX9 A1382146
75 202990_at phosphorylase, glycogen; liver PYGL NM_002863
76 203040_s_at hydroxymetllylbilane synthase HMBS NM_000190
77 203082_at BMS1-like, ribosome assembly protein BMS1L NM_014753
(yeast)
78 203190_at NADH dehydrogenase (ubiquinone) Fe-S NDUFS8 NM_002496
CA 02589782 2007-05-29
WO 2006/060653 PCT/US2005/043620
28
protein 8
79 203196 at ATP-binding cassette, sub-fam C ABCC4 A1948503
(CFTR/MRP), mem 4
80 203211_s_at myotubularin related protein 2 MTMR2 AK027038
81 203368_at cysteine-rich with EGF-like domains 1 CRELDI NM_015513
82 203372_s_at suppressor of cytokine signaling 2 SOCS2 AB004903
83 203378_at pre-mRNA cleavage complex II protein Pcfl 1 PCF11 AB020631
84 203491_s_at translokin PIG8 A1123527
85 203494_s_at translokin PIG8 NM_014679
86 203545_at asparagine-linked glycosylation 8 homolog ALG8 NM_024079
87 203555_at protein tyrosine phosphatase, non-receptor PTPN 18 NM 014369
type 18
88 203573_s_at Rab geranylgeranyltransferase, alpha subunit RABGGTA NM_004581
89 203589_s_at transcription factor Dp-2 TFDP2 NM_006286
90 203611_at telomeric repeat binding factor 2 TERF2 NM_005652
91 203638_s_at fibroblast growth factor receptor 2 FGFR2 NM_022969
92 203639_s_at fibroblast growth factor receptor 2 FGFR2 M80634
93 203691_at protease inhibitor 3, skin-derived P13 NM_002638
94 203726 s_at laminin, alpha 3 LAMA3 NM_000227
95 203759T_at ST3 beta-galactoside alpha-2,3- ST3GAL4 NM_006278
sialyltransferase 4
96 203787_at single-stranded DNA binding protein 2 SSBP2 NM_012446
97 203798 s_at visinin-like 1 VSNLl NM003385
98 203809T_s_at v-akt murine thymoma viral oncogene AKT2 AA769075
homolog 2
99 203853_s_at GRB2-associated binding protein 2 GAB2 NM_012296
100 203885_at RAB21, member RAS oncogene family RAB21 NM_014999
101 203924_at glutathione S-transferase A2 GSTAl NM_000846
102 203953_s_at Claudin 3 CLDN3 BE791251
103 203964_at N-myc (and STAT) interactor NMI NM_004688
104 203974_at haloacid dehalogenase-like hydrolase domain HDHDIA NM 012080
containing 1 A
105 204014_at dual specificity phosphatase 4 DUSP4 NM_001394
106 204036_at endothelial differentiation, lysophosphatidic EDG2 AW269335
acid G-protein-coupled receptor, 2
107 204037_at EDG2 BF055366
108 204038_s_at EDG2 NM001401
109 204047_s_at phosphatase and actin regulator 2 PHACTR2 AW295193
110 204049_s_at PHACTR2 NM014721
111 204136_at collagen, type VII, alpha 1 COL7A1 NM_000094
112 204151_x_at aldo-keto reductase family 1, member Cl AKR1C1 NM_001353
113 204154_at cysteine dioxygenase, type I CDOl NM_001801
114 204206_at MAX binding protein MNT NM_020310
115 204268_at S 100 calcium-binding protein A2 S 100A2 NM_005978
116 204326x_at metallothionein 1X MTIX NM002450
117 204367_at Sp2 transcription factor SP2 D28588
118 204379_s_at fibroblast growth factor receptor 3 FGFR3 N1V1_000142
119 204385_at kynureninase (L-kynurenine hydrolase) KYNU NM_003937
CA 02589782 2007-05-29
WO 2006/060653 PCT/US2005/043620
29
120 204388_s_at monoamine oxidase A MAOA NM_000240
121 204455_at bullous pemphigoid antigen 1 BPAG1 NM_001723
122 204460_s_at RAD 1 homolog RAD 1 AF074717
123 204469_at protein tyrosine phosphatase, receptor-type, Z PTPRZI NM_002851
polypep 1
124 204493_at BH3 interacting domain death agonist BID NM_001196
125 204532_x_at UDP glycosyltransferase 1 family, polypep UGT1A9 NM_021027
A9
126 204542_at sialyltransferase SIAT7B NM_006456
127 204547_at RAB40B, member RAS oncogene family RAB40B NM_006822
128 204614_at serine (or cysteine) proteinase inhibitor, clade SERPINB2
NM_002575
B, mem 2
129 204621_s_at nuclear receptor subfamily 4, group A, NR4A2 AI935096
member 2
130 204622_x_at NR4A2 NM006186
131 204633_s_at nuclear mitogen- and stress-activated protein RPS6KA5 AF074393
kinase-1
132 204636_at collagen, type XVII, alpha I COL17A1 NM_000494
133 204672_s_at ankyrin repeat domain 6 ANKRD6 NM_014942
134 204734_at keratin 15 KRT15 NM002275
135 204753_s_at hepatic leukemia factor HLF AI810712
136 204754_at hepatic leukemia factor HLF W60800
137 204755_x_at hepatic leukemia factor HLF M95585
138 204855_at serine (or cysteine) proteinase inhibitor, clade SERPINB5
NM_002639
B, mem 5
139 204887_s_at polo-like kinase 4 PLK4 NM_014264
140 204952_at GPI-anchored metastasis-associated protein C4.4A NM 014400
homolog
141 204971_at cystatin A(stefin A) CSTA NM_005213
142 205014_at heparin-binding growth factor binding protein FGFBPI NM_005130
143 205022_s_at checkpoint suppressor 1 CHES1 NM_005197
144 205054_at nebulin NEB NM_004543
145 205064_at small proline-rich protein 1B SPRRIB NM_003125
146 205081_at cysteine-rich protein 1 CRIP1 NM_001311
147 205141_at angiogenin, ribonuclease, RNase A family, 5 ANG NIVI_001145
148 205157_s_at keratin 17 KRT17 NM000422
149 205176_s_at integrin beta 3 binding protein (beta3- ITGB3BP NM 014288
endonexin)
150 205206_at Kallmann syndrome 1 sequence KAL1 NM_000216
151 205219_s_at galactokinase 2 GALK2 NM_002044
152 205267_at POU domain, class 2, associating factor 1 POU2AF1 NM_006235
153 205367_at adaptor protein with pleckstrin homology and APS NM_020979
src homology 2 domains
154 205372_at pleiomorphic adenoma gene 1 PLAG1 NM_002655
155 205450_at phosphorylase kinase, alpha 1(muscle) PHKA1 NM_002637
156 205490_x_at gap junction protein, beta 3 GJB3 BF060667
157 205569_at lysosomal-associated membrane protein 3 LAMP3 NM_014398
158 205595 at desmoglein 3 DSG3 NM_001944
CA 02589782 2007-05-29
WO 2006/060653 PCT/US2005/043620
159 205618_at proline rich Gla (G-carboxyglutamic acid) 1 PRRG1 NM_000950
160 205623_at aldehyde dehydrogenase 3 ALDH3A1 NM_000691
161 205624_at carboxypeptidase A3 (mast cell) CPA3 NM_001870
162 205789_at CD 1 D antigen, d polypeptide CD 1 D NM_001766
163 205839_s_at benzodiazapine receptor (peripheral) assoc BZRAPI NM_004758
pro 1
164 205961_s_at PC4 and SFRS1 interacting protein 1 PSIPI NM_004682
165 205968_at K+ voltage-gated channel, delayed-rectifier, KCNS3 NM_002252
subfamily S, member 3
166 205969_at arylacetamide deacetylase (esterase) AADAC NM_001086
167 206032_at desmocollin 3, transcript variant Dsc3a DSC3 A1797281
168 206033_s_at desmocollin 3, transcript variant Dsc3a DSC3 A1797281
169 206068_s_at acyl-Coenzyme A dehydrogenase, long chain ACADL A1367275
170 206094_x_at UDP glycosyltransferase 1 family, UGTIA6 NM 001072
polypeptide A6
171 206122 at SRY-box 20 SOX15 NM006942
172 206164at chloride channel, calcium activated, family CLCA2 NM 006536
mem 2
173 206165_s_at chloride channel, calcium activated, family CLCA2 NM_006536
mem 2
174 206166_s_at calcium-activated chloride channel-2 CLCA2 NM_006536
175 206300_s_at parathyroid hormone-like hormone PTHLH NM_002820
176 206331_at calcitonin receptor-like CALCRL NM 005795
177 206400_at lectin, galactoside-binding, soluble, 7 LGALS7 NM_'002307
178 206461_x_at metallothionein IH MTIH NM005951
179 206561_s_at aldo-keto reductase family 1, member B10 AKR1B10 NM_020299
180 206566_at solute carrier family 7 (cationic amino acid SLC7A1 NM_003045
transporter, y+ system), member 1
181 206581_at basonuclin BNCI NM_001717
182 206641_at tumor necrosis factor receptor superfamily, TNFRSF 17 NM_001192
mem 17
183 206653_at Polymerase (RNA) III (DNA directed) POLR3G BF062139
polypep G
184 206658_at hypothetical protein MGC 10902 UPK3B NM_030570
185 206756_at carbohydrate (N-acetylglucosamine 6-0) CHST7 NM.019886
sulfotransferase 7
186 206912_at forkhead box E1 FOXEl NM004473
187 207029_at KIT ligand KITLG NM_000899
188 207126_x_at UDP glycosyltransferase 1 family, polypep UGT1A1 NM_000463
Al
189 207499_x_at hypothetical protein FLJ10043 SMAP-1 NM_017979
190 207513_s_at zinc finger protein 189 ZNF189 NM_003452
191 207620_s_at calcium/calmodulin-dependent serine protein CASK NM_003688
kinase
192 207935_s_at keratin 13 KRT13 NM002274
193 208153s_at FAT tumor suppressor homolog 2 FAT2 NM_001447
194 208228_s_at fibroblast growth factor receptor 2 FGFR2 M87771
195 208502_s_at paired-like homeodomain transcription factor PITXI NM_002653
CA 02589782 2007-05-29
WO 2006/060653 PCT/US2005/043620
31
196 208539x_at small proline-rich protein 2B SPRR2A NM_006945
197 208581x_at metallothionein 1X MTIX NM005952
198 208596_s_at UDP glycosyltransferase 1 family, polypep UGT1A3 NM_019093
A3
199 208657_s_at septin 9 9-Sep AF142408
200 208692_at ribosomal protein S3 RPS3 U14990
201 208737_at ATPase, H+ transporting, lysosomal 13kDa, ATP6V1G1 BC003564
V 1 subunit G isoform 1
202 208758_at 5-aminoimidazole-4-carboxamide ATIC D89976
ribonucleotide formyltransferase/IMP
cyclohydrolase
203 208798_x_at golgin-67 GOLGIN- AF204231
67
204 208856_x_at ribosomal protein, large, P0 RPLPO BC003655
205 208870_x_at ATP synthase, H+ transporting, mitochondrial ATP5C l BC000931
F 1 complex, gamma polypeptide 1
206 208933_s_at lectin, galactoside-binding, soluble, 8 LGALS8 A1659005
207 208935_s_at lectin, galactoside-binding, soluble, 8 LGALS8 L78132
208 208950_s_at aldehyde dehydrogenase 7 family, mem A1 ALDH7A1 BC002515
209 209009_at esterase D/formylglutathione hydrolase ESD BC001169
210 209041_s_at ubiquitin-conjugating enzyme E2G 2 UBE2G2 BG395660
211 209117_at WW domain binding protein 2 WBP2 U79458
212 209122_at adipose differentiation-related protein ADFP BC005127
213 209125_at keratin 6A KRT6A J00269
214 209126xat keratin 6 isoform K6f KRT6B L42612
215 209204_at LIM domain only 4 LMO4 A1824831
216 209212_s_at transcription factor BTEB2 KLF5 AB030824
217 209215_at tetracycline transporter-like protein TETRAN L11669
218 209220_at glypican 3 GPC3 L47125
219 209260_at stratifin SFN BC000329
220 209296_at protein phosphatase 1B (formerly 2C), PPM1B AF136972
magnesium-dependent, beta isoform
221 209309_at zinc-alpha2-glycoprotein AZGP1 D90427
222 209339_at seven in absentia homolog 2 SIAH2 U76248
223 209351_at keratin 14 KRT14 BC002690
224 209380_s_at CFTR/MRP, member 5 ABCC5 AF146074
225 209411_s_at Golgi associated, gamma adaptin ear GGA3 AW008018
containing, ARF binding protein 3
226 209446_s_at Similar to hypothetical protein FLJ10803 --- BC001743
227 209457_at dual specificity phosphatase 5 DUSP5 U16996
228 209509_s_at dolichyl-phosphate DPAGTl BC000325
229 209587_at hindlimb expressed homeobox protein Bft U70370
backfoot
230 209647_s_at IMAGE:2972022 SOCS5 AW664421
231 209699xat dihydrodiol dehydrogenase AKRI C2 U05598
232 209719_x_at squamous cell carcinoma antigen I SCCA1 U19556
233 209720_s_at serine (or cysteine) proteinase inhibitor, clade SERPINB3
U19556
CA 02589782 2007-05-29
WO 2006/060653 PCT/US2005/043620
32
B (ovalbumin), member 3
234 209727_at GM2 ganglioside activator GM2A M76477
235 209748_at spastic paraplegia 4 SPG4 AB029006
236 209792_s_at kallikrein 10 KLKIO BC002710
237 209800_at keratin 16 KRT16 AF061812
238 209863_s_at CUSP TP73L AF091627
239 209878_s_at v-rel reticuloendotheliosis viral oncogene RELA M62399
hom A,
240 209897_s_at slit homolog 2 (Drosophila) SLIT2 AF055585
241 209959at nuclear receptor subfamily 4, group A, NR4A3 U12767
member 3
242 209963_s_at erythropoietin receptor EPOR M34986
243 210020x_at NB-1 CALML3 M58026
244 210052_s_at TPX2, microtubule-associated protein TPX2 AF098158
homolog
245 210064_s_at uroplakin lB UPK1B NIVI_006952
246 210065_s_at uroplakin lb UPKI B NM_006952
247 210084x_at mast cell alpha II tryptase --- AF206665
248 210133_at chemokine (C-C motif) ligand 11 CCLI 1 D49372
249 210135_s_at short stature homeobox 2 SHOX2 AF022654
250 210264_at G protein-coupled receptor 35 GPR35 AF089087
251 210355_at parathyroid-like protein PTHLH J03580
252 210406_s_at RAB6A, member RAS oncogene family RAB6A AL136727
253 210505_at alcohol dehydrogenase ADH7 U07821
254 210512_s_at vascular endothelial growth factor VEGF AF022375
255 210829_s_at single-stranded DNA binding protein 2 SSBP2 AF077048
256 210876_at annexin A2 ANXA2 M62896
257 211002_s_at tripartite motif protein TRIM29 beta TRIM29 AF230389
258 211105_s_at nuclear factor of activated T-cells, NFATCI U80918
cytoplasmic, calcineurin-dependent 1
259 211194_s_at p73H TP73L AB010153
260 211195_s_at p51 delta TP73L AB010153
261 211272_s_at diacylglycerol kinase, alpha 8OkDa DGKA AF064771
262 211361_s_at hurpin hurpin AJ001696
263 211401_s_at fibroblast growth factor receptor 2 FGFR2 AB030078
264 211452x at clone FLB4816 PRO1252 --- AF130054
265 211456xat metallothionein 1H-like --- AF333388
266 211474_s_at serine (or cysteine) proteinase inhibitor, clade SERPINB6
BC004948
B (ovalbumin), member 6
267 211527_x_at vascular perrn.eability factor VEGF M27281
268 211547_s_at Miller-Diekerlissencephalyprotein LIS1 L13387
269 211548_s_at hydroxyprostaglandin dehydrogenase HPGD J05594
15-(NAD)
270 211596_s_at leucine-rich repeats and immtuloglobulin-like LRIGI AB050468
domains 1
271 211634_x_at immunoglobulin heavy constant mu IGHM M24669
272 211635xat IgM rheumatoid factor RF-TT1, VH chain --- M24670
273 211653_x_at pseudo-chlordecone AKR1C2 M33376
CA 02589782 2007-05-29
WO 2006/060653 PCT/US2005/043620
33
274 211689_s_at transmembrane protease, serine 2 TMPRSS2 AF270487
275 211721_s_at zinc finger protein 551 ZNF551 BC005868
276 211734_s_at IgE Fc, high affinity I, receptor for a polypep FCERIA
BC005912
277 211756_at parathyroid hormone-like hormone PTHLH BC005961
278 211834_s_at p73Lp63p5lp40KET TP73L AB042841
279 212061_at KIAA0332 SR140 AB002330
280 212092_at KIAA1051 PEG10 BE858180
281 212094_at KIAA1051 PEG10 BE858180
282 212162_at FLJ12811 --- AK022873
283 212189_s_at component of oligomeric Golgi complex 4 COG4 AK022874
284 212228_s_at hypothetical protein DKFZp434KO46 DKFZP434 AC004382
K046
285 212236_x_at cytokeratin 17 KRT17 Z19574
286 212252 at CaZ+calmodulin-dependent protein kinase CAMKK2 AA181179
~ kinase 2(3
287 212255_s_at FLJ10822 fis FLJ10822 AK001684
288 212286_at ankyrin repeat domain 12 ANKRD12 AW572909
289 212311 at KIAA0746 protein KIAA0746 AA522514
290 212314~_at KIAA0746 protein K1AA0746 AB018289
291 212424_at programmed cell death 11 PDCD11 AW026194
292 212441_at KIAA0232 KIAA0232 D86985
293 212458_at sprouty-related, EVH1 domain containing 2 SPRED2 H97931
294 212466_at sprouty-related, EVH 1 domain containing 2 SPRED2 AW 13 8902
295 212570 at KIAA0830 protein KIAA0830 AL573201
296 212573~_at KIAA0830 protein KIAA0830 AF131747
297 212595_s_at DAZ associated protein 2 DAZAP2 AL534321
298 212599_at autism susceptibility candidate 2 AUTS2 AK025298
299 212600_s_at ubiquinol-cytochrome c reductase core UQCRC2 AV727381
protein II
300 212662_at poliovirus receptor PVR BE615277
301 212680_x_at protein phosphatase 1, regulatory (inhibitor) PPP1R14B
BE305165
subunit 14B
302 212836_at polymerase (DNA-directed), delta 3, POLD3 D26018
accessory subunit
303 212841_s_at PTPRF interacting protein, binding protein 2 PPFIBP2 AI692180
304 212864_at CDP-diacylglycerol synthase (phosphatidate CDS2 Y16521
cytidylyltransferase) 2
305 212914_at chromobox homolog 7 CBX7 AV648364
306 212980_at AHA1, activator of heat shock 90kDa protein AHSA2 AL050376
ATPase homolog 2
307 213023_at utrophin UTRN NM_007124
308 213034_at KIAA0999 protein KIAA0999 AB023216
309 213093_at protein kinase C, alpha PRKCA AI471375
310 213199_at DKFZP586PO123 protein DKFZP586 AL080220
P0123
311 213325_at poliovirus receptor-related 3 PVRL3 AA129716
312 213366 xat ATP synthase, H+ transporting, mitochondrial ATP5C1 AV711183
FI complex, gamma polypeptide 1
CA 02589782 2007-05-29
WO 2006/060653 PCT/US2005/043620
34
313 213425_at wingless-type MMTV integration site family, WNT5A A1968085
member 5A
314 213440_at RABIA, member RAS oncogene family RAB1A AL530264
315 213471_at nephronophthisis 4 NPHP4 AB014573
316 213490_s_at mitogen-activated protein kinase kinase 2 MAP2K2 AI762811
317 213518_at protein kinase C, iota PRKCI AI689429
318 213680_at keratin 6A KRT6B A1831452
319 213700_s_at Pyruvate kinase, muscle PKM2 AA554945
320 213721_at SRY-box 2 SOX2 L07335
321 213722_at SRY-box 2 SOX2 AW007161
322 213796_at Small proline-rich protein SPRK SPRRIA A1923984
323 213808_at 23688 clone ADAM23 BE674466
324 213843_x_at accessory proteins BAP31BAP29 SLC6A8 AW276522
325 213880_at leucine-rich repeat-containing G protein- LGR5 AL524520
coupled receptor 5
326 213913_s_at KIAA0984 protein KIAA0984 AW 134976
327 214073 at cortactin CTTN BG475299
328 214100~_x_at IMAGE:1964520 A1284845
329 214260_at COP9 constitutive photomorphogenic COPS8 A1079287
homolog subunit 8
330 214441_at syntaxin 6 STX6 NM_005819
331 214549_x_at small proline-rich protein lA SPRRIA NM_005987
332 214580xat keratin 6B KRT6B AL569511
333 214680_at neurotrophic tyrosine kinase, receptor, type 2 NTRK2 BF674712
334 214688_at transducin-like enhancer of split 4 TLE4 BF217301
335 214735_at phosphoinositide-binding protein PIP3-E PIP3-E AW166711
336 214812_s_at KIAA0184 KIAA0184 D80006
337 214829_at aminoadipate-semialdehyde synthase AASS AK023446
338 214965_at hypothetical protein MGC26885 MGC26885 AF070574
339 215011_at RNA, U17D small nucleolar RNU17D AJ006835
340 215030_at G-rich RNA sequence binding factor 1 GRSF1 AK023187
341 215125_s_at UDP glycosyltransferase 1 family, polypep UGTIA9 AV691323
A9
342 215189_at keratin, hair, basic, 6 (monilethrix) KRTHB6 X99142
343 215354_s_at proline-, glutamic acid-, leucine-rich protein 1 PELPI
BC002875
344 215372xat Hypothetical protein LOC151878 LOC151878 _AU146794
345 215382xat mast cell alpha II tryptase --- AF206666
346 215561_s_at interleukin 1 receptor, type I IL1R1 AK026803
347 215786_at Hepatitis B virus x associated protein HBXAP AK022170
348 215812_s_at creatine transporter SLC6A10 U41163
349 216052xat Artemin ARTN AF115765
350 216147_at Septin 11 11-Sep AL353942
351 216221_s_at pumilio homolog 2 PUM2 D87078
352 216248_s_at nuclear receptor subfamily 4, group A, NR4A2 S77154
member 2
353 216258_s_at UV-B repressed sequence, HUR 7 BE148534
354 216263_s_at chromosome 14 open reading frame 120 Cl4orfl20 AK022215
355 216288_at cysteinyl leukotriene receptor 1 CYSLTR1 AU159276
CA 02589782 2007-05-29
WO 2006/060653 PCT/US2005/043620
356 216412_x_at IgG to Puumala virus G2, light chain V region--- AF043584
357 216594_x_at aldo-keto reductase family 1, member Cl AKR1C1 S68290
358 216603_at solute carrier family 7, member 8 --- AL365343
359 216722at VENT-like homeobox 2 pseudogene 1 VENTX2P1 AF164963
360 216918_s_at bullous pemphigoid antigen 1 isoforms 1 and DST AL096710
3
361 217003_s_at tMDC II, isoform [d] --- AJ132823
362 217097_s_at hypothetical protein DKFZp564F013 PHTF2 AC004990
363 217165_x_at metallothionein 1 F (functional) MT 1 F M 10943
364 217198_x_at immunoglobulin heavy constant gamma 1 IGHG 1 U80164
365 217227_x_at immunoglobulin lambda locus IGLVJC X93006
366 217272_s_at serine (or cysteine) proteinase inhibitor, clade hurpin
AJ001698
B, member 13
367 217312_s_at collagen type VII intergenic region COL7A1 L23982
368 217388_s_at kynureninase,(L-kynurenine hydrolase) KYNU D55639
369 217418_x_at membrane-spanning 4-domains, subfam A, MS4A1 X12530
mem 1
370 217480_x_at similar to Ig kappa chain LOC339562 M20812
371. 217528_at chloride channel, calcium activated, family CLCA2 BF003134
mem 2
372 217622_at chromosome 22 open reading frame 3 C22orf3 AA018187
373 217626_at IMAGE:3089210 AKR1C2 /// BF508244
AKR1C1
374 217746_s_at programmed cell death 6 interacting protein PDCD6IP NM_013374
375 217783_s_at yippee-like YPEL5 NM_016061
376 217786_at SKB1 homolog SKB1 NM_006109
377 217811_at selenoprotein T SELT NM_016275
378 217841_s_at protein phosphatase methylesterase-1 PME-1 NM_016147
379 217860_at NADH dehydrogenase (ubiquinone) 1 alpha NDUFAIO NM_004544
subcomplex, 10,
380 217922_at Mannosidase, alpha, class IA, member 2 MAN1A2 AL157902
381 217994_x_at hypothetical protein FLJ20542 FLJ20542 NM_017871
382 218070_s_at GDP-mannose pyrophosphorylase A GMPPA NM_013335
383 218092_s_at HIV-1 Rev binding protein HRB NM_004504
384 218192_at inositol hexaphosphate kinase 2 IHPK2 NIVI_016291
385 218236_s_at protein kinase D3 PRKD3 NM_005813
386 218238_at GTP binding protein 4 GTPBP4 NM_012341
387 218239_s_at GTP binding protein 4 GTPBP4 NM_012341
388 218288_s_at hypothetical protein MDS025 MDS025 NM_021825
389 218305_at importin 4 IP04 NM_024658
390 218331_s_at chromosome 10 open reading frame 18 ClOorfl8 NM_017782
391 218355_at kinesin family member 4A KIF4A NM_012310
392 218384_at calcium regulated heat stable protein 1 CARHSP1 NM_014316
393 218460_at hypothetical protein FLJ20397 FLJ20397 NM_017802
394 218483_s_at hypothetical protein FLJ21827 FLJ21827 NM_020153
395 218507_at hypoxia-inducible protein 2 HIG2 NM_013332
396 218546_at hypothetical protein FLJ14146 FLJ14146 N1VI_024709
397 218657 at Link guanine nucleotide exchange factor II RAPGEFLI NM_016339
CA 02589782 2007-05-29
WO 2006/060653 PCT/US2005/043620
36
398 218696_at eukaryotic translation initiation factor 2-a EIF2AK3 NM_004836
kinase 3
399 218699_at RAB7, member RAS oncogene family-like 1 RAB7LI BG338251
400 218750_at hypothetical protein MGC5306 MGC5306 NM_024116
401 218769_s_at ankyrin repeat, family A (RFXANK-like), 2 ANKRA2 NM023039
402 218796_at hypothetical protein FLJ20116 C20orf42 NM_017671
403 218834_s_at heat shock 70kDa protein 5 (glucose- HSPA5BP1 NM_017870
regulated protein, 78kDa) binding protein 1
404 218957_s_at hypothetical protein FLJ11848 FLJ11848 NM_025155
405 218960_at transmembrane protease, serine 4 TMPRSS4 NIvI_016425
406 218962_s_at hypothetical protein FLJ13576 FLJ13576 NM_022484
407 218990_s_at small proline-rich protein 3 SPRR3 NM_005416
408 219129_s_at hypothetical protein FLJI 1526 SAP30L NM_024632
409 219132_at pellino homolog 2 PELI2 NM_021255
410 219154_at Ras homolog gene family, member F RHOF NM_024714
411 219155_at phosphatidylinositol transfer protein, PITPNC 1 NM_012417
cytoplasmic 1
412 219201_s_at twisted gastrulation homolog I TWSG1 NM_020648
413 219217_at hypothetical protein FLJ23441 FLJ23441 NM_024678
414 219241_x_at hypothetical protein FLJ20515 SSH3 NM_017857
415 219245_s_at hypothetical protein FLJ13491 FLJ13491 A1309636
416 219250_s_at fibronectin leucine rich transmem protein 3 FLRT3 NM_013281
417 219347_at nudix (nucleoside diphosphate linked moiety NUDT15 NM_018283
X)-type motif 15
418 219389_at hypothetical protein FLJ10052 FLJ10052 NM_017982
419 219554_at Rh type C glycoprotein RHCG NM_016321
420 219582_at opioid growth factor receptor-like 1 OGFRL1 NM_024576
421 219704_at germ cell specific Y-box binding protein YBX2 NM_015982
422 219732_at plasticity related gene 3 PRG-3 NM_017753
423 219741_x_at zinc finger protein 552 ZNF552 NM_024762
424 219756_s_at hypothetical protein FLJ22792 POF1B NM_024921
425 219854_at zinc finger protein 14 (KOX 6) ZNF14 NM_021030
426 219936_s_at G protein-coupled receptor 87 GPR87 NM_023915
427 219959_at molybdenum cofactor sulfurase MOCOS NM_017947
428 219962_at angiotensin I converting enzyme (peptidyl- ACE2 NM 021804
dipeptidase A) 2
429 219995_s_at hypothetical protein FLJ13841 FLJ13841 NM_024702
430 219997_s_at COP9 constitutive photomorphogenic hom COPS7B NM_022730
sub 7B
431 220046_s_at cyclin L1 CCNL1 NM_020307
432 220177_s_at transmembrane protease, serine 3 TMPRSS3 NM_024022
433 220285_at chromosome 9 open reading frame 77 C9orf77 NM_016014
434 220466_at hypothetical protein FLJ13215 FLJ13215 NM_025004
435 220664_at small proline-rich protein 2C SPRR2C NM_006518
436 220668_s_at DNA (cytosine-5-)-methyltransferase 3 beta DNMT3B NM_006892
437 221004_s_at integral membrane protein 2C ITM2C NM_030926
438 221045_s_at period homolog 3 PER3 NM_016831
439 221047 s at MAP/microtubule affinity-regulating kinase 1 MARK1 NM_018650
CA 02589782 2007-05-29
WO 2006/060653 PCT/US2005/043620
37
440 221050_s_at GTP binding protein 2 GTPBP2 NM_019096
441 221064_s_at chromosome 16 open reading frame 28 C16orf28 NM_023076
442 221096_s_at hypothetical protein PRO1580 PRO1580 NM_018502
443 221234_s at BTB and CNC homology 1, basic leucine BACH2 NM_021813
~ zipper transcription factor 2
444 221286_s_at proapoptotic caspase adaptor protein PACAP NM_016459
445 221305_s_at UDP glycosyltransferase 1 family, polypep UGT1A8 NM_019076
A8
446 221326_s_at delta-tubulin TUBD1 NM016261
447 221480_at heterogeneous nuclear ribonucleoprotein D HNRPD BG180941
448 221513_s_at UTP 14, U3 small nucleolar ribonucleoprotein, UTP 14C /
BC001149
homolog C / homolog A UTP 14A
449 221514_at U3 small nucleolar ribonucleoprotein, hom A UTP14A BC001149
450 221580_s_at hypothetical protein MGC5306 MGC5306 BC001972
451 221597_s_at HSPC 171 protein HSPC171 BC003080
452 221622_s_at uncharacterized hypothalamus protein HT007 HT007 AF246240
453 221649_s_at peter pan homolog PPAN BC000535
454 221679_s_at abhydrolase domain containing 6 ABHD6 AF225418
455 221770_at ribulose-5-phosphate-3-epimerase RPE BE964473
456 221790_s_at LDL receptor adaptor protein ARH AL545035
457 221795_at Similar to hypothetical protein FLJ20093 A1346341
458 221796_at Similar to hypothetical protein FLJ20093 AA707199
459 221854_at ESTs PKP1 A1378979
460 221884_at ecotropic viral integration site 1 EVI1 BE466525
461 243_g_at microtubule-associated protein 4 MAP4 M64571
462 31846_at ras homolog gene family, member D RHOD AW003733
463 33323 r_at stratifin SFN X57348
464 33850~_at microtubule-associated protein 4 MAP4 W28892
465 34858_at potassium channel tetramerisation domain KCTD2 D79998
containing 2
466 37512_at 3-hydroxysteroid epimerase RODH U89281
467 41037_at TEA domain family member 4 TEAD4 U63824
468 41469_at elafin P13 L10343
469 44111 at vacuolar protein sorting 33B VPS33B A1672363
470 49049at deltex 3 homolog DTX3 N92708
471 49077_at protein phosphatase methylesterase-1 PME-1 AL040538
472 59625 at nucleolar protein 3 NOL3 AI912351
473 65438~at KIAA1609 protein KIAA1609 AA195124
CA 02589782 2007-05-29
WO 2006/060653 PCT/US2005/043620
38
References
Beer et al. (2002) "Gene-expression profiles predict survival of patients with
lung
adenocarcinoma" Nat Med 8:816-824
Brookes (1999) "The essence of SNPs" Gene 23:177-186
Kato et al. (2004) "A Randomized Trial of Adjuvant Chemotherapy with Uracil-
Tegafur for Adenocarcinoma of the Lung" N Engl J Med 350:1713-1721
Kiernan et al. (1993) "Stage I non-small cell cancer of the lung results of
surgical
resection at Fairfax Hospital" Va Med Q 120:146-149
Kononen et al. (1998) "Tissue microarrays for high-throughput molecular
profiling of
tumor specimens" Nat Med 4:844-847
Mountain et al. (1987) "Lung cancer classification: the relationship of
disease extent
and cell type to survival in a clinical trials population" J Surg Oncol 35:147-
156
Wingo et al. (1999) "Annual Report to the Nation on the Status of Cancer, 1973-
1996,
With a Special Section on Lung Cancer and Tobacco Smoking "J Natl Cancer Inst
91:675-690
DEMANDE OU BREVET VOLUMINEUX
LA PRESENTE PARTIE DE CETTE DEMANDE OU CE BREVET COMPREND
PLUS D'UN TOME.
CECI EST LE TOME 1 DE 2
CONTENANT LES PAGES 1 A 38
NOTE : Pour les tomes additionels, veuillez contacter le Bureau canadien des
brevets
JUMBO APPLICATIONS/PATENTS
THIS SECTION OF THE APPLICATION/PATENT CONTAINS MORE THAN ONE
VOLUME
THIS IS VOLUME 1 OF 2
CONTAINING PAGES 1 TO 38
NOTE: For additional volumes, please contact the Canadian Patent Office
NOM DU FICHIER / FILE NAME:
NOTE POUR LE TOME / VOLUME NOTE: