Note: Descriptions are shown in the official language in which they were submitted.
CA 02592691 2013-12-09
HYPERSPECTRAL/MULTISPECTRAL IMAGING IN DETERMINATION,
ASSESSMENT AND MONITORING OF SYSTEMIC
PHYSIOLOGY AND SHOCK
10
20 Background
I. Field of the Invention
'Me invention is directed to a hyperspectral or multispectral imaging systems
and apparatus for performing real-time and/or near real-time assessment and
monitoring of one or more physiologic parameters. The invention is also
directed to
method of analyzing the hyperspectral and multispeetral data to provide
specific
diagnoses and treatment options in, for example, shock and impending shock,
hypovolemia, hemodynamie compromise, physiological derangement, dehydration,
and
hypothermia.
CA 02592691 2007-06-28
WO 2006/086085
PCT/US2005/046919
2. Description of the Background
Early detection of metabolic shock regardless of etiology is critical for a
variety
of civilian and military medical environments. Acute hemorrhage and subsequent
circulatory collapse (shock) account for about 50% of the deaths on the
battlefield and
the forward operating table, a statistic that has remained relatively
unchanged since
World War I. In addition, hemorrhage is the primary cause of death in about
30% of
injured soldiers who die from wounds. Likewise, uncontrolled hemorrhage
accounts
for up to 82% of the early operative deaths from trauma in the civilian arena.
However,
the mortality rate in combat casualties drops to 2% to 4% if the trauma
patient is
stabilized through surgery. It is therefore clear that the ability to provide
an early
diagnosis of shock significantly reduces mortality and morbidity associated
with shock
in both civilian and military settings.
Hemorrhagic shock is typically identified by the degree of hypotension,
nonspecific signs and subjective symptoms such as cold clammy skin, pallor,
weak
thready pulse, unstable vital signs, and diminished mentation that develop as
a result of
blood loss. Similar symptoms are seen for other types of shock. The impact of
shock
is a mismatch between supply and demand leading to alterations in cellular
metabolism
in various tissues. All of these result from the insufficiency of the
circulation to meet
metabolic demands.
It is clear that past a certain point, shock becomes irreversible. For
military
applications, particularly in the battlefield, it is extremely useful to have
indications as
to which injured soldiers were expectant and which ought to be given therapy.
Significant effort has been placed toward the delineation of criteria for
predicting
impending hemodynamic decompensation and for determining the irreversibility
of
shock in a variety of human and animal models. Similarly, information that
could be
used to assess other injury, exposure to chemical or biological agents,
exhaustion,
dehydration, nutritional state, level of mental or emotional stress,
pharmacological
agents, exposure to toxic agents such as carbon monoxide would be useful in
both
battlefield and civilian settings.
2
CA 02592691 2007-06-28
WO 2006/086085
PCT/US2005/046919
Adequate triage and diagnosis are key to appropriate application of
potentially
life saving therapeutic countermeasures. In the face of a chemical or
biological
exposure, it will be both critical and difficult to rapidly and accurately
assess the
hemodynamic status of wounded or affected individuals. Cumbersome chemical bio-
warfare (CBW) personal protective gear may prevent medical personnel or first
responders from the access required for standard assessment of casualties who
may also
be wearing CBW gear. Taking a pulse or measuring blood pressure may be
impossible.
Any device placed in contact with a potentially contaminated individual may
also be
contaminated and may not be able to be reused without onerous cleansing
measures or
disposable covers. Therefore, the development and deployment of a remote
sensing
technology to provide physiologic and hemodynamic assessment in such
circumstances
would be highly advantageous. For maximum utility, such a technology would
provide
a hand-held, robust, turnkey system that could provide near-real time
information. It
would require minimal operator dexterity and would be operable by an end-user
in
CBW attire.
Profound acidosis, base deficit or rates of change of base deficit have all
been
associated with non-survivability, but it is well known that these occur late
in the
progression of shock. In addition, to date, the assessment of these parameters
has
required blood sample and laboratory equipment, which restricts the use of
such tests
for first responders. Other parameters such as profound hypotension or the
onset of
severe bradycardia or other significant dysrhythmias are often seen in shock
immediately prior to a terminal event but cannot reliably provide sufficient
advance
notice to permit successful intervention. Milder degrees of hypotension or
rhythm
disturbances can be associated with either survival or death and offer no
prognostic
information. Thus, there is an outstanding need for monitoring devices that
would
provide earlier information about likely outcomes for a patient's response to
shock.
Since the appearance of hypotension and reduced oxygen delivery reflect late
events in the process of hemorrhagic shock, it is critical to identify
physiological
signals that are altered during the earliest time period of blood volume loss
to provide
an accurate assessment of the severity of shock. A common denominator in
3
CA 02592691 2007-06-28
WO 2006/086085
PCT/US2005/046919
development of shock is inadequate oxygen delivery (D02) to the tissue
associated
with reductions in blood flow (cardiac output) or metabolic alterations
(reduced pH or
base excess). Increased cardiac output and D02 correlate well with survival
while
failure to stabilize cardiac output and D02 is highly correlated with death.
Therefore,
approaches that include some indicator of oxygen delivery (e.g., stroke
volume, cardiac
output) represent better tools for the early prediction of circulatory shock
than
measurements currently used for this purpose.
Summary
The present invention overcomes the problems and disadvantages associated
with current strategies and designs and provides new tools and methods for
assessing
tissue oxygen saturation, oxygen delivery and oxygen extraction, and tissue
hydration
level of shock victims and other patients requiring physiological assessment
in real-
time or near real-time. This technology utilizes an assessment of local tissue
by
hyperspectral imaging to provide information about systemic physiology and
disease
state.
Accordingly, the invention is directed to a hyperspectral and multispectral
imaging systems, apparatus and methods for performing real-time or near real-
time
assessment and monitoring of one or more physiologic parameters including
oxyhemoglobin, deoxyhemoglobin, water content, total hemoglobin and oxygen
saturation that, when analyzed as described herein, provides metabolic and
physiology
status, such as, for example, the presence or evolution of shock, the adequacy
of
resuscitation or the potential for survival. Specific diagnoses derived from
HSI data
include shock, hypovolemia, hemodynamic compromise, physiological derangement,
shock or impending shock state including hemorrhagic shock, hypovolemic shock,
septic shock, cardiogenic shock, neurogenic shock, burn shock, dehydration,
hypothermia.
Microcirculatory changes similarly can be seen in chronic disease states such
as
diabetes or congestive heart failure. For example, hyperspectral measurement
of tissue
oxyhemoglobin and oxygen saturation (Slisi02) was lower in the forearm of
diabetic
4
CA 02592691 2007-06-28
WO 2006/086085
PCT/US2005/046919
subjects with neuropathy even through this area is usually not affected by
clinical
somatic neuropathy (Greenman et al., Lancet 2005; 366: 1711). This observation
involves hyperspectral imaging of a systemic microvascular change from a
disease
commonly targeted to the foot. Similar information provided by the
hyperspectral
measurement can support early detection of or additional information
concerning shock
or other physiological alterations, and also provide information about likely
outcomes.
Hyperspectral imaging using a hemorrhagic shock model in pigs and a low body
negative pressure (LBNP) model in humans (human shock model that emulates a
blood
loss) demonstrated metrics that can be used to monitor and predict the onset
of and
recovery from shock. Embodiments of the device are useful in settings
including, but
not limited to, surgery, clinical procedures, health monitoring, emergency
room or
battlefield care, first response situations and medical evaluations in the
field, hospital,
and clinic or physician office. This technology evaluates (for the first time)
local tissue
in spatial, spectral, and temporal dimensions via hyperspectral imaging to
provide
information about systemic physiology and disease state.
One embodiment of the invention is directed to an apparatus to deliver MHSI
images to diagnose and evaluate shock comprising a detector (e.g. camera), a
controllable light source, a spectral separator, a power supply, and image
acquisition
and display hardware and an integrated analysis system comprised of hardware
and
software sufficient to convert data to usable information. The detector is
preferably a
digital camera, e.g. a camera having a charge-couple device (CCD) or a
complementary
metal oxide semiconductor (CMOS) detector, and a lens. Preferably, the light
source is
an array of light-emitting devices (e.g. light emitting diodes, LED)
positioned around
the light entry area to provide near-coaxial illumination, with intensity and
duration for
each controlled by a software program. Preferably, the spectral separator is a
visible-
or near-infrared-wavelength, liquid-crystal tunable filter (LCTF) and fitted
to the front
of the camera lens. Preferably, the power supply and a software program are
used to
power up and control the image acquisition hardware. Preferably, the apparatus
is
portable and the acquisition of data is performed in real-time or near real-
time.
Preferably the tissue examined can be the skin, such as that of the volar
(inner) forearm.
5
CA 02592691 2007-06-28
WO 2006/086085
PCT/US2005/046919
Two such lens, filter and detector subsystems, one for visible and the other
for NIR
wavelength collection can be combined and integrated into a single functioning
system.
In another embodiment of the invention, an acousto-optic tunable filter (AOTF)
is fitted between the lens and the camera or in front of the lens. Wavelength
selection
occurs by changing the frequency of the acoustical wave via computer
controlled
driver. Depending on the desired optical design, an additional lens can be
used between
the camera and AOTF.
In another embodiment of the invention, an infra-red thermometer is co-aligned
with(in) the HSI system to measure the temperature of the ROI surface. The
thermometer could be extended to an array of thermo-sensitive devices that
provide a
digital image of the temperature distribution on the observed surface. The
latter is
incorporated into HSI data analysis to determine onset and progression of
shock.
Another embodiment of the invention is directed to a method for acquiring MHSI
data
from a patient comprising illuminating a region of interest on tissue of the
patient,
collecting data images of the region of interest with a detector, converting
the data
images to optical density units using an algorithm, creating a hypercube of
the data
images, and calculating any or all of the following: oxyhemoglobin,
deoxyhemoglobin
and water coefficients and using these calculations to derive any or all of
the following
physiologically relevant parameters: oxygen delivery, oxygen extraction, total
hemoglobin, tissue hyperspectral oxygen saturation (SHm02), and hydration
levels for
each spectrum in the hypercube. Any or all of these parameters are used in
order to
derive a hyperspectral shock index.
From the collected data, calculations are performed to provide information as
to
the chemical composition of the ROT. Preferably any one or more of the
following
coefficients representative of the concentration of the substance present are
calculated
from the data: oxyhemoglobin, deoxyhemoglobin and water. More preferably
oxyhemoglobin and deoxyhemoglobin and water coefficients are calculated for
each
pixel of the image or for representative pixels, groups of pixels, region of
the ROT or
6
CA 02592691 2007-06-28
WO 2006/086085
PCT/US2005/046919
the entire ROI. Most preferably, only oxyhemoglobin and deoxyhemoglobin
coefficients are calculated.
One or more calculated coefficients are used by the system or by a diagnostic
module of the system to derive information on physiology or physiologic state
or
physiologic derangement or pathophysiology. Preferably this reflects broader
physiology than that of the specific piece of tissue imaged. More preferably
this
information reflects or is correlated with at least regional physiology. Most
preferably
this information reflects or is correlated with systemic physiology or
metabolic state.
Algorithms have been developed by the system or by a diagnostic module of the
system to reduce and present the information. Preferably these algorithms are
designed
to generate a scalar index value or scalar value that can be correlated to or
associated
with variations in the physiologic state under study. Preferably this is a
shock index.
Preferably, this index can be considered to be a vital sign and serve as a
surrogate or
non-invasive non-contact or remote method of obtaining a vital sign. It may or
may not
be designed to closely correlate with one of the currently standard vital
signs such as
heart rate or blood pressure. More preferably, a shock index will correlate
with more
advanced measures of hemodynamic status such as cardiac output, stroke volume
or
D02. Most preferably, the shock index will be correlated with outcomes.
Preferably
the shock index will provide improved or earlier information about the patient
status in
advance of other metrics.
In other embodiments other indices can be derived by the system or by specific
diagnostic modules for other states of disease or physiology. Examples of such
indices
include ones derived for diabetes, congestive heart failure, renal failure,
fluid retention,
dehydration, hypertension, hemorrhage, sepsis, pulmonary failure, hypoxia
among
others. These can similarly be correlated with current measures associated
with the
various physiological or pathologic states or with outcomes data to provide an
improved metric.
In an alternate embodiment, a set of numbers reflecting the coefficients
themselves will be presented along with scales to permit interpretation. In
yet another
7
CA 02592691 2007-06-28
WO 2006/086085
PCT/US2005/046919
alternate embodiment, pertinent information is presented as a single or series
of black
and white or false color images reflecting both spatial and spectral tissue
characteristics. Preferably the images will be reported in association with a
scale to
permit easy interpretation. In another embodiment a simple indicator of
metabolic state
is provided. Preferably, this is in the form of one or a series of lights that
signal the
operator as to the state of the patient. In another embodiment, verbal or
written
instructions are presented on a screen.
Images may be presented in any of a number of methods including on the MHSI
imager itself, on a remote screen, by projector or via a heads-up-display.
Prespecified lighting is used or lighting is measured or estimated or
recorded.
Preferably the system is calibrated to take into account ambient lighting as
well as any
light administered by the instrument. Calibration steps determined to be
necessary are
identified either automatically or manually or by a combination of the two and
steps
taken to implement this calibration is undertaken either manually or
automatically or as
a combination of the two. Preferably calibration steps are used to assess and
utilize or
correct for ambient light.
On one preferred embodiment, a tunable light source, a tunable filter or both
are
used as spectral separators to provide specific spectral data for analysis. In
another
preferred embodiment, specific wavelength light sources, preferably LEDs are
used to
provide the data input and obviate the need for some or all of the spectral
separators or
filters.
Preferably lighting is provided for the device during all or part of the data
collection process. More preferably the instrument provides prespecified
lighting.
Preferably, the instrument collects at least one set of data with only ambient
lighting.
This data set could be a single wavelength band collection or all or part of
the entirety
of the wavelength bands measured by the device. In another embodiment, ambient
light
is utilized as the light source and measured by the device for use in
calibration.
Preferably if the ambient light is insufficient, the operator will be
notified. Most
8
CA 02592691 2007-06-28
WO 2006/086085
PCT/US2005/046919
preferably, if the ambient light is insufficient it will be supplemented by
lighting from
the instrument either manually or automatically or as a combination of the
two.
Other embodiments and advantages of the invention are set forth in part in the
description, which follows, and in part, may be obvious from this description,
or may
be learned from the practice of the invention.
Description of the Figures
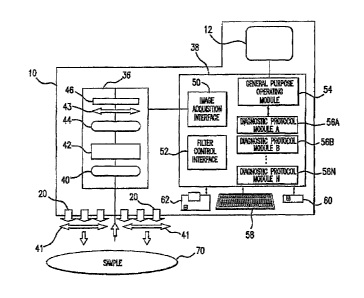
Figure 1 HSI system with light separator.
Figure 2 HSI system with light of preselected wavelengths. Narrowband
LED's
can be used such that the spectral separator is no longer needed.
Figure 3 Visible and NIR absorption spectra of main chromophores in skin:
water
(blue), oxygenated hemoglobin (red), and deoxygenated hemoglobin (green).
Figure 4 Using visible MHSI, a color image for a palm (left panel) and
spectra
(right panel) was recorded at one pixel of the hypercube. The recorded spectra
(black
solid line) are decomposed into four components (offset, slope, oxy, and
deoxyhemoglobin), such that when composed back, they form a line (black
dotted)
fitted to the real data in a least-square sense.
Figure 5 Histograms of pixel intensity in SHsi02 image for a porcine
subject. The
lines show the distribution of SH5102 values in skin at baseline (blue) and
during shock
(green). Reduction in the mean value provides a clear cue of shock.
Figure 6 Heart rate (red) and mean TI-lb (total hemoglobin averaged over
ROI)
(blue) during LBNP experiment for a human subject while pressure was reduced
up to -
90 mmHg. Syncope and return to zero LBNP occur at t=0. Total Hb drops
precipitously prior to collapse.
Figure 7 Heart rate (red) and std(SHsIO2) (standard deviation of SHs102
over ROI)
(blue) during LBNP experiment for a human subject while pressure was reduced
up to -
9
CA 02592691 2007-06-28
WO 2006/086085
PCT/US2005/046919
90 mmHg. Syncope and return to zero LBNP occur at t=0. SHsi02 heterogeneity
rises
prior to collapse.
Figure 8
Skin hydration (blue) averaged across ROI and LBNP (green) during
LBNP experiment for a human subject while pressure was reduced up to -90 mmHg.
Syncope and return to zero LBNP occur at t=0. In this study, tissue hydration
dropped
by nearly 10 percent prior to collapse.
Figure 9 Raw
and processed images showing how image filtering can be used to
give automated detection of skin mottling.
Figure 10 The
BLOBS and TEMPORALS (green and blue, lower panel)
characterize features in the images. BLOBS quantifies "mottling" or
"blobbiness"¨ a
large spatial variation in SH5102 that appears in association with shock.
TEMPORAL
quantifies the temporal change in "mottling" pattern from one time point to
the next. In
many instances, an increase in TEMPORAL precedes an increase in BLOBS.
Figure 11
MHSI oxyhemoglobin (OxyHb) reveals changes in circulatory patterns
that are indicative of patient survivability. The OxyHb images show changes
over the
course of the animal shock experiment: left is at baseline (prior to the first
bleed),
middle is during the shock period (62 minutes after the first bleed), and
right is at post-
resuscitation equilibrium (147 minutes after the first bleed). Other pigs
demonstrated
complete recovery of baseline patterns post resuscitation.
Figure 12 MHSI SHsi02 reveals changes in circulatory patterns that are
indicative
of patient survivability. Comparing the baseline (left panel) to the shock
image (right
panel) of SHs102 shows development of a "feathery" pattern. This pattern
developed in
many of the animal subjects that either died during the procedure or did not
exhibit
strong recoveries to the test procedure, and appears to indicate a higher
likelihood of an
unfavorable outcome.
Figure 13 The
mean values for physiological and hyperspectral parameters as a
function of time together with the standard error for each time step The heart
rate and
1-1^^1 ------- -1--
vn in left two panels. The results using mean, spread,
CA 02592691 2007-06-28
WO 2006/086085
PCT/US2005/046919
blobbiness, and temporal shift methods are shown in the panels at right.
Control and
bleed subjects are shown by blue and black, respectively.
Figure 14 Receiver Operator Characteristic (ROC) curves and area under
ROC
curves with standard error for the heart rate (red), systolic arterial blood
pressure (blue),
and hyperspectral shock index, HSSI (black).
Figure 15 Hyperspectral data collection through CBW mask. From top to
bottom:
1) color photograph reconstructed from hyperspectral images of region of
interest;
2) Spectra obtained through mask lens demonstrating expected heterogeneity;
3) unregistered "raw" spectral image with spatial variation which is
advantageous in
image processing algorithms. Note reflective glare does not hamper analysis.
Description of the Invention
Spectroscopy has been used to monitor metabolic status in a variety of
tissues.
For example, spectroscopic methods are incorporated in pulse oximeters, which
utilize
the different oxy- and deoxyhemoglobin absorption bands to estimate systemic
arterial
oxygen saturation. The measurement provided by pulse oxymetry is, however,
inadequate as a method to diagnose or monitor shock. While pulse oxymetry can
provide a point measurement of arterial oxygen saturation, it does not provide
a
measure of total hemoglobin or of tissue oxygen extraction or of tissue
hydration. In so
doing, pulse oximeters only provide a portion of the information necessary to
make an
assessment of physiologic state associated with shock and hemodynamic
condition.
This is significant, as a drop in total hemoglobin or the mismatch between
oxygen
delivery and oxygen extraction or the pattern of the skin circulation carry
important
information and can be important warning signs. Pulse oximeter derived
arterial
oxygen saturation actually provides more information as to pulmonary as
opposed to
circulatory function, and arterial saturation can be preserved late into
profound shock,
especially if the patient is being ventilated with high concentrations of
oxygen.
Another parameter important in determining adequacy of circulation and/or
perfusion to the tissues is oxygen extraction by the tissues. By recording
both
11
CA 02592691 2007-06-28
WO 2006/086085
PCT/US2005/046919
oxyhemoglobin and deoxyhemoglobin information and using this to report
information
regarding both oxygen delivery and oxygen extraction (respectively), medical
hyperspectral imaging (MHSI ¨ which herein is understood by those skilled in
the art to
refer to either or both medical multispectral or hyperspectral imaging)
reports on tissue
metabolism and the adequacy of tissue perfusion to maintain tissue health and
viability.
Using both pieces of information, tissue OxyHb and DeoxyHb hemoglobin levels
calculated from MHSI data can deliver information as to tissue oxygen
saturation
(SHsi02) and total hemoglobin. Water levels calculated from MHSI data can
deliver
information as to the state of hydration of the tissue. In the shock state,
the patterns of
hyperspectral imaging also are useful to demonstrate the body's response to
hemodynamic compromise. In the body's response to hypovolemia, in order to
centralize blood flow, blood is often shunted away from the skin very early in
the
process. Thus, by monitoring the skin and the pattern of its microcirculation
or its
hydrational state, we obtain early information as to the severity of
hemodynamic
compromise. Microcirculatory changes related to other disease states such as
diabetes,
systemic infection or cardiac or pulmonary disease can be similarly evaluated.
Other
acute or chronic physiologic or metabolic changes can be identified, assessed
or tracked
by similar methods (Greenman et al., Lancet 2005; 366: 1711).
Changes in tissue images reflect both global changes, regional changes related
to regional blood flow and hydration and more localized changes associated
with the
specific response of the microcirculatory bed under examination. Comparison of
responses of different tissues or microcirculatory beds (for example, skin
versus buccal
mucosa, or skin from a peripheral site such as the forearm versus skin from a
more
central site such as the chest wall) and their relative change over time
provides
additional information.
In hospital settings, a number of measurements can be made in an attempt to
monitor shock. Progression toward circulatory collapse is often monitored
based on
significant reductions in blood pressure and oxygen carrying capacity of the
blood, and
elevations in heart rate, and changes in pulse character. There are several
compensatory mechanisms that buffer against changes in blood pressure and
oxygen
12
CA 02592691 2007-06-28
WO 2006/086085
PCT/US2005/046919
carrying capacity, limiting the use of these measurements for early assessment
of
shock. The appearance of hypotension and other signs and symptoms of shock do
not
mark the beginning of circulatory compromise, but rather represent the
beginning of
decompensation, i.e., a point in time when it may be too late to introduce
effective
therapy.
Another standard vital sign, heart rate, is a notoriously non-specific
indicator of
shock. Elevated pulse rate in a wounded soldier or injured patient may be
impossible to
accurately interpret since "fight-or-flight" responses are a natural
consequence of
battle. More invasive or extensive measurements are not practical during
combat or to
first or early responders in the more conventional ambulance or emergency room
settings. In these settings, it is likely not possible to implement invasive
monitoring
such as, for example, pulmonary artery (Swan-Ganz) catheterization, which
gives
measurements of blood gases and cardiac output. Thus in both military and
civilian
arenas a need exists for small, noninvasive and portable measurement systems.
Non-invasive measurements of blood gases can be made using, for example,
transcutaneous oxygen partial pressure and/or carbon dioxide partial pressure
(PtCO2/CO2). One shortcoming of these measurements is that they rely on a
small
sample size which does not accurately reflect overall tissue condition. In
addition,
probe placement itself on the skin alters its blood flow and physiology.
MHSI data may also be combined with data provided by one or a combination
of the following measurements: skin temperature, core temperature, heart rate,
R-R
interval variability, arterial blood pressure, end tidal CO2, tcP02, cranial
Doppler,
pulse oximetry, laser Doppler, ultrasound, NIR point spectroscopy, nerve
conduction,
cardiac output, stroke volume, central venous pressure, pulmonary artery
pressure,
pulmonary capillary wedge pressure, tissue hydration measurement, blood
chemistry
values such as pH, lactate, to provide additional information to the care
giver, improve
diagnostic accuracy or deliver earlier warning of alteration in physiological
status or
impending shock.
13
CA 02592691 2007-06-28
WO 2006/086085
PCT/US2005/046919
Skin is a particularly good choice for monitoring. In addition to its easy
availability to camera-based technology such as MHSI, there are well
appreciated
responses of the skin microcirculation to shock and to other systemic disease
states. By
monitoring the skin MHSI can track changes associated with a decrease in blood
or red
cell volume due to causes including blood loss, hemodilution, an increase in
tissue
water or shunting blood away from the skin to protect blood flow to central
organs.
Information is also obtained as to the response of the autonomic nervous
system which
has specific impact on the skin microcirculation and can provide additional
information
as to the cause and severity of the insult or disease state and of the body's
response.
This may be different in different disease states, in the different forms of
shock or in
the case of septic shock to specific organisms. Skin measurements taken with
MHSI
can be used to derive information about oxygen delivery, oxygen extraction,
and
hydration level which can secondarily be used to evaluate the physiology
associated
with a variety of disease states such as shock and diabetes.
Oxyhemoblobin (OxyHb), deoxyhemoglobin (DeoxyHb) and water coefficients
can be presented independently as images or as scalars reflecting a mean value
across a
region of interest (ROT), or the oxyhemoblobin and deoxyhemoglobin
coefficients can
be used to calculate hyperspectral tissue oxygen saturation (SHsi02 =
OxyHb/(OxyHb +
DeoxyHb)), total hemoglobin. This information can be presented as black and
white or
false color images, or oxyhemoglobin and deoxyhemoglobin values (or their
combination equivalent to oxygen extraction and delivery) can be presented
together in
a format such as a blood pressure (e.g. XXJYY). This presentation can be used
to
represent oxyhemoglobin and deoxyhemoglobin values for any pixel in the ROI,
to
present the average oxyhemoglobin and deoxyhemoglobin values over the entire
ROT
or over any subsection of the ROT or the oxyhemoglobin and deoxyhemoglobin
values
can be combined by a formula or an algorithm to a single number (e.g.
hyperspectral
shock index). At any of these stages, additional data from the water
coefficient or other
physiological or biochemical values can be added to enhance the utility of the
technique. For example a different color scheme could be chosen to present
OxyHb,
DeoxyHb and water coefficients in a given image, or the scalar value for each
coefficient for a pixel or a region could be presented as XX//YY//ZZ.
14
CA 02592691 2007-06-28
WO 2006/086085
PCT/US2005/046919
For example, the mean of the OxyHb coefficient determined from skin at a
region of interest decreased preceding the onset of shock while the standard
deviation
of this value increased. These trends were observed in both the human LBNP in
pig
hemorrhage experiments. In addition, the hyperspectral shock index, which is
derived
from the mean and standard deviation of the OxyHb coefficient, the blobbiness
index
and the temporal index, was shown to be correlated to the heart rate and lower
body
negative pressure, and reasonably correlated with stroke volume and pulse
pressure.
Using diabetes as an example, the OxyHb/DeoxyHb values are typically around
30/40
for control subjects and 20/50 for subjects with diabetic neuropathy.
Anesthesia may alter control mechanisms for cutaneous blood flow, causing a
dampening of the blood flow oscillations which normally occur in response to
hypovolemia. Hyperspectral images may be different in anesthetized versus
awake
patients, may vary with depth of anesthesia, or may vary with particular
medications
administered. A library of responses under various pharmacologic situations
could be
used to improve results. For example, US Patent 6,640,130 by Freeman et al.,
teaches
the use of extracting information from the plurality of images and spectra
including
thermal measurements by way of multivariate classification algorithms.
Addition of
information relative to patient condition, other hemodynamic or other
parameters,
presumptive diagnosis or therapies administered could improve results.
Braverman and
colleagues described the relationship between the microanatomy of the
cutaneous
circulation and regional heterogeneity in blood flow by laser Doppler
flovvmetry. They
also described synchronicity in cutaneous blood-flow oscillations between
sites on
ipsilateral and contralateral limbs, suggesting that such oscillations are
controlled
centrally by the sympathetic nervous system.
=
Further studies employing MHSI in unanesthetized humans undergoing lower
body negative pressure demonstrated that an increase in regional heterogeneity
in the
region of interest (ROI) of images can be demonstrated by the hyperspectral
measurement of tissue oxyhemoglobin and oxygen saturation (SHs102) and that
changes
in this heterogeneity of the oxyhemoglobin and SHSIO2 is a prominent feature
of the
CA 02592691 2007-06-28
WO 2006/086085
PCT/US2005/046919
response to central hypovolemia, as is a greater change in heterogeneity
between
images collected at different time points.
Thermoregulation is a major function of the cutaneous circulation, and
hypothermia is commonly present in trauma casualties. Treatment is also now
under
development to assist in the early care of patients with hemodynamic
insufficiency and
other medical problems. The relationship between systemic hypothermia and
localized
cutaneous total hemoglobin, oxygen delivery, oxygen extraction and oxygen
saturation
can be defined by MHSI technology. The decrease in mean cutaneous oxygen
saturation (SHs102) and OxyHb values during the hemorrhagic shock study were
not
caused by systemic hypothermia. Core and skin temperature were maintained..
In a separate pilot study, moderate hypothermia (down to 32 degrees Celsius)
did not produce the same mean changes in tissue oxygenation across the ROI
that were
observed with hemorrhagic shock. More significant changes were seen with
deeper
hypothermia (26 degrees Celsius). Possibly, decreased metabolic demands
defended
against desaturation during hypothermia. These experiments were done in
anesthetized
pigs and there may be far different results in awake or anesthetized humans.
Different
parameters and patterns are derived under these circumstances which will be
useful in
monitoring physiologic status under circumstances where hypothermia occurs or
is
induced. MHSI is useful in monitoring the systemic physiology and metabolic
state
associated with hypothermia.
Classically, physicians have used capillary refill as an indication of
systemic
perfusion. Several other patents describe methods that also attempt to give
early
detection of shock.
Shani et al. (U.S. Patent Application Publication No.
20040249290) describe a shock monitoring device which consists of an optical
device
that registers changes in a patient's skin. In that patent, like the physician
pressing the
skin, pressure is briefly exerted on the patient's skin in a periphery. The
time required
for the skin to change from white to back to a pink color is automatically
detected by
the device, giving a measure of capillary refilling time.
16
CA 02592691 2007-06-28
WO 2006/086085
PCT/US2005/046919
As described above, blood pressure measurements are most commonly used to
identify shock-related hypotension. Several recent patents have described
additional
ways of using blood pressure measurements to monitor shock. Sharrock et al
(U.S.
Patent Application Publication No. 20030040675) describe a non-invasive method
for
monitoring the cardiovascular system. In that approach, a pressure sensor is
placed
underneath a blood pressure cuff. "Suprasystolic" measurements are made, i.e.
pressure
measurements made when the cuff pressure is greater than the patient's
systolic blood
pressure. The time series recorded show an initial impulse generated by the
heart beat,
followed by a series of reflections from within the circulatory system. The
patent
describes a method for estimating the degree of vasoconstriction from the
pressure time
series. Data are presented showing that the suprasystolic measurements can aid
in
diagnosis of shock.
A second use of blood pressure measurements is described by Cohen et al. (U.S.
Patent Application Publication No. 2004015816). In that method, a quantity
proportional to cardiac output can be calculated from a blood pressure
measurement by
estimating an overall mechanical resistance for the circulatory tree. Cardiac
output is
clearly an important parameter in identifying the onset of shock, as described
above.
However, because the device estimates a quantity proportional to cardiac
output (rather
than cardiac output directly) the device would presumably require a baseline
measurement for each patient before it could be used to detect the onset of
shock.
Additionally, the numerical value generated by a cardiac output measurement
per se is
not always associated with irreversible hemodynamic derangement, i.e. there is
variability in the response or resilience of a given individual ¨ this is more
easily
quantified and monitored with the multiple parameters available with MHSI.
Similarly, in more chronic conditions such as diabetes or congestive heart
failure, microcirculatory alterations and variations in oxygen delivery and
extraction
can be monitored and can provide useful information as to disease state or
progression
of disease. Also, data related to shock in a given individual may be related
to a given
baseline which reflects diabetes, congestive heart failure or other disease
states that
influence the microcirculation or the skin. With the increasing incidence of
diabetes, an
17
CA 02592691 2013-12-09
understanding of the manifestations of acute shock on a baseline of chronic
diabetes is
imperative. Similarly, congestive heart failure is a chronic condition, but
one in which
the evaluation of cardiogenic, hemorrhagic, septic or other shock could be
particularly
crucial. Again, with a baseline library of congestive heart failure
parameters, the
importance of features seen in such patients in shock is more easily
interpretable. The
approach is based on hyperspectral imaging applications, described in an
earlier patent
by Freeman et al., U.S. Patent 20040236229.
One comment about the approaches described above is that they may in many
cases be complementary to MHS1 measurements. For example, estimates derived
from
blood pressure may give information about the overall circulatory system,
while MHSI
measurements provide a high-resolution image showing local changes of
circulatory
patterns in the skin.
MHS1 is a method of "imaging spectroscopy." Spectroscopy is widely used to
monitor metabolic status in a variety of tissues. For example, spectroscopic
methods
are incorporated in the pulse oximeters described above, which utilize the
different
oxy- and deoxyhernoglobin absorption bands to estimate arterial oxygen
saturation.
Point spectroscopy in the near-infrared range interrogates tissue hydration
along with
the tissue saturation of oxygen in subcutaneous tissue, muscle, and/or brain,
and has
been used for patient monitoring in hemorrhagic shock, in extremity
compartment
syndrome, and following head trauma.
Near-infrared measurements have been used to give a measure of blood
oxygenation that potentially can be used in detecting shock. A recent patent
by Ward et
al. (U.S. Patent Application Publication No. 20040039269), describes a method
of
2.5 shock monitoring that uses ultraviolet, near-ultraviolet and near
infrared resonance
Raman spectroscopy and fluorescence spectroscopy for tissue interrogation. The
present invention teaches, among other things, the use of visible and MR
diffuse
reflectance spectroscopy for the detection of shock that does not require
sensitive
18
CA 02592691 2007-06-28
WO 2006/086085
PCT/US2005/046919
detectors required for collecting weak fluorescence and resonance Raman
signals as
described in Ward et al.
In regard to near-infrared (NIR) and related point spectroscopic measurements,
these spectroscopic approaches do not result in images, and therefore do not
deliver any
information as to spatial distribution of blood flow or microcirculatory
changes which
are important in predicting the body's response to shock. Further, the
hemoglobin
absorption signal is much stronger in the visible range compared to the NIR.
Given
ever-present biological and optical noise, it is easier to quantify the
hemoglobin-related
processes in the visible range (as is done in the proposed MHSI approach) due
to the
higher signal-to-noise ratio. NIR spectroscopy has been primarily developed to
monitor deeper tissues such as muscle and brain. While skin and subcutaneous
measurements can be collected and have been reported, because of the
interoptrode
distances and other technical issues, (perhaps including those related to skin
heterogeneity) these results have been variable, such that these techniques
have yet not
become widely used in clinical practice.
Used for decades in airborne systems for the analysis of geological features,
HSI has recently been applied to biomedicine. The spectrum of reflected light
is
acquired for each pixel in a region, and each such spectrum is subjected to
standard
spectral analysis. This allows the creation of an image based on the chemical
content
of the region of interest (ROI). It has been employed in microscopic studies
of
histologic sections. In vivo, MHSI has been used locally to demonstrate the
macroscopic distribution of skin oxygen saturation in models of ischemia-
reperfusion,
following nitric oxide inhalation and inhibition, and in patients with sickle
cell disease.
One application of MHSI has been in the early prediction of tissue viability
following
plastic surgery: tissue that has insufficient oxygenation to remain viable is
readily
apparent from oxygen saturation maps calculated from near-infrared spectral
images
acquired immediately following surgery. By contrast, clinical signs of
impending
necrosis do not become apparent to the naked eye for 6 to 12 hours after
surgery.
Assessment of tissue viability following burns has also been performed.
19
CA 02592691 2007-06-28
WO 2006/086085
PCT/US2005/046919
MHSI information about the microcirculation has been useful in the evaluation
of regional and systemic microcirculatory changes in people with diabetes and
correlations have been found between MHSI data reflecting regional (e.g. foot
dorsum)
and systemic (e.g. forearm) tissue oxygenation and SHsi02 and diabetic foot
disease and
the risk of developing ulceration. Typical values for SHs102 are 42%, 32% and
28% in
control subjects, diabetic subjects and diabetic subjects with neuropathy
(Greenman et
al. Lancet 2005; 366: 1711). Subjects presenting with neuropathy have a higher
risk for
developing foot ulcers. Nerve function is important in controlling
microcirculation as
evident by the lack of vasodilation in neuropathic diabetics that is commonly
seen
adjacent to injured skin in otherwise healthy individuals.
Described herein is the application of MHSI to the assessment of systemic
disease to meet the substantial need for apparatus and methods for performing
real time
=
or near real time assessment and monitoring of shock in both military and
civilian
arenas at an in-depth level that hyperspectral imaging provides.
As embodied and broadly described herein, the present invention is directed to
methods and apparatuses for assessing an array of physiologic parameters
including the
delivery and extraction of oxygen and water delivery to tissue (including
skin, and the
mucosa or serosa of various organs) and local tissue response to the adequacy
of this
delivery by hyperspectral or multispectral imaging in real time or near real
time.
The invention described herein uses hyperspectral or multispectral imaging as
a
noninvasive and generally although not necessarily, noncontact means of
monitoring
changes in tissue and the microcirculation (here described for obtaining
images from
the skin, but is not limited to the skin) that are indicative of systemic
physiology
including the state preceding shock or occurring during shock (whether
hemorrhagic,
hypovolemic, cardiogenic, neurogenic, septic or other shock states). Changes
in
microcirculation can also be indicative of other physiological states or
derangements as
described herein, and as a means for providing indicators for monitoring
therapy or the
adequacy of resuscitation and patient survivability. Unlike conventional
methods, the
MHSI approach employs an imaging system, and is capable of displaying and
drawing
CA 02592691 2007-06-28
WO 2006/086085
PCT/US2005/046919
attention to changes in the circulatory patterns in the skin and the changes
in these
changes. One specific type of change, mottling, is known to be a symptom of
shock.
The invention is applicable in military, critical care and chronic disease
management arenas where there are microcirculatory or tissue oxygenation
changes
associated with shock, diabetes, infection, sepsis, dehydration, hypothermia,
hypoxia,
low gravity environments, congestive heart failure, hypertension, hypotension
or other
physiologic derangement, when the assessment of physiologic state or of the
response
or potential response to therapy is advantageous. Shock represents one end of
the
spectrum as an example of acute microcirculatory pathology. Diabetes
represents the
other end of the spectrum, and is associated with slower, more chronic changes
which,
however, are also reflected in microcirculatory changes.
The instruments and methods of the invention may also be applied to many
forms of shock and other acute and chronic conditions in which physiologic
monitoring
for screening, assessment, diagnosis, early warning, monitoring of therapy or
assessment of survivability is useful. In addition to or instead of the
microcirculatory
changes associated with local response to the mismatch of oxygen delivery and
oxygen
extraction and changes in hydration that we can observe with hemorrhagic
shock, we
anticipate other specific findings associated with other forms of shock which
can also
be identified, assessed and quantitated by hyperspectral imaging. For example,
in
septic shock, the presence of a variety of inflammatory mediators influences
the
rnicrocirculation. These microcirculatory changes are in turn identified and
monitored
using our MHSI techniques. This allows specific information as to the onset or
progression of infection or shock or the monitoring of the efficacy of
antibiotics,
intravenous fluid administration, pressor agents to treat hypotension or acute
cardiac
decompensation (such as dopamine or neosynepherine), or other forms of
therapy. The
observed microcirculatory changes are also useful in determining the causative
organism(s), which can be associated with idiosyncratic tissue signatures.
In other chronic conditions MHSI can be used to derive spatial and spectral
data
from the tissues to provide information relating to indications for
administration of
21
CA 02592691 2011-10-31
particular therapies and for monitoring such therapies. This includes use of
MHSI
measurements to assist the physician in treating patients with conditions such
as
hypertension or congestive heart failure and provide useful information which
can
assist in decisions relative to the use of specific antihypertensive or after
load reducing
agents. Here, patients can be selected for specific therapeutic regimens or
therapies can
be monitored with MHSI. Additional uses include monitoring native tissue
or
wounded tissue in the face of steroid therapy. Another use include monitoring
for
systemic effects of neurological defects.
Another iteration is an advanced metabolic monitor for ICU and critical care
purposes to define adequacy of metabolic support and tissue oxygen delivery
and
extraction. This is especially useful to determine combined adequacy of
ventilatory and
circulatory support to optimize care and adjust therapy. Another use is to
assess
adequacy of ventilation. In patients with damaged lungs, sometimes over
ventilation or
over oxygenation can contribute to tissue damage and prolong hospital stay or
even
lead to poor long term outcome or death and it would be useful to determine
the
minimum amount of ventilator support truly required to maintain adequate
tissue
oxygenation and ventilation. This can be determined by monitoring the levels
of
oxygen delivery and oxygen extraction as derived from measurements of tissue
oxyhemoglobin, tissue deoxyhemoglobin, and/or by using information provided by
both of these measurements, with or without the addition of information as to
the water
content of monitored tissue (e.g. skin, mucous membrane or other tissue). This
is also
useful in determining the need for pulmonary drugs including bronchodilators,
surfactants, etc.
Hyperspectral imaging of patients exposed to biological or chemical agents
permits simple implementation by non-professional staff for rapid use in the
field,
clinic and hospital settings without the necessity for prior patient
preparation or
. subsequent lab work. In one embodiment, using spectral and spatial data of
biologically
relevant compounds, MHSI is used to identify physiologic changes to evaluate
infection of individuals or populations either in association with sporadic
infection or in
an epidemic. In these settings MHSI provides a useful tool for triage,
screening,
22
CA 02592691 2007-06-28
WO 2006/086085
PCT/US2005/046919
diagnosis, determining therapy, monitoring of therapy, monitoring disease
progression
or resolution. In relation to possible exposure to chemical and biological
warfare
(CBW) agents, MHSI determines the likely pathogen/class responsible and
evaluates
the extent of exposure, progression of disease and effectiveness of treatment.
A rapid,
low-cost, non-invasive screening tool that differentiates between pathogen
classes
permits assessment of key portions of the population during an epidemic.
Locally, MHSI can evaluate the "take" of a variety of immunizations such as
smallpox using a combination of oxyhemoglobin and deoxyhemoglobin and water
data
images to facilitate diagnosis. At some level, all pathogens lead to
microcirculatory
changes andthe body itself acts as a "bioamplifier" in that it mounts immune
responses
that include localized or disseminated cutaneous manifestations. The response
itself
can be interrogated to detect subtle changes that indicate exposure to a
bioagent. A
characteristic effect of the bioagent on the organism as a whole can be
relatively
dramatic and produce a larger "signal" for detection, in contrast to the more
difficult
task of identifying a few small bacteria or virus particles in situ. Through
leveraging
this natural response, in one embodiment, MHSI is useful as a screening tool
to
evaluate those at risk of infection in a natural epidemic or biowarfare
scenario.
Beyond the CBW applications, hyperspectral technology more widely offers the
capability for relating local information to systemic pathophysiology in the
setting of
infection. Rapid and accurate determination and classification of infection
would
benefit a wide group of patients ranging from patients immuno-compromised due
to
HIV or chemotherapy to elderly or very young patients presenting in septic
shock. By
distinguishing between classes of infectious organisms, MHSI can assist in
determining the initial choice of antibiotic regimens or assist in the
diagnosis between
viral gastroenteritis and appendicitis. In another iteration, MHSI is designed
to assess
less profound metabolic alterations and the sequelae of chronic diseases such
as
diabetes. Diabetic patients are at high risk for limb loss secondary to
atherosclerotic
peripheral vascular disease or diabetic foot ulceration and would benefit
greatly from a
device which could detect spreading or systemic sequelae of infection at an
early stage.
In the face of a chemical or biological exposure, MUST can be used to rapidly
and accurately assess the hemodynamic status of wounded or affected
individuals.
23
CA 02592691 2007-06-28
WO 2006/086085
PCT/US2005/046919
Local changes in either OxyHb and DeoxyHb and H20 or any combination of these
parameters can be used to assess the physiologic state of a victim potentially
exposed to
a chemical or biological agent. Given specific changes related to an immune or
inflammatory, cardiovascular or neurological or other response, severity of
exposure,
identification of agent, duration of exposure, severity of response and other
parameters
useful to the care giver can be assessed and followed over time. MHSI can
provide a
non-contact means of obtaining a useful "vital sign" to assess patient
condition without
the need to touch the patient or remove any protective gear. Cumbersome
chemical bio-
warfare (CBW) personal protective gear may prevent medical personnel or first
responders from the access required for standard assessment of casualties who
may also
be wearing CBW gear. Taking a pulse or measuring blood pressure is often
impossible.
Any device placed in contact with a potentially contaminated individual may
also be
contaminated and may not be able to be reused without onerous cleansing
measures or
disposable covers. Therefore, use of MHSI as a remote sensing technology to
provide
physiologic and hemodynamic assessment in such circumstances is highly
advantageous. Also, preferred is a sensing technology that will see through
portions of
the CBW gear such as clear plastic faceplates or other such windows in the
gear, or
directly through opaque fabrics and other such materials.
In one embodiment, the proposed invention could provide trauma triage by
providing a "vital sign" reporting critical casualty information to the
battlefield medic
encumbered by chem/bio protective clothing. A resulting MHSI algorithm for
delivering information which could be interpreted as a novel "vital sign"
measurement
would inherently identify the measures required in order to provide the most
effective
casualty care and remote triage. This invention also provides the medic with a
greater
decision making capability for prioritizing casualty care based on otherwise
unavailable
information about live/dead status, severity and progression of the injury and
which
injuries require life saving interventions.
In one embodiment, a personal digital assistant (PDA)-like device carried by
the
battlefield medic might have a single button that could be pushed even with
protective
gloves on to take a HSI image and provide a numerical read out or even more
simply, a
24
CA 02592691 2007-06-28
WO 2006/086085
PCT/US2005/046919
simple visual code (green, yellow, red) of a downed soldier's medical status.
MHSI
could reduce combat mortalities by enabling combat medics in CBW gear to: 1)
commence triage within moments after a soldier is wounded; 2) receive more
accurate
information of wound severity and progression to shock; and 3) optimize
available
treatment and evacuation. Finally, since the killed-in-action rate for
battlefield medics
(even absent CBW concerns) has been as high as double that of infantryman, HSI
could
be instrumental in reducing risk to the combat medic by providing early
identification
of dead or unsalvageable soldiers and particularly in the chem/bio arena by
permitting
non-contact and more remote measurements.
In one preferred embodiment, MHSI is used to provide a hand-held, robust,
turnkey system for near-real time information based on a combination of
spatial and
spectral data. Designed for use as a stand-off tool, this embodiment requires
minimal
operator dexterity is required and the device is operable by an end-user in
CBW attire.
Optimally, a battlefield or CBW agent detection device would provide
information
from a great distance with a remote or local light source, but at the very
least, an
operating distance of even inches would provide significant advantage over an
assessment requiring individual contact. Monitoring of an exposed hand or the
eye/cheek region through a standard gas mask could provide the surface
necessary for
physiologic evaluation. Hyperspectral imaging can be used as a stand-off
device as a
non-contact vital sign monitor (e.g., non-contact diagnostic or vital sign)
for use by a
provider wearing CBW protective clothing to predict metabolic embarrassment
and
impending hemodynamic collapse and at various distances and in cases where
access to
the victim is difficult CBW protective clothing.
In one preferred embodiment, MHSI provides localized spatial and spectral data
as described that is used in judging the vasodilatation accompanying
anesthesia and the
potential use of vasoconstrictive agents such as neosynepherine to offset
effects of
either general anesthesia or regional (e.g. spinal) anesthesia on systemic or
lower body
vasculature.
CA 02592691 2007-06-28
WO 2006/086085
PCT/US2005/046919
In another preferred embodiment, a portion of the proposed invention is
attached by a nonconstricting arm band or other fixation device to the body
for
stabilization and to facilitate multiple readings over time. Image data or
calculated
results can be sent by wire or electronically to a distant monitor. Another
embodiment
could provide a method of fixing the imager near or lightly touching the
tissue to obtain
image data from skin or from oral, rectal or bladder mucosa or other tissue.
In one embodiment, preferably with a specific diagnostic protocol, the
proposed
invention can assess the adequacy of pulmonary and circulatory function
following a
pulmonary embolus.
In another embodiment, preferably with a specific diagnostic protocol, the
proposed invention can assist in the evaluation and management of chronic
anemia,
leukemia or other cancers in assisting the determination of the adequacy of a
low
hematocrit to meet the metabolic requirement of end organ tissue (such as
skin).
In another embodiment, preferably with a specific diagnostic protocol, the
proposed invention can assist in the evaluation and management of
chemotherapeutic
agents and the side effects thereof.
In another embodiment, preferably with a specific diagnostic protocol, the
proposed invention can assist in the management or evaluation of systemic
manifestations of organ rejection following cardiac or renal transplant.
Given the unique spectral signature of carbon monoxide, in one embodiment,
MHSI is designed to assess and report carbon monoxide levels for use in
diagnosing
and monitoring patients following potential or real carbon monoxide exposure
and to
assist in the determination of tissue levels of carbon monoxide and in
monitoring and
adjusting therapy.
One embodiment of the proposed invention is tailored for use in the screening,
diagnosing evaluating and monitoring of trauma or burned patients who have
either
circulatory or ventilatory compromise or both.
26
CA 02592691 2007-06-28
WO 2006/086085
PCT/US2005/046919
One embodiment of the proposed invention is tailored for use monitoring
patients with fevers or infections. Given the inflammatory and vasoactive
responses
with microcirculatory consequences, MHSI is used to monitor the ordinary
response to
a variety of organisms or the response of patients that are immunosuppressed
with
chemotherapy or intrinsic disease (e.g. AIDS).
One embodiment of the proposed invention is tailored for use to identify the
need for transfusion and when the red cell volume or blood volume has been
replaced
adequately.
Because of its capability to measure hemoglobin and hemoglobin breakdown
products, the proposed invention is useful for evaluating new blood substitute
products
and for monitoring their use in the clinical setting. This could range from
determining
adequacy of oxygen carrying capacity in the circulating blood to following
with
MHSI' s spectral and spatial features, the potential extravisation of the
substitute from
the capillaries or small vessels.
One embodiment of the proposed invention is tailored for use in the
determination of whether to give volume and what kind (e.g. blood or
crystaloid)
versus pressor agents such as epinephrine to a hypotensive patient.
One embodiment of the proposed invention is tailored to select
antihypertensive
therapy in cases of acute or chronic hypertension and monitoring efficacy.
One embodiment of the proposed invention is tailored for drug development or
in the selection or assessment of patients for clinical trials as a research
tool or patient
selection and monitoring of any drug or drug candidate that has an influence
on tissue
microcirculation or hydration.
While we have primarily focused on readings from skin, similar instrumentation
(with different front end optics and data pre-processing specific to the
tissue and site
under evaluation) are used and data analysis could be performed from data
obtained
from other sites such as buccal, bladder, rectal, esophageal, nasopharyngeal
or other
mucosa, nail bed, ear lobe, palmar or plantar skin, or the serosal surface of
internal
27
CA 02592691 2007-06-28
WO 2006/086085
PCT/US2005/046919
organs. Imaging systems and probes to obtain appropriate images could be
specifically
designed for each location. These measurements could be taken either at
intervals or
continuously and recorded for static measurements or for trending information.
By revealing changes in tissue hydration, total hemoglobin, oxygen delivery,
oxygen extraction, SHsi02 or circulatory patterns that correlate with adverse
outcomes,
the MHSI approach is additionally able to provide information about patient
survivability, shock state, physiology, hydration status, capability to
compensate for
volume loss, type of shock, organism or class of organism responsible in
infection or
septic shock, and efficacy or adequacy of therapy. Water content in the tissue
is also
useful in this determination and is incorporated with total hemoglobin, oxygen
delivery,
oxygen extraction, SHs102 or circulatory pattern or temporal shift data or
used
independently to deliver early information relative to shock or an index which
can be
correlated with other useful hemodynamic parameters. Data and algorithms can
be
built around each of following three types of data: 1) just visible MHSI with
a) oxy and
spatial information or b) oxy and deoxy and spatial info or c) SHs102 with
spatial info
can be used, d) mean change with oxy, e) mean change with SHst02, 2) just
infrared
MHSI data with mostly water and some deoxy information as mean across ROT, and
3)
any combination of 1 with 2
In general terms, the invention uses an imaging system to acquire a multi-
dimensional "hypercube" of data describing a region of the skin or other
tissue. This
could be composed of many wavelength bands or at least 2 bands that help to
provide
spectral information across the ROT. The hypercube contains information about
optical
absorbance as a function of spatial dimensions, wavelength, and time. These
data can
be processed to yield an estimate of the abundance of chemical species as a
function of
spatial location and time. For the purposes of shock monitoring, images of the
abundance of blood oxyhemoglobin and deoxyhemoglobin are particularly useful.
These abundance images can be used to estimate tissue blood volume.
In healthy young individuals and in experimental animals, in the absence of
shock, skin oxygenation appears relatively homogeneous across a given ROT.
During
28
CA 02592691 2007-06-28
WO 2006/086085
PCT/US2005/046919
various types of shock, several types of response can occur, either separately
or
concurrently, of these, four are described in more detail herein. First,
shifts in the range
and overall levels of quantities such as OxyHb, DeoxyHb and water in the
tissue can be
seen. Second, mottling of the skin may be observed. Mottling is a result of
vasoconstriction which causes the OxyHb and DeoxyHb levels to become uneven
across the skin. Regions of relatively higher and lower tissue oxygenation are
seen,
giving a mottled appearance. Third, the location of these regions can shift
over time in
response to changing constriction of the vasculature (temporal shift). Fourth,
there is
the appearance of new circulatory patterns in response to shock, some of which
appear
to be correlated with poor outcomes. In older and diabetic patients, there is
a greater
degree of baseline heterogeneity and a lower mean level of OxyHb and SH02.
The present invention exploits the responses described in the last paragraph
by
using image processing techniques to generate a series of metrics. These
metrics,
described herein, include the average and the spread of levels in an image,
measures of
mottling, and measures of how rapidly the skin changes over time. These
metrics are
either used separately or combined together to derive an index that gives an
early
indicator of shock. Image processing methods are used to highlight circulatory
features
that are believed to be indicative of patient survivability. The HSI system
uses an image
processing technique to display gradients present within the ROI based on
derived
profiles of chemical concentrations. Derived scalar values that correlate with
a given
physiological state can also be presented.
First, the method used for acquiring HSI data, registering the images, and
estimating relative abundances of chromophore is described. Second, algorithms
for
processing the images to detect overall, large-scale changes in the
hyperspectrally
derived quantities are derived. Third, image processing algorithms for
detecting and
evaluating local heterogeneity in the skin are derived including spread within
the
variable-size ROI. Fourth, mottling and patterned features of the skin are
derived.
Fifth, changes in mottling patterns over time are derived. Finally, methods
for
detecting features in the image that may indicate likely patient outcomes or
the severity
of the shock response or physiological derangement are described.
29
CA 02592691 2007-06-28
WO 2006/086085
PCT/US2005/046919
Accordingly, one embodiment of an appropriate HSI apparatus is described
before the five processing steps.
Medical Hyperspectral Imaging System
In one embodiment, FIST data is presented in a very intuitive form by pairing
a
HSI pseudo-color image with a high quality color picture composed from the
same HSI
data. The identification and assessment of the region of interest (ROT) is
easily
achieved by flipping between color and HSI images or merging these images, and
can
be enhanced by zooming in on the ROI for enhanced resolution and additional
information. The images can be seen on a computer screen, projector or heads-
up-
display, and/or stored and transported as any other digital information,
and/or printed
out. The presented image reflects the high resolution of the hyperspectral
imager and
can be improved with upgraded hardware. Alternatively, the data can be
presented as
single scalar numerical values for the entire ROI, any given pixel or selected
region
within the ROT. In this embodiment, preferably, oxygen delivery and oxygen
extraction
data can be presented in the form of XX/YY. Similar to a blood pressure and
easy to
understand, such a measurement carries both oxyhemoglobin and deoxyhemoglobin
information but gives a more complete picture than a single scalar variable,
since each
of the two components carries specific information. If water is also presented
it can be
presented as X.X/YY/ZZ.
Due to the complexity of the biological system, medical personnel want to have
as much information as possible about a given case in order to make the most-
reliable
diagnosis, but need it to be reduced to a form amenable for facilitating
decision making.
MHSI provides additional information to the doctor that is not currently
available and
can be used along with other clinical assessments to make this decision. MHSI
provides images for further analysis by the human; initially results can be
compared to
a lookup table. Ultimately, a computer algorithm can be used that
automatically
matches the results to the outcome expected from the lookup table.
Additionally, HSI transcribes vast multispectral or hyperspectral information
into one image which nresents complex data via millions of color shades which
CA 02592691 2007-06-28
WO 2006/086085
PCT/US2005/046919
represent fine gradations in a gradient map. The particular color and distinct
shape of
features in the pseudo-color image allow discrimination between tissue types
such as
tumor, connective tissue, muscle, extravasated blood, and blood vessels. MHSI
also
allows the near-real time differentiation of tumor grade that will be useful
in making
appropriate medical decisions.
MHSI main purpose is the collection and presentation of physiologically
relevant data in an easily interpretable numerical, image or other format in
order to: 1)
expand human eye capabilities beyond the ordinary; 2) expand the human brain
capabilities by pre-analyzing the spectral characteristics of the observable
ROI; 3)
perform these tasks with real or near-real time data acquisition. The aim of
the
algorithm is assist the human to diagnose and assess the condition of the
observable
subject.
MHSI is successful because it carries more information than visual imagery,
using the spectral data of reflected electro-magnetic radiation (ultraviolet -
UV, visible,
near infrared - NIR, and infrared - IR), and since different types of tissue
reflect,
absorb, and scatter light differently, the hyperspectral cubes contain enough
information to differentiate between tissue conditions. Here local tissue
conditions are
used to collect data that is relevant to the systemic condition or physiology
of the
individual or organism. MHSI is robust since it is based on a few general
properties of
the spectral profiles (e.g. slope, offset, OxyHb, DeoxyHb, and water);
therefore it is
relatively flexible with respect to spectral coverage and is not sensitive to
a particular
light wavelength. MHSI is fast, because it uses fast image processing
techniques that
allow superposition of absorbance, scattering (derived from slope and offset),
and
oxygenation information in one pseudo-color image.
An image cube can generally be collected in under a minute, but typically in a
short period of time. The simplicity of image processing techniques allow for
the
display of results in real-to-near-real time. MHSI is easily interpretable
since it can
deliver an image where color differences reflect a gradient map of the
concentration of
different substances that reflect different tissue types, metabolism,
physiologic state or
31
CA 02592691 2011-10-31
condition. The distinction is graded and not binary. In addition, the color
and the shape
of structures depict different composition, physiology or metabolism or the
level of
viability of the tissue in the ROI.
A portable MHSI apparatus according to an embodiment of the invention is
depicted in Figure 1. Portable apparatus 10 weighs less than 100 pounds,
preferably
less than 25 pounds, and more preferably less than 10 pounds. Preferably, the
portable
apparatus may be battery operated or more preferably, may have a connector
adapted to
connect to an existing power source.
Portable apparatus 10 comprises an optical acquisition system 36 and a
diagnostic processor 38. Optical acquisition system 36 comprises means to
acquire
broadband data, visible data, ultraviolet data, infra-red data, hyperspectral
data, or any
combination thereof. In a preferred embodiment, optical acquiring means
comprises a
first-stage imaging optic 40, a spectral separator 42, a second-stage optic
44, and an
imaging sensor 46. There may be one or more subsystem 36s present, for example
a
single subsystem 36 could be built around either a visible or NIR LCTF.
Alternatively,
there may be one subsystem 36 built around a visible LCTF and one around a NIR
LCTF. There may be one subsystem 36 which has an LCTF which accommodates both
visible and NIR wavelengths or there may be one subsystem.
Alternatively, optical acquiring means may be any acquisition
system suited for acquiring broadband data, visible data, ultraviolet data,
infra-red data,
hyperspectral data, or any combination thereof. Preferably, one or more
polarizers 41,
43 are included in the acquisition system to compile the light into a plane of
polarization before entering the imaging sensor.
If the spectral separator 42 does not internally polarize the light, the first
polarizer 43 is placed anywhere in the optical path, preferably in front of
the receiving
camera 46. The second polarizer 41 is placed in front of illuminating lights
(20) such
that the incident light polarization is controlled. The incident light is
cross-polarized
32
CA 02592691 2007-06-28
WO 2006/086085
PCT/US2005/046919
with the light recorded by the camera 46 to reduce specular reflection, or
polarized at
an angle to vary intensity of the reflected light recorded by the camera.
Illumination is provided by the remote light(s) 20, preferably positioned
around
the light receiving opening of the system. The light can be a circular
array(s) of
focused LED lights that emit light at the particular wavelengths (or ranges)
that are
used in the processing algorithm, or in the ranges of wavelengths (e.g.,
visible and/or
near-infrared). The circular or substantially circular arrangement of the
light sources in
one or many circles surrounding the light receiving opening provides even
illumination
that reduces shadowing. The light wavelength selectivity reduces the total
radiation
onto the skin, and therefore reduces the effect of the observation on the
observing
subject. Particularly in the infrared regions, this can lead to less of a
thermal effect on
the skin and maintain the tissue in a more normal condition.
Although the preferred embodiment describes the system as portable, a non-
portable system may also be utilized. Preferably, an optical head is mounted
to the wall
of the examination room. In another embodiment, the system has a portable
table with
an observational window overlooking the operating site.
The first-stage optic receives light collected from a tissue sample through a
polarizer and focuses the light onto the surface of the spectral separator.
Preferably, the
spectral separator is a liquid crystal tunable filter (LCTF). The LCTF 42 is a
programmable filter that sequentially provides light from selected wavelength
bands
with small (for example, 7-10 nm) bandwidth from the light collected from the
sample.
The second-stage optic 44 receives the narrow band of light passing through
the
spectral separator and focuses the light onto the image sensor 46. The image
sensor is
preferably, although not necessarily, a two-dimensional array sensor, such as
a charge-
coupled device array (CCD) or complementary metal oxide semiconductor (CMOS)
detector, which delivers an image signal to the diagnostic processor 38.
The diagnostic processor 38 includes an image acquisition interface 50, that
has
an input responsive to an output of the image sensor 46 and an output provided
to a
general-purpose operating module 54. The general-purpose operating module
includes
33
CA 02592691 2011-10-31
routines that perform image processing, and that operate and control the
various parts
of the system. The general-purpose operating module also controls the light
source(s)
(e.g. LED array) allowing for switching on and off during measurement as
required by
the algorithm. The general-purpose operating module has control output
provided to a
filter control interface 52, which in turn has an output provided to the
spectral separator
42. The general-purpose operating module also interacts with one or a number
of
diagnostic protocol modules 56A, 56B, . . . 54N, and has an output provided to
a video
display. The diagnostic process includes special purpose hardware, general-
purpose
hardware with special-purpose software, or a combination of the two. The
diagnostic
processor also includes an input device 58, which is operatively connected to
the
general-purpose operating module. A storage device 60 and printer 62 also are
operatively connected to the general-purpose operating module.
In operation, a portable or semi-portable apparatus is employed near a target,
e.g., volar forearm or other general area of interest. An operator begins by
selecting a
diagnostic protocol module using the input device. Each diagnostic protocol
module is
adapted to detect particular tissue characteristics of the target. In an
alternative
embodiment, the apparatus may contain only one diagnostic module adapted for
general medical diagnosis.
Diagnostic processor 38 responds to the operator's input by obtaining a series
of
transfer functions and an image processing protocol from the selected
diagnostic protocol
module 56. The diagnostic processor provides the filtering transfer functions
to the
spectral separator 42 via its filter control interface 52 and then instructs
the image
acquisition interface 50 to acquire and store the resulting filtered image
from the image
sensor 46. The general-purpose operating module 54 repeats these filtering and
acquiring
steps one or more times, depending on the number of filter transfer functions
stored in the
selected diagnostic protocol module. The filtering transfer functions can
represent band
pass, multiple band pass, or other filter characteristics and can include
wavelengths in
preferably the UV, preferably the visible, preferably the NIR and preferably,
the IR
electromagnetic spectrum.
34
CA 02592691 2013-12-09
In a preferred embodiment, the light source delivering light to the ROI can be
filtered, selected or separated as opposed to filtering or selecting the
returned light
collected by the detector. Thus, a tunable
source delivers the information.
Alternatively, both a tunable source and a tunable detector may be utilized,
Such
tuning takes the form of LCTF, acousto-optical tunable filter (AOTF), filter
wheels,
matched filters, diffraction gratings or other spectral separators. The light
source may
be a fiber optic, but is preferably a light emitting diode (LED) (see K. .Gono
et al.,
"Appearance of enhanced tissue features in narrow-band endoscope imaging"
Journal
of Biomedical Optics, 9(3):568-77, 2004).
This use is highly novel and is based on not just using LEDs as a broad
light source, but rather specifically selecting LEDs to provide illumination
specific for
the chromophores of interest in a way such that the wavelength selector is no
longer
needed. LEDs and other system parameters could be selected to provide
information
about any compound with appropriate spectral characteristics in the
wavelengths
measured by the device, whether as a medical device or a device used in other
applications such as environmental, food process control, pharmaceutical
process
control, geologic, military etc.
In one embodiment, such a device would be particularly well suited for use on
the end of an endoscope, more preferably a disposable endoscope or other
device where
a low cost, proximal light source (as opposed to a distant source with a
fiberoptic
delivery system) would be an advantage.
The proposed instrument could be used as part of a remote device for either
medical or other applications in an endoscope, laparoscope, baroscope or other
rigid or
flexible device for internal examination of the body or the internal surface
of any
structure such as an industrial pipe, or hard to reach location within
machinery in order
to augment available diagnostic or other data. In the case of an endoscope,
laparoscope, boroscope or other rigid or flexible device for internal
examination of the
body or the internal surface of any structure such as an industrial pipe, or
hard to reach
location within machinery, the LED system described could be positioned at the
operator end of the scope and transmitted to the end by fiber-optics.
Alternatively,
CA 02592691 2007-06-28
WO 2006/086085
PCT/US2005/046919
small LEDs could be positioned at the end of the scope for direct illumination
of the
ROT. In medical applications, such a scope could be used to assess systemic
shock
similar to skin readings presented here, or regional ischemia such as ischemic
colitis or
local disease such as cancer or polyps. Projection of the HSI image back onto
the tissue
facilitates diagnosis and targeted biopsy.
In another embodiment, the HSI instrument could be placed on a robot for
remote sensing. In another application, lenses could be configured to collect
data from
a distance. LEDs, lasers or other illumination sources with long distance
penetration or
ambient light such as the sun can be used to illuminate the target. Any of
these could
be used independently, or different kinds could be used combined to deliver
the total
light used during data collection.
In such preferred embodiment, the HSI instrument is used as a non-contact
remote means of assessing physiologic status in extreme environmental
conditions
simulated during hypovolemia induced lower body negative pressure. Preferably,
vital
signs are monitored by a non-technical provider wearing chemical/biological
warfare
(CBW) protective clothing to protect metabolic embarrassment and impending
hemodynamic collapse. Such system is advantageous in CBW.
Light could be collected from the skin of a person or the surface of an object
through any substance transparent or partially transparent to the wavelengths
being
utilized. One embodiment of this could be for patient assessment through a
protective
mask used for protection from potentially harmful chemical or biological
agents.
In another embodiment, whether with LED system or other (e.g. filter based)
system employed, transmitted light as opposed to reflected light would be
collected
through a relatively thin piece of tissue such as a webspace between the
fingers or toes
or the ear lobe or cheek. In another embodiment a translucent, transparent or
semitransparent film or other substance could be place on the skin to filter
both
illumination and reflection.
36
CA 02592691 2013-12-09
In another embodiment, the system and method could be utilized or adapted to
record information from the skin or other tissue with the light source coming
from
tissue chemolurninescence, phosphoresecence, or fluorescence either intrinsic,
or
associated with an injected or applied fluorophore or phosphor. Such light
emitting
compounds could either be static or dynamic based on extant conditions,
varying with
temperature, moisture, pressure This would allow for better spatial resolution
of deeper
tissues. In another embodiment a specific absorber (such as indocyanine green,
nanoparticles) or reflector of light (such as intralipid or microspheres)
could be injected
or applied.
The unique cooling illumination provided by the LED prevents overheating of
skin or other tissue which may result in poor image resolution. Preferably,
the LED
provides sufficient light while producing minimal or no increase or a small
known
increase in skin or tissue temperature. This lighting system in combination
with the
polarizer allows adequate illumination while preventing surface glare from
internal
organs and overheating of skin or other tissue under examination.
Once the image acquisition interface 50 has stored images for all of the image
planes specified by the diagnostic protocol chosen by the operator, the image
acquisition interface begins processing these image planes based on the image
processing protocol from the selected diagnostic protocol module 56N.
Processing
operations can include general image processing of combined images, such as
comparing the relative amplitude of the collected light at different
wavelengths, adding
amplitudes of the collected light at different wavelengths, or computing other
combinations of signals corresponding to the acquired planes. The computed
image is
displayed on the display 12. Other preferred embodiments include storing the
computed image in the storage device 60 or printing the computed image out on
printer
62 (see U.S. Patent No. 4,885,634).
In an alternative embodiment, diagnostic protocol modules 56, printer 62,
display 12, or any combination thereof, may be omitted from portable device
10. In
this embodiment, acquired images are stored in storage device 60 during the
medical
37
CA 02592691 2007-06-28
WO 2006/086085
PCT/US2005/046919
procedure. At a later time, these images are transferred via a communications
link to a
second device or computer located at a remote location, for example, hospital
medical
records, for backup or reviewing at a later time. This second device can have
the
omitted diagnostic protocol modules, printer, display, or any combination
thereof. In
another embodiment, the stored images are transferred from portable device 10,
located
in the clinic, via a communications link to a remote second device in real
time.
In one embodiment, a numerical hyperspectral shock index is presented to an
operator. This could be related to other vital signs which are also presented
by the
device or could be presented as the sole measurement. In an alternative
embodiment,
the data is reduced to a simple set of instructions or indicators. For
example, based on
the data, the device could simply show a green light for healthy, yellow light
for needs
resuscitative therapy and a red light for uncorrectable physiologic
derangement.
In a preferred embodiment the system correlates the HSI data with the real
source of presented data in real time or near-real time via a heads up display
(HUD) or
via projection. Preferably HSI projects real-time hyperspectral data onto the
region of
interest, or viewing window. The projected information has precise one-to-one
mapping to the illuminated surface (e.g. wound, operating surface, tissue) and
provides
necessary information in an efficient manner. When projected onto an overhang
viewing window preferably, the images (real-color and/or pseudo-color) can be
zoomed
in/out to provide variable magnification. This subsystem consists of the
following
elements: 1) image projector with field-of-view precisely co-aligned with the
field-of-
view of the hyperspectral imager, 2) miniature remote control device which
allows the
operator to switch the projected image on and off without turning from the ROI
and
change highlight structure and/or translucency on the projected image to
improve
visibility of the features of interest as well as projected image brightness
and intensity,
3) real-time data processing package which constructs projected image based on
hyperspectral data and operator/surgeon input, 4) optional viewing window
positioned
above the ROI that is translucent for real observation or opaque for
projecting pseudo-
color solution or higher resolution images.
38
=
CA 02592691 2007-06-28
WO 2006/086085
PCT/US2005/046919
To achieve precise co-registration between hyperspectral image and ROI, the
system performs a self-alignment procedure as necessary. The system projects a
sequence of calibration pattern on the operating surface using projector and
reads them
using hyperspectral imaging system. Calibration software processes acquired
data and
stores them. Processed data are further used by projection system to achieve
high-
precision mapping to operating surface and compensate for surface relief.
Such a projection system or the simpler camera system could also be utilized
to
evaluate the level of local tissue compromise or regional ischemia either
because of
local trauma, vascular compromise (i.e. where the leg is viable, needs
vascular
reconstruction or is not salvageable beyond a femoral artery injury). Regional
or local
vascular compromise could be on top of systemic aberrations due to shock,
diabetes,
congestive heart failure, etc. The projector could be used to determine level
for
amputation or assist with the geometry of a plastic surgical flap
reconstruction.
In another preferred embodiment, the hyperspectral system consists of a
visible
and NIR light sensor (camera), a lens tuned for visible and NIR wavelengths,
illuminator with light controller, and computer running system control, data
acquisition
and preprocessing software as depicted in Figure 2. The illuminator preferably
consists
of one or more sets of LEDs with different spectral properties of the
emission. Each set
has its own central emission wavelength and emission bandwidth. More
preferably,
each set includes LEDs distributed in a circular pattern around the lens,
allowing for
uniform illumination at each sp'ectral point. Each set of LEDs is powered on
and off by
an "Illuminator Controller" controlled by the computer. Preferably, to
decrease the
effect of ambient light, the difference in intensity between two images is
measured.
One image is taken when a particular LED set is powered on, and the other
image is
taken when the set is powered off. Another preferred embodiment involves two
apparatus of the invention, one with narrow band LEDs and the other with a
filter.
An exemplary embodiment of a measurement sequence is as follows: turn first
LED set on and acquire data turn off the LED set and acquire data; turn second
LED set
on and acquire data, turn second LED set off and acquire data; turn third LED
set on
39
CA 02592691 2007-06-28
WO 2006/086085
PCT/US2005/046919
and acquire data, turn third LED set off and acquire data; and so on as
desired. The
data, images of the object, are taken while illuminated by every set of LEDs
in
subsequent turns. Central emission wavelengths and bandwidth of LED sets are
selected specifically such that combinations of images of the object taken as
described
above allow the calculation of the concentration of oxygenated and
deoxygenated
hemoglobin, and concentration of water in the tissue. Preferred central
emission
wavelength and bandwidths of LED sets are selected as follows:
Set number Central wavelength (nm) Bandwidth (nm)
1 529 +/- 10 7 (3-20)
2 542 +/- 10 20 +/- 10
3 562 +/- 10 45 +/- 30
4 577 +/- 10 15 +/- 10
5 960 +/- 20 20(5-50)
6 980 +/-20 20 (5-50)
To calculate concentrations of oxygenated, deoxygenated, and total
hemoglobin, a linear combination and/or their ratio of images recorded from
LED sets
1-4 is used. The intensities of LED sets 2 and 4 are adjusted in such way that
the
resulting emission spectra closely correspond to the absorption spectra of the
oxygenated hemoglobin. The intensity of LED set number 3 is adjusted according
to
the absorption spectra of the deoxygenated hemoglobin at a similar
concentration. The
intensity of LED set number 1 is adjusted according to both, oxy- and
deoxyhemoglobin spectra.
Preferably, intensities of the LEDs are set in house according to particular
spectra. It is preferred that illumination intensity modulated to mimic
spectra of
deoxyHb and oxyHb. Variations may span from 1 to 100 nm, or more, but
preferred
variations are from 5 to 30 nm or from 10 to 60 nm.
Duration or exposure time varies according to sample. Accordingly, there is a
learning or teaching aspect involved with each sample. For instance,
characteristics of
a skin sample including, but not limited to, hair, pigment and tone vary
exposure time
necessary for adequate signal-to-noise level of data. For an acceptable signal
from
darker skin, exposure time is usually longer than for fairer skin.
CA 02592691 2007-06-28
WO 2006/086085
PCT/US2005/046919
To calculate the concentration of water and its changes with time, a linear
combination and/or their ratio of images recorded from LED sets 5-6 is used.
The
intensities of LED sets 5 and 6 are adjusted according to the absorption
spectra of water
at a concentration similar to the hemoglobin.
The light source preferably includes a polarizer disk in front of the LED
lights
that is cross-polarized (or at an angle) with its central disk that covers the
lens.
However, other embodiments may exclude the polarizer disk.
In another embodiment, the HSI system employs a liquid-crystal tunable filter
(LCTF), placed in front of a standard lens and digital camera. By varying the
voltage
across the LCTF, the wavelength of light admitted to the camera is varied.
During
image acquisition, a hypercube of images, each at a separate wavelength, is
generated
(preferably at 5-20 nm intervals across 500 to 600 nm). Then, the visible
light
spectrum for each pixel in the hypercube is compared by linear regression to
standard
spectra for oxyhemoglobin (OxyHb) and deoxyhemoglobin (DeoxyHb). The resulting
fit coefficients for OxyHb and DeoxyHb are used to calculate SHsi02 values for
each
pixel in the ROI. The mean values for OxyHb, DeoxyHb, and SHs102 across the
ROI
are calculated. Gray-scale SHs102 pictures of the ROI are also generated, in
which the
brightness of each pixel is proportional to its value.
Visible HSI provides improved signal-to-noise ratio over near-infrared
spectroscopy for the measurement of hemoglobin spectra, since the hemoglobin
absorption signal is much stronger in the visible than in the near-infrared
range. While
most of the NIR HSI information pertains to water content in the tissue, OxyHb
and
DeoxyHb information is also present. Utility of near-infrared point
spectroscopy has
been shown in its ability to provide information about sub-surface tissue
oxygenation,
for example in brain or muscle, and which derives from the increased tissue
penetration
of near-infrared light. By contrast, visible light spectroscopy, employed in
preferred
embodiments, interrogates hemoglobin saturation at a more superficial level,
most
likely within dermal capillaries. Thus, using HSI information from either
visible and
near infrared HSI together or visible HSI combined with NIR point spectroscopy
41
CA 02592691 2007-06-28
WO 2006/086085
PCT/US2005/046919
provide potentially complementary information about different tissue beds, the
visible
light reporting on more superficial tissue and the NIR on deeper tissue.
Comparing
visible and NIR HSI data from a particular location may deliver useful
information as
to shock or regional or local tissue physiology. Further embodiments of the
invention
detect IR thermometer and IR themomatrix to record surface temperatures at the
same
time with VIS and/or NIR measurements.
The preferred embodiments and devices of the present invention allow for the
creation and unique identification of patterns in data that highlight the
information of
interest. The data sets in this case may be discrete images, each tightly
bounded in
spectra that can then be analyzed. This is analogous to looking at a scene
through
various colored lenses, each filtering out all but a particular color, and
then a
recombining of these images into something new. Such techniques as false color
analysis (assigning new colors to an image that don't represent the true color
but are an
artifact designed to improve the image analysis by a human) are also
applicable.
Optionally, optics can be modified to provide a zoom function, or to
transition from a
micro environment to a macro environment and a macro environment to a micro
environment. Further, commercially available features can be added to provide
real-
time or near real-time functioning. Data analysis can be enhanced by
triangulation with
two or more optical acquisition systems or rotation or movement of a single
system.
Polarizers may be used as desired to enhance signatures for various targets.
In addition to having the ability to gather data, the present invention also
encompasses the ability to combine the data in various manners including
vision fusion,
summation, subtraction and other, more complex processes whereby certain
unique
signatures for information of interest can be defined so that background data
and
imagery can be removed, thereby highlighting features or information of
interest. This
can also be combined with automated ways of noting or highlighting items,
areas or
information of interest in the display of the information.
The hyperspectrally resolved image in the present invention is comprised of a
plurality of spectral bands. Each spectral band is adjacent to another forming
a
42
CA 02592691 2011-10-31
continuous set. Preferably, each spectral band having a bandwidth of less than
50 nm,
more preferably less than 30 rim, more preferably less than 20 nm, more
preferably,
from about 20 ¨ 40 nm, more preferably, from about 20 ¨30 nm, more preferably,
from
about 10 ¨ 20 nm, more preferably from about 10 ¨ 15 nm, and more preferably
from
about 10 ¨ 12 nm.
It is clear to one skilled in the art that there are many uses for a medical
hyperspectral imager (MHSI) according to the invention. The MHSI offers the
advantages of performing the functions for such uses faster, more
economically, and
with less equipment and infrastructure/logistics tail than other conventional
techniques.
Many similar examples can be ascertained by one of ordinary skill in the art
from this
disclosure for circumstances where medical personal relies on their visual
analysis of
the biological system. The MHSI acts like "magic glasses" to help human to see
inside
and beyond.
Data acquisition and data pre-processing
The first step in the invention is the creation of a hyperspectral data set
from the
measurements taken: the acquisition of the hyperspectral data cube, or
hypercube. A
region of the patient's skin or other tissue is selected for imaging, and a
series of
images are collected while illuminated by light at different wavelength ranges
preferably (but not necessary) in turns with acquisitions without
illumination.
Preferably, the wavelength region used is between 450 and 1200 nm. In a
preferred
embodiment, the wavelengths collected include portions of the spectrum that
provide a
good discrimination between blood oxyhemoglobin and blood deoxyhemoglobin, or
approximately 500-600 nm. In another preferred embodiment, the system also
collects
wavelengths, from a portion of the spectrum where water is highly absorbent,
approximately 950-1100 nm as well as those that provide a good discrimination
between blood oxyhemoglobin and blood deoxyhemoglobin, or approximately 500-
600
nm. A "data image" associated with each separate wavelength band is collected.
Data
images from the spectral region are digitized using a recording camera,
preferably a
43
CA 02592691 2007-06-28
WO 2006/086085
PCT/US2005/046919
CCD or CMOS camera, and are recorded, forming a three-dimensional "data cube"
(2
spatial dimensions and one wavelength frequency dimension).
Preferably, once a full set of spectral data images is acquired, the scanning
process is
repeated at a frequency sufficient to detect changes in metabolic status.
Sequential data
images are then collected into a four-dimensional "hypercube" (2 spatial
dimensions by
one wavelength frequency dimension and one time dimension).
Preferably, during the image collection, specified active illumination is
provided. An important aspect of the illumination is that it should not result
in
substantial heating of the patient's skin or tissue. Preferably, as part of
the data
collection, an image is taken of a white reflector affixed to the subject's
skin. This
provides a calibration image that is used to calibrate for uneven illumination
effects and
provides a reference for calculating optical absorption.
The data pre-processing described herein is preferably performed by the MHSI
system and more preferably it is part of a shock diagnostic module. Such a
module
could be automatic in the device or could be selected by the operator from a
menu of
modules for different applications. Preferably, different diagnostic modules
all relevant
to shock could also be in place for choice by the operator under different
patient
conditions, environmental conditions or other circumstances.
While not necessary, preferably any of the following pre-processing steps are
implemented and more preferably, they are all implemented as described.
Preferably, the first step in data pre-processing is removing the ambient
light
contribution and evaluating reflected intensity per unit time. This is
performed by
subtracting an image recorded without the LED or other administered light from
an
image recorded with the light, for each wavelength set. The resultant image is
normalized by the exposure time that is preferably the same for both images,
with and
without the administered light:
HSI Intensity = Intensity with light/exposure time ¨ Intensity without
light/exposure
time
44
CA 02592691 2015-03-25
Preferably, this is performed for the ROT or a portion of the ROT. More
preferably, it is
performed for each pixel or region of pixels. Preferably, under weak ambient
light
conditions, the correction for dark noise, read-out noise, background
radiation, and
similar distortion sources is performed instead.
Preferably, the second step in data pre-processing is to calculate optical
absorption as a decimal logarithm of the ratio of the derived normalized HSI
image
intensity to the reference normalized intensity recorded off the white
reflector:
Absorption = log jo(HSI Intensity/Calibrator Intensity)
This is performed for each pixel or region of pixels. Preferably, the
Calibrator Intensity
is recorded during data acquisition and/or prior and stored in the HSI system
for
subsequent data pre-processing.
Preferably, the third step in data pre-processing, is to,perform image
registration
at each time step. Registration causes the images acquired at different time
to be
translated, rotated and scaled such that distinctive features in the images
captured at
each moment lie at the same spatial location in each image. Image registration
is
especially important for patients in or near shock, as the patient may move
due to pain
and discomfort or involuntarily. If desired, a calibrator or small
registration mark may
be applied to the skin to provide a distinctive feature for registration
algorithms. The
problem of image registration is discussed in more detail by Freeman et al. in
U.S.
Patent Application 20040236229.
Once images are captured and pre-processing is completed, preferably, the next
step in data processing is to decompose the data to provide an estimate of the
chemical
signatures present in each pixel of the image. This decomposition step
requires, in
addition to the hyperspectral data, a reference spectrum for each chromophore
(i.e.
tissue or fluid) of interest. For example, spectra captured for blood
oxyhemoglobin,
blood deoxyhemoglobin, and water can be used in the decomposition process (see
Figure 3).
CA 02592691 2015-03-25
If hyperspectral data were recorded using the system with a light separator
(Figure 1), each pixel in the hypercube has skin absorption spectra (somewhat
similar
to the spectra in Figure 4). The decomposition process then can be generally
framed as
a constrained optimization problem, in which the relative abundance of each
chemical
species is estimated subject to constraints on the physically possible range
of
abundance values (Keshava, N, A survey of spectral umnixing algorithms,
Lincoln
Laboratory Journal, 14(1):55-78 (2003)). However, a straightforward and robust
decomposition can be obtained using a least-squares solution (for each pixel
or a region
of pixels):
S,(2) = c1,1Oxylih(2)+ e, . Deoxylib(2)+ e3;i147citer (2) + (.44 x /1+ c 5,1 2
-
The decomposition results in the output images of estimated abundance for each
of the
chemical species considered (in the example above, ci and c,-) are images for
oxy and
deoxyhemoglobin concentrations, whereas c3 is for the water). The slope and
offset are
denoted by c4 and c5, respectively.
In the embodiment where hyperspectral data is recorded using the system with
specifically selected and/or modulated light (Figure 2), the data images
recorded with
light from each LED set represent the concentration of chromophores integrated
over
that wavelength range. For example, when the white reflector is illuminated
with the
LED sets 2 and 4 (that are preferably chosen and modulated to mimic or
partially
mimic the oxyhemoglobin absorption spectra), the recorded data image
represents the
HSI system response to illumination, integrated over the entirety of the LED
set 2 and 4
wavelength range. When the skin is illuminated with the LED sets 2 and 4, the
recorded data image differs from the data image acquired off the calibrator by
the
amount of skin oxyhemoglobin absorption integrated over the entirety of the
LED set 2
and 4 wavelength range. The skin data image referenced to the calibrator data
image
has information on skin absorption due to oxy-hemoglobin in addition to slope
and
offset components. Similar steps are taken with illumination with the LED set
3, where
the skin absorption due to deoxyhemoglobin in addition to slope and offset
components
is recorded. The skin response to the LED set 1, where both oxy- and
46
CA 02592691 2015-03-25
deoxyhemoglobin have same absorption under similar concentrations, determines
the
total hemoglobin concentration in the skin. Difference between data images
from sets
46A
CA 02592691 2007-06-28
WO 2006/086085
PCT/US2005/046919
1, 2, 3, and 4 allows the elimination of the slope and offset spectral
components and the
identification of the oxy- and deoxyhemoglobin concentrations. And finally,
the skin
response to LED sets 5 and 6 and the difference between the two, determines
the water
concentration and allows the assessment of tissue hydration levels.
Data from any or all of the described LED sets may be utilized to evaluate a
given physiological state. Or any or all of the described LED sets may be used
in
combination with other spectral separation techniques to collect data in
similar or other
parts of the spectrum. For example, a visible LCTF system could be used in
concert
with an LED system similar to LED sets 5 and 6 to augment information provided
by
the visible spectrum such as hemoglobin with infrared data regarding water
concentration.
For the present invention it is preferred that at least tissue oxyhemoglobin
and
deoxyhemoglobin be calculated or estimated (other quantities such as water
abundance
can also be utilized). Denoting these estimated abundances as OxyHb and
DeoxyHb
respectively, the blood total hemoglobin (THb) can be found from:
THb = OxyHb + DeoxyHb.
Relative tissue oxygen saturation (Sii5i02) can be found from:
SHSIO2= OxyHb / THb*100.
Note that these quantities (THb and SHsi02) are by-products of the
hyperspectral
decomposition, and are calculated as they have relevance to similar
measurements that
are commonly referenced in the medical literature. Also, the hyperspectrally-
derived
data images may be clipped to remove extreme values. Smoothing with a low-pass
filter (such as a Gaussian filter) may be used to enhance the data image
before metrics
are calculated from the data image.
Next, in one application of the invention to the assessment of shock, an index
that
reflects clinical signs of shock or impending shock are derived. Additional
steps of
analysis are performed across all or a portion of the ROT, including but not
limited to
47
CA 02592691 2011-10-31
calculation of a mean index, heterogeneity index, mottling index, temporal
index, and
combinations thereof. Preferably any or all of the first three algorithms that
follow are
used to derive these shock related indices. A fourth algorithm describes
likely patient
outcomes or the severity of the shock response: reversible versus irreversible
shock.
Algorithms
The first algorithm quantifies the markers that reflect clinical signs of
shock that
are characteristic to the entire image, or.to the entire ROI, e.g mean and
spread of the
hyperspectral measurement across all or a selected portion of the ROI. For
example, an
early clinical sign of hemorrhagic shock is a drop in the total blood volume
and
therefore to the blood supply and blood oxygenation in the skin, particularly
in the
peripheral parts of the body. This results from both blood loss and the body's
attempt
to compensate for shock, hypovolemia or blood loss by restricting blood flow
to
peripheral parts of the body. This often leads to an overall drop in the
amount of total
blood and of oxygenated blood available to the areas being imaged during
patient
monitoring of shock. Conversely, associated with low flow to the skin there is
greater
extraction of oxygen from the limited amount of blood available and hence a
relative
increase in deoxyhemoglobin. Given the total decrease in all forms of
hemoglobin, this
relative increase in deoxyhemoglobin may lead to either an increase, decrease
or
similar levels of total deoxyhemoglobin prior to or in association with the
onset of
shock.
To derive mean values for a given ROI, changes in the overall quantities of
blood and/or tissue oxygen delivery, oxygen extraction, oxygen saturation,
total
hemoglobin, or water content can be calculated directly by calculating
quantities such
as the mean, median, or fixed percentile measure of values on the
hyperspectral data
image. For this application a single number is derived from each component
data
image. The advantage of a data image over a point measurement for this case is
that
the integration provided by the large number of points being averaged results
in a more
accurate estimate.
48
CA 02592691 2015-03-25
Figure 5 shows data results from an example porcine subject. Histograms are
formed for hyperspectrally-calculated images of oxygen saturation taken at
baseline
and during shock. The histograms show that the reduction in the mean value of
the
oxygen saturation provides a cue as to circulatory shock for this subject.
Figure 6 shows data results from an example human subject. The total
hemoglobin drops precipitously prior to collapse.
If circumstances permit, it is possible to obtain baseline readings from the
patient when he is clearly not in a state of shock. In this case, changes in
average
oxygenation, etc. may be referenced to the baseline state. When possible, use
of a
baseline is beneficial as it helps to remove patient-to-patient variations.
Even without a
baseline, trending of sequential measurements can provide important
information. In
emergency settings it may not be possible to obtain a baseline, and judgments
about
shock detection are made on raw (un-normalized) quantities or referred to a
standard
baseline derived from multiple other individuals.
The water content, evaluated from the skin absorption in the NIR region (950-
1100 nm) changes as a human subject undergoes reduction in the lower body
pressure.
Figure 8 shows that water concentration in tissue drops by nearly 10 percent
prior to
collapse. Similar to total Hb and the standard deviation of oxygen saturation
measured
in the visible range, water is also one of the most effective markers that
predict shock
since significant change occurs well before the collapse (10 minutes in this
case).
Water is measured in near IR, which is more favorable in the battlefield.
In addition to the changes in the mean values of components: hemoglobin, oxy-,
deoxy, Sit5107 and 1-170 in the data images, the spread and/or standard
deviation in the
component data images change. These changes relate to the increased presence
of
heterogeneous patterns in skin oxygen delivery/extraction and hydration in
association
with shock or hypovolemia.
Figure 7 shows data results from an example human subject. The heterogeneity
in the S1 151O2 images rises prior to hemodynamic collapse.
49
CA 02592691 2007-06-28
WO 2006/086085
PCT/US2005/046919
The second algorithm quantifies the markers that reflect clinical signs of
shock
and are related to more localized changes in oxygen delivery/extraction, e.g.
mottling
of the skin. Unlike point measurement of oxygenation, hyperspectral imaging is
able to
capture information about these mottling patterns. The presence of mottling
can be
detected and the mottling patterns can be characterized using a variety of
image
processing algorithms. Four separate methods for detecting and evaluating the
mottling
and its changes are described below.
As a first method to assess mottling, the size of mottling pattern can be
determined. As mentioned earlier, the heterogeneity of the entire HSI image
increases
as shock approaches. nears. Measures of the increased heterogeneity, such as
the
standard deviation (std) or percentile-based measures of the spread (c.f. the
difference
between 75th and 25th quartile values of the image) can be evaluated at
regions of
smaller size. When the region of interest is comparable to the mottling
pattern size, the
spread within the region could drop (compare to the increased std over the
entire
image), reflecting homogeneity within the mottling area. The change in
heterogeneity
as a function of ROT size can be used to evaluate size of the mottling
patterns.
As a second method for characterizing mottling, the mottling size and shape
can
be characterized using a measure of image complexity. Preferably this could
utilize
area-to-perimeter measurements for regions with high values. More preferably,
the
data images described above (oxygenation, etc.) can be processed via image
processing
techniques to yield a binary image describing "high" and "low" regions of the
response.
This binary image can be created using several approaches. In one embodiment,
edge
detection approaches are used to identify regions of interest. These edges are
then
filled in to form a binary image. In a second embodiment, the image is first
filtered to
remove low-frequency variation. A threshold for the filtered image is then
determined,
using Otsu's method or comparable threshold techniques. The threshold is used
to
identify "high" and "low" regions in the binary image.
Once a binary image is created, the area and summed perimeter of all "high"
regions can be found. The ratio of these parameters gives a measure of
mottling. If
CA 02592691 2007-06-28
WO 2006/086085
PCT/US2005/046919
large, "blob-like" mottled regions exist in the imaged area, they will tend to
have lower
perimeter ¨ to ¨ area ratios. If the imaged area is relatively homogenous,
"high" and
"low" regions will tend to be small, corresponding to small regions of
excursion from
the local background. Thus the average perimeter ¨ to ¨area ratio for these
smaller
regions is less than in a mottled subject.
As a third method for characterizing mottling, image filtering can be used to
enhance contiguous regions that deviate significantly from the mean. This
approach
takes advantage of two aspects of mottling; first, that mottled regions often
have
oxygenation or other values that differ significantly from the mean, and
second, that
mottled areas are typically larger rather than smaller. In the approach, a
binary image
is first formed that identifies all pixels in the hyperspectral image that
differ from the
mean by more than a user-specified amount. As an example, regions can be
identified
that are either 1) greater than the mean plus some multiple of the standard
deviation or
2) less than the mean plus some multiple of the standard deviation. The method
does
not explicitly require use of the mean; for example, deviation from a low-
frequency
filtered version of the image may be used. This first binary image identifies
regions
with extreme values. As a second stage, the binary image is filtered to remove
pixels
that are not connected to at least N other pixels, where N is a user-selected
parameter
chosen to represent the smallest physiologically reasonable size for a mottled
area.
This second step results in a binary image of connected pixels that differ
significantly
from the mean, i.e. mottled regions. The area of all such regions is then
summed to
yield a metric representing the degree of mottling in the image. An example of
this
method is shown in Figure 9.
As a fourth method for characterizing mottling, the degree of mottling change
over time in a data image or an image of physiological parameters (such as
blood
oxygenation or saturation, or hydration state) is evaluated. This approach
exploits the
fact that the physiological parameters being imaged by the hyperspectral
system change
dynamically as the body attempts to compensate for shock. Skin mottling
patterns shift
to protect tissue viability in regions of vasoconstriction and these shifts
occur more
rapidly in advance of or with the progression of shock.
51
CA 02592691 2007-06-28
WO 2006/086085
PCT/US2005/046919
Preferably, two parameters are derived to measure mottling variability,
"blobbiness" and "temporal". To characterize these, the hyperspectral image is
preferably converted to a 3-value image of "high", "low", and zero values (see
top raw
of plots in Figure 10, where green is zero, red and blue correspond to "high"
and "low"
values in SHsi02, correspondingly). Each plot in the raw corresponds to a
particular
time within the experiment, starting with baseline and progressing toward
shock (image
before last with the LBNP=-90) with the last image is back to equilibrium. The
blobbiness represents the blob size, and it is calculated as sum of red and
blue pixels,
and is reduced to one number that is increasing with time towards collapse
(green line
in the lower panel, Figure 10).
The temporal parameter that measures mottling variability is based on
comparison between two sequential images of any or all of the HSI-measured or
derived quantities. Preferably, these include but are not limited to OxyHb,
DeoxyHb,
THb, SHs102, water and single wavelength images,) either independently or in
combination. More preferably, it includes but is not limited to OxyHb and
DeoxyHb
data images. The image later in the sequence is registered to the the
previous, then
subtracted from the previous (or vice versa) and the resulting image is
analyzed. As an
example of such an analysis, here the areas with little change (e.g. less than
1 standard
deviation) are assigned to zero (dark blue in the second raw of plots in
Figure 10). The
areas that have a positive change (e.g. increasing oxygenation) are colored
with the
shades of red while the negatively changed areas (e.g. reducing oxygenation)
are in
shades of blue. The areas (both, positive and negative) are then scaled with
their
maximal amplitude and summed over the entire image. Thus, the temporal
variability
in mottling is reduced to a single number that can be plotted as a function of
time (see
blue line in the lower panel in Figure 10). In many instances, an increase in
temporal
component (blue line) precedes an increase in the blobbiness component (green
line).
The level of temporal and blobbiness components provides a measure of how
rapidly
the subject is reacting when attempting to compensate for shock, and is an
indicator of
physiological stress. Preferably one or more of these four methods are
utilized to assess
mottling. More preferably, more than one of these methods are combined to
calculate a
52
CA 02592691 2007-06-28
WO 2006/086085
PCT/US2005/046919
mottling index. Most preferably, blobbiness and temporal methods are combined
to
calculate a temporal mottling index.
The third algorithm for detecting shock combines the two previously described
algorithms: the entire image analysis and the local mottling analysis. All
markers
quantified above that reflect clinical signs of shock are reduced to single
values that
change with time depending on physiological and metabolic state of the
subject. Linear
and non-linear compilation of these data approximates a HyperSpectral Shock
Index
(HSSI) measurement for the particular subject. As an example, using a relative
HSSI
scale where a measurement > 1 is considered to be an index of shock, evidence
of
impending vascular collapse can be seen on a plotted graph using peaks and
falls.
HSSI acts as a very sensitive metric of circulatory regulation and goes up
when there is
an initial systemic compromise due to rising LBNP level and then back down as
compensatory mechanism occurs.
The final algorithm describes methods for detecting features in the image that
may indicate likely patient outcomes or the severity of the shock response:
reversible
versus irreversible shock. Previously described herein, measurements support
early
detection of shock, by uncovering homogeneous changes and mottling of the
skin.
Studies to date have also shown that hyperspectral images, by revealing
changes in the
microcirculatory patterns in the skin, can give cues as to patient
survivability. Figure
11 shows example hyperspectral oxyhemoglobin images for a porcine subject
before
bleed (left panel, 27 minutes prior), during shock (62 minutes after the first
bleed), and
post resuscitation (2 hours after the first bleed). The subject had developed
large,
rapidly changing mottling patterns that were associated with alternating high
and low
oxyhemoglobin levels. The circulatory pattern has recovered post resuscitation
(compare third and first image in Figure 11). Another animal subject (Figure
12) had
developed a distinctive "feathery" pattern in the SHsi02 images. This pattern
developed
in many of the test subjects that either died during the procedure or did not
exhibit
strong recoveries to the test procedure, and appears to indicate a higher
likelihood of an
unfavorable outcome. Presenting such a cue to medical personnel could be of
great
value.
53
CA 02592691 2015-03-25
The feathery pattern seen in Figure 12 can be detected by using image
processing approaches to detect eck. Ls and features in the image that may be
"feathery".
In addition to the methods characterizing mottling described above (spread
value for
different size ROI, area-to-perimeter ratio, ratio of short to long axis in
the mottling
blob), another possible implementation can be applied. An image template can
be
constructed that resembles either the entire feathery feature, or a sub-
section of it (for
example, a single branching). Scaled and rotated versions of this template can
be
correlated against the hyperspectral image to generate "match" scores.
Presence of
high match scores in a region of the image can be taken to be an indication of
the
presence of "feathering" in the image, and will result in an alert being given
to the
medical personnel. This image processing approach is similar to that described
by
Delanoy, RL et al. (Toolkit for image milling: user-trainable search tools,
Lincoln
Laboratory Journal, 8:145-60 (1995)) but has not been previously applied to
hyperspectral detection of shock, assessment of survivability, assessment of
adequacy
of resuscitation or other evaluation of physiologic state.
The following examples illustrate embodiments of the invention, but should not
be viewed as limiting the scope of the invention.
Examples
First a target ROT is selected, preferably this is localized tissue , and more
preferably a patch of skin and most preferably a patch of skin that is
relatively hairless
and relatively flat such as the forearm. Other potential sites of preference
include the
cheek, thigh, deltopectoral region. In an alternate embodiment, the localized
tissue is
buccal mucosa, rectal mucosa, bladder mucosa, intra abdominal serosa or other
tissue
available for imaging. We then collect spectral data from the ROI or a portion
of the
ROI at a pre-specified distance or at a distance that is measured or estimated
or
recorded. Preferably this is less than 10 feet and more preferably between six
and 36
inches, and most preferably between 12 and 18 inches.
54
CA 02592691 2015-03-25
In another embodiment, the preferred distance is between 0.1 and 6 inches,
more
preferably between 0.5 and 2 inches. In another embodiment, the preferred
distance is
between 10 feet and 1000 feet, morn preferably between 10 and 300 feet and
more
54A
CA 02592691 2007-06-28
WO 2006/086085
PCT/US2005/046919
preferably between 10 and 100 feet. In each instance, preferably adjustment of
the
optics to provide the appropriate resolution is undertaken. Preferably data is
collected
with automatic zoom optics. In another embodiment a fixed focal length is
required by
the system. In another embodiment manual adjustment of the optics is utilized
to obtain
the desired field of view and resolution for the image. Preferably,
prespecified optical
settings are used or the automatically or a manually selected optical setting
is measured
or estimated or recorded either automatically or manually. Preferably image
stabilization methods are utilized. One or a series of images is obtained. If
more than
one image is obtained, sequential images can be collected at a prespecified
interval, or
at an interval that is measured or estimated or recorded. Preferably
sequential
measurements will be collected at between 10 milliseconds and one hour. More
preferably measurements will be collected at between10 millisecond and 10
minute
intervals. Most preferably, measurements will be collected at between 10
milliseconds
and 1 minute intervals. In another embodiment, measurements will be collected
preferably between 1 millisecond and one minute, more preferably at between
lmilliseconds and 1 second.
Preferably the instrument is configured as a free standing device that is
fixed to a
moveable cart, table, wall or ceiling fixture. More preferably it is a small
hand held
device.
In another embodiment, it is in whole or in part mounted in or with other
optical
equipment such as binoculars or the sighting of a gun.
In another preferred embodiment, the device will be maintained in close
approximation to the body. More preferably, the relationship between the
device and
the body will be maintained as relatively fixed. Most preferably, a
nonconstrictive band
can fix a portion of the device in a position above the skin for continuous or
intermittent readings.
Relevant spectral data is collected from one or more images of the ROT.
Preferably
between 1 and 1000 wavelength bands are collected, more preferably between 2
and
100 bands and yet more preferably between 2 and 60 bands and most preferably
CA 02592691 2007-06-28
WO 2006/086085
PCT/US2005/046919
between 2 and 25 bands. In another embodiment, preferably between 2 and 10
bands
are collected and more preferably between 3 and 5 bands are collected.
Preferably the
spectral region from which data is collected is between 450 and 1200
nanometers.
Hemorrhagic Shock
Changes in cutaneous oxygen saturation (SHm02) following chest trauma and
hemorrhage were observed which were not evident to the naked. eye, but which
produced hyperspectral images with a pronounced mottling pattern. Image
intensity of
Siisi02 images of the skin decreased during hemorrhagic shock in a porcine
model,
indicating a decrease in oxygen saturation in the skin.
Seventeen female Yorkshire pigs (9 in the hemorrhage group and 8 in the
control group), weighing 36.4 + 0.11 kg were used. The animals were
quarantined for
one week and were fasted overnight prior to the procedure.
Animals were premedicated with 250 mg IM Telazol. After induction of
anesthesia with isoflurane delivered through a mask, they were incubated, and
were
placed on a Datex-Ohmeda anesthesia ventilator with a tidal volume of 10m1/kg
and a
respiratory rate of 12/min. The rate was adjusted to achieve normocapnea
(PaCO2 =
35-45 mm Fig). Anesthesia was maintained with a mixture of isoflurane (2-2.5%)
and
room air. Percutaneous sheath introducers were inserted into the carotid
artery and
external jugular vein bilaterally, and a 10 F Foley catheter was inserted into
the urinary
bladder. A splenectomy was performed via a midline laparotomy. The splenic
artery
was tied off before splenectomy to allow drainage of blood from the spleen
into the
circulation. An infusion of lactated Ringer's solution (LR) at 1.5 times the
spleen
weight was administered immediately after the splenectomy. At the end of
surgery the
isoflurane was decreased to 0.6% and an infusion of ketamine (250-350
fig/kg/min)
was begun. The ketamine-isoflurane anesthesia was continued until the end of
the
study. Depth-of-anesthesia assessment and anesthetic dose adjustments were
made as
needed. Core temperature was maintained between 37-39 C by means of an
external
heating pad.
56
CA 02592691 2007-06-28
WO 2006/086085
PCT/US2005/046919
A flow-directed pulmonary artery catheter was inserted via the external
jugular
vein introducer sheath to permit measurement of mixed venous blood gases and
core
temperature. One of the carotid arterial introducer sheaths was used for
measurement
of the arterial blood pressure (ABP). Clinical pressure transducers were used.
The
heart rate was obtained from the electrocardiogram. Regional skin temperature
was
monitored on both hind limbs using thermocouples.
The experimental schedule is given in Table 1. After a postoperative
stabilization period (1-2 hours), baseline data were collected. The animals in
the
hemorrhage group (HEM, n=9) then underwent withdrawal of blood through the
carotid line with a syringe. Three withdrawals, each 10 ml/kg, were performed
at a
constant rate of 1 ml/kg/min. Blood was collected into a bag containing CPDA
anticoagulant. Each of the three 10-mM hemorrhage periods was followed by a 15-
min
observation period. Following the third observation period, the animals were
resuscitated with intravenous infusion of LR at 1.5 times the shed blood
volume. The
duration of the LR resuscitation period was 25 min. Additional fluid to exceed
the
initial resuscitation volume was then administered as needed to return the
heart rate and
blood pressure toward baseline values. The 25-min LR infusion period was
followed by
a 30-min observation period, and then a 25-minute period during which the shed
blood
was reinfused. The animals were observed for an additional hour thereafter and
then
were euthanized. Blood and LR were infused using a fluid warmer. HSI images
were
obtained of the inner hind limb throughout.
Animals in the control group underwent similar surgical preparation and
received a maintenance LR infusion at 100 ml/hour. Data were obtained at the
following time points: baseline, after each 10 ml/kg blood withdrawal, after
LR
resuscitation, and after blood reinfusion.
Blood withdrawal resulted in an early drop in systolic arterial pressure,
which
became statistically significant during the first withdrawal, and which
remained
decreased until after LR resuscitation. Heart rate increased with blood
withdrawal,
57
CA 02592691 2007-06-28
WO 2006/086085
PCT/US2005/046919
although in delayed fashion¨becoming significant only during the second bleed;
it
returned to control levels after reinfus ion of shed blood.
All HEM animals showed a decrease in mean SFEI02 with blood loss; these
changes became significant after the 3rd bleed. They were evident on the gray
scale
SHsi02 pictures, but not to the naked eye. Decreases in HSI OxyHb, as well as
in
arterial base excess and mixed venous saturation of oxygen, were significant
after the
2n1 bleed. These changes were all reversed by resuscitation.
The mean intensity of both SEBIO2 and OxyHb images of the skin, obtained by
hyperspectral imaging in the visible wavelength range, decreased during
hemorrhagic
shock and were restored during resuscitation in the anesthetized pigs. These
changes
roughly paralleled those observed in several invasively obtained variables, to
include
the systolic arterial pressure, the arterial base excess, and the mixed venous
saturation
of oxygen. However, the lack of tight correlation is expected, given that HSI
provides
additional information about hemodynamic. s and physiologic condition and may
be
associated with HSI providing earlier information as to hemodynamic compromise
and
impending collapse.
Figure 5 shows data results from an example porcine subject. Histograms are
formed for hyperspectrally-calculated images of oxygen saturation taken at
baseline
and during shock. The histograms show that the mean value of the oxygen
saturation
provides a cue as to circulatory shock for this subject.
Oxygen saturation images in which the brightness of each pixel is
proportionate
to the intensity of the SHsi02 for that pixel. Both baseline images, and
images obtained
during the third post-bleed period, are included. The decrease in image
intensity is
evident on these images. Qualitatively, some animals, but not all,
demonstrated an
increase in mottling during shock, also evident on the oxygen saturation
images.
Neither of these changes was evident to the naked eye. Quantitatively, the
mean-gray-
scale intensity for these SHsi02 images decreased linearly with blood
withdrawal,
becoming significantly decreased in comparison with control animals after the
third
bleed, and restored to control levels by resuscitation.
58
CA 02592691 2007-06-28
WO 2006/086085
PCT/US2005/046919
The mean value of the OxyHb fit coefficient for the ROT also decreased
linearly
with hemorrhage, but it showed an earlier statistically significant decrease,
after the
second bleed, which was also restored by resuscitation. Meanwhile, the mean
DeoxyHb Et coefficient for the ROT appeared to trend upward during and after
the third
bleed, but these changes were not significant. As a rough index of the degree
of
mottling present, the standard deviation of the gray-scale histogram of the
oxygen
saturation images appeared to increase with hemorrhage, but this was not
statistically
significant. Laser Doppler imaging demonstrated a linear decrease in skin
blood flow
for the ROT with blood loss, which became significant after the third bleed
and which
was reversed by resuscitation.
Linear regression was performed to examine the possible relationship between
mixed venous saturation of oxygen and SHs102. This analysis demonstrated a
linear
relationship, with a relatively low r2 of 0.12 (p < 0.001, df = 114).
Correlation with the
systolic arterial pressure was similar (r2 = 0.14, p < 0.001, df = 202).
Although the
laser Doppler image intensity appeared to follow a time course similar to that
of SH5102,
there was no relationship between the 2 variables on linear regression (r2 =
0.01, p =
0.312, df = 112).
The shock monitoring approach described in this patent utilizes hyperspectral
imaging. In this technique, a two dimensional image is created that has
spectral data
inherent in each individual pixel. In a preferred embodiment, the spectrum of
each
pixel is correlated with the presence and concentration of various chemical
species.
This data is interpreted as the abundance of these species in a surface. This
has a high
correlation with various physiologic conditions and offers the possibility of
improved
metabolic monitoring (Figure 11).
Several types of response to shock that were observable using hyperspectral
imaging (as seen in the hypovolemic shock in porcine subjects). First, the
overall
oxygenation levels (or oxygen saturation) were seen to decrease in many
subjects.
Second, a mottled appearance was seen in the skin of several subjects. This is
a known
indicator of shock and results from a change in the micro-circulatory patterns
of blood
59
CA 02592691 2007-06-28
WO 2006/086085
PCT/US2005/046919
flow as the body attempts to compensate for the event causing physiological
stress.
Finally, a distinctive change in circulatory patterns may occur, resulting in
a "feathery"
pattern (Figure 12). These changing circulatory patterns appear to correlate
with poor
outcomes, and therefore provide a measure of the likelihood that the patient
is moving
into an irreversible shock..
HSSI is a non-linear combination of 4 scalar factors that were derived with
image processing techniques applied to the hypercubes for each animal at every
time
step. Two of the factors (MEAN and SPREAD) are based on analysis of the entire
region of interest (ROI). The other 2 factors (blobbiness [BLOBS] and temporal
shift
[TEMPERAL]) are based on feature analysis that identifies patterns of
oxygenation of
the tissue, its amplitude, lateral extension and frequency of change. To
summarize data
from all 14 subjects, we displayed mean values for physiologic (HEART RATE and
SYSTOLIC BLOOD PRESSURE, left two panels) and hyperspectral parameters
(MEAN, SPREAD, BLOB and TEMP, right panels) as a function of time together
with the standard error for each time step (Figure 13). Here, blue lines
represent the 6
control subjects and black lines the 8 bleed subjects. If we use a heart rate
of 140
(¨human 110) as the metric for shock, we see this event at ¨50 minutes after
the first
bleed. If we use a systolic blood pressure of 70 (¨human 100) as the metric
for shock,
we see this event at 35 minutes after the first bleed. Using a HyperSpectral
Shock
Index (HSSI) of >1, significant bleeding is indicated 5 mm into the first
bleed. To avoid
dependency of the comparison on a threshold value, we constructed Receiver
Operator
Characteristic (ROC) curves that evaluate sensitivity and specificity in
identifying
shock by three parameters: HEART RATE, SYSTOLIC BLOOD PRESSURE, and
HSSI (Figure 14).
Battlefield
Hyperspectral or multispectral imaging is useful as small, portable
noninvasive
monitoring devices for use by first responders in a battlefield or emergency
room
setting. The responder captures hyperspectral or multispectral data from the
patient.
Software built into the device provides the responder with an assessment of
the
CA 02592691 2007-06-28
WO 2006/086085
PCT/US2005/046919
patient's state, including likelihood of the patient entering a state of shock
as well as
any available indicators of likely outcome. This information is used by the
responder
in determining the appropriate level of care needed to stabilize the patient.
In one exemplary embodiment, the battlefield/first responder system for
simultaneous collection and integration of both visible and near-infrared MHSI
data is
built in a rugged enclosure. The visible and NIR systems each consists of
three
functional modules ¨ a Spectral Imager (SI), supporting Controller and Power
Module
(CPM) and Control and Data Acquisition Computer (CDAC). The spectral imagers
consists of a visible and NIR liquid crystal tunable filters (LCTFs) and
complementary
metal oxide semiconductor (CMOS) visible and NIR imaging sensors, fitted with
macro lenses. Preferably, the LCTFs have a bandwidth of 9 nm, more preferably,
8
nm, and most preferably 7 nm. By varying the voltage across the LCTF, the
wavelength of light admitted through the LCTF, and into the camera, can be
varied.
The focal plane of the system is defined at the point of intersection of two
crossed laser
..
pointers. The imaging sensors are composed of 1280 pixels x 1024 pixels. The
system
preferably has a working focal length of approximately 12 inches and a field
of view of
approximately 7 cm x 6 cm, corresponding to approximately 60 lam resolution.
In another embodiment, only visible light is used.
In another embodiment, only NIR light is used.
In another embodiment visible light and LCTF and single or only several NIR
bands are collected through a simplified filter system.
Energy efficient light emitting diodes (LEDs) are used to illuminate the
tissue
surface. Preferably, eight, more preferably, 6, and most preferably, four
visible LEDs
are used to deliver 1.8 W of broadband light between preferably 300-970 nm,
more
preferably, 400-850 nm, more preferably, 450-800 nm, more preferably 450-750
nm,
and most preferably 450-720 nm. NIR emitters at 740, 780, 810, and 970 nm with
30
nm bandwidths are used to deliver 5 W of broadband NIR light between 720-830
nm
and 945-1000 nm. A single hyperspectral cube consists of images at 25 visible
and 25
61
CA 02592691 2007-06-28
WO 2006/086085
PCT/US2005/046919
NIR images. The integration times of each image is adjusted such that the
brightest
area in the image filled approximately 80% of the full well capacity of the
CCD. A
complete spectral datacube is collected in under one minute.
Another embodiment uses ambient light such as sunlight or ambient light either
alone or supplemented with another independent light source such as a
flashlight. In
this embodiment automatic calibration is undertaken by the system which can
measure
the flashlight output and/or ambient lighting and calibration effected or
instructions
given for the operator to make adjustments to the system.
The data is then converted to optical density units by ratioing the sample
data to
data acquired from the white reflectance standard using a Beer's Law
algorithm.
Reference oxyhemoglobin and deoxyhemoglobin spectra are obtained in electronic
format. A four-term linear regression fitting of oxyhemoglobin,
deoxyhemoglobin,
offset and slope terms are then performed on each of the spectra in the image
cube.
The regression fit coefficients are then used to calculate a relative oxygen
saturation
percentage for each spectrum in the image cube:
SHsi02 = OxyHb/(OxyHb + DeoxyHb) * 100,
where OxyHb is the fit coefficient for oxyhemoglobin, and DeoxyHb is the fit
coefficient for deoxyhemoglobin, resulting from the linear regression.
The state of shock is then assessed by evaluating the levels of oxy and
deoxyhemoglobin, total hemoglobin and hemoglobin oxygen saturation. The
spatial
distribution or mottling pattern observed in oxygenation is further used to
refine class
distinctions. Additional refinement is made by observing how the mottling
pattern
changes over time.
In one exemplary example, MHSI can be used to monitor a subject during
biological or chemical exposure even in cases where access to the victim is
difficult due
to the victim wearing a protective suit. As demonstrated in Figure 15,
hyperspectral
imaging of the face can be acquired directly through the protective goggles.
62
CA 02592691 2015-03-25
Hypotlz ermia
Four animals weighing 36.2 0.45 kg were used to evaluate the effect of
systemic hypothermia on the hyperspectral images. These animals underwent
similar
surgical preparation to those in the hemorrhage study. After baseline data
were
obtained, the animals were continuously cooled down over 1 hour 40 min by
placement
between 2 cooling blankets set at 4 C, followed shortly thereafter by covering
the head,
neck, axillas, and torso with plastic bags filled with ice.
In 3 animals, the target core temperature was 31 C. The duration of cooling
was intended to approximate the duration of the 3 consecutive bleed and
observation
sessions described for the hemorrhage protocol. To avoid decreasing the core
temperature below 31 C, the blanket and room temperature were set to 42 C and
30 C
respectively once the core temperature reached 33 C. The ice packs were then
removed, and a Bair Hugger warming blanket was added. Rewarming was carried
out
until baseline core temperature values were reached. Body temperature was
monitored
via pulmonary artery catheter and rectal temperature probe. Regional skin
temperature
was monitored on both hind limbs using thermocouples.
Because the skin Snsia, did not appear to change at core temperatures as low
as
31 C, a fourth animal was cooled further to 22 C, without rewarming.
In other preferred embodiments, the assessment of shock can be determined
using standard classification methods such as discriminant analysis or
classification
trees. Analysis can start using the diffuse reflectance signal collected with
the camera
before or after converting to optical density units. The method can also use
principal
component analysis or some other means for data reduction prior to analysis.
The present invention provides a hyperspectral/multispectral imaging system
which demonstrates changes in local tissue that reflect changes in systemic
physiology,
here changes in skin oxygenation and Susia, during hemorrhagic shock and
resuscitation. Other preferred uses of HSI include, but are not limited to,
the
macroscopic distribution of S15102, the in-situ detection of tumor during
breast cancer
63
CA 02592691 2013-12-09
resection in rat, the determination of tissue viability following plastic
surgery and
burns, claudication and foot ulcers in peripheral arterial disease patients
and diabetic
patients, and applications to hypovolemic decompensation and circulatory
collapse
under lower body negative pressure (LBNP) in pigs and humans, respectively.
Throughout the application, where we have described hyperspectral imaging,
multispectral imaging could be similarly employed and reference to MHSI or HSI
includes reference to either hyperspectral or multispectral imaging.
While these methods and instruments are described for application to medicine
and physiology, assessments, they can be similarly used in other application
areas
including in vivo and invitro biological, forensic, environmental, geological,
chemical,
astronomical and other areas.
Other embodiments and uses of the invention will be apparent to those
skilled in the art from consideration of the specification and practice of the
invention
disclosed herein. It is intended that the scope of the claims should not be
limited by
__ the preferred embodiments set forth in the examples, but should be given
the broadest
interpretation consistent with the description as a whole.
64