Note: Descriptions are shown in the official language in which they were submitted.
CA 02599254 2007-08-27
WO 2007/006454 PCT/EP2006/006487
- 1 -
Method for the determination of the concentration of a non-volatile
analyte
The invention relates to a method for the determination of the
concentration of a non-volatile analyte present in an aqueous sample
medium with the use of an optical sensor which contains a
luminescent indicator dye whose luminescence depends on the
concentration of the analyte and which is calibrated at the user
site by means of a single-point-calibration.
State of the art
Analyzers for the determination of non-volatile substances in a
liquid (e.g. ionic substances such as H+ (pH), Na+, K+, Ca++, Cl-,
neutral or charged molecules such as glucose, urea or lactate) are
used in medical, environmental, and industrial technology. Clinical
diagnosis, in particular, relies heavily on analyzing equipment for
the determination of so-called "critical care analytes" in
biological fluids such as urine, plasma, serum and above all whole
blood. Such systems frequently comprise diverse sensing elements for
determining the respective parameters. Such sensing elements may be
used for a single determination (single-use) or reused for multiple
determinations (multiple-use).
Sensing elements of this kind often utilize electro-chemical sensing
technologies or optical-chemical sensing technologies for the
determination of gas parameters, pH-values, ionic values or
metabolite values in clinical diagnostics. Preferably a plurality of
sensing elements for the determination of diverse analytes are
bundled into a "cartridge" (see for instance Ann. Biol. Clin. 61,
183-91, 2003).
Clinical diagnosis requires a high degree of accuracy of measurement
results. In addition, a single measurement step should supply
measurement values for a large number of substances. It is
furthermore expected that measurement results are presented with
minimum delay and that cost per measurement value is low. Often it
CONFIRMATION COPY
CA 02599254 2007-08-27
WO 2007/006454 PCT/EP2006/006487
2 -
is desirable that measurements be performed in close proximity to
the patient, for instance "at the bedside", in the physician's
office or in the critical care unit.
As a consequence, time-consuming calibrating procedures involving
various calibrating media prior to actual measurement will not be
acceptable, especially when "single-use" sensors are concerned.
Since the cost of miniaturized devices and sensing elements must be
kept low, procedures requiring costly apparatus, complex sensing
elements, or a plurality of fluids and other supplies are
unsatisfactory.
Electrochemical sensors may be based on one of several different
measurement principles, such as potentiometric, amperometric or
conductometric measurement principles. All principles require the
use of a reference electrode and are often applied in configurations
requiring contact with a wet calibration fluid prior to measurement
of the unknown sample.
U.S. Pat. No. 4,734,184 (Burleigh et al.) discloses an electrode
assembly for monitoring the concentration of a number of gases and
ions present in the blood. Although the assembly is stored dry to
promote an extended shelf-life, the electrodes are thoroughly
hydrated (wet-up) prior to use.
U.S. Pat. No. 4,654,127 (Baker et al.) discloses a sensing device
equipped with species-selective sensors and a rotatable multichamber
reservoir in which calibrant and sample solutions are contained but
in separate chambers. A plurality of chemical species may be
detected by this device. Furthermore, these commercially available
sensors are stored in a high humidity package (i.e., substantially
wet). This packaging method has the effect of limiting the shelf-
life of these sensing devices.
U.S. Pat. No. 5,112,455 (Cozette et al.) discloses a sensing device
equipped with a reference electrode and at least one substantially
dry-stored sensor capable of exhibiting a response to changes in the
concentration of a preselected analyte species before the sensor
attains full equilibrated wet-up. However the sensor and reference
CA 02599254 2007-08-27
WO 2007/006454 PCT/EP2006/006487
3 -
electrode must contact a calibrant fluid before the electrodes
attain an equilibrated "wet-up" state, to derive meaningful
analytical information from such solid-state electrodes.
Optical-chemical sensors may be based on one of several different
optical measurement principles, such as fluorescence, absorbance, or
reflectance measurement principles. They are applied in a number of
very diverse measurement configurations and, in contrast to electro-
chemical sensors, optical sensors typically do not require a
reference electrode or reference sensor.
An optical-chemical or optical-biochemical sensor typically consists
of one or more layers of inorganic and/or organic, preferably
polymeric, substances applied on a transparent carrier or substrate,
with a least one layer containing a dye whose optical charac-
teristics (absorption, luminescence) vary with the concentration of
a particular analyte contained in a sample medium. Optical-
biochemical sensors contain at least one biochemical or naturally-
occuring biotic agent, for instance an enzyme. The carrier may be
planar, cylindric, or of any other shape. For example the layers may
be applied to the "wells" of micro-titration plates, at the tip of
optical fibre bundles or on single optical fibres or light-guiding
structures.
An optical-chemical sensor is usually able to measure reversibly and
often continuously. Exceptions to this rule are certain enzyme-
carrying biochemical sensors. These measure discontinuously and
often consume a substrate or reactant (such as oxygen), i.e. they or
their substrate or reactant are consumed or altered and must be
regenerated for subsequent measurements. Since sensors generally
have a limited lifetime, they must be replaced at certain intervals.
An optical-chemical sensor is placed in direct contact with the
sample medium and, when exposed to light, provides optically
readable information about a particular analyte of interest which is
present in the sample medium (e.g. concentration, activity or
partial pressure).
CA 02599254 2007-08-27
WO 2007/006454 PCT/EP2006/006487
4 -
The majority of optical-chemical sensors require several calibration
measurements with calibrating media, with the analyte concentrations
being distributed over the whole measurement range. The number of
calibration measurements required depends on the measurement
accuracy desired in the relevant measurement range, accuracy and
range varying for different applications. For example measurements
of physiologic sodium levels in blood typically span at least 120 to
160 millimoles per liter and hence require calibration measurements
within that range.
In order to minimize the number of calibration measurements, at
least as far as the user is concerned, and to make them fast and
simple, it is possible to obtain one or more of the sensor
characteristics at the manufacturing site (e.g. by calibrating a
production batch or lot), and to provide the relevant data together
with the sensors in suitable form.
State-of-the-art devices occasionally use the term "calibration-free
sensors" in their documentation. In reality there is no such thing
as a calibration-free sensor. A new sensor or newly designed or
developed sensor is calibrated at least once, or one or more of its
characteristics are measured at least once. It is for instance
possible to calibrate a production batch during sensor fabrication
and subsequently to produce sensors with just this known
characteristic by reproducible fabrication techniques. Furthermore
it is possible to calibrate at least one sensor or a representative
number of sensors of a batch and to assign the measured
characteristics to all sensors of this batch. This requires
sufficiently reproducible fabrication within a batch and/or
reproducible fabrication of sensors between batches. It also
requires reproducible fabrication of any measuring devices or
instruments supplied or endorsed by the manufacture to perform the
measurement. Such factory calibration is both time-consuming and
expensive, requiring extremely tight control over sensor
characteristics and concomitant control over the characteristics of
the measuring device or instrument.
A number of solutions have been proposed in this context, for
instance measuring luminescence intensity at a plurality of
CA 02599254 2007-08-27
WO 2007/006454 PCT/EP2006/006487
-
wavelengths, or measuring luminescence decay time of optical sensors
by methods of time- or phase-resolution. As described below, very
often a multiplicity of methods are applied within a single system,
due to the scarcity of indicator molecules responsive to all desired
analytes within their respective concentration ranges.
For example one such "calibration-free" system utilizing optical-
chemical sensors is proposed for "near-patient-testing" of blood
gases (P02 and PC02) and blood pH-value in Clin. Chim. Acta 307, 225-
233, 2001. In this system the determination of P02 is carried out by
measuring the luminescence decay time of a luminescent dye
immobilised on a membrane. PC02 is determined - avoiding the use of
an optical sensor - by means of the direct infrared absorption of
CO2. The pH-value is determined colorimetrically (using the principle
of absorbance) through multi-wavelength transmission measurement of
a colorimetric pH-indicator dye immobilised on a membrane with the
sample removed. Such systems employing multiple methods are often
complex and expensive.
Measuring the oxygen content of a blood sample by a luminescence
quenching method is also known from U.S. Pat. No. 5,564,419
(Radiometer). The method uses a luminophore whose luminescence is
quenched in the presence of oxygen. The P02 of the sample is
determined by measuring the decay time of the luminescence.
In contrast to the measurement of luminescence decay time, the
determination of luminescence intensity poses greater problems as
regards the parameters of the components of the optical system. For
sensors using luminescence indicators with long decay times (> 500
nanoseconds) state-of-the-art requirements concerning the optical
measurement set-up are relatively mild.
Unfortunately there are a large number of analytes, especially ions
and metabolites, for which no simple indicators or indicator systems
with long luminescence decay times are available. With increasing
luminescence life-time of the indicator the cross-sensitivity
against well-known quenching substances, especially 02, will also
increase. Indicators with decay times less than 100 nanoseconds (ns)
are less affected by such problems, however the accurate and
CA 02599254 2007-08-27
WO 2007/006454 PCT/EP2006/006487
- 6 -
calibration-free determination of such small decay times usually
requires more costly and complex instrumentation. Modern medicine
increasingly requests low-cost, rugged, and miniaturized analyzers
which may be used in close proximity to the patient.
The determination of the pH-value of a blood sample by a
colorimetric method is known from U.S. Pat. No. 5,288,646
(Radiometer), where a photometric measurement is proposed using a
colorimetric (non-luminescent) pH-indicator dye which is immobilised
on a membrane situated on the channel-wall of a "sampling device".
Transmission measurement using multiple analysis wavelengths is
costly and requires measures to correct for variations of the
characteristics of the optical components and of the light paths.
Since blood absorbs light the sample must be removed from the light
path prior to measurement, for instance by compressing the channel.
In the context of luminescence indicators it has been proposed (see
U.S. Pat. No. 5,108,932 (Wolfbeis)) to illuminate at one wavelength,
preferably at the isosbestic point, and to measure at two different
wavelengths of light emission. Working with multiple wavelengths or
detection at multiple wavelengths with the characteristics of the
optical components fully known demands costlier technology however.
In contrast to the measuring of pH-values there is a large number of
analytes for which no luminescence indicators suitable for multiple
wavelength methods are available.
Measuring luminescence intensity at one broad band of analytical
wavelengths is particularly advantageous. In comparison with the
technologies mentioned above measuring luminescence intensity has
the advantage that the set-up of optical and electronic components
necessary for measurement is relatively simple and may be realized
with low-cost components. A disadvantage here is the fact that
certain parameters of the optical components of the measurement set-
up and of the individual sensors, which influence luminescence
intensity, will affect the measurement result. Although it is
basically possible to build optical systems and sensors with stable
components and sensors whose characteristics are precisely
determined, this will be unrealistic in view of the above
requirements and the expense and costs involved. A solution of the
CA 02599254 2007-08-27
WO 2007/006454 PCT/EP2006/006487
7 -
problem, which is known in principle, consists in performing a
single-point calibration immediately prior to the measurement in
which the parameters are determined which depend on the individual
measuring equipment set-up and on the individual sensor element and
which influence the luminescence intensity.
According to the state of the art it is possible, for instance in
the case of optical sensors based on the measurement of luminescence
intensity at a broad band of analytical wavelengths, to obtain a
relative characteristic (i.e. a characteristic not depending on the
individual measuring system) by calibration measurements during
manufacturing and to supply this characteristic, in the form of
parameters (coefficients) of a mathematical equation describing the
characteristic curve, together with the sensor for use in the
measuring system at the user site. The parameters may be supplied in
the form of bar-codes, or stored on electronic, magnetic or optical
storage media. For determination of the characteristic valid in the
user measurement system (i.e. the effective characteristic) at least
one further measurement of luminescence intensity is required.
According to the state of the art this is obtained as follows: by
means of a calibration medium containing at least the analyte to be
measured in known concentration, a luminescence value corresponding
to this known concentration is set at the sensor of the user
measurement system and luminescence is measured, giving a
calibration value for the user site. The relative characteristic
referenced on the calibration value at the user site will yield the
effective characteristic.
For a simple optical-chemical sensor system, in which the
luminescence indicator is electronically excited by irradiation with
light in an absorption band and the intensity of the emitted light
in an emission band is used for determination of the analyte, at
least one calibration measurement performed at the user site is
required.
Regarding this user-site calibration, measurement procedures and
devices are known for single-use measuring elements containing one
or more optical-chemical sensors and a calibration medium.
CA 02599254 2007-08-27
WO 2007/006454 PCT/EP2006/006487.
8 -
In U.S. Pat. No. 5,080,865 (Leiner) a single-use measuring element
is proposed which contains one or more electrochemical or optical
sensors and includes a calibration medium suitable for the given
sensor(s). Prior to measurement the measuring element is inserted
into the analyzer and a calibration measurement followed by the
sample measurement is performed. If a liquid tonometered with one or
more gases (e.g. 02 and C02) is used, gas- and ion-sensors may be
calibrated simultaneously. Storing the sensors in a liquid has the
advantage that the sensors are ready for use immediately after
measurement temperature has been reached. The disadvantage is that
the "shelf-life" of the sensors is limited to several months when
they are stored in a liquid. This is the case especially for very
sensitive, enzyme carrying biosensors. A further disadvantage lies
in the fact that the single-use measuring element must hold the
liquid without loss during shelf-life and that a fluidic system for
transport of the calibration liquid must be provided.
In U.S. Pat. No. 5,351,563 (Karpf) it is proposed to integrate a
liquid storage medium (which at same time is a calibration medium
for pH- and ion-sensors) into the single-use measuring element. The
storage medium is displaced by a calibrating gas saturated with
water vapour, following which calibration and subsequently sample
measurement are performed.
U.S. Patent 5,166,079 (Blackwood et al.) discloses a method and test
device for competitive immunoassays using binding partners which are
labelled with a fluorescent moiety. In the dry state, the reagent
layer of the test device comprises an immunocomplex of an
immobilized binding partner (e. g. an antibody) for the analyte (e.
g. antigen) of interest and a conjugate of a labelled analyte. In
practice, the label which is present in the reagent layer is
optically read prior to applying the sample to the assay element.
When sample liquid containing the analyte of interest has been added
to the test device, the analyte present in the sample competes with
the labelled analyte conjugate in the reagent layer for the
available binding sites on the immobilized binding partners. The
labelled analyte dissociates therefrom and is replaced by the sample
analyte in a ratio appropriately equal to the relative amounts of
CA 02599254 2007-08-27
WO 2007/006454 PCT/EP2006/006487
9 -
sample analyte and labelled analyte. A second readout signal of the
reagent layer is obtained when the sample has been applied which
signal is inversely proportional to the amount of analyte in the
sample. The ratio of the second signal to the first signal is taken
and compared with that for known amounts of analyte to determine the
amount of analyte in the sample. According to U.S. Patent 5,166,079,
the method disclosed therein allows to compensate for variations in
the instrument and in the thickness of the reagent layer from
element to element and yields a better precision. Importantly, the
method of U. S. Patent 5,166,079 is based on the displacement of
fluorescent labelled analyte from the layer which is interrogated by
radiation, but the analyte in the sample does not affect the
fluorescent properties of the fluorescent moiety as such.
Accordingly, there remains at the present a need for a method which
integrates a sensing device, preferably an optical-chemical sensor,
having the requisite of long shelf life, predictable and reproducible
optical response and "wet-up" characteristics, which method allows to
obtain cost-effective and accurate determinations of the concentration
of analytes. Such determinations are desirably made in five minutes or
less, most preferably within about a minute.
Basic principles
To enable better understanding of the present invention the
relationship between the intensity S of the luminescence signal of a
luminescent species A, its concentration cA and the parameters of the
given measuring system will be summarized and wet calibration, known
in the art, will then be described using the case of an optical sensor
with an intramolecular charge transfer (ICT) dye for determination of
the pH-value of a sample.
To conform with published equations concerning wet calibration the
letter S was used to designate luminescence intensity. In contrast
thereto, the description of the invention will use the letter L for
luminescence intensity in equations and their derivation.
CA 02599254 2007-08-27
WO 2007/006454 PCT/EP2006/006487
- 10 -
Parker's equation describes the relationship between luminescence
intensity S of a species A and its concentration CA when excitation
wavelength (ex) and emission wavelength (em) are given:
(a) S=Iokexekemc0dCA
where 10 is the intensity of the light source, kex and kem are
transmission parameters of the optical components on the excitation
or the emission side, and e is the sensitivity of the detector, all
depending on the light wavelength X. Photophysical parameters
depending on the luminescent species are the molar absorption
coefficient 6, the luminescence quantum yield O and the analyte
concentration cA. d is the mean pathlength of light in the medium
containing the species.
For a given species A the product of the parameters F , and d may be combined
into a new parameter kA
(b) kA =Iokexekm COd
resulting in
(c) S=kACA.
The properties of optical components (e.g. intensity and spectrum of
the light source, spectral transmission properties of optical
filters, spectral sensitivity of detectors, etc.) and of optical
assemblies (length of light paths) vary within certain limits and
over time. This will cause the parameter kA to have a certain
variance between sensors and between devices which will also change
over time (duration of operation) . These variances must be taken
into account when measurements requiring a high degree of accuracy
and reproducibility are made. Minimizing these variances is costly
and therefore economically not feasible where low-cost measuring
systems are concerned.
A well-known optical-chemical sensor for pH-determination uses the
ICT dye hydroxy-pyrene-trisulfonic acid (HPTA) (Ann. Biol. Clin. 61,
183-91, 2003).
CA 02599254 2007-08-27
WO 2007/006454 PCT/EP2006/006487
- 11 -
The calibration curve of the sensor can be derived from the mass
action law's simple relationships between pH-value and the
concentration of the protonated (AH) and deprotonated (A-) dye
species:
(d) pH = pK + log (cK / cAH)
When excited near 470 nm in an aqueous environment, no luminescence
at 520 nm is generated from the protonated form. The total
concentration cD of the dye is the sum of the concentrations of the
individual dye species:
(e) cD = cA + cHA
At high pH-values (i.e., pH > pK+3), the protonated dye species is
absent. Thus, at high pH-values cD = CA- .
Substitution of cHA in eqn. (d) by the expression cHA = cD-cA
generated from eqn. (e) and simplification yields the equation:
(f) cA = 1
cD 1+IOpK-pH
Eqn. (f) is equivalent to equation (g)
(g) kA cA- 1
kA cD 1 + 10PK-pH
and further equivalent to equation (h) in view of equation (c)
(h) S = 1
S. I + IOPK-PH
where S denotes the luminescence intensity at a given pH-value and Sm
denotes the luminescence intensity in absence of the protonated
species HA. Finally, rearrangement of eqn. (h) yields the
calibration curve of the sensor (published in Ann. Biol. Clin. 61,
183-91, 2003.)
(i) S = Sm
I + IOPK-PH
CA 02599254 2007-08-27
WO 2007/006454 PCT/EP2006/006487
- 12 -
The calibration curve (eqn. i) is a sigmoidal function characterized
by increasing luminescence intensity in going from low to high pH-
values and a point of inflection (the dye's pK-value) centred at
mid-physiologic pH-values, where S is the relative luminescence
intensity as a function of pH, Sm is the maximum intensity seen at
high pH-values and pK is the negative log of the indicator's proton
dissociation constant.
Solving equation (i) for pH gives
(J) PH = pK -log( Sm -1J
from which the pH-value may be computed if the parameters S, Sm and
pK are known.
To determine the pH-value the luminescence intensity S is obtained
at the user site from the luminescence measurement value of the
sensor in contact with the aqueous sample. The pK value is obtained
by factory calibration. The value Sm at the user site is unknown and
must be determined at the user site from the luminescence
measurement value of the sensor in contact with an aqueous
calibrating solution of known pH-value. The necessity of the
determination of Sm at the user site is obvious from equation (g).
The parameters kA in the numerator and denominator of the fraction
are identical only if the quantities making up the parameters kA are
equal. These quantities can be seen from (b). Equality will
essentially hold if Sm is determined shortly before or after S is
determined using one and the same measurement set-up.
Sm may for instance be determined at the user site by measuring the
luminescence of the sensor in contact with an aqueous calibration
medium with high pH-value.
Preferably Sm is obtained by measuring the luminescence intensity Scai
of the sensor in contact with an aqueous calibration medium, whose
pH-value (pHcal) is close to the pK value known from factory
calibration, and by computing Sm from equation (k):
CA 02599254 2007-08-27
WO 2007/006454 PCT/EP2006/006487
- 13 -
(k) Sm = Scat (I + 10 PK-PHca1)
US 6,211,359 (He et al.) discloses similar characteristics for
optical sensors for the determination of potassium with luminescent
indicators based on the photo induced electron transfer (PET)
effect. Equation 6 of US 6,211,359 (He et al.) may also be applied
in the case of other ions and in addition takes into account
interfering ions which might be present. Equation 7 of US 6,211,359
is used to obtain the concentration of the ion to be measured in
analogy to eqn. (j). Eqn. 8 of US 6,211,359 is used to find the
unknown value of Sm by means of a single-point calibration in analogy
to eqn. (k).
US 6,171,866 (He et al.) discloses similar characteristics for
optical sensors for the determination of calcium with luminescent
indicators based on the PET effect. Eqn. 6 of US 6,211,359 and eqn.
4 of US 6,171,866 are equivalent with the exception that eqn. 4 does
not take into account interfering ions and that the concentration
and the Kd value are given in logarithmic form.
Definitions
In order to prevent misunderstandings due to varying definitions in
previously published documents the following definitions are given
for a number of essential concepts.
Analyte: in the following analyte will mean a substance in an
aqueous sample medium to be qualitatively or quantitatively
determined. The term non-volatile analyte will be used in
distinction from volatile analytes, i.e. substances which are
gaseous under standard conditions such as 02 or CO2. Non-volatile
analytes include, e.g. ionic substances such as H+ (pH), Na+, K+,
Ca++, Cl-, neutral or charged molecules such as glucose or lactate.
The interaction between analyte and luminescent dye in the optical
sensor can either be direct or indirect.
"Direct interaction" means that the analyte reaches the dye and both
species actually react with each other.
CA 02599254 2007-08-27
WO 2007/006454 PCT/EP2006/006487
- 14 -
"Indirect interaction" means that the analyte does not come into
direct contact with the luminescent dye and/or that the luminescent
response of the dye is not due to chemical or physical analyte-dye
interaction. Examples are furnished by enzymatic sensors which
belong to the group of biochemical sensors. In this context one or
more enzymes react with the analyte, yielding a reaction product
which in turn reacts directly with the indicator dye. In certain
known biosensors the enzyme reaction causes e.g. a change in pH-
value which may be determined by means of a pH-sensitive indicator
dye. Examples may be found in Biosensors & Bioelectronics 10, 1995,
653-659 (Konicki et al.).
Another type of indirect interaction occurs in assays based on the
fluorescence resonance energy transfer (FRET) principle (cf. infra)
according to which the analyte interacts with an acceptor dye and
the luminescence of a donor dye is measured.
Irrespective of whether a direct or indirect interaction of the
analyte with the luminescent dye occurs, in analogy to classical pH
absorption dyes these luminescent dyes are subsequently called
luminescent indicator dyes.
Unless specifically mentioned, the term "analyte" in connection with
its interactions with the luminescent dye shall encompass both the
direct and indirect interactions as defined supra. E.g. if the non-
volatile analyte is H+ and a pH-sensitive dye is used, direct
interaction of the analyte and the dye occurs. If, however, glucose
is the analyte and an enzyme sensor is used employing the principle
of detecting a pH change which occurs when glucose is enzymatically
converted, the species interacting with the dye is H+, not glucose..
In the present context, therefore, the statements like "the analyte
reacts with the indicator dye", "the analyte interacts with the
indicator dye" "the analyte is bound to the dye" and similar
statements shall encompass both direct and indirect analyte - dye -
interactions as defined supra.
Sample medium: the sample medium typically is an aqueous solution
with dissolved salts, which in addition may contain organic,
CA 02599254 2007-08-27
WO 2007/006454 PCT/EP2006/006487
- 15 -
biochemical or biological components. The sample media to be
measured may come from the area of environmental technology (water
or waste-water samples), from biotechnology and from medicine
(blood, serum, plasma, urine samples or samples of other body
fluids).
Optical sensor: in the usage of the present invention the term
"optical sensor" refers to the interface between a sample medium and
the optical components of a measuring device; in particular, it
refers to one or more layers of inorganic and/or organic, preferably
polymeric, substances applied on a transparent carrier or substrate,
with at least one layer containing a dye whose optical
characteristics (absorption, luminescence) vary with the
concentration of a particular analyte contained in a sample medium.
This interface is also designated as optode or optrode.
Components of the measuring system or the measuring device, such as
light source, detector, optical filters, electronic signal
amplifiers and the evaluation unit are not part of the optical
sensor.
The present invention relates to optical sensors for the measurement
of substances that are non-volatile (non-gaseous) under standard
conditions, such as inorganic ions (e.g. H+, Na+, K+, Ca++, Cl-, N03-,
Fee+, etc.), electrically neutral or charged molecules (e.g. lactate,
glucose, urea, creatinine, amines, alcohols) dissolved in preferably
aqueous sample media.
The present invention does not relate to optical sensors for the
measurement of substances that are gaseous under standard conditions
such as 02, C02, SO2, etc. In particular, it does not relate to
optical gas sensors, i.e. sensors which in the dry state and in
contact with a gaseous sample medium respond to a change in the
partial pressure of the analyte (e.g. 02, C02) with a change in the
optical signal. The invention does also not relate to sensors for
such volatile analytes dissolved in an aqueous sample that is in
contact with the sensor.
CA 02599254 2007-08-27
WO 2007/006454 PCT/EP2006/006487
- 16 -
However, the present invention can be used when separate sensors for
non-volatile and volatile analytes are used in combination. In this
case, however, the invention is applicable only in connection with
the sensors for non-volatile analytes.
Luminescence-optical sensors: the present invention preferentially
relates to luminescence-optical sensors. Such sensors contain at
least one luminescent dye (also referred to as luminescent indicator
dye) in at least one layer.
Dry optical sensor: the term relates to an optical sensor according
to the above definition, in which all sensor materials making up the
sensor are dry (i.e. essentially free from water) . The sensor is in
this state during storage and/or prior to measurement use. To
functionally activate the sensor it must be brought into contact
with water or a medium containing water, for instance an aqueous
activation medium, a sample medium, or a calibration medium.
Wet optical sensor: the term relates to an optical sensor according
to the above definition which is in contact with an aqueous medium,
for instance an aqueous activation-, sample-, or calibration-medium.
Activity: the activity a of an ionic substance is the product of its
concentration c and its coefficient of activity Activity depends on
ionic strength. At low ionic strength the activity coefficient is 1,
and thus c = a. Depending on the application the expert will compute
a suitable other value, e.g. by using the equations of Debeye-
HUckel. If, in the following, the determination of the concentration
is mentioned, the determination of the activity is also encompassed..
Measuring system: the term relates, with the exception of the
optical sensor itself as defined above, to all optical, electronic
and mechanical components which are required for application of the
optical sensor, such as the light source generating the excitation
radiation, the detector measuring the intensity of the measurement
radiation, optical filters, electronic signal amplifiers, the
evaluation unit and the measuring cell (for instance a cuvette to
whose wall the sensor is attached, a cell with an inlet and possibly
CA 02599254 2007-08-27
WO 2007/006454 PCT/EP2006/006487
- 17 -
an outlet and a measuring passage to whose wall the sensor is
attached, or a micro-titration plate).
Measuring device or device: the totality of all the components of
the measuring system. Preferably, the measuring cell (containing the
optical sensor) is not an integral part of the device but may be
replaced together with the sensor.
(Response) characteristic or characteristic function: the charac-
teristic describes the functional relationship between the measured
intensity of the measurement radiation (e.g. the luminescence
intensity) and the concentration or activity of the analyte to be
determined.
In the case of optical sensors the characteristic is non-linear,
i.e. the functional relationship between luminescence intensity and
concentration of the analyte over the complete dynamic measurement
range cannot be represented by a straight line with sufficient
accuracy. Depending on the required width of the measurement range
and on the required degree of accuracy it may be possible for
certain applications to represent at least parts of the
characteristic by straight lines.
The characteristic is determined by measuring the luminescence of
the sensor for a series of aqueous calibration media with different,
known concentrations of the substance to be determined, these known
concentrations being distributed over the expected range of
concentrations of the analyte to be determined. From these measured
calibration values the characteristic is derived in the form of a
table or a diagram, preferably in the form of a mathematical
equation. In actual measurement the concentration of the analyte is
computed using the luminescence intensity measured in contact with
the sample and the characteristic function.
Effective characteristic: the characteristic valid for a given
sensor together with a given measuring system. Referencing the
effective characteristic obtained by a factory-site measuring system
to a calibration value obtained by the factory-site measuring system
results in the relative characteristic.
CA 02599254 2007-08-27
WO 2007/006454 PCT/EP2006/006487
- 18 -
Relative characteristic: means a characteristic independent of the
specific measuring system. The relative characteristic referenced to
a calibration value obtained for a user-specific measuring system
provides the effective characteristic valid for the user-specific
measuring system. Typically, the relative characteristic is obtained
at the factory-site (cf. also the definition for "Effective
characteristic", supra) and can be referenced to a wet or a dry
calibration value (cf. also the definition for "Wet to dry
relationship", infra).
Effective and relative characteristics may be computationally
transformed one into the other, provided: (a) that for the measuring
system for which the effective characteristic is valid, at least one
calibration value is known, (for instance the intensity of the
measurement radiation of the sensor in contact with a medium of
known analyte concentration); and (b) that the measuring systems
used for obtaining the effective and the relative characteristic are
built alike.
"Wet to dry relationship": In the context of the present
application, the "wet to dry relationship" is a relationship which
allows computing at the user site the concentration of the non-
volatile analyte using the user-site dry calibration value and the
luminescence measurement value, both measured at the user site. The
"wet to dry relationship" typically is derived from factory-site dry
and wet calibration values that are obtained from measurements using
a representative number of single sensors from a production batch or
lot. These factory-site dry and wet calibration values then lead to
the "wet to dry relationship" which is taken as a relationship which
is valid for the complete production lot of which the representative
sensors came from.
The "wet to dry relationship" can for example be a relative
characteristic, or a relative characteristic and a ratio value,
and/or the like. In connection with some typical, but not limiting,
examples (cf. Examples 1, 1.1., 1.2., 1.3., 2, 2.1., and 2.2.,
infra) and embodiments, the following specification will show how
the determination of the concentration of a non-volatile analyte can
be carried out using the "wet to dry relationship".
CA 02599254 2007-08-27
WO 2007/006454 PCT/EP2006/006487
- 19 -
With reference to Example 1, in particular Examples 1.1., 1.2., and
1.3. (infra), the "wet to dry relationship" comprises a relative
characteristic referenced to a wet calibration value obtained at the
factory-site and a ratio value.
With reference to Example 2.1. (infra), the "wet to dry
relationship" comprises a relative characteristic referenced to a
dry calibration value obtained at the factory-site.
With reference to Example 2.2. (infra), the "wet to dry
relationship" comprises a relative characteristic referenced to a
dry calibration value based on ratio values obtained at the factory-
site.
Calibration: means the determination of the characteristic. When an
optical sensor is calibrated it is brought into contact with
calibrating media in a measuring system, which media contain the
analyte to be measured in different, known concentrations. The
optically measurable response of the sensor, e.g. the luminescence
intensity, referenced to the known concentration of the analyte in
the calibration medium serves as a reference value for the unknown
concentration of the analyte in a sample to be measured.
Prior to sample measurement the sensor may be wet or dry. If dry, it
must be activated by the calibration medium. In this case the
calibrating medium is also the activation medium. It is also
possible to use a storage medium, if provided, as the activating and
also calibrating medium. Examples for this may be found US 5,080,865
A and in US 5,658,451 A.
Single-point-calibration: a luminescence measurement value of the
dry sensor is obtained and taken as a calibration value. From the
calibration value obtained with the given measuring system and the
relative characteristic obtained from a measuring system built in
the same way the effective characteristic valid for the given
measuring system can be derived.
Measurement and evaluation: during measurement the optical sensor is
brought into contact with the sample medium, which contains the
analyte in a concentration to be determined. The concentration of
CA 02599254 2007-08-27
WO 2007/006454 PCT/EP2006/006487
- 20 -
the analyte is found from the sensor signal measured (e.g.
luminescence intensity) with reference to the effective charac-
teristic of the optical sensor.
Factory-site calibration: the determination of the parameters of the
characteristic (if eqn. 7, cited below, is used, for instance
parameters Kd and q) at the factory site with the exclusive use of
aqueous calibrating media is well-known and not subject of the
present invention.
If some calibration steps are carried out already at the factory
site using a suitable measuring system, only one calibration step
(single-point-calibration) may be needed at the user site, provided
a measuring system of identical design is used. A necessary
condition for factory-site calibration is that the characteristic
obtained at the factory site does not change until the sensor is
used (or at least does not change in an unforeseeable way); changes
could for instance occur during transport or during storage due to
temperature effects or due to chemical or physical ageing or
decomposition.
Luminescent indicator dyes: in the given context the term
luminescent indicator dye, luminescent dye or luminescence-optical
dye refers to all substances whose luminescent response (e.g.
luminescence intensity, luminescence decay time) depends on the
concentration or activity of the analyte via direct or indirect
interaction.
Typically, the luminescent indicator dye is immobilized in an
optical sensor, preferably in at least one sensor layer.
Depending on the type of dye or dye-system the luminescent response
caused by the analyte concentration is affected by very different
chemical-physical and/or photophysical mechanisms. The most
important types of dyes are:
A) PET dyes
B) ICT dyes
C) FRET systems (energy transfer systems).
CA 02599254 2007-08-27
WO 2007/006454 PCT/EP2006/006487
- 21 -
As already defined supra, "direct interaction" means that the
analyte reaches the dye and reacts with it.
"Indirect interaction" means that the analyte does not come into
direct contact with the luminescent dye and/or that the luminescent
response of the dye is not due to chemical or physical analyte-dye
interaction.
PET dye: an indicator dye whose luminescence is wholly or partly
quenched by photoinduced electron transfer (PET). Luminescence
quenching will reduce luminescence quantum yield, luminescence
intensity and luminescence decay time.
The electron transfer in a PET indicator dye takes place from an
electron donor to an electronically excited electron acceptor. Donor
and acceptor are covalently linked via a spacer. The spacer's
function is to electronically decouple donor and acceptor. The
acceptor is a luminescent substance. The donor is a receptor which
is able to bind the analyte, preferably reversibly. If the bound
substances are ionic substances the reactive component is also
called the ionophore. In a thermodynamic equilibrium reaction the
analyte reacts reversibly with the indicator dye by binding to the
receptor.
From the luminescence properties (e.g. luminescence intensity,
luminescence decay time) the concentration of the analyte may be
inferred, for instance by evaluating the visible, or with photo-
detectors measurable, intensity of the emitted light in the
ultraviolet (UV), visible (VIS), or near infrared (NIR) range.
PET indicator dyes have at least one species A to which the analyte
S is not bound, and at least one species B to which the analyte S is
bound, the two species and the analyte being in thermodynamic
equilibrium after a certain time. In the species B the PET effect is
wholly or partly blocked through the binding of the analyte, which
results in the luminescence intensity of B having a maximum. In the
species A the PET effect is not blocked resulting in a minimum of
its luminescence intensity.
CA 02599254 2007-08-27
WO 2007/006454 PCT/EP2006/006487
- 22 -
Since the dye component of a PET indicator dye remains essentially
unaffected by the binding of the analyte, the expert will recognize
a PET indicator dye by the fact that in a given chemical environment
the absorption and emission spectra of the dye of both species are
essentially equal as regards spectral position. Since the total
spectrum results from an addition of the spectra of the two species
the binding of the analyte will change the luminescence intensity of
the excitation- and emission spectrum.
Examples may be found in AP de Silva et al., Coordination Chemistry
Reviews 205, 2000, 41-57 (Review of PET dyes), in He et al., Anal.
Chem. 75, 2003, 549-555, Fig. 2 (PET indicator dye for Na') and in
J.Am.Chem.Soc. 125, 2003, 1468-1469, Fig. 3 PET indicator dye for
K+).
ICT dye: in contrast to PET indicator dyes there is no electronic
decoupling of the two parts (dye and receptor component) in an ICT
dye (ICT = intramolecular charge transfer). Since the binding of the
analyte substantially changes the chromophore system of the dye
component, the expert will recognize ICT dyes by the fact that in a
given chemical environment the absorption and emission spectra of
the dye component of the two species are different as regards
spectral position. Since the total spectrum results from the
addition of the spectra of the two species the binding of the
analyte will change the relative proportion of the two component
spectra in the total spectrum.
Examples may be found in Molecular Probes, Handbook of Fluorescent
Probes and Research Products, 2002, 9th ed., Ch. 21, Fig. 21.19
(SNARF-4F) and Fig. 21.24 (HPTS).
FRET dye: FRET indicator dye systems (FRET = Fluorescence Resonance
Energy Transfer) essentially consist of two dyes, a luminescent
donor dye and an acceptor dye. The luminescence of the donor dye is
quenched by the acceptor dye via radiation-less energy transfer.
Quenching of the luminescence changes luminescence intensity and
luminescence decay time. The acceptor dye reacts directly or
indirectly with the analyte, thus changing its absorption values
(absorption spectrum) and the rate of energy transfer. From the
CA 02599254 2007-08-27
WO 2007/006454 PCT/EP2006/006487
- 23 -
luminescence intensity of the donor dye inferences regarding the
analyte can be made. A condition among others for FRET to occur is
that the absorption spectrum of at least one species of the acceptor
dye overlaps at least partially with the emission spectrum of the
donor dye. An advantage of FRET systems lies in the fact that the
expert has a choice of many known, non-luminescent indicator dyes
(especially pH-sensitive absorption dyes) and that the analyte may
be determined via the more sensitive luminescence measurement.
Examples may be found in US 5,232,858 A (Wolfbeis et al.), in US
5,942,189 A (Wolfbeis et al.) and in Anal.Chim.Acta, 1998,364,143-
151 (Huber et al.).
Object of the invention
On the basis of the above methods for determination of the
concentration of a non-volatile analyte or the pH-value in an
aqueous sample medium, it is the object of the present invention to
propose improvements and simplifications which permit the
determination of the concentration of a non-volatile analyte
(including pH-value) at the user site without the use of calibrating
media. Typically, the measurement method is based exclusively on
measuring the luminescence intensity using only one excitation and
emission wavelength or band.
This object is attained by providing that a luminescence measurement
value be obtained at the user site with the sensor in contact with
the aqueous sample medium, which measurement value is referenced to
a wet to dry relationship, e.g. a relative characteristic, obtained
at the factory site and to a measured dry calibration value obtained
at the user site, and that the pH-value or the concentration of the
non-volatile analyte (including pH-value) be deduced from these
data.
Thus for the first time a measurement method plus calibration
procedure based on measuring luminescence intensity will be realized
which will require no calibration media at the user-site even if
only one excitation and emission wavelength is used. The invention
utilizes the surprising fact that optical sensors for the
determination of many non-volatile (non-gaseous) substances may be
CA 02599254 2011-03-30
- 24 -
engineered to use a luminescent dye which exhibits luminescence in
the dry state if suitably excited.
The object of the invention is a method as defined in claim 1.
Preferred embodiments are objects of the dependent claims.
The object of the invention is a method for the determination of
the concentration of a non-volatile analyte present in an aqueous
sample medium with the use of an optical sensor which contains in
at least one sensor layer an immobilized luminescent indicator
dye whose optical characteristics vary with the concentration of
the analyte and which is calibrated at the user site by means of
a single-point-calibration, by obtaining at the user site a
luminescence measurement value of the sensor in contact with the
aqueous sample medium, and characterized in that it further
comprises:
- at the user site, measuring luminescence of the dry sensor,
without the use of calibrating media, yielding a user-site dry
calibration value, and
- deducing the concentration of the non-volatile analyte from the
luminescence measurement value, a wet to dry relationship derived
from a factory-site wet calibration value and a factory-site dry
calibration value, and the user-site dry calibration value.
In particular, the method of the invention comprises
a) at the factory site
i. choosing a representative number of dry sensors So from -a
plurality of dry sensors S. made in the same way;
ii. measuring luminescence of each of the chosen dry sensors So,
yielding factory-site dry calibration values;
iii. subsequently measuring luminescence of each of the chosen
sensors So in subsequent contact with at least two aqueous
calibrating media with known, different concentrations of the
non-volatile analyte, yielding factory-site wet calibration
values;
iv. obtaining a wet to dry relationship of the sensors So from the
factory-site wet calibration values and the factory-site dry
calibration values, which wet to dry relationship is taken as
the wet to dry relationship for all sensors Sõ made in the same
way;
b) at the user site
CA 02599254 2007-08-27
WO 2007/006454 PCT/EP2006/006487
- 25 -
i. measuring luminescence of a dry sensor S1 from the plurality of
sensors Si-, made in the same way, yielding a user-site dry
calibration value;
ii. obtaining a luminescence measurement value of the sensor S1 in
contact with the aqueous sample medium; and
iii. computing the concentration of the non-volatile analyte present
in the aqueous sample medium from the luminescence measurement
value, the user-site dry calibration value, and the wet to dry
relationship obtained at the factory site.
In a first variant of the method of the invention the invention's
objective is realized by providing that
a) at the factory site
i. a representative number of sensors So is chosen from a
plurality of dry sensors Sn made in the same way; (i.e.
from a production batch or lot, or even - if the
production process is highly reproducible - for all
sensors of a kind)
ii. luminescence is measured for each of the chosen dry
sensors so, yielding factory-site dry calibration
values;
iii. next, for each of the chosen sensors So luminescence is
measured using at least two aqueous calibrating media
with known, different concentrations of the non-
volatile analyte which calibrating media are
subsequently brought into contact with the sensors,
yielding factory-site wet calibration values;
iv. from the factory-site wet calibration values a relative
characteristic of the sensors So is obtained, which is
taken as relative characteristic for all sensors Sn
made in the same way (i.e. belonging to the same
production lot);
v. from the factory-site wet calibration values and the
factory-site dry calibration values a ratio-value is
CA 02599254 2007-08-27
WO 2007/006454 PCT/EP2006/006487
- 26 -
derived, which ratio value is taken as a corresponding
ratio-value for all sensors Sn made in the same way;
and that
b) at the user site
i. luminescence is measured for one dry sensor S1 from the
plurality of sensors Sn made in the same way, yielding
a user-site dry calibration value;
ii. a luminescence measurement value is obtained with the
sensor S1 in contact with the aqueous sample medium;
and
iii. the concentration of the non-volatile analyte present
in the aqueous sample medium, or the pH-value, is
computed from the luminescence measurement value, the
user-site dry calibration value, the relative
characteristic and the ratio value obtained at the
factory site.
The first variant of the invention differs in some further points
from the known procedures initially described. Thus during factory-
site calibration a ratio-value of the factory-site dry calibration
value and the factory-site wet calibration value is obtained in
addition to the relative characteristic. At the user site only one
measurement of the sensor in dry state is required prior to the
actual sample measurement in order to obtain a user-site dry
calibration value, which permits the concentration of the non-
volatile analyte present in the aqueous sample medium to be
determined from the measured luminescence value of the sample
together with the relative characteristic and the ratio-value, both
determined for the whole production lot of sensors at the factory-
site.
Another variant of the invention in which a characteristic is
derived from the factory-site wet calibration values, referenced to
the dry calibration value, and thus a relative characteristic
referenced to the dry calibration value is obtained, differs from
the aforementioned variant, from step a) iv. onwards, insofar as
CA 02599254 2007-08-27
WO 2007/006454 PCT/EP2006/006487
- 27 -
at the factory site
- a relative characteristic for the sensors So is obtained from
the factory-site wet calibration values and the factory-site
dry calibration values, which relative characteristic is taken
to be valid for all sensors Sr, made in the same way; and
at the user site
- the concentration of the non-volatile analyte present in the
aqueous sample medium is computed from the luminescence
measurement value, the user-site dry calibration value and the
relative characteristic.
This variant of the invention also differs in a number of points
from the known procedures initially described. Thus during factory-
site calibration a factory-site dry calibration value is obtained,
which enters into the computation of the relative characteristic. At
the user site only one dry measurement of the sensor is required
prior to actual sample measurement in order to obtain a user-site
dry calibration value, such that the concentration of the non-
volatile analyte present in the aqueous sample medium can be
determined from the measured luminescence value together with the
relative characteristic obtained at the factory site and the user-
site dry calibration value.
A further variant of the invention in which ratio-values are
computed from factory-site dry and wet calibration values and a
relative characteristic is then derived from these ratio-values,
differs from the above variants, from step a) iv. onwards, insofar
as
at the factory site
- ratio-values are computed from the factory-site wet calibration
values and the factory-site dry calibration values; and
- from the ratio-values a relative characteristic of the sensors
So is obtained, which is taken to be valid for all sensors Sõ
made in the same way; and
CA 02599254 2007-08-27
WO 2007/006454 PCT/EP2006/006487
- 28 -
at the user site
- a user-site ratio-value is computed from the user-site dry
calibration value and the luminescence measurement value; and
- the concentration of the non-volatile analyte present in the
aqueous sample is computed from the user-site ratio-value and
the relative characteristic.
This variant of the invention also differs from the known procedures
initially described in a number of points. Thus during factory-site
calibration factory-site dry calibration values are obtained to
which the factory-site wet calibration values are related by the
computation of ratio-values. The relative characteristic is obtained
from these factory-site ratio-values. At the user site a
luminescence measurement is performed with the dry sensor, yielding
a user-site dry calibration value to which the luminescence
measurement value obtained from the sensor in contact with the
sample is related by computing a user-site ratio-value. From the
user-site ratio-value and the relative characteristic the
concentration of the non-volatile analyte present in the aqueous
sample is determined.
According to the invention an optical sensor for the determination
of a non-volatile analyte may be used in combination or in a joint
sensor configuration with sensors for the determination of the
concentration of volatile analytes, such as 02 or CO2. Gas sensors
and sensors for non-volatile analytes may for instance be combined
in a single-use measuring element, e.g. in the form of a sensor
array. The gas sensors are to be regarded as "calibration-free", if
measurement is performed by means of luminescence decay time. With
the help of a calibrating gas a single-point-calibration is also
possible.
To facilitate understanding of the invention, wet calibration,
though known in the art, is subsequently described in more detail
for the case of an optical sensor with a PET dye. The following
equations are immediately applicable to PET pH indicator dyes. For
CA 02599254 2007-08-27
WO 2007/006454 PCT/EP2006/006487
- 29 -
indicator dyes, based on the PET effect, for Na+, K+, Ca++ see for
instance US 5,981,746 A, US 6,211,359 B1 and US 6,171,866 B1.
The given equations are also, with certain restrictions, applicable
to ICT pH indicator dyes, specifically to such dyes where through
suitable choice of spectral filters only one species may be excited
or where the luminescence of only one species may be measured. The
sign of the responses will change according to whether measured
luminescence increases or decreases when the analyte is bound. In
principle, the given equations are also applicable to ICT pH
indicator dyes where through suitable choice of spectral filters
none of the two species can be specifically excited nor their
luminescence measured, for instance when the spectra overlap. The
complexity of the mathematical expressions increases in this case.
Depending on the thermodynamic equilibrium constant Kd of the
indicator dye and on the concentration of the analyte S the
indicator dye will have a species A to which the analyte S is not
bound, and a species B to which the analyte S is bound.
The reversible binding is governed by the mass action law:
(1) Be K 4A+S
The dissociation constant Kd, which is dependent on the temperature
and on the physical-chemical environment of the indicator dye, is
given in a first approximation by equation 2,
(2) Kd _ cA = cS
cB
with C standing for concentration, and the index d meaning
dissociation constant. Kd is given in mol/l.
The ratio of the concentrations CA and CB is thus determined by the
dissociation constant Kdand the concentration of the analyte S.
(3) CB CS
CA Kd
CA 02599254 2007-08-27
WO 2007/006454 PCT/EP2006/006487
- 30 -
The pKd-value (eqn. 4) is the negative logarithm to base 10 of the
dissociation constant:
(4) PKd = -log(Kd)
The concentration cD (total concentration) of the PET indicator is
the sum of the concentrations of the individual indicator species A
and B.
(5) cD = cA + cB
The ratio of the concentration of the indicator species B to the
total concentration of the indicator is
(6) V = cB/cD
If the species A is absent the ratio is 1. If the concentrations of
the two species are equal the ratio is O.S. If the species B is
absent and only species A is present the ratio is 0.
For given excitation and emission wavelengths the luminescence
intensity L of the PET indicator is the sum of the intensities LA and
LB of the emitted light of the individual species A and B.
(7) L=LA+LB
LA and LB are proportional to the concentrations CA and CB of the
individual species A and B, where LA = kA' CA and LB = kB- cB. The
proportionality constants kA and kB are valid for a measurement
system, that is for the combination of a sensor, from a set of
sensors made in the same way, with a suitable measuring device.
For given excitation and emission wavelengths the proportionality
constants kA and kB comprise
(x) sensor parameters, such as the total concentration CD of the
dye, effective light pathlengths within the sensors, irradiated
area, absorption values and luminescence quantum yield of the
species A and B;
CA 02599254 2007-08-27
WO 2007/006454 PCT/EP2006/006487
- 31 -
(3) parameters of the individual measuring system, such as
intensity of the light source, sensitivity of the detector and
transmission values of the optical components.
PET indicators that are particularly suitable are characterized by
the fact that kB preferably is larger by at least a factor 10, even
more preferably by a factor 100, than kA, i.e. that the luminescence
intensity of the species A - to which the analyte is not bound - is
lower by this factor than the luminescence intensity of the species
B - to which the analyte is bound. In the following it is assumed
that kB > kA. Depending on the PET mechanism indicators could be
found with kA > kB . As in the case of ICT indicators the expert
would have to adapt the following equations accordingly.
Combining equations 2, 5 and 6 finally leads to an equation which
describes the effective shape of the sensor characteristic:
(8) L=L (1+1+q 1
S/Kd
where q = kA/kB and L. (m indicating maximum intensity) is the
measured luminescence intensity, when only species B is present. Lm
may also be used as a scaling factor.
For given excitation and emission wavelengths and for a given
measuring system equation 8 describes the measured (effective)
luminescence intensity L as a function of the concentration of the
analyte.
The following considerations apply to the parameter q:
The parameter q represents the ratio kA/kB and thus the intensity of
the pure species A versus the intensity of the pure species B,
q.100 is the intensity of the pure species A as a percentage of the
intensity of the pure species B.
The following considerations apply to the scaling factor Lm:
CA 02599254 2007-08-27
WO 2007/006454 PCT/EP2006/006487
- 32 -
For a given measuring system LmA is the lowest measurable intensity
of a sensor. A sensor may for instance be set to lowest intensity by
bringing it into contact with a measurement medium whose
concentration of analyte S is very small compared with Kd (cS << Kd),
which means that the equilibrium (see eqn. 1) is completely shifted
to the left side. Typically it will be sufficient if cS is smaller
than Kd by a factor 103 to 10' .
For a given measuring system LmB is the highest (maximum) intensity
of a sensor (which can be achieved with the analyte in question) A
sensor may for instance be set to maximum intensity by bringing it
into contact with a measurement medium whose concentration of
analyte S is very high compared with Kd (cS >> Kd), which means that
the equilibrium (see eqn. 1) is completely shifted to the right
side. Typically it will be sufficient if cS is greater than Kd by at
least a factor 103 to 104.
In equation 8 Lm is to be taken as LmB, i.e. the maximum intensity of
the sensor.
In the case of particularly efficient PET dyes q may tend to zero.
Such dyes are particularly suitable since their species A is not
luminescent and its dry luminescence therefore need not be taken
into account. In the case of ICT dyes, where only one species, e.g.
B, is measured by using suitable spectral filters (see description
above) q is zero (since luminescence of A is not measured, whether
it be luminescent or not) . Since q is equal to zero, eqn. 8 reads
L=Lm(1-1/(1+CS/Kd)). If species A is measured instead of species B,
eqn. 8 reads L=Lm(1-1/(1+Kd/CS)). The other equations must be changed
accordingly.
If equation 8 is divided by a constant (>0), for instance by Lm,
there results a relative characteristic Lrel, referenced to the value
of the constant.
(9) Lrel =I* (I+ 4-1
1+CS/Kd
Lrelin eqn. 9 can assume values between q and 1.
CA 02599254 2007-08-27
WO 2007/006454 PCT/EP2006/006487
- 33 -
The parameters Kd and q determine the shape of the characteristic
which is independent of the scaling factor Lm. These parameters are
independent of the quantities cited above in paragraphs a) and (3),
and can be determined by factory-site calibration. The parameter Lm
takes into account the quantities cited above in paragraphs (X)and
P)
By multiplying the relative characteristic Lrel (which can be
determined by factory-site calibration with a factory-site measuring
system) with the parameter Lm (which can be determined with a user-
site measuring system) the characteristic valid for the user-site
measuring system (effective characteristic) is obtained.
If the scaling factor Lm refers to a sensor in the wet state (wet
sensor), it will be designated by the index W (LmW) in the following.
If it refers to a sensor in the dry state (dry sensor) it will be
designated by the index D (LmD)
The scaling factor Lmw is identical with the maximum luminescence
intensity which can be measured with a given wet sensor in a given
measuring system. Lmw is directly measurable in a wet calibration
with a calibrating medium, provided that the analyte concentration
is chosen such that only species B is present.
In the case of pH sensors eqn. 8 may also be written in the form of
eqn. 10 with pH = -log (aH+) and pK = -log (Kd)
(10) L=Lmw(1+ q-1
1-IOPH-pK
In the following the superscript is used for all quantities which
refer to the factory site (factory-site calibration).
The parameters q and Kd, are, for instance, determined by the
following steps:
a) Selection of at least one sensor from a plurality of sensors
made in the same way;
CA 02599254 2007-08-27
WO 2007/006454 PCT/EP2006/006487
- 34 -
b) Factory-site measurement with the selected sensor of the
luminescence intensities Liw* with a number n (where n is at
least 3, preferably 5 or greater, if eqn. 8 or 10 is applied)
of aqueous calibration media with known concentrations cSj* of
the analyte, which are distributed at least over the expected
range of the measurement variable, yielding n data pairs
(cSi*, LiW*; i=1...n) ;
c) Fitting of a suitable mathematical equation describing the
sensor characteristic (e.g. eqn. 8 or 10) to the n data
pairs, for instance by known least square methods, resulting
in values for the parameters q, Kd and LmW*.
The parameter Lmw* found at the factory site depends on the
measuring device used at the factory site and is irrelevant for
user-site measurement.
It is of particular advantage if the parameters q and Kd are
determined not with a single sensor but with a representative
number of sensors. By averaging the values q and Kd of individual
sensors, mean values of these parameters are obtained, which may
be assigned to the plurality of sensors made in the same way.
Thus it is possible to determine by factory-site calibration the
relative characteristic (in the form of the parameters q and Kd or
pK) and to supply it together with the sensor to the user, for
instance in bar-code form. If a sensor from a set of sensors made
in the same way is then inserted into a user-site measuring
device, LmW is at first unknown. It could for instance be measured
directly in an aqueous single-point-calibration. All parameters
describing the effective characteristic would then be known.
If the calibrating medium is replaced by the sample in actual
measurement and the luminescence intensity L is measured in
contact with the sample, the analyte concentration can be deduced
from equations 8 or 10 by solving for cS or pH.
If equation 8 is solved for cS (setting Lm = LmW), one gets:
CA 02599254 2007-08-27
WO 2007/006454 PCT/EP2006/006487
- 35 -
(11) CS=Kd ( (q-1)/(L/LmW-1) -1)
Since the analyte concentration necessary in the calibration
medium for direct determination of Lmw, lies beyond the
measurement range of interest, it is often undesirable to
determine Lmw directly.
It is advantageous to perform the single-point-calibration at an
analyte concentration which lies in the expected range of the
sample analyte concentration. Preferably the analyte
concentration is chosen such that the ratio cB/cD (eqn. 6) has a
value between 0.1 and 0.9, even more preferably between 0.3 and
0.7.
With the intensity value Leal, measured at the user site during
single-point-calibration with the wet sensor in contact with a
calibration medium of known analyte concentration cScal, and the
parameter values q and Kd known from factory calibration, Lmw is
computed from eqn. 12:
(12) L .W /(1+ q-1
õ~w ` ~ 1 + cSca, / Kd
The disadvantages of the procedure described above for the
conventional calibration of optical sensors with an indicator dye,
stem from the fact that, despite the majority of calibration steps
having been performed at the factory, at least a single-point-
calibration (with an aqueous calibration medium) must still be
performed at the user site prior to the actual measurement. This
requires the acquisition and management of an aqueous calibration
medium (handling, storage, distribution, re-ordering, checking of
expiry dates etc.) . This disadvantage is overcome by the method of
the present invention in which at the user site only dry calibration
steps are carried out, but no wet calibration steps.
Description of the drawings
In the following the invention will be described in more detail with
the aid of diagrams and schematic drawings.
CA 02599254 2007-08-27
WO 2007/006454 PCT/EP2006/006487
- 36 -
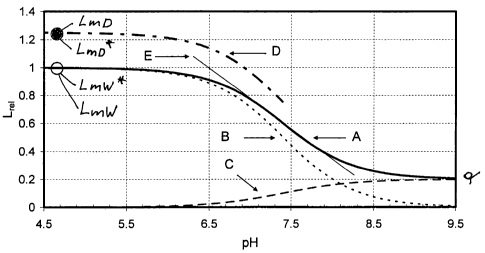
Figs. la to lc show the luminescence intensities scaled to Lmw = 1 of
the individual species of a pH sensor as functions of the pH-value
(in the pH range 4.5 to 9.5) for different sub-variants of the
procedure according to the invention.
Fig. 2 shows the luminescence intensities scaled to LmW = 1 of the
individual species of an ion sensor as functions of ion
concentration in mol/l with the abscissa logarithmically scaled.
Fig. 3 shows the response curves (scaled relative luminescence
intensity Lrel as a function of time t in sec.) of six individual pH
sensors.
Fig. 4 shows the scaled luminescence values in accordance with Fig.
3 as functions of pH-value.
Fig. 5 shows a diagram as in Fig. 4 with the difference that the
relative characteristic (solid curve) is represented by the linear
relationship Lrei = u1 + u2 pH.
Fig. 6 shows the scaled luminescence intensities Lrei of two groups
of sensors with different pretreatment (solid line and symbols) as
functions of time t.
Fig. 7a and Fig. 7b show the synthetic route of luminescent dye A41
Example I
(with sub-variants 1.1 (Fig. la), 1.2 (Fig. lb), and 1.3 (Fig. lc)
using equations 1 to 10)
In Figs. la to lc, which illustrate the sub-variants 1.1, 1.2 and
1.3 described in the following, the luminescence intensities scaled
to Lmw = 1 of the individual species of a pH sensor (i.e., with H+
being the non-volatile analyte) are shown as functions of pH-value.
Curve A represents the relative characteristic and is the sum of the
luminescence intensities LAW and LBW of the individual species A and
B. It was obtained from equation 10, with the value 7.4 used for
parameter pK and the value 0.2 used for the parameter q, and
equation 10 divided by LmW. The ratio between lowest intensity (right
side) and highest intensity (left side) is the value of the
CA 02599254 2007-08-27
WO 2007/006454 PCT/EP2006/006487
- 37 -
parameter q. Curve B is the relative luminescence intensity of
species B as a function of pH-value. Curve C is the relative
luminescence intensity of species A as a function of pH-value. From
curves B and C it can be seen that for pH < 4.5 essentially only
species B is present, while for pH > 9.5 essentially only species A
is present. Curve D is the sum of the luminescence intensities LAD
and LBD of the individual species A and B in the dry sensor as
functions of pH-value during manufacture of the sensors. For the
illustration it was assumed that the luminescence intensity of
species B in the dry state is greater by a factor 1.25 than in the
wet state. Depending on the dye and on the matrix it could also be
equal or smaller. Towards higher pH-values the intensity of dry
luminescence decreases with a decrease in the concentration of the
stronger luminescent species B whereas the concentration of the
lesser luminescent species A increases. From curve E it can be seen
that within a limited pH range (approx. pH 7.0 - 7.8) the relative
characteristic may be represented by a straight line of the general
form Lw = a + b=pH. Outside of this range the characteristic cannot
be approximated by the linear function with sufficient accuracy. The
measurement values designated by * in the individual figures are
factory-site values, the values without * pertain to the user site.
Fig. 2 illustrates the luminescence intensities scaled to Lmw = 1 of
the individual species of an ion sensor as functions of ion
concentration. The abscissa is logarithmically scaled. Curves A to D
are analogous to those of Figs. la to lc. Curve A was obtained from
eqn. 8 with the value 0.0176 for parameter Kd and the value 0.18 for
parameter q and eqn. 8 divided by Lmw. The values have been taken
from table 1 of US 6,211,359. Eqn. 8 essentially corresponds to eqn.
6 of US 6,211,359 with the difference that eqn. 8 does not take into
account interfering ions in order to keep the presentation simple.
Eqn. 8 also corresponds to eqn. 4 of US 6,171,866 with the
difference that there the presentation is logarithmic. From curve E
it can be seen that within a limited range of concentrations (cS =
0.006-0.05 mol/l approx.) the relative characteristic may be
represented by a straight line of the general form Lw = a +
b=log(cS). Outside of this range the characteristic cannot be
approximated by the linear function with sufficient accuracy.
CA 02599254 2007-08-27
WO 2007/006454 PCT/EP2006/006487
- 38 -
Due to the definition of Lm (m indicating maximum intensity, i.e. the
intensity when essentially only species B is present) a special case
is described in example 1.1 following below, examples 1.2 and 1.3
dealing with the general case.
Example 1.1 (Fig. 1 a)
Surprisingly it has been found that for sensors made in the same way
and measured with devices of the same type, the ratio
(13) RmD/w = LmD/Lmw = LmD*/Lmw*
is constant and can be determined by factory-site calibration. Thus
the scaling factor Lmw may be determined from LmD/RmD/w= At the user
site therefore only a single-point-dry-calibration will be necessary
for determination of the scaling factor Lmw and no calibrating medium
will be required. This means that a true dry calibration of a
luminescence-optical sensor is obtained at the user site, such that
liquid calibration media for single-point-calibration may be
altogether dispensed with.
Lmp, respectively LmD, are the maximum intensity values measured with
dry sensors at the factory site, respectively at the user site.
These values can be determined if the indicator dye of the sensor is
set up in such a way that in the dry state the whole mass of the
indicator is present in the form of species B, i.e. the luminescent
indicator dye is present essentially completely as the species B
with the ratio V = cB/cD (egn.6) equal to 1, since cD = cA + cB
(eqn. 5).
Lmw*, respectively Lmw, are the maximum intensity values measured at
the factory site, respectively at the user site, with wet sensors.
The value Lmw* can be measured at the factory site with the sensor in
contact with a liquid calibrating medium and with the analyte
concentration of the calibrating medium adjusted in such a way that
after wet-up and with equilibrium reached (eqn. 1 resp. 2)
essentially only species B is present, the ratio V = cB/cD (eqn. 6)
in the wet sensor being equal to 1. Lmw may then be computed from
eqn. 13.
CA 02599254 2007-08-27
WO 2007/006454 PCT/EP2006/006487
- 39 -
A variant of the method of the invention for an optical sensor with
an indicator dye, which can be present as a species A - free of the
analyte S - or as a species B - to which the analyte S is bound -,
and whose characteristic is given by eqn. 8 or eqn. 10, is
characterized by the fact that during factory calibration when the
indicator dye is essentially completely present in the form of
species B, a ratio-value RmD/w (from an intensity value LmD* without
aqueous calibration medium, and an intensity value Lmw* with aqueous
calibration medium) is computed, such that eqn. 8 becomes, with Lmw =
LmD RmD/wi
(14) L= LmD (1+ q-1
RmD/W 1+cS/KD
and that LmD may be determined in a subsequent user-site single-point
dry calibration, i.e. without the use of an aqueous calibrating
medium.
If the sensors are manufactured in such a way that in the dry state
only species B is present, the intensity measured in the dry state
will be L.D. Following wet-up and equilibration at the factory site
with a liquid calibrating medium whose analyte concentration is
chosen such that only species B is present, RmD/w may be determined
directly from eqn. 13.
The first subvariant according to the invention (Fig. la) is thus
characterized in that:
in step a)i.
sensors so are selected, in which the luminescent
indicator dye is essentially completely present as a
species B, to which the analyte or an analogue of the
analyte is bound,
in step a)ii.
factory-site dry calibration values LmD' are obtained,
in step a)iii.
CA 02599254 2007-08-27
WO 2007/006454 PCT/EP2006/006487
- 40 -
for at least one of the aqueous calibrating media the
concentration of the analyte S is chosen such that after
wet-up and equilibration essentially only the species B
is present and factory-site wet calibration values Lmw+
are measured,
in step a)iv.
from the factory-site dry calibration values LmD# and the
factory-site wet calibration values Lmw* a ratio-value RmD/w
is computed,
in step b)i.
a user-site dry calibration value LmD is obtained, and
in step b)iii.
a user-site scaling factor Lmw is computed from LmD and the
ratio-value RmD/w, and the concentration of the non-
volatile analyte is determined from the measured
luminescence value, the user-site scaling factor Lmw and
the relative characteristic.
Example 1.2 (Fig. 1b)
In example 1.1 the ratio V of the concentration of species B -to
which the analyte S is bound - to the total concentration D of the
indicator is 1. In other words: in the dry state the indicator dye
is completely present in the form of species B.
Typically optical sensors are manufactured in such a way that in the
dry state the ratio V = cB/cD has a value between 0.1 and 0.9 and
preferably lies between 0.3 and 0.7. For each value of the ratio.V
there exists a value RD/w which may be used to deduce the maximum wet
luminescence intensity Lmw from the intensity LD measured in the dry
state. If - as illustrated in example 1.1 - cA tends to zero,
essentially only species B is present and the equality RD/w = RmD/w
holds.
In modification of eqn. 13 one obtains from eqn. 15
CA 02599254 2007-08-27
WO 2007/006454 PCT/EP2006/006487
- 41 -
(15) RD/w = LD /Lmw = LD*/Lmw*
a ratio Rpiw by which the relative characteristic can be related to
the user-site dry calibration value.
The second subvariant according to the invention (see Fig. lb) is
thus characterized in that:
in step a)i.
sensors So are selected, in which the indicator dye is
present in the form of a species A and a species B, the
analyte or an analogue thereof binding to the species B
and not binding to species A, the ratio V=cB/cD, with
cD=cA+cB, being known and lying between 0.1 and 0.9,
preferably between 0.3 and 0.7,
in step a)ii.
dry factory calibration values LD* are obtained,
in step a)iii.
for at least one of the aqueous calibrating media the
concentration of the analyte S is chosen such that after
wet-up and equilibration essentially only the species B
is present and factory-site wet calibration values Lmw*
are measured, and
in step a)iv.
from the factory-site dry calibration values LD* and the
factory-site wet calibration values Lmw* a ratio-value RD/w
is computed,
in step b)i.
a user-site dry calibration value LD is obtained, and
in step b)iii.
CA 02599254 2007-08-27
WO 2007/006454 PCT/EP2006/006487
- 42 -
a user-site scaling factor Lmw is computed from LD and the
ratio-value RD/w, and the concentration of the non-
volatile analyte is determined from the luminescence
measurement value, the user-site scaling factor Lmw and
the relative characteristic.
Example 1.3 (Fig. 1c)
In the examples 1.1 and 1.2 described above, the concentration of
the analyte S for measuring the wet factory calibration value Lmw*
must be chosen such that essentially only species B of the indicator
is present.
In practice it is frequently undesirable and in the case of some
sensors or analytes outright disadvantageous or impossible, to set
the analyte concentration in a calibrating medium in such a way that
after wet-up and equilibration (eqn. 1 or 2) essentially only
species B is present, permitting direct measurement of Lmw* (see above
under a.iii) . The reason for this is that - in order to shift
equilibrium completely to the left in eqn. 1 - very high analyte
concentrations (> 1 mol/1) would have to be achieved in some cases.
A Na+ sensor for measuring physiological Na' concentrations ideally
has a Kd value of roughly 0.150 mol/l, for instance. To shift the
equilibrium (in eqn. 1 and 2) to the left side, such that
essentially only species B is present, the analyte concentration
would have to be higher than the Kd value by a factor 100, ideally by
a factor 1000. A resulting analyte concentration in the calibrating
medium of 15 mol/l or higher is neither practical nor possible, due
to solubility limitations.
As a further example take a pH sensor (with H+ as the non-volatile
analyte) for determination of physiological pH values, which ideally
has a Kd of about 3.4*10-8 (corresponding to a pK value of 7.4) . To
shift the equilibrium (in eqn. 1 and 2) to the left side, such that
essentially only species B is present, the analyte concentration
must be higher than the Kd value by a factor 100, ideally by a factor
1000. Setting the analyte concentration (cH+) in the calibration
medium at 3.4*10-8 or higher, corresponding to a pH of 4.4 or lower,
CA 02599254 2007-08-27
WO 2007/006454 PCT/EP2006/006487
- 43 -
presents no problem, but may be undesirable if weakly or strongly
acidic calibration media are to be avoided for some reason.
When the parameter values q and Kd are known (obtained from the
factory-site calibration) the concentration cSi of the analyte in the
liquid calibration medium may be chosen such in procedure step a)iii
of factory calibration that (after wet-up) a known ratio V = cB/cD
is established in the wet sensor, which preferably lies in the range
between 0.1 and 0.9, in particular between 0.3 and 0.7. It is of
particular advantage if this wet-state ratio (procedure step c) is
chosen such that it equals the dry-state ratio (procedure step b).
This variant will then yield the wet calibration value Liw`. Using
eqn. 12 Lmw* may for instance be computed from Ljw*.
(16) L,w*=L1w*( 1+(q-1)/(1+CS,/Kd))
The third subvariant according to the invention (see Fig. lc) is
thus characterized in that:
in step a)i.
sensors So are selected, in which the indicator dye is
present in the form of a species A and a species B, the
analyte or an analogue thereof binding to the species B
and not binding to species A, the ratio of the
concentrations of the species V=cB/cD, with cD=cA+cB,
being known and lying between 0.1 and 0.9, preferably
between 0.3 and 0.7,
in step a)ii.
factory-site dry calibration values LD* are obtained,
in step a)iii.
luminescence intensity is measured with the sensors So for
at least two aqueous calibrating media with known,
different concentrations cSi of the analyte S yielding at
least two factory-site wet calibration values Ljw*, and
CA 02599254 2007-08-27
WO 2007/006454 PCT/EP2006/006487
- 44 -
in step a)iv.
the relative characteristics and the wet calibration
values LmW* of the sensors So are obtained from the value
pairs LiW*, cSi and the relative characteristic valid for
all sensors Sn made in the same way is computed therefrom,
in step a)iv.
from the dry calibration values LD* and the wet
calibration values LmW` a ratio-value RD/W is computed,
yielding
in step b)i.
a user-site dry calibration value LD, and
in step b)iii.
a user-site scaling factor LmW is computed from LD and the
ratio-value RD/W, and the concentration of the non-
volatile analyte is determined from the luminescence
measurement value, the dry calibration value LD, the
ratio-value RD/w and the relative characteristic.
Example 2
(with subvariants 2.1 and 2.2 not using equations 1 to 10)
It is an advantage of theoretically derived functional equations for
the sensor characteristic that they usually describe the shape of
the characteristic curve over the whole range of measurable analyte
concentrations with sufficient accuracy. But for the purpose of dry
calibration according to the invention it is not absolutely
necessary to use the above, theoretically derived equations.
In principle alternative functional relationships may be used. The
shape of the characteristic curve - at least over the expected range
of the analyte concentration - can be represented sufficiently
CA 02599254 2007-08-27
WO 2007/006454 PCT/EP2006/006487
- 45 -
accurately, for instance by polynomials of first or second degree,
by logarithmic functions, by rational functions or by combinations
of these functions (e.g. LW = a + b=cS, LW = a + b=log(cS), LW = a +
b=cS + C. (CS) 2, or LW = a + b=pH, LW = a + b=log(pH), LW = a + b=pH +
c=(pH)2 ). The functions cited as examples differ from the
theoretically derived functions (e.g. eqn. 8 or 10) for instance
insofar as their parameter sets (a, b, c) do not contain a specific
parameter which could be used as a scaling factor analogous to Lm,
and further as the individual parameters, in contrast to q and Kd of
eqn. 8, do not reflect specific properties of the sensor. If such
alternative functions are used and the analyte concentration
unexpectedly lies outside the assumed range, there is a risk that
the values of the characteristic do not correlate closely enough
with the measurement values, thus leading to false results. If the
function does not approximate the shape of the characteristic
closely enough over the expected range of analyte concentrations,
the results will be imprecise.
Alternative functions could for instance be used, if
- theoretically derived functions are not available or are not
known with sufficient accuracy;
- the dynamic range of the sensor is larger than the expected
range of analyte concentrations and the alternative function
represents the shape of the characteristic in the expected
range with sufficient accuracy.
There are two different approaches which, while differing formally
and in details of procedure, are basically equivalent:
- normalizing the characteristic obtained by factory-site
calibration by the dry value (see example 2.1),
- normalizing the measured points obtained by factory-site
calibration by the dry value (see example 2.2).
A given ratio VD (egn.6) of the indicator species A and B present in
a dry sensor So will in dry measurement result in an intensity LD.
CA 02599254 2007-08-27
WO 2007/006454 PCT/EP2006/006487
- 46 -
LD is the luminescence intensity measured with the dry sensor, at a
given ratio VD, the ratio between the concentrations of the two
indicator species A and B being the same for every dry sensor from a
plurality of sensors Snmade in the same way.
In contact with a liquid medium, i.e. a calibrating or controlling
medium or the sample containing the analyte S to be measured in the
concentration cSi, a new ratio Viw of the species A and B is
established after wet-up and equilibration in the wet sensor, where
the ratio Viw established in the wet sensor depends on the
concentration cSi of the analyte in the sample and the dissociation
constant Kd of the indicator, and a luminescence intensity Liw
corresponding to the ratio Viw is measured.
Liw thus is the luminescence intensity measured with the wet sensor
in contact with a sample containing the analyte S in a concentration
cSi to be determined.
And thus - with the ratio VD given - each ratio-value Liw/LD
corresponds to a certain concentration of the analyte in the sample.
The ratio-values Liw/LD are essentially independent of the
influencing factors cited above under (x) and (3). To determine these
ratio-values the intensities Liw and LD must be measured with one and
the same sensor and with the same measuring device.
For a given value VD in the dry sensor there is a certain functional
relationship between the ratio-values Liw/LD and the concentration of
the analyte in the sample.
Example 2.1
In a preferred variant of the method according to the invention a
representative number of dry sensors So is selected from a plurality
of sensors Sn made in the same way and the luminescence intensity LD*
is measured without the use of an aqueous calibrating medium.
Subsequently each of the sensors So is brought into contact with a
number n of aqueous calibrating media with known concentrations cSi
of the analyte, which are distributed at least over the expected
range of the concentration to be measured, and n luminescence
CA 02599254 2007-08-27
WO 2007/006454 PCT/EP2006/006487
- 47 -
intensities (Liw*; i=l...n) are measured, yielding n data pairs (cSiw*,
Liw*; i=1...n) .
A suitable function of general form Lw* = f (P1*,..., P,*, cS or pH) (e.g.
Lw*=P1*+P2*'CS or Lw*=P1*+P2*=pH) describing the shape of the sensor
characteristic is fitted to the n data pairs, resulting - at least
for part of the range of the analyte concentrations to be measured -
in values for the parameters P1*,..., Põ* of an effective sensor
characteristic obtained at the factory site.
From the effective characteristic obtained at the factory site the
relative characteristic is derived by scaling with the dry value LD*,
that is the characteristic is divided by the dry value LD*.
For example: the effective factory-site characteristic Lw*=P1*+P2*=cS
is divided by LD*, i.e. the ratios p1=P1*/Lp and p2=P2*/LD* are computed
and the scaled characteristic is Lrel= (P1*+P2*' cS) /LD*= (pl+p2 = cS) .
At the user site a single-point-dry-calibration (no aqueous
calibrating medium is used) is performed using a dry sensor S1 from
the plurality of sensors made in the same way, yielding a
luminescence intensity LD.
Multiplying the relative characteristic Lrel with the dry calibration
value LD measured at the user site gives the effective characteristic
valid for the user site.
Continuing the above example: the relative characteristic Lre1=
(p1+p2'cS) is multiplied with the user-site dry calibration value LD.
I.e., the parameters p, and P2 of the relative characteristic are
multiplied with the dry calibration value LD measured at the user
site: P1= LD'p1 and P2= LD'p2; and the effective characteristic at the
user site is Lw=LD' (pl+p2.cS)=(LD'p1+LD=p2=cS)=(P1+P2'cS) . Thus the
user-site relative characteristic is referenced to the dry
calibration value.
From the user-site effective characteristic the analyte
concentration is obtained by solving the equation for cS (or pH) and
CA 02599254 2007-08-27
WO 2007/006454 PCT/EP2006/006487
- 48 -
entering the value Liw of the luminescence intensity measured in
contact with the sample. In the present example: cSi= (Liw-P1) /P2
In order to be able to obtain reliable mean values of the parameters
p, to p,, of the characteristic the expert may select a representative
number m of sensors. Theoretically m = 1 is possible, but in
practice m will be a larger number, depending on the given
application, m will be ? 16, preferably >_ 40.
In an advantageous subvariant of the second variant it is provided
that at least m sensors are selected and m dry calibration values LD*
are obtained at the factory site and that following the dry
measurement wet calibration values Liw* are obtained from each sensor
using at least two of n >_ 2 different aqueous calibration media,
with each calibration medium being used at least once during the
calibration of all of the selected sensors. For each sensor an
effective characteristic of general form Lw = f (P1',..., Pn', cS or pH) is
derived from the at least two of n >_ 2 wet calibration values Liw*,
and for each sensor a relative characteristic of general form Lrei =
f (pl,..., pn, cS or pH) is computed by dividing the effective
characteristic by the dry calibration value LDS. Subsequently a
relative characteristic is obtained by averaging the coefficients Pi
to pn of the individual sensor characteristics, and this relative
characteristic is assigned to the totality of all sensors Sn made in
the same way, i.e. a production lot of sensors.
A subvariant of the second variant of the invention is thus
characterized as follows:
at the factory site
- at least m sensors So are selected from a plurality of sensors
made in the same way;
- the luminescence intensity is measured for each selected sensor
So without aqueous calibration medium, giving a factory-site
dry calibration value LD* for each sensor;
CA 02599254 2007-08-27
WO 2007/006454 PCT/EP2006/006487
- 49 -
- for each selected sensor the luminescence intensities are
measured when in contact with at least 2 of n (n >_ 2)
different, aqueous calibrating media, each calibration medium
being used at least once in the calibration of all of the
selected sensors, yielding at least two factory-site wet
calibration values Liw* for each sensor;
- for each selected sensor a suitable function of general form LW"
f (P1`, ..., Pr,*, cS or pH) describing the shape of the sensor
characteristic is fitted to the data pairs (cSj*, L1),
resulting for each sensor in values for the parameters P1*, ..., Pn*
of an effective factory-site characteristic;
- for each selected sensor the effective factory-site
characteristic is scaled with the corresponding factory-site
dry calibration value LD', resulting in parameters Pi to pn for
the relative characteristic of general form Lrel = f (Pi,..., pn, cS
or pH) of the individual sensors;
- by averaging the coefficients of the individual sensor
characteristics a relative characteristic is obtained which is
assigned to the totality of all sensors Sn made in the same
way.
at the user site
- for a sensor S1 from the plurality of sensors Sn made in the
same way luminescence intensity is measured yielding a user-
site dry calibration value LD;
- for the sensor S1 in contact with the aqueous sample medium the
luminescence intensity L1 is measured;
- the relative characteristic obtained at the factory-site is
scaled with the user-site dry calibration value LD resulting in
values for the parameters P1 to Pn for the effective
characteristic at the user site, which has the general form LW
= f (P1r ..., Pn, cS or pH) ;
CA 02599254 2007-08-27
WO 2007/006454 PCT/EP2006/006487
- 50 -
- the analyte concentration is computed by solving the equation
of general form LW = f (P1, ..., Prõ cS or pH) for cS or pH (cS or pH
f (P1, ..., Pn, Lw) ) and entering the user-site luminescence
measurement value Liw.
Example 2.2
In a particularly preferred variant of the invention the following
variation of the procedure outlined under example 2.1 also is
possible. First ratio-values are computed from the factory-site wet
calibration values LiW* with a number n of calibrating fluids and the
factory-site dry calibration value LD*, and the functional
relationship between these ratios of wet values against dry value
and the analyte concentrations or pH-values is expressed in the form
of a table or a suitable function of the general form Lrei =
f(Ulf ...,un, cS or pH).
In this variant of the method according to the invention at least
one dry sensor So is selected from a plurality of sensors made in the
same way and the luminescence intensity LD* is measured without an
aqueous calibrating medium. Subsequently the sensor is brought into
contact with a number n of aqueous calibrating media with known
concentrations cSi of the analyte, distributed at least over the
expected range of the concentration to be measured, and n
luminescence intensities (LiW*; i=1...n) are measured, yielding n data
pairs (cSiw*, LiW*; i=1...n) .
For each of the selected sensors So the measured luminescence
intensities LiW* are divided by LD*, giving the ratio-values Ui*=
Liw*/LD*; i=1, ..., n and thus n data pairs (cSi*, Ui*; i=1, ..., n)
Then a suitable function of the general form Lrei = f (ui, ..., un, cS or
pH) describing the relative characteristic of the sensor (e.g. Lrei =
u1+u2 = cS or Lrei = u1+U2 = pH) is fitted to the data pairs obtained,
resulting in values for the parameters ui to un of the relative
characteristic.
CA 02599254 2007-08-27
WO 2007/006454 PCT/EP2006/006487
- 51 -
At the user site a single-point-dry-calibration (without an aqueous
calibrating medium) is performed using a dry sensor Sn, giving a
luminescence intensity LD which is the user-site dry calibration
value; then the sensor is brought into contact with the sample
containing the analyte S with (unknown) concentration cSi and a wet
measurement, i.e. a measurement where the sensor is in contact with
the aqueous sample is performed, yielding the luminescence intensity
LiW, i.e. the luminescence measurement value.
From the sample intensity value LiW and the dry intensity value LD a
ratio Ui= LiW/LD is computed. Using the sample intensity value U1
referenced to the dry intensity value and the characteristic of the
general form Lrel = f (ul,..., un, cS or pH) also referenced to the dry
value, the analyte concentration or the pH value is deduced by
solving for cS or pH.
The essential difference between the present variant and that
described in example 2.1 is the following: in 2.1 the effective
factory characteristic of general form Lw*=f (P1*,..., Pn*, cS or pH) is
obtained by measuring n calibrating values with n aqueous
calibrating media, computing the parameters P1* to Pn= and deriving
the relative characteristic of the general form Lrei=f (Pi, ..., Pn, cS or
pH) by scaling the effective characteristic with the dry value
measured at the factory site, while in 2.2 the individual n wet
calibration values are first scaled with the dry value measured at
the factory site (that is, the n wet calibration values are divided
by the dry value LD* to obtain n ratio values) and then a relative
characteristic is derived by fitting the n ratio values to the
relative characteristic of the general form Lrei=f (ul,..., un, cS or pH) .
In an advantageous further embodiment of the invention it is
proposed that at least m sensors are selected at the factory site
and that m dry calibration values ti, with i = 1 to m, are obtained,
and that from each sensor wet calibration values with at least one
of n >_ 2 different aqueous calibration media are taken, each
calibration medium being used at least once, such that k >_ n wet
calibration values kid, with j = 1 to n, are obtained, and that
ratio-values kip/ti are computed from the individual pairs ti, ki] and
CA 02599254 2007-08-27
WO 2007/006454 PCT/EP2006/006487
- 52 -
that the relative characteristic of the sensor is derived from these
ratio-values.
The number of selected sensors is m (m may be 1, typically is > 1,
and in practice is a larger number, such as >_ 16, and preferably z
40, depending on the application, in order to get representative
mean values), with the index i of the selected sensors running from
1 to m. There will thus be m dry calibration values ti with i = 1 to
m. The number of different, aqueous calibration media is n >_ 2, with
the index j of the aqueous calibration media running from j = 1 to
n. There are thus k >- n wet calibration values ki] and k ratio-values
kij/ti.
The table below lists the values for 2, 3 and 5 calibration media:
m selected m dry n k wet
sensors calibrat. calibrat. calibration k ratios k;;/t;
values t; media values k,
1 t1 2 k11, k12 k11/t1, k12/t1
n=2, k=2
2.) m = 3, K11, k12, k13 k11/t1, k12/t1, k13/t1,
n=3, k=9 3 t1, t2, t3 3 k21, k22, k33 k21/t2, k22/t2, k23/t2,
k31, k32, k33 k31/t3, k32/t3, k33/t3
3.) m = 2, k11, k12, k13 k11/t1, k12/t1, k13/t1
n=5, k=6 2 tl' t2 5 k23, k24, k25 k23/t2, k24/t2, k25/t2
A subvariant of this variant of the invention is thus characterized
as follows:
at the factory site
- at least m sensors So are selected from a plurality of sensors
made in the same way;
- for each selected sensor the luminescence intensity without
aqueous calibration medium is measured, giving a factory-site
dry calibration value LD for each sensor;
- for each selected sensor the luminescence intensity is measured
when in contact with at least one of n (n >_ 2) different,
CA 02599254 2007-08-27
WO 2007/006454 PCT/EP2006/006487
- 53 -
aqueous calibrating media, each calibrating medium being used
at least once in the calibration of all of the selected
sensors, yielding at least one factory-site wet calibration
value Liw for each sensor;
- from the factory-site dry and wet calibration values of the
individual sensors ratio-values Uit= Liw`/LD` are computed;
- a suitable function of the general form Lre1=f (u1r...,un, cS or pH)
describing the shape of the relative sensor characteristic is
fitted to the ratio-values Ui* of all m sensors, resulting in
values for the parameters u1r ..., un;
at the user site
- luminescence intensity is measured for a dry sensor S1 from the
plurality of sensors Si-, made in the same way, yielding a user-
site dry calibration value LD;
- for the sensor S1 in contact with the aqueous sample medium the
luminescence intensity Liw is measured, yielding a luminescence
measurement value;
- the luminescence measurement value Liw is scaled by the dry
value LD, resulting in a ratio-value Ui, and the analyte
concentration is computed by entering the ratio-value Ui into
the equation of the general form Lrei=f(ul,...,un, cS or pH) and
solving for cS or pH (cS or pH = f (ul, ..., un, Lrel))
It should be noted that in actual sample measurement at the user
site only the last three steps have to be performed, since the
values resulting from factory-site calibration are supplied with the
sensor in suitable form, e.g. as a lot-specific calibration
information encoded in a bar-code, a magnetic or electronic code
carrier or a ROM-Key.
The variant described in 2.2 has certain advantages, especially if
the parameters of the characteristic are obtained in factory-site
calibration not only from one sensor So but, more realistically, from
CA 02599254 2007-08-27
WO 2007/006454 PCT/EP2006/006487
- 54 -
a statistically representative number of sensors and assigned to the
totality of sensors.
Example 3
In this example the chemical synthesis of indicator dyes suitable
for the present invention, their immobilization to cellulosic
fibers, the preparation of dry optical sensor discs and pH, Na+, K+
and Ca++ measurements using the so obtained optical sensors are
described.
3.1. Synthesis of the pH-sensitive luminescent dye A41 with the
formula
OH
CI CI
HN
i
N-
o
O OH
Chemicals
DCM (dichlormethane) : Riedel de Haen 24233 > 99 %; TFA (trifluor-
acetic acid) : Fluka 91700 >98 %; NHS (N-hydroxysuccinimide) : Fluka
56480 > 97 %; DIC (diisopropylcarbodiimide): Fluka 38370 >98 %; DMAP
(4-dimethylaminopyridine) : Fluka 39405 > 98 %; DIPEA (diisopropyl-
ethylamine): Fluka 03440 > 98%; acetonitrile: Merck-HPLC-grade; 4-
aminomethyl benzoic acid: Fluka: 08400 >98%; SOC12: Fluka: 88950 >
99%; EtOH abs.: Riedel de Haen: 32221; TEA (triethylamine) : Merck:
808352; SO2C12: Fluka: 862212; hydrazine-monohydrate: Fluka: 53850;
phthalic anhydride: Fluka: 80020; tyramine hydrochloide: Fluka 93820
> 97 %; NMP ( N-methylpyrrolidone) . Fluka: 69116; 4-chloro-l,8-
naphthalic anhydride: Aldrich: 19,149-3 - 95%.
The synthetic route is shown in Figs. 7a and 7b.
CA 02599254 2007-08-27
WO 2007/006454 PCT/EP2006/006487
- 55 -
4-Aminomethylbenzoic acid-ethylester hydrochloride (1):
20.0 g (132 mM) of 4-aminomethylbenzoic acid are suspended in 200 ml
ethanol (EtOH) abs. and cooled with ice. 28.0 g (17 ml) (236 mM)
thionylchloride are added drop by drop. The clear mixture is then
refluxed for 3 hours. After cooling to room temperature, EtOH is
evaporated. 50 ml of toluene/EtOH 1/1 are added and evaporated three
times. The residue is dried to get 27 g of (1).
4-Chloro-naphthalimidyl-methylbenzoic acid-ethylester (2):
20.0 g (93.2 mM) 4-aminomethylbenzoic acid-ethylester hydrochloride
21.68 g (93.2 mM) 4-Chloro-1,8-naphthalic anhydride and 19.78 g
triethylamine (195.5 mM) in 400 ml DMF are heated to 90 C and
stirred overnight. After cooling to room temperature 100 ml H2O are
added to precipitate the desired product. The 4-Chloro-naphthal-
imidyl-methylbenzoic acid-ethylester (2) is recrystallized from
EtOH. Yield: 15.8 g.
The HPLC (Vydac 10-90-15) shows a single peak at t = 14.04 and the
mass peak
MH+ = 394.8 ( M = 393.82) is found in the maldi tof mass spectrum.
Tyraminephthalimide (3):
29.6 g (200 mM) phthalic anhydride, 34.73 tyramine hydrochloride
(200 mM) and 27.7 ml triethylamine (200 mM) are heated to 115 C
for 4 hours. After cooling to room temperature, the mixture is
poured to 1.5 1 ice water. The precipitate (3) is filtered and
washed with water. Yield : 45 g
Dichlorotyraminephthalimide (4):
15.35 g (57 mM) tyraminphthalimide (3) are added slowly and in
portions to 24.75 g (170 mM) boiling sulfuryl chloride and 75 ml
CHC13. Refluxing is continued till the mixture becomes clear. Then
the solution is stirred openly at room temperature overnight to
remove sulfuryl chloride. The solvent is removed by evaporation and
the crude product (4) is recrystallized from 75 ml MeOH. Yield: 7.2
g=
CA 02599254 2007-08-27
WO 2007/006454 PCT/EP2006/006487
- 56 -
Dichlorotyramine (5):
7.2 g dichlorotyraminephthalimide (4) and 1.6 ml hydrazine
monohydrate are refluxed in 170 ml EtOH abs. overnight. After
cooling to room temperature, the precipitate is filtered off. The
crude product (5) is not purified for further synthesis.
A-040:
A mixture of 1.5 g (7.26 mM) dichlorotyramine (5), 2.85 g 4-
chloronaphthalimidylmethyl-benzoic acid ethylester (2) and 4 ml
DIPEA in 150 ml NMP is heated to 90 C for 4 days.
After cooling to room temperature, 1.5 1 water and 7 ml acetic acid
(AcOH) are added. The precipitate is filtered off and dissolved in
400 ml CHC13. The organic layer is extracted with 0.5 N NaOH three
times and the NaOH-layer is acidified with 6N HC1. The water layer
is extracted with ethyl acetate and the organic layer containing the
dye is dried over MgSO4. Solvent is removed by evaporation.
Finally the crude A-040 is purified via dry flash silica gel column
chromatography.
Gradient: petrolether
petrolether/ ethyl acetate 9/1; petrolether/ ethyl acetate 8/2;
petrolether/ ethyl acetate 7/3; petrolether/ ethyl acetate 1/1
The HPLC (Vydac: 10-90-15) shows a single peak at t = 13.42 min and
the mass peak M = 563 ( M = 563) is found by maldi tof measurement.
A-041:
A-040 is dissolved in 50 ml acetonitrile and 50 ml 1N NaOH. The
solution is warmed up to 60 C and stirred for 1 hour. Then the
solution is acidified with HC1 and extracted with ethyl acetate. The
ethyl acetate layer containing the dye is washed with water three
times. After drying the organic layer over MgSO4, the solvent is
removed by evaporation. Yield: 350 mg.
CA 02599254 2007-08-27
WO 2007/006454 PCT/EP2006/006487
- 57 -
The HPLC (Vydac: 10-90-15) shows a single peak at t = 11.3 min and
the mass peak MH+ = 535.4 ( M = 534.4) is found by maldi tof
measurement.
3.2. Synthesis of the Na' sensitive luminescent dye 4-{4'-[4" -C-
[aza-15-crown-5]-3" -Methoxyphenyl-ethylamino]-1',8'-napthylamidyl
methyl} benzoic acid
The Na+sensors used are described in US 5,952,491 (Leiner et. al)
An exact description of the preparation of the Na+ sensitive PET
indicator dye as well as spectrum and measurement data of the
sensors may be found in Anal. Chem. 75, 549-555, 2003 He et al., "A
fluorescent chemo sensor for sodium based on photo induced electron
transfer".
3.3. Synthesis of the K+ sensitive luminescent dye
The K+ sensors used are described in US 6,211,369 (He et al.).
An exact description of the preparation of the K+ sensitive PET
indicator dye as well as spectrum and measurement data of the
sensors may be found in the publication J. Am. Chem. Soc. 125, 1468-
1469, 2003, supporting information, He et al., "A fluorescent sensor
with high selectivity and sensitivity for potassium in water".
3.4. Synthesis of the Ca++ sensitive luminescent dye
The Ca++ sensitive indicator dye is prepared as described in US
6,171,866 (He et al.).
3.5. Preparation of amino cellulose fibers
Amino cellulose fibers is prepared as described in SU 1,028,677, CA
99.177723b.
3.6. Immobilization of the pH, Na+, K+ and Ca++ sensitive indicator
dyes on amino cellulose fibers
CA 02599254 2007-08-27
WO 2007/006454 PCT/EP2006/006487
- 58 -
The immobilization of all four dyes to amino cellulose fibers is
carried out analogously to example 18 in US 6,211,359 (He et al.).
3.7. Establishing a known ratio of the respective indicator species
A and B
In order to establish a known ratio V (eqn. 6) of the species A and
B, after immobilization of the indicator dyes the fibers carrying
the indicator are washed with an aqueous medium which contains the
relevant analyte in suitable concentration, such that after
equilibrium is reached (eqn. 1 and 2) the desired ratio of the
concentrations of the indicator species A and B is established.
Subsequently the fibers are rinsed by short contact with de-ionized
water and dried, which does not change the established ratio of the
two indicator species.
Alternatively it is also possible to produce the complete sensors
first and wash them with an aqueous medium containing the relevant
analyte in suitable concentration, such that after equilibrium is
reached (eqn. 1 and 2) the desired ratio of the concentrations of
the indicator species A and B is established, and to dry the sensors
subsequently.
To establish a certain ratio of the species A and B it is for
instance possible in the case of pH sensors to equilibrate the
sensors or the raw materials (e.g. fibers carrying the indicator,
particles etc.) with acids, bases, or buffers with known pH.
In the case of ion-sensors the raw materials resp. the sensors can
be equilibrated with aqueous solutions containing the ion to be
determined in suitable concentration.
Alternatively it is possible in the case of PET indicator dyes
described in US 5,952,491 (Leiner et al.), US 6,211,359 (He et al.),
US 6,171,866 (He et al.) to establish with acids (e.g. HC1) or pH-
buffered solutions a certain ratio of the two species A and B in the
absence of the ion to be determined. This is possible because the
aromatically bound nitrogen atoms of the ionophore moiety are pH-
active. The pK value of the aromatically bound N atoms is
CA 02599254 2007-08-27
WO 2007/006454 PCT/EP2006/006487
- 59 -
approximately 5, for instance. In contact with acidic liquids the
nitrogen is protonated and the PET effect is eliminated. The
luminescence of the protonated species corresponds to the
luminescence of species B, to which the analyte (the ion to be
determined) is bound. Thus it is possible in the case of certain
luminescence indicators for metal cations having pH-active ionophore
moieties, to establish a predetermined ratio of the weakly and
strongly luminescent indicator species by means of protons. The
proton acts as analyte-analogon.
3.8. Fabrication of optical sensors (sensor discs) of H+ (pH), Na+,
K+ and Ca++ sensitive optical sensors
The fabrication of the four sensors was carried out analogously to
example 19 in US 6,211,359 (He et al.).
0.5 g sieved (25 pm) cellulose powder with immobilized indicator
from Example 3.7 is suspended in 9.5g of a solution of 10%
hydrophilic polyether-polyurethane-copolymer in 90% ethanol-water
for 16 h. Such polyether-polyurethane copolymers can be obtained for
example from CardioTech International, Inc. Woburn, MA, U.S.A. The
resultant homogeneous dispersion is coated on a polyester foil
(Melinex foil, ICI America) with a final dry thickness of 10 pm.
This foil is overcoated with 3% carbon black in a solution of 10%
polyether-polyurethane copolymer in 90% ethanol-water with a dry
thickness of 5 pm. Then small discs of 3 mm diameter are punched
out.
Methods of preparing sensor discs were described by M. J. P. Leiner
and P. Hartmann in Sensors and Actuators B, 11 (1993), 281-189
("Theory and Practice in optical pH sensing").
CA 02599254 2007-08-27
WO 2007/006454 PCT/EP2006/006487
- 60 -
3.9. Fabrication of disposable measuring cells containing an array
of H+ (pH) , Na+, K+ and Ca++ sensitive optical sensors
The sensor discs of example 3.8 are incorporated in disposable
plastic measuring cells. The cells consist of injection moulded top
and bottom parts, a channel for passage of calibrants and sample,
sealable inlet and outlet openings. The bottom part has cylindrical
cavities for inlay of the sensor discs. After incorporation of the H+
(pH), Na+, K+ and Ca" sensitive sensor discs in the cavities, the
bottom and top parts are glued together to form the final measuring
cell. Illumination of the respective indicator dye and collection of
the longer wavelength luminescence light is carried out through the
bottom part of the cell.
After assembly, the disposable cells are placed for several days in
closed containers containing an appropriate desiccant to allow the
sensors to further dry down to the desired level of humidity. After
drying, the inlet and outlet openings are sealed and the cells are
stored in closed containers along with an appropriate desiccant
until use.
Alternatively it is also possible to seal the inlet and outlet
openings immediately after assembly of the disposable cells and to
store the cells in closed desiccant containing packaging until use.
In such case, drying occurs through the sealing material and/or
through the plastic materials. Due to the low water permeability of
plastics, the drying process will take longer (i.e., weeks).
Methods of preparing disposable measuring cells are described by M.
J. P. Leiner in Sensors and Actuators B, 29 (1995), 269-173
("Optical sensors for in vitro blood gas analysis").
3.10. Dry and wet measurements of disposable cells in a measuring
setup
For measurement, the disposable cells are introduced into a
thermostated measuring chamber impervious to light. The inlet and
outlet openings are connected to a fluidic system to allow passage
of aqueous solutions having different pH-values and/or different
concentration of alkali ions.
CA 02599254 2007-08-27
WO 2007/006454 PCT/EP2006/006487
- 61 -
For each channel (sensor) the optical measuring system consists of a
blue LED as the light source, a photodiode as the detector, optical
filters for selecting the wavelengths, an optic arrangement for
conducting the excitation light into the indicator layer of the
sensor and for conducting the emission light to the photo detector
as well as a device for electronic signal processing. At the excita-
tion end an interference filter (peak transmission at 480 nm) is
utilized and at the emission end a 520 nm cut-off filter.
3.11. Measurement results with pH sensors
In Fig. 3 the response curves (luminescence intensity as a function
of time) of six individual pH sensors - selected from a plurality of
sensors made in the same way - are shown as functions of time t
(measured in seconds) in the dry state and during the equilibration
phase with aqueous fluids. The intensity values are measured in time
intervals of 2 seconds.
For this group of sensors (see item 3.7) the material carrying the
indicator (cellulose fibers) is washed with HC1 (pH - 3) prior to
introducing it into the sensor layer. Thus only species B is present
in the dry sensors of this group. The ratio V=cB/cD therefore equals
1 in the dry sensor (eqn.6).
Following the insertion of the sensors, which are stored in contact
with a dry gaseous medium, into the measuring device, they are
thermostated at 37 C (not shown), illuminated, and the dry
luminescence intensity is measured (this is the time interval 0-60
s). Then the gaseous medium is replaced by the aqueous fluid
(different for each sensor). During the time interval 60-240 s
equilibration of the sensors to the pH-value of the fluid occurs.
The intensities measured with different dry sensors are different
(not shown). For clarity of presentation the response curves of Fig.
3 are scaled in such a way that the mean values of the dry
intensities shown have the value 1.15. This value 1.15 represents
the ratio RmD/w (of eqn. 13)
CA 02599254 2007-08-27
WO 2007/006454 PCT/EP2006/006487
- 62 -
Scaling in this context means: the intensity values measured at
intervals of 2 seconds are multiplied by a factor (=1.15/average of
the dry intensities over the time interval 0-60 s).
Two groups of sample fluids are used.
The group with pH-values 7.18, 7.41, 7.59 consists of aqueous
electrolyte fluids which are typically used for control and
calibration purposes in the determination of blood parameters (see
e.g. US 6,174,728).
The group with pH-values 6.84, 7.15, 7.18 consists of HEPES buffers
with physiological values of Na+, K+, Ca", and Cl-.
During the time interval 60-240 s two processes occur
simultaneously, i.e. wet-up and equilibration to the pH-value of the
fluid.
In the time interval 230-240 s these processes essentially have
terminated. The luminescence intensity in this interval is the wet
intensity of the sample.
From the shape of the, curves it can be observed that the kinetics of
the equilibration process indeed depend on the type of sample.
In the diagram of Fig. 4 the scaled luminescence values of Fig. 3
are plotted against the pH-values on the abscissa.
The triangular symbols indicate that in the example the protonated
species B is exclusively present in the dry state. The dark
triangles, respectively the dashed lines, denote the dry calibration
values LmD' and LmD. In the dry state there is no pH-dependence! The
light triangle denotes the wet calibration value LmW* when only the
protonated species B is present.
The square symbols denote the intensities Liwt of the individual
sensors after equilibration, scaled by the dry values. The solid
line is the relative characteristic according to eqn. 10, with Lmw'
equal to 1.
CA 02599254 2007-08-27
WO 2007/006454 PCT/EP2006/006487
- 63 -
The parameters q and pK of the characteristic result from fitting
eqn. 10 to the measurement data represented by the square symbols by
the method of least squares. The approximation yields the result: q
0.17, pK = 7.08.
With the species B present the dry intensities LmD* and LmD are
greater by a factor RmD/W = 1.15 than the wet intensities Lmw* and Lmw.
In accordance with example 1.1, the relative characteristic (eqn.
10) is given by the parameters Lmw = 1, q = 0.17, pK = 7.08, with the
ratio RmD/w = 1.15.
The diagram of Fig. 5 corresponds to that of Fig. 4, the difference
being that the equation Lre1=Ul+U2 = pH is used to represent the
relative characteristic (solid line). For comparison reasons, the
relative characteristic from Fig. 4 is shown as a dashed line.
In accordance with example 2.2, the relative characteristic is given
by the parameters ul = 3.59 and u2 = -0.42. In the limited pH range
6.3-7.6 the shape of this characteristic approximates that of Fig.
4.
Fig. 6 shows the luminescence intensities Lrel of two groups of
sensors with differing pre-treatment (group a: solid lines, group b:
symbols). In group a (see example 3.7) the carrier of the indicator
(cellulose fibers) is washed with HC1 (pH - 3) prior to being
introduced into the sensor layer. As a consequence only the species
B is present in the dry pH sensors of this group. In group b (see
example 3.7) the carrier of the indicator (cellulose fibers) is
washed with phosphate buffer (pH - 7.4) prior to introduction into
the sensor layer. Therefore a ratio V=cB/cD (eqn. 6) of the two
indicator species is realized in the dry sensors of this group.
After insertion of the sensors stored in contact with a dry gaseous
medium into the measuring device they are thermostated to 37 C (not
shown), illuminated with blue light, and the luminescence intensity
is measured as a function of time at intervals of 2 seconds. In the
time interval 0-60 s the sensors were dry. In the interval 60-70 s
the gaseous medium is replaced by the sample fluid (no measurements
CA 02599254 2007-08-27
WO 2007/006454 PCT/EP2006/006487
- 64 -
are taken during this time) . In the time interval 70-200 s wet-up
and equilibration to the pH-value of the sample occurrs.
Wet-up and equilibration of the 3 sensors of each group is performed
with aqueous electrolyte fluids (pH-values 7.18, 7.41, 7.59), which
are typically used for control and calibration purposes in devices
for the determination of blood parameters (described in US
6,174,728).
The measured intensities of the different dry sensors are different
(not shown) . The measured intensities of each curve in Fig. 6 are
normalized in two steps.
Step 1: the last 10 values measured on each dry sensor are averaged.
Then all measured values of the curve are divided by the mean value.
Step 2, group a: the last 10 values measured on the wet sensor of
the curve with pH-value 7.41 are averaged. Then all three curves of
group a are divided by this mean value.
Step 2, group b: the three curves of group b are treated analogously
to group a.
From the presentation chosen it can be seen that after equilibration
the relative intensities of both groups are essentially the same and
correlate with the pH-values of the sample fluids.
Furthermore it is evident that (as was to be expected) the dry
intensity of group a is greater than that of group b: both groups
have the same amount of indicator dye; in group a the dye is present
in the strongly luminescent species B, while in group b there is a
mixture of the strongly and the weakly luminescent species.
Table 1: contains the measured dry and wet intensities of group a as
presented in Fig. 6. In the dry pH sensors of this group only
species B is present. The wet/dry intensity ratios are obtained by
dividing the measured wet values by the corresponding measured dry
value (e.g. 463944/172253 = 2.69).
CA 02599254 2007-08-27
WO 2007/006454 PCT/EP2006/006487
- 65 -
pH Measured Dry Measured Wet Dry/Wet
Intensity Intensity Intensity Ratio
7.18 463944 172253 2.69
7.41 475324 146897 3.24
7.59 460287 125670 3.66
Table 1
Table 2: contains the wet values of group a as presented in Fig. 6,
normalized by the dry value. The dry values are normalized to 1
(e.g. 463944/463944 = 1) . The normalized wet values are obtained by
dividing the measured wet values of table 1 by the corresponding dry
value of table 1 (e.g. 172253/463944 = 0.371). The dry/wet intensity
ratios are obtained by dividing the normalized dry value by the
normalized wet values (e.g. 1/0.371 = 2.69).
pH Dry intensity Normalized Dry/Wet
normalized Wet Intensity Intensity Ratio
7.18 1 0.371 2.69
7.41 1 0.309 3.24
7.59 1 0.273 3.66
Table 2
A comparison of table 1 and table 2 shows that equivalent dry/wet
ratios are obtained, regardless of whether the ratios are directly
obtained by dividing the measured wet values by the measured dry
values or whether the measured wet values are first normalized by
the dry values and the ratios are then computed by dividing the
normalized values.
Normalization permits comparison in graphic form between measured
curves or measured data of sensors with differing luminescence
intensity.
Table 3: contains the wet values of group b as presented in Fig. 6,
normalized by the dry value. In the dry pH sensors of this group
both species A and B are present.
CA 02599254 2007-08-27
WO 2007/006454 PCT/EP2006/006487
- 66 -
pH Normalized Normalized Dry/Wet
Dr Intensity Wet intensity Intensity Ratio
7.18 1 0.503 1.99
7.41 1 0.399 2.51
7.59 1 0.338 2.96
Table 3
3.12. Measurement results with Na+ sensors
Table 4: Normalized dry and wet intensities of sensors for
determining Na+-ion concentration in aqueous samples.
Normalized Normalized Dry/Wet
cNa+ Dry Intensity Wet Intensity
[mmol/1] Intensity Ratio
122 1 0.290 3.45
143 1 0.319 3.13
155 1 0.338 2.96
Table 4
3.13. Measurement results with K+ sensors
Table 5: Normalized dry and wet intensities of sensors for
determining K+-ion concentration in aqueous samples.
Normalized Normalized Dry/Wet
cK+ [mmol/1] Dry Intensity Wet Intensity
Intensity Ratio
3.0 1 0.346 2.89
4.9 1 0.383 2.61
5.9 1 0.401 2.49
Table 5
3.14. Measurement results with Ca++ sensors
Table 6: Normalized dry and wet intensities of sensors for
luminescence-optical determination of ionized Ca++ in aqueous
samples.
cCa++ Normalized Normalized Dry/Wet
[mmol/1] Dry Intensity Wet Intensity
Intensity Ratio
1.55 1 0.317 3.15
1.23 1 0.345 2.90
0.84 1 0.359 2.79
CA 02599254 2007-08-27
WO 2007/006454 PCT/EP2006/006487
- 67 -
Table 6
3.16. Measurement results with Cl- sensors
Table 7: Normalized dry and wet intensities of sensors for
determining C1--ion concentration in aqueous samples.
Normalized Normalized Dry/Wet
cCl- Dry Intensity Wet Intensity
[mmol/1] Intensity Ratio
88 1 0.386 2.59
106 1 0.352 2.84
119 1 0.321 3.12
Table 7
The Cl- sensors used are described in U.S. Pat. No. 6,613,282
(Huber).