Note: Descriptions are shown in the official language in which they were submitted.
CA 02604150 2011-08-31
-1-
A MAGNETIC RESONANCE SYSTEM AND METHOD TO DETECT
AND CONFIRM ANALYTES
Government Interest
[02] This invention was made with U.S. Government support under one or more of
the
following contracts: Naval Air Warfare Center n68335 -02-c-3120, Department of
Homeland Security contracts NBCHC060017 and HSHQPA-05-9-0039. The U.S.
Government has certain rights in this invention.
Background
1. Field of the Invention
[03] The present invention generally relates to the field of analyte detection
and
additionally relates to detecting analytes using magnetic resonance.
2. Related Art
[04] Detection technology for specific analytes spans a wide range of
laboratory
instrumentation and techniques including liquid and gas chromatography (LC and
GC,
respectively), mass spectrometry (MS), nuclear magnetic resonance (NMR)
spectroscopy,
polymerase chain reaction (PCR), optical spectroscopy and fluoroscopy, Fourier
transform
infrared (FTIR) spectroscopy, and ion mobility instruments. Today's chemical
analysis
instruments however, are large and expensive, require a skilled operator,
involve complex
sample preparation, and require substantial amounts of time for analysis.
[05] There is a critical need worldwide for improved detection of specific
chemicals
and microbes. For example, in the area of national security, a system is
needed to detect
biological agents, toxins, and chemical weapons to provide early alert in case
of a terrorist
attack. Such a detection capability could also be used to search for
clandestine sites where
CA 02604150 2007-10-09
WO 2007/086840 PCT/US2006/002368
-2-
such weapons are under development or in production, thus enabling action to
prevent
their use. A system is also needed to scan mail and packages to detect a
terrorist attack.
[06] Improved pathogen detection is also needed for medical science. Sensitive
detection of DNA or proteins associated with avian flu, bovine spongiform
encephalopathy (more commonly referred to as "mad-cow disease"), or severe
acute
respiratory syndrome (SARS) would enable intervention to avoid a pandemic.
Broad
clinical use of such a system would assist in identifying ordinary diseases or
serious
illnesses, greatly assisting physicians in diagnosis.
[07] Detection of various chemicals is also needed for industrial applications
to detect
toxic industrial chemicals (TICs) and toxic industrial materials (TIMs). Such
a system
would enable leak detection, process control, detection of material
degradation, control of
concentration, and a host of other process applications in a wide range of
industries.
[08] Improved detection is also needed in agriculture and food production, as
well as a
means to detect contamination, spoiling, or poisoning of food. Food includes
for example,
items such as drinking water and fruit juices. There is also a need in
forensic testing,
including for example, searching for specific DNA sequences in a sample at the
search
site.
[09] Magnetic resonance detection techniques are under development involving
nanometer-scale paramagnetic particles (nanoparticles) which have previously
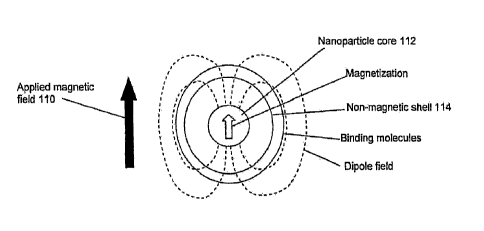
been used
as MRI contrast agents. The particles comprise a core of paramagnetic or
superparamagnetic (both generally referred to herein as paramagnetic)
material, coated by
a shell of nonmagnetic material which are adorned with reactant molecules to
promote
binding to target cells such as pathogens, tumor cells, etc. Nanoparticles are
injected into
a patient prior to MRI analysis. They bind to the target cells, cause a local
change in the
MRI image properties, and enable detection or localization of the target
cells.
[010] The nanoparticles have also been used in vitro. Dissolved or suspended
in a liquid
medium, the nanoparticles bind to target cells or molecules in the medium. The
nanoparticles and analytes may form aggregates incorporating dozens to
thousands of
nanoparticles. Such aggregates are detectable by light scattering, atomic-
force
microscopy, electron microscopy, and in some cases by NMR effects. See, for
example,
U.S. patent no. 5,254,460 to Josephson et al.
CA 02604150 2007-10-09
WO 2007/086840 PCT/US2006/002368
-3-
[011] Target-specific reactants can be mounted onto the nanoparticles to
provide analyte-
specific selectivity. A disadvantage is the need to form aggregations
comprising a
plurality of nanoparticles and a plurality of target cells or molecules,
because aggregation
occurs only when each nanoparticle is bound to multiple analytes, and each
analyte is
bound to multiple nanoparticles. Aggregation can be inhibited by geometrical
effects such
as a variation in size among nanoparticles. Substantial time may be required
for the
aggregations to form.
[012] Prior studies on agglomeration were conducted on benchtop relaxometers
and
high-field MR instruments. Sample preparation and insertion into the NMR tube
is
tedious. Hand mixing of each sample and then insertion of sample is time
consuming and
miss the important binding event that takes place early on when an analyte
binds to the
nanoparticle. A compact and automated instrument is required to speed up
measurements.
Also, it is important to understand the phenomena describing the changes seen
in the
measurement from a basic physics and biochemistry standpoint.
[013] Earlier studies did not model the change in T2 effects from a physics
standpoint.
Simple agglomeration effects were observed through optical means (microscopes)
to
establish the phenomena relating change in T2. In addition, early studies did
not take
advantage of stoichiometry control of the nanoparticles to adapt the measured
parameters
for various applications leading to specific NMR products.
[014] Earlier studies used samples that were pure and not subject to
interferences such as
dust, acids, etc. Moreover, there was no requirement for fast measurements
combined
with no interference from clutter and near neighbor molecules, cost of overall
system, low
false alarms and high probability of detection. There was also no defined
range of analyte
concentrations to be detected.
[015] Earlier studies did not consider use of improved paramagnetic materials
such as
compounds of iron, cobalt and nickel leading to stronger magnetization and
improved
sensitivity.
CA 02604150 2007-10-09
WO 2007/086840 PCT/US2006/002368
-4-
Summary
[016] A system and method are provided which can detect target analytes based
on
magnetic resonance measurements. In one aspect analytes are detected using
specific
nanoparticles in the form of magnetic resonance nanoswitches.
[017] In one aspect of the invention, systems and methods detect targeted
analytes with
very high specificity, despite near-neighbor interference, dirt, clutter,
biological
interferents such as mold spores, proteinaceous interferents such as skim milk
and ova
albumin, paramagnetic interferents such as hemoglobin and humic acid
(containing
chelated iron), environmental interferents such as the so-called Arizona dust,
diesel soot,
etc.
[018] One aspect of the invention includes a system and method for detecting
analytes in
a liquid medium. In another aspect analytes may be introduced as aerosol,
hydrosol, and in
complex media such as food.
[019] The system includes a magnetic resonance system to detect resonance
signals from
the liquid, a magnetic field passing through that liquid, and a region within
the liquid
where the magnetic field has a distinct property such as a particular value or
gradient.
Liquid within that region produces magnetic resonance signals which depend on
the field
property, and liquid outside that region may also be influenced by the region
due to
diffusion. A material having particular affinity for the analyte is adjacent
to the region.
The analyte binds to or is held by the affinity material and displaces liquid
from that
region, thus altering the magnetic resonance signals and revealing the
analyte.
[020] A system for detecting an analyte comprises: a sample which contains the
analyte
within a liquid medium, means for generating a first magnetic field within the
liquid,
means for generating a second magnetic field within a special region within
the liquid,
means for holding the analyte within the special region, a magnetic resonance
instrument
capable of measuring magnetic resonance signals from the liquid, and means for
analyzing
those signals to determine whether the liquid occupies the special region.
Alternatively,
liquid passing through the special region influences the magnetic resonance
signals of the
remaining liquid. The second magnetic field is distinct from the first
magnetic field so
that the signals of the liquid residing within the special region differ
detectably from
signals of the liquid located exterior to the special region. When present, an
analyte
CA 02604150 2007-10-09
WO 2007/086840 PCT/US2006/002368
-5-
displaces liquid from the special region. Thus if the signals show that liquid
occupies the
special region, analyte must be absent. If the signals show that the liquid is
displaced from
the special region, then the analyte must be present, and is thus detected.
[021] The analyte can be any molecule, molecular complex, microbe, chemical,
or
material which can be contained in the liquid medium, and which displaces the
liquid
when so contained. Examples of analytes include bio-molecules such as
proteins, DNA,
RNA, or fragments or complexes thereof; enzymes, small molecules, organisms,
microbes
such as whole or disrupted viruses or bacteria; whole or disrupted cells from
other species
including humans, non-biological chemicals such as chemical weapon molecules,
explosives, insecticides, pharmaceuticals, and industrial chemicals.
[022] In one embodiment the liquid contains the analyte. Here "contains" means
that the
analyte is dissolved, suspended, emulsified, or otherwise wholly enclosed in
and dispersed
within the liquid. Also, the analyte displaces the liquid, meaning that
molecules of the
analyte can not co-occupy space with molecules of the liquid.
[023] The liquid can be any fluid material that includes a nucleus having non-
zero spin.
Only nuclei with non-zero spin give rise to the NMR phenomena. The liquid
includes
such nuclei when molecules comprising the liquid comprise a nucleus with non-
zero spin,
such as hydrogen in the water molecule. Alternatively, the liquid may include
such nuclei
as solutes or suspensions, such as a fluoridated solute which generates
magnetic resonance
signals at the '9F Larmor frequency.
[024] In a further aspect a system includes a first magnetic field which
passes through
the liquid. The first magnetic field may be produced by an electromagnet,
permanent
magnet, superconducting coil, or any other source. Normally the first magnetic
field is a
static and substantially uniform magnetic field that can be in the range of
0.01 Tesla to 20
Tesla, and is a part of the magnetic resonance system.
[025] A second magnetic field is generated in a special region of the sample.
The second
magnetic field is distinct from the first magnetic field in some parameter
that is detectable
using magnetic resonance. For example, the second magnetic field may differ
from the
first magnetic field in magnitude, orientation, uniformity, gradient, or any
other detectable
parameter. A second magnetic field generator or means for generating the
second
magnetic field may be a nanoparticle, suspended in the liquid and immersed in
the first
CA 02604150 2007-10-09
WO 2007/086840 PCT/US2006/002368
;C. -6-
magnetic field or applied field. In one embodiment the nanoparticle becomes
magnetized
and produces a dipole-shaped field that adds vectorially to the applied field,
producing a
net magnetic field. The special region is that volume occupied by the distinct
magnetic
field. When the distinct magnetic field is caused by a nanoparticle the
special region is
that nanometer-scale volume adjacent to but exterior to the surface of the
nanoparticle,
where the net field differs substantially from the applied magnetic field.
Alternatively, the
special magnetic field region could be produced by paramagnetic ions such as
chelated
iron or gadolinium instead of nanoparticles. An advantage of this approach is
that
diffusion-limited reaction rates may be increased due to the higher mobility
of metal-ion
chelates. Similar ions are used in MRI (Gd-DTPA and Gd-DOTA.).
[026] Alternatively, the special magnetic field region is produced by
particles or
structures having a size larger than nanometer-scale, provided that the
magnetic resonance
signals differ detectably when analyte is present or absent. For example,
shaped magnetic
structures may provide two specific values of the magnetic field in two
regions, and the
analyte binding molecules could be coupled to only one of the field regions.
The detection
measurement is then a spectral analysis of the composite magnetic resonance
signal, which
will exhibit two frequency peaks corresponding to the two field regions when
no analyte is
present, or only a single peak when analyte obscures one of the field regions.
[027] In one aspect, temperature cycling is used to accelerate binding between
the
analyte and nanoparticle. This shortens the binding event time by increasing
the mobility
of the analyte and/or the nanoparticle. When an energy barrier inhibits
binding, higher
temperatures improve the rate of binding. Temperature cycling may include
heating and
cooling or vice versa. Then the sample is measured in the magnetic resonance
instrument.
[028] In one aspect, the system includes a mechanism or binding agent for
holding the
analyte in the special region, to displace the liquid from the special region,
leading to
detection of the analyte. Such a binding agent can include any material
surface or
molecule for which the analyte has an affinity. Such holding may be
accomplished by
hydrogen bonds, ionic forces, covalent bonds, sulfide bridges, van der Waals
forces,
electrostatic forces, or any other type of molecular or material attachment or
affinity
ligand. The binding agent is positioned adjacent to the region of shaped
magnetic field so
that the target molecule, when bound, occupies that region and excludes the
liquid
therefrom. For example, the binding agent may be an antibody raised against an
analyte
CA 02604150 2007-10-09
WO 2007/086840 PCT/US2006/002368
-7-
protein, or DNA complementary to analyte DNA sequences. Preferably the binding
agent
also has null affinity or negative affinity for all solutes other than the
analyte that may be
present. In addition to DNA, other holding means can be used such as aptamers,
small
molecules, etc. Targets include, but are not limited to the following:
a. An antibody that recognize and binds to an antigen
b. an oligonucleotide or DNA sequence complementary to a DNA- or RNA-
target
c. a DNA- or RNA-aptamer that binds to a target protein, bacteria, virus,
yeast
or fungus.
d. a protein or peptide that binds to a target protein, bacteria, virus, yeast
or
fungus.
e. a pseudopeptide composed of unnatural amino acids with a stronger
binding to a target or better environmental stability.
f. a small molecule or combination of small molecules that can bind to a
target.
g. monosacharides, polysacharides, carbohydates and sugars that can bind to a
target protein, bacteria, virus, yeast or fungus.
[0291 A further aspect includes a magnetic resonance instrument, which is
capable of
exciting and detecting magnetic resonance signals from the liquid medium.
Existing
magnetic resonance systems may perform this function. More preferably, the
instrument
is a simple, compact, automated, single-purpose magnetic resonance system
which can
perform the detection measurement automatically. The system measures signals
related to
the presence or absence of liquid, affected by the second magnetic field in
the special
region. For example, when the magnitude of magnetic field in the special
region differs
from that in the rest of the liquid, then the magnetic resonance system can
measure the
spectral content of the magnetic resonance signals to determine the magnetic
field from
which the signals emerged. Thus by analyzing for the Larmor frequency of the
liquid in
the special region, the system determines whether liquid occupies that region.
CA 02604150 2007-10-09
WO 2007/086840 PCT/US2006/002368
-8-
[030] An alternative measurement is the spin-spin relaxation time (T2) of the
liquid. T2
is affected when the magnetic field in the special region has strong
gradients, and
particularly when the liquid diffuses through those gradient fields in times
short compared
to the measurement. Thus the system can determine the presence of analyte by
measuring
the T2 of the liquid to determine if depolarization is occurring in the
special region.
[031] In one aspect, the compact magnetic resonance system can measure either
a
positive or negative change in T2. Agglomeration is described in the Josephson
patent as
the formation of a large supermolecular assembly of molecules. Agglomeration
necessarily occurs later in time than the binding event. In the case of
agglomeration, all
measurements show a negative T2 change. Likewise, the parameter defined as
"positive
1/T2" in Josephson represents a negative change in T2. Agglomeration is
described by
Josephson as a process where several molecules attach to each other and they
form
assemblies large enough to change the T2 of the water. In one embodiment, the
inventive
system measures T2 changes due to the analyte binding event, leading to
positive and
negative T2 changes prior to agglomeration.
[032] In one aspect, the compact magnetic resonance system measures baseline
T2 on the
nanoparticles or nanoparticle solution first, which is then mixed with the
analyte and T2 is
measured again to determine whether a change in T2 has occurred. This is done
to ensure
the correct concentration of nanoparticles and consistent stoichiometry, as
well as to
cancel out metering and mixing errors, variations in nanoparticle properties,
fluidic
transport errors, etc.
[033] In one embodiment the inventive system can detect analyte by measuring
magnetic
resonance signals from the sample at a single time. Alternatively, the system
can perform
a series of measurements spanning a period of time and can compare or analyze
the
measurements to improve the detection of analyte. For example, the binding
between
analyte and nanoparticles may proceed during an interval which is longer than
the time
required for a particular measurement. Then the system can perform the
measurements
repeatedly to observe the changes caused by the binding. As another example,
the analyte
may first bind to nanoparticles to form binaries, causing a positive shift in
T2, and
thereafter the binaries may combine to form agglomerates, causing a negative
shift in T2.
Such data can greatly enhance the quality of the result by reducing the false
alarm rate,
CA 02604150 2007-10-09
WO 2007/086840 PCT/US2006/002368
-9-
providing a lower detection threshold, and enhancing the detection probability
for a given
quantity of analyte.
[034] The inventive system can derive parameters related to reaction kinetics
from
repeated measurements on the same sample, including a rate of change of a
parameter or
an accumulated reaction parameter. These results can then be used to guide
additional
measurements to confirm or clear the initial indication. For example, if a
sample exhibits
a small but suspicious T2 change soon after mixing, the system can initiate a
series of tests
to determine the rate of change in T2 over a period of time. Then, if those
later results
confirm that the analyte is present, an alarm can be issued, but if the follow-
on
measurements indicate no analyte, then the initial suspicion may be cleared,
thereby
averting a false alarm. Using a provisional re-scan protocol, combined with a
rate-
magnitude analysis, the system enhances both reliability and threshold
sensitivity.
[035] Based on experimental results and theoretical modeling, a positive T2
change is
due to analyte displacing water molecules upon binding to the nanoparticles,
and negative
T2 change is due to repeated dephasing of water molecules within a cage
structure formed
by multiple nanoparticles. In addition, the positive or negative T2 change can
be
promoted by processing and stoichiometry. For example, the ratios of
nanoparticles and
the reagent can be adjusted to provide negative or positive T2 changes. In
some
circumstances it can be important to measure both negative and positive T2
effects to
eliminate interference from the base sample. For example, a test sample
contaminated
with a paramagnetic ion, such as humic acid with chelated iron, causes a
reduction in the
T2 of the mixture. Thus if there is an analyte mixed in with the humic acid,
it can be
measured in the following manner. First, measure the sample prior to mixing
the
nanoparticles, to generate baseline T2 measurement. Then, mix the
nanoparticles and
measure the change in T2, positive or negative, to reveal the analyte.
Alternatively, in the
event that a separate baseline measurement cannot be taken, it is useful to
mix
nanoparticles which lead to a positive T2 difference upon binding to the
analyte, so that
the analyte may be detected despite the contaminant.
[036] "Nanoparticle multiplexed mixtures" are nanoparticle preparations
sensitized to
multiple analytes. There are two multiplexing scenarios. First, each
nanoparticle in the
mixture is sensitized to a specific analyte. Second, a single nanoparticle is
sensitized to
multiple analytes.
CA 02604150 2007-10-09
WO 2007/086840 PCT/US2006/002368
-10-
[037] In one embodiment, an automated air monitoring system includes inlets to
admit
the sample along with air, a collector that gathers the sample material and
concentrates it
into a liquid form, called a raw sample, and a fluidics system. The fluidics
system holds
the raw sample, for example in a container and provides consistent metering of
the raw
sample, for example via an outlet tube using a pump such as a peristaltic
pump. Metered
sample is mixed with selected nanoparticles which may be in water, for
example, drawn
from reservoirs via an outlet by a pump. As soon as the reaction takes place
the fluidics
system moves the sample into the sample area of the magnetic resonance system
for
measurement, for example, via a tube driven by a pump. Alternatively, sample
mixing
and processing may take place within the magnetic resonance system. The
fluidics system
may include means for cell lysing wherein the fluidics system may lyse or
disrupt cells or
viruses in the sample to release proteins, RNA, or DNA of the target cell. The
fluidics
system may also have a temperature control built in to speed up the binding
event.
Fluidics system also may have an overall system cleaning solvent to eliminate
contamination. The cleaning solvent or rinsing agent can be drawn from a
reservoir and
pumped through the tube which delivers the samples to the sample area. The
fluidics
system also allows positive and negative control tests to ensure the overall
system is
functional, and performs calibration tests using calibration standards.
[038] In one embodiment, chelates are used in place of nanoparticles to
generate the
distinct magnetic field region and to bind to analyte. An advantage of using
chelated ions
is that it allows faster diffusion through the liquid medium to speed up
diffusion-limited
processes. On the other hand, with nanoparticles one can tailor the affinity
molecules to
select the analyte desired, whereas chelates occur only in specific molecular
forms.
Nanoparticles have more area to attach the affinity molecules compared to
chelates.
Nanoparticles can be decorated with chelates for binding to analytes,
explosives and
chemicals.
[039] In one aspect, the second magnetic field region, being generated by
paramagnetic
cores or chelates or other magnetic structures, has a size comparable to the
size of the
analyte, so that the bound analyte just fills the second magnetic field
region, excluding the
liquid from that region, thus providing highest signal and highest
sensitivity. For example,
when the analyte is a relatively small molecule such as an explosive vapor
molecule or a
chemical weapon molecule, then the size of the second magnetic field region is
preferably
chosen to be in the range of 1 to 10 nm. To detect a larger analyte, such as a
toxin or
CA 02604150 2007-10-09
WO 2007/086840 PCT/US2006/002368
-11-
DNA or virus particle, then the size of the second magnetic field region would
be 10 to
100 mn. When the analyte is an even larger objects such as a bacterium, the
size of the
second magnetic field region may be 100 to 1000 run or larger as needed to
match the
analyte.
[040] The nanoparticles may include structures that provide an optical
signature. For
example, fluorescent dyes or centers may be attached to or included within the
nanoparticles, and may be exposed to photons of sufficient energy to excite
fluorescence,
causing emission of fluorescence photons having an energy different from, and
usually
lower than, the excitation photons. The excitation and fluorescence photons
may be in the
ultraviolet, visible, or infrared range. Detection of the fluorescence photons
provides a
measure of the nanoparticle concentration. In addition, the structures may be
modified
when analyte binds to the nanoparticle, and such action may result in a
detectable change
in the fluorescence such as a change in the intensity or energy of the
fluorescence photons.
Detection of this change would provide an indication, independent of magnetic
resonance
measurements, that analyte binding has occurred and thus that analyte is
present in the
sample.
[041] Other features and advantages of the invention will be apparent from the
following
detailed description, the claims and the appended drawings.
Brief Description of the Drawings
[042] The details of the present invention, both as to its structure and
operation, may be
gleaned in part by study of the accompanying drawings, in which like reference
numerals
refer to like parts, and in which:
[043] Figure 1 is a schematic representation of a nanoparticle showing the
applied
magnetic field and the second magnetic field around the nanoparticle.
[044] Figure 2 is a graph of the net magnetic field surrounding the
nanoparticle of Figure
1.
[045] Figure 3 is a plot of the magnitude of the magnetic field gradient
around the
nanoparticle.
[046] Figure 4 is a plot of the field gradient magnitude along the axis of the
particle.
CA 02604150 2007-10-09
WO 2007/086840 PCT/US2006/002368
-12-
[047] Figure 5 which is a functional block diagram of a magnetic resonance
system.
[048] Figures 6a-d is a representation of four configurations of the antenna.
[049] Figure 7 is a schematic representation of one embodiment of a magnet.
[050] Figure 8 is a circuit diagram of a buffered oscillator.
[051] Figure 9 is a schematic illustration of an installation having one
controller and
multiple sensor units.
[052] Figure 10 shows a schematic of an HVAC monitor system.
[053] Figures 1 la-e depict an embodiment of a fixed installation system and
three
collector intakes.
[054] Figure 12 is a front perspective view of a hand-portable system.
[055] Figure 13 is a block diagram of a system adapted to a medical diagnostic
application.
Detailed Description
[056] After reading this description it will become apparent to one skilled in
the art how
to implement the invention in various alternative embodiments and alternative
applications. However, although various embodiments of the present invention
will be
described herein, it is understood that these embodiments are presented by way
of example
only, and not limitation. As such, this detailed description of various
alternative
embodiments should not be construed to limit the scope or breadth of the
present invention
as set forth in the appended claims.
Magnetic Resonance
[057] A brief summary of the technical elements used in certain embodiments is
provided herein. The analyte or target molecule is contained in a medium,
preferably a
liquid such as water, which includes an atomic nucleus that has a non-zero
spin, such as
hydrogen. As is well known, (see for example, Pulse Methods in 1D & 2D Liquid-
Phase
CA 02604150 2007-10-09
WO 2007/086840 PCT/US2006/002368
-13-
NMR, Wallace S. Brey, Academic Press 1988), that the magnetic component of
such a
nucleus becomes polarized or spatially oriented in a magnetic field, and may
be induced
into magnetic resonance precession at a frequency given by:
fLarmor = y B/tit ,
where B is the magnetic field strength at the position of the nucleus, y is
the magnetogyric
ratio of the nucleus, and fLarmor is the resonance frequency or Larmor
frequency (y =
2.675x10⁸ Tesla 1 see-' for the hydrogen nucleus). The magnetic components, or
magnetic
moments, of the nuclei are vector quantities and add to give a resultant bulk
magnetization
vector that is the NMR signal measured by NMR spectrometers.
[058] Following a perturbation such as that employed in recording NMR signals
(see
below), the bulk magnetization vector recovers to its original steady state
over time; this
process is referred to as nuclear magnetic relaxation. Two fundamental time
constants are
used to describe this relaxation in terms of a single-exponential process.
Recovery of the
bulls magnetization along the direction of the first magnetic field is
described by the spin-
lattice relaxation time or longitudinal relaxation time, designated as Ti.
Typically, T1 is
of order milliseconds to seconds. The single-exponential decay of bulk
magnetization in
the plane perpendicular to the direction of the first magnetic field is
described by the spin-
spin relaxation time, or transverse relaxation time, designated as T2. For
liquid signals,
T2 is generally in the range of 100 milliseconds or more. Solid samples on the
other hand,
generally have T2 values in the range of 1 to 100 microseconds.
[059] A magnetic resonance measurement is performed by applying one or more RF
(radio frequency) energy pulses to the sample and measuring the bulk
magnetization that
becomes reoriented by the pulse. The RF pulses have a frequency equal to the
Larmor
frequency, and duration sufficient to cause the bulk magnetization vector to
reorient into a
plane perpendicular to the first magnetic field, where the bulk magnetization
vector (the
NMR signal) can be recorded over time. The RF pulses therefore, are usually
multiples of
90 degrees.
[060] Spin-spin relaxation is typically measured by a series of RF pulses to
give rise to
spin echo signals. A spin echo is generated by a 90-degree pulse followed by a
small
delay time (typically designated as c), followed by a 180-degree pulse (90 -ti-
180 ). A
second ti, identical in time to the first, is used before the bulk
magnetization vector is
CA 02604150 2007-10-09
WO 2007/086840 PCT/US2006/002368
-14-
recorded. The series of RF pulses and time delays is used to first dephase the
nuclear
magnetic moments comprising the bulk magnetization in the plane perpendicular
to the
first magnetic field during the first ti, and refocus the remaining bulk
magnetization in this
plane during the second ti. This latter refocusing creates an echo signal,
which can be
recorded. The most common method to measure spin-spin relaxation is that
originally
described by Can and Purcell (Carr, H.Y. and Purcell, E.M.: Effects of
Diffusion on Free
Precession in Nuclear Magnetic Resonance Experiments, Physical Review 94, no.
3
(1954): 630-63 8), a modification of the method described earlier by Meiboom
and Gill
(Meiboom, S. and Gill, D.: Modified Spin-Echo Method for Measuring Nuclear
Relaxation Times, The Review of Scientific Instruments 29, no. 8 (1958): 688-
691). The
Carr-Purcell modified Meiboom-Gill (CPMG) method uses a series of small time
delays
followed by 180-degree pulses after the initial 90 -ti-180 sequence described
above. This
in turn is followed by the resultant bulk magnetization vector [90,,'-(,U-
180y -t-record)õ].
The amplitudes of the spin echo signals are proportional to the bulk
magnetization
remaining at the time of the echo, which becomes successively smaller as the
number of
sequences increases (as the value of n increases). Therefore, measuring the
amplitude of
the bulk magnetization vector after various values of n and fitting the data
to a single
exponential decay with T2 as the relaxation time provides a direct measure of
T2.
Paramagnetic Nanoparticle Fields
[061] In a preferred embodiment, nanoparticles are employed to influence the
magnetic
field in a region close to the nanoparticles. The paramagnetic or
superparamagnetic core
of the nanoparticle becomes magnetized when an external magnetic field is
applied to it.
Superparamagnetism is related to ferromagnetism in which the size of the
magnetized
body is too small to form a magnetic domain. The superparamagnetic core
exhibits a high
permeability and fairly high saturation field comparable to iron, but little
or no hysteresis
(He-0). When placed in a magnetic field, the core becomes strongly magnetized
parallel
to the direction of the applied field. When the external field is removed, the
core loses
essentially all of its magnetization. Disregarding anisotropy and shape
effects, the induced
magnetic moment of the core is given by:
mcore (47L/3) (rcore) (x Bo)
where more is the dipole moment of the core, rcore is its radius, Bo is the
applied field, and
x is the susceptibility. Normally x;z~0 for nonmagnetic materials, x>~l for
CA 02604150 2007-10-09
WO 2007/086840 PCT/US2006/002368
-15-
superparainagnetic materials when Bo is below a saturation field, and 1<_x<_O
for Bo above
saturation. For example, magnetite (Fe304) is superparamagnetic with a
susceptibility of
about 1 for fields below saturation of about 0.5 Tesla.
[062] The magnetized core produces a magnetic field which usually approximates
a
dipole field, or the magnetic field produced by an ideal magnetic dipole
located at the
center of the paramagnetic core of the nanoparticle. At locations outside the
nanoparticle
core, the dipole magnetic field is parameterized as follows:
Br = 2 meore cose/r3
Bo = -mcore sine/r3
[063] Here Br is the radial component of the dipole field, B0 is the
circumferential
component, r is the distance from the center of the core, 0 is the polar angle
relative to the
applied field, and mcore is the dipole moment.
[064] The dipole field adds linearly to the applied field (as vectors),
resulting in the net
magnetic field. The Larmor frequency is determined by the net magnetic field
experienced by the polarized nucleus. Components of the dipole field
orthogonal to the
applied field cause primarily a field rotation, whereas the dipole components
parallel to
the applied field directly change the magnitude of the net field and therefore
change the
Larmor frequency, relative to the undistorted applied field. The net field
Bnet ,
disregarding second order terms, and for r>>rC01e, is as follows:
But = Bo (1 + 4rc/3 (rcore/r)3 x (2 cost 0 - sin2 0 ))
[065] In some embodiments the magnitude of the gradient of the net magnetic
field is
also important. The field gradient is given by:
VBnet = Box 87C (reore3/r4) (-{r} cost 0 +{0} cos 0 sin 0)
where curly brackets denote unit vectors in the r or 0 directions.
Diffusion in a Liquid
[066] Some embodiments include a liquid medium. The liquid contains the
analyte and
the nucleus that emits the magnetic resonance signals. Those signals are
influenced by
diffusion, particularly the diffusion of the molecules of the liquid through
the liquid, or
molecular self-diffusion. Diffusion is formulated as follows:
CA 02604150 2007-10-09
WO 2007/086840 PCT/US2006/002368
-16-
Uwalk - (2 Dmolec t)1/2
where 6walk is the average distance traveled in an isotropic three-dimensional
random walk
in time t, and D,notec is the translational diffusion coefficient. For
example, Dmolec
1.5x10"9 m2/s for water at room temperature.
[067] Magnetic resonance measurements are also influenced by spin diffusion, a
phenomenon in which the spin or polarization of a nucleus is interchanged with
that of a
nearby nucleus of the same type. Spin diffusion can distribute spin-dependent
effects,
such as depolarization, throughout the sample. For example, if a small
fraction of the
hydrogen nuclei in water experience a depolarizing force, spin diffusion can
cause all of
the hydrogen in the sample to assume an averaged polarization value.
A Model
[068] This model addresses spin-dependent interactions between nanoparticles
and
solvent, and provides a useful framework for quantifying the observed T2
effects. It is
used in some embodiments as the basis for measuring and detecting analytes. A
simplified
nanoparticle is assumed to consist of a spherical core of superparamagnetic
material,
surrounded by a spherical shell of non-magnetic material, all in water.
However, the
model can be applied or modified for use with nanoparticles of other shapes
and for use
with other solvents. The model suggests the following mechanisms for the
observed T2
changes:
[069] (1) Nanoparticles in solution reduce T2 relative to plain water. The
model
suggests that depolarization is due to a dipole magnetic field produced by the
magnetized
core. The field distortion causes spins to precess at different frequencies,
leading to
destructive interference. Although CPMG normally refocuses static field-
nonuniformity
effects, the Brownian motion of the water molecules causes them to enter and
exit the field
distortions in a time shorter than the echo interval, thereby making the spin
dispersion
time-dependent and breaking the CPMG refocusing effect.
[070] (2) When nanoparticles react with analyte, but do not agglomerate, the
T2
increases. This may be due to the analyte molecules occupying part of the
distorted-field
region around the nanoparticle, thereby excluding water from that region, thus
reducing
the spin dispersion and increasing T2.
CA 02604150 2007-10-09
WO 2007/086840 PCT/US2006/002368
-17-
[071] (3) T2 decreases when nanoparticles and analyte agglomerate. This may be
due to
the formation of a water-filled cage-like structure in which water molecules
undergo
repeated spin-dispersion collisions with the surrounding nanoparticles.
Sufficient
repetition of incremental depolarization would reduce T2, despite the analyte
occluding
portions of the non-uniform field regions.
[072] (4) A single exponential usually fits the polarization decay curve. This
is despite
the fact that hydrogens close to nanoparticles are strongly dephased, while
the general
solvent sees only a uniform field, a two-population system. However, the spin
populations
are rapidly equilibrated across the sample by spin diffusion via homonuclear
flip-flop
interactions, resulting in a single averaged T2.
[073] The model nanoparticle is depicted in cross section in Figure 1 in the
presence of
an applied magnetic field indicated by arrow 110. The nanoparticle consists of
a
magnetizable core 112 which preferably is paramagnetic and more preferably is
superparamagnetic. The induced local dipole-shaped field of the nanoparticle
is
represented by the dashed lines. The radius of the core should be large enough
to produce
a significant magnetic field distortion in a large enough region to produce a
change in T2
of the liquid in that region. The radius of the core should be small enough
that the core
does not become ferromagnetic. Typically the core radius is about 1 to 20 nm.
Desirable
properties of the core include high susceptibility at the applied magnetic
field strength,
high saturation field preferably in excess of the applied magnetic field
strength, chemical
compatibility with the liquid medium, and very low remnant field. The last
feature is
desirable to prevent nanoparticles from clumping together due to magnetic
attraction. The
core material may be any magnetizable material such as iron oxide, cobalt, and
nickel
compounds. Nanoparticles can be non-toxic and biodegradable if an iron core is
used. The
core is coated by one or more shells 114 of non-magnetic material, for
example, dextran or
silica. Silica coatings are stable and robust, and may avoid the need for
refrigeration.
Other polymeric coatings may be considered such as polystyrene, polyacrylic
acid,
polyacrylamide and polyvinyl alcohol.
[074] The net field magnitude at location (r,O) around the nanoparticle has
both positive
and negative variations relative to a uniform field. This is shown in the
graph of Figure 2.
CA 02604150 2007-10-09
WO 2007/086840 PCT/US2006/002368
-18-
[075] While the CPMG procedure refocuses static field non-uniformities, those
water
molecules that move from one field region to another, in the time between
refocusing
pulses, are not refocused and produce T2 effects. Thus, T2 changes are related
to the
gradient of the net field.
[076] To consider a specific example, the core is Fe3O4, with a 4-8 nm
diameter, and the
rest of the particle is shell, with an overall 50 nm diameter. The
susceptibility and
saturation field depend on the composition, crystal structure, and core
diameter. Values of
the saturation field range from 0.2 to 0.5 T, and susceptibility ranges from
0.2 to 2. A
numerical simulation was prepared using 0.5T saturation and 0.5 for
susceptibility. The
net field in the vicinity of this nanoparticle is shown in Figure 2. Strong
field
enhancements at the two "poles" of the particle are seen, relative to the
field reduction
around the "equator". The field within the shell is of no interest and is not
calculated; it is
plotted as BO.
[077] The magnetic field gradient is shown in Figures 3 and 4. Figure 3 is a
plot of the
magnitude of the field gradient around the nanoparticle. Figure 4 is a plot of
the field
gradient magnitude along the axis of the particle. Again, fields inside the
particle are not
analyzed.
[078] For an echo interval of TE,.h,, 4 msec, the average walk distance is
about 3.5
microns. This is much larger than the length scale of the distorted-field
regions; hence it is
safe to assume that the water molecule has enough time to enter and exit the
distorted-field
region between refocusing pulses.
[079] The spin dephasing produced by the water molecule passing through the
distorted
field region can be estimated as follows. The instantaneous precession
frequency is
proportional to the net magnetic field at the water molecule's location. For
simplicity we
assume that the molecule random-walks through the distorted-field region of
one
nanoparticle, during one echo interval, starting and ending in the main
solvent which has
only the applied field of BO. While the molecule is within the distorted
field, it
accumulates extra precession compared to the rest of the solvent. The phase
advance due
to the B0 field is then refocused as usual by the 180 pulses, but the extra
precession phase
from time spent in the distorted field will not be refocused. The unrefocused
phase
CA 02604150 2007-10-09
WO 2007/086840 PCT/US2006/002368
-19-
increment due to traversal of a field distortion is the integral of the field
experienced by
the particle, minus that in the main solvent:
dphase = f y(Bnet(r) - Bo) dt
where dpi,ase is the accumulated phase difference between a hydrogen which
passes through
Bnet (here an explicit function of space) versus one remaining in the uniform
field Bo, y is
again the Larmor coefficient and the integral is over the time between
refocusing pulses.
To obtain a rough estimate of the phase shift, the previous equation may be
simplified by
assuming that the molecule resides in a constant field for a time needed to
diffuse through
the distorted field region, resulting in the following approximation:
dphase ~ [xdis2/(2 Drmiec)][Bnet-Bo]y
[080] Using the nanoparticle sizes and field assumptions discussed above, the
net
magnetic field deviates from the applied field by typically 20 mT . The spins
within that
field will precess about 850 kHz faster than in the main solvent. A typical
length scale for
this distortion is xdis=20 nm. The time needed to diffuse 20 nm is 133 nsec.
During that
time, the spins precess an extra dphase 0.1 radians. This represents a
substantial dephasing
in a single echo interval by a single molecular traversal, which if not
refocused by CPMG
will result in a short T2. In the sample, many water molecules will be
interacting with the
nonuniform field continuously, and each will experience a positive or negative
phase shift
depending on the specific path. In the ensemble, the extra spin dispersion
causes
destructive interference and overall depolarization.
[081] The spin diffusion coefficient in water is in the range of Dspin X10"11
to 10-16 m2/s
depending on temperature and other factors. Although spin diffusion is slower
than
molecular diffusion, it is sufficient to spread the depolarization among many
water
molecules in a few msec. Interestingly, solid-state spin diffusion rates tend
to be much
higher, of order 10-9 m2/s which is comparable to the molecular diffusion in
free water. If
the shell exhibits rapid spin diffusion, it could serve as a conduit for
distributing
polarization among all of the water molecules contacting the nanoparticle
surface.
[0821 Several experiments have demonstrated a T2 increase of 20 to 200 msec.
The
model suggests that this is due to the analyte molecules obstructing the
surface of the
CA 02604150 2007-10-09
WO 2007/086840 PCT/US2006/002368
-20-
nanoparticle, effectively preventing water molecules from sampling the
distorted-field
regions at the surface of the nanoparticle.
[083] When analyte molecules attach to the surface of a nanoparticle, a
portion of the
surface is occluded. The global depolarization rate goes down and T2
increases. The
change in decay rate is roughly proportional to the fraction of the distorted-
field volume
occupied by the analyte. If multiple analyte molecules are attached, they all
contribute a
similar T2 change on average. If the analyte spends only part of its time
covering up the
surface of the nanoparticle, then the T2 change scales proportionately.
[084] A decrease in T2 may also be observed by changing the ratio of the
nanoparticles
to antibodies. Here antibody is used as an example of the connection to the
analyte. This
is defined as stoichiometry control. Depending on the level of detection of
analyte one
can adjust the stoichiometry to allow rapid detection of analyte.
[085] The reagents and processing conditions may be adjusted to cause a
decrease in T2.
Formation of extended aggregates of nanoparticles and analytes is correlated
with such a
T2 decrease. The model posits that the aggregates are open, cage-like
structures through
which water molecules may pass easily. This is not explained in earlier
studies. In one
embodiment, spin information diffuses in and out of the agglomerate structure
rapidly, so
that the depolarization occurring within the cage is equilibrated throughout
the sample.
[086] The model suggests that the T2 decrease for agglomerates is due to
repeated
dephasing when water molecules within the cage repeatedly encounter
depolarizing fields.
Such repeated dephasing represents a more effective polarization sink than
isolated
nanoparticles in the free liquid because the caged water molecule remains in
close
proximity to numerous nanoparticle surfaces. While portions of the
nanoparticle's
distorted-field volumes are occluded by analyte, the water molecule could
spend a
significant fraction of its time sampling fields that differ from the main
field, and thus
would become totally dephased in a time short compared to the echo interval.
Then, by
trading polarization with neighboring molecules including those outside the
agglomerate, a
uniformly reduced T2 would result.
[087] The model has utility because it leads to new measurements and new ways
of
performing measurements related to analyte in the sample. The model explains
how the
analyte interactions with nanoparticles produce both increases and decreases
in T2, and
CA 02604150 2007-10-09
WO 2007/086840 PCT/US2006/002368
-21-
suggests ways to control the effects by adjusting reagent concentrations.
Noting that
speed of detection is a critical parameter for many applications, the model
suggests that
the T2 increase method due to analyte-nanoparticle binding will provide the
signals faster
than the T2 decrease from aggregation, because binding must occur before the
agglomerations. The model also guides the development of more sensitive
nanoparticles
using higher-susceptibility core material and thinner non-magnetic shells. The
model also
leads to steps for canceling systematic errors, such as measuring the T2 of
the nanoparticle
solution and the sample separately, before mixing, to better quantify any T2
changes from
the binding. The model also explains how thermal effects and diffusion effects
participate,
and can be exploited to accelerate the detection or confirm analyte reactions.
The model
also guides the development of products exploiting the inventive methods by
quantifying
signal and noise versus sample size and other design parameters.
Method description
[088] In one embodiment a method for detecting one or more analytes includes:
preparing a liquid sample mixture, which may contain the analyte and other
materials;
applying a first magnetic field to the liquid; preparing a second and distinct
magnetic field
within a special region of the liquid; maintaining the analyte, if any is
present, within the
special region (for example, by providing means for holding the analyte,
securing that
binging agent adjacent to the special region and allowing the analyte to
interact with the
binding agent); exciting magnetic resonance signals from the mixture while the
analyte is
maintained within the special region; analyzing the signals to determine
whether analyte
occupies the special region; and then concluding that analyte is present when
the signals
indicate that the liquid is displaced from the special region.
[089] In one embodiment preparing the liquid sample mixture includes the use
of a liquid
which contains an atom with a nucleus having non-zero spin. The atoms may be
an
intrinsic part of the liquid, or they may be added as solute. The step of
preparing a liquid
sample can include mixing or stirring to ensure that analyte reaches
nanoparticles. Mixing
can be achieved in numerous ways, including by driving the sample fluids
through
convoluted tubes using a pump, and such motion may be unidirectional or
reciprocal to
produce the desired level of mixing. Alternatively, the nanoparticles and the
analyte may
be contained in the same type of liquid, so that when the nanoparticles and
analyte are
placed in the same container, they spontaneously become mixed without the need
for
physical stirring. For example, the nanoparticles and the sample material may
be
CA 02604150 2007-10-09
WO 2007/086840 PCT/US2006/002368
-22-
dissolved in water and then intermingled by diffusion in the measurement
container.
Unassisted mixing may also be arranged by use of highly miscible solvents,
such as
alcohol and water, for the various ingredients.
[090] The method can also include temperature cycling wherein a sample may be
heated
or cooled at a fixed location, or the sample may be moved between locations
maintained at
high or low temperatures. The method can include taking measurements before,
during,
and after such temperature changes. For example, a measurement for T2 may be
taken
immediately upon mixing the sample, and again after a period of heating and
cooling
when the sample comes to equilibrium temperature. Comparison of the T2 values
before
and after thermal processing will reveal reactions, such as analyte binding to
nanoparticles, which occurred during thermal processing.
[091] The method can include the steps of changing the temperature of the
sample and
then measuring the T2 parameter. Temperature affects the nanoparticle
interactions and
the magnetic resonance measurement. Selective binding between the analyte and
the
affinity molecules on the nanoparticles may be accelerated by raising the
temperature,
particularly for diffusion-limited reactions. Thus the method may include
measuring the
T2 of a mixture of nanoparticles and unknowns within the liquid at a first
temperature,
preferably a sufficiently low temperature that the analyte has not reacted
with the
nanoparticles when the measurement is made. The method may then include the
step of
heating the sample to a second temperature sufficient to promote analyte-
nanoparticle
interactions. The method may include measuring the T2 at the second
temperature to
observe effects of the binding. The method may include a further temperature
change,
such as return to the first temperature, and further T2 measurements to
confirm that the T2
of the sample after the various temperature changes differs from the T2 of the
sample
before the temperature changes. The steps provide many advantages, including
improved
discrimination against interferents, demonstration that the T2 change is due
to analyte-
specific binding, and a check for instrumental errors.
[092] The method may include heating the sample to a temperature sufficient to
disrupt
the analyte-nanoparticle aggregations, thus producing a solution of analyte-
nanoparticle
binaries, with a corresponding T2 change. The temperature may be raised
further until the
analyte is disbonded from the nanoparticles, thus releasing analyte back into
the solution
and causing a further T2 change. The temperature may then be lowered until
binding or
CA 02604150 2007-10-09
WO 2007/086840 PCT/US2006/002368
-23-
aggregation is restored, with corresponding reversion of T2 to the earlier
value. This
behavior in T2 versus temperature would strongly discriminate against
interferents or
instrumental errors, and would confirm the presence of analyte.
[093] The method may include the step of measuring the T2 of the sample
material prior
to mixing with nanoparticles. This would reveal a sample material which causes
a shift in
T2, such as a high-viscosity solution or chelated iron in the sample. When the
sample
material causes only a small T2 shift, the measurement may proceed as usual,
but in
analysis the T2 of the processed sample may be compared to that initially
observed in the
raw sample to determine whether analyte is present. When the sample produces a
large T2
shift, it may be advantageous to dilute the sample until its effects are low
enough to permit
the magnetic resonance measurements. Analyte in the diluted sample may then be
detected as described. When the sample produces such a large T2 shift that
magnetic
resonance measurements are prohibited, the invention can flag that sample as
un-testable,
thereby avoiding a false alarm, or it can archive the sample for further
analysis.
[094] The method can include preparing a magnetic field in a particular way.
The field
may be prepared by first generating a substantially uniform first magnetic
field with
sufficient intensity to permit magnetic resonance measurements, and then
perturbing that
field locally to produce a second magnetic field, distinct from the first,
within a special
region. The second field is distinct from the first when the magnetic
resonance signals of
the liquid outside the special region are influenced by or can be
distinguished from signals
of liquid inside the special region. For example, the second field can be
created by mixing
or dissolving paramagnetic particles, for example, those nanoparticles
describe above, in
the liquid. The nanoparticles then spontaneously generate the second magnetic
field, in a
region closely exterior to the nanoparticles, as a result of magnetization of
the
nanoparticles by the first magnetic filed. Alternatively, paramagnetic ions
such as
chelated iron or gadolinium could be employed instead of nanoparticles. An
advantage of
this approach is that diffusion-limited reaction rates may be increased due to
the higher
mobility of metal-ion chelates. Similar ions are used in MRI imaging (Gd-DTPA
and Gd-
DOTA.).
[095] Holding the analyte within the special region can be accomplished by
reacting or
binding or otherwise attracting the analyte to a material surface or molecule
for which the
analyte has particular affinity. Such holding may be accomplished by hydrogen
bonds,
CA 02604150 2007-10-09
WO 2007/086840 PCT/US2006/002368
-24-
ionic forces, covalent bonds, van der Waals forces, electrostatic forces, or
any other type
of molecular or material attachment. For example, the holding mechanism may be
an
antibody raised against an analyte protein, or DNA complementary to analyte
DNA
sequences and can include any material surface or molecule for which the
analyte has an
affinity. Preferably the holding mechanism also has null affinity or negative
affinity for
all solutes other than the analyte which may be present. Preferably, the
holding
mechanism is secured proximate to the special region, so that the analyte will
be held
within the special region. For example, when the special region is exterior to
a
nanoparticle, antibodies to the analyte, or the other holding mechanisms
mentioned above,
may be attached to the surface of the nanoparticle, so that the analyte will
be held adjacent
to the nanoparticle within that region and the liquid will be excluded.
Optionally, the
nanoparticle may include multiple antibodies, or complimentary DNA, or other
binding
agents so as to interact with a number of different, but selected, analytes.
For example, the
nanoparticle could be adorned with complementary DNA for anthrax, antibodies
for ricin,
and complementary DNA sequences for smallpox, thereby enabling detection of
any of
these analytes in a single mixture.
[096] The magnetic resonance measurements and analysis to determine whether
the
analyte occupies the special region can include analyzing the magnetic
resonance signals
by spectral analysis to seek a frequency component characteristic of the
special region.
That frequency component, if present, indicates that the liquid is in the
special region, and
therefore the analyte is not present. Alternatively the step could include
applying the
CPMG procedure, and analyzing the signals to determine the T2 of the liquid.
The T2
distribution may be a single exponential component, or it may include a
multitude of
components, depending on the spin diffusion rate. In either case, however, a
T2 which is
longer than the T2 of the baseline case (liquid with the nanoparticles and no
analyte)
indicates the presence of the analyte.
[097] A variation of the method includes forming an aggregate comprising a
plurality of
analyte entities. Then, a reduction in T2 (compared to the baseline) indicates
the presence
of the analyte. For example, an aggregate of nanoparticles with attachment
mechanisms
and analyte molecules may form when both nanoparticles and analyte molecules
have
multiple attachment points. Since the aggregation results in a decrease in T2,
whereas
binding of analyte to nanoparticles results in an increase in T2, it is
important to
previously calibrate the signals, so that the expected sign of T2 change is
known in
CA 02604150 2007-10-09
WO 2007/086840 PCT/US2006/002368
-25-
advance. Nanoparticle stoichiometry can be adjusted to prevent agglomeration
or to cause
agglomeration depending on the measurement process to be used.
[098] In one embodiment, analyte causes nanoparticles to form extended
aggregates.
Membrane filters are used to separate those aggregates from the liquid medium.
The pore
size of the filter is preferably larger than the size of the nanoparticles or
of the analyte, but
smaller than the aggregates. When an agglomerated sample is filtered, the
filtrate has a
reduced concentration of both nanoparticles and analyte, which are thus both
greatly
concentrated as a filter cake. When secondary analysis means are desired, for
example to
confirm detection of a microbe, the filter cake is used for that secondary
analysis.
Likewise, the filtrate liquid may be re-measured using the inventive system as
an
additional check, since the T2 of the filtrate should be much longer than of
the initial
nanoparticle solution when most of the nanoparticles have been filtered out.
[099] The method may include the steps of measuring the T2 value of a
standard. Here a
standard is any material which has a known T2. Preferably the T2 of the
standard is
unchanging in time and is known from prior calibration measurements. For
example the
standard may be a solution of nanoparticles or of copper sulfate with a
concentration
adjusted to provide a particular value of T2. Standards enable detection and
correction of
instrumentation drifts. The standard may be a liquid which is not a solution,
such as an
oil selected to have a T2 in the desired range. The standard may be arranged
to have a T2
substantially equal to that of an analyte-free sample, in which case it is
called a negative
comparator. The standard may have a T2 close to that produced by the analyte,
a positive
comparator. The method may include measuring the T2 of multiple standards with
different T2 values.
[0100] The method can include the step of testing a positive and/or a negative
control. A
positive control can be a benign analyte, such as bacillus subtilis along with
nanoparticles
sensitized to it. The positive control may be analyzed at any time, and should
be detected
in the same way as a threat analyte. Preferably the T2 change produced by the
positive
control is known from prior calibration, and testing the positive control
should always
produce the expected T2 change, and failure to do so would reveal a
malfunction in the
system. A negative control is a benign analyte along with nanoparticles
sensitized to some
other materials, for example bacillus subtilis combined with nanoparticles
sensitized to
anthrax. The negative control should never produce a T2 change because the
analyte and
CA 02604150 2007-10-09
WO 2007/086840 PCT/US2006/002368
-26-
the nanoparticles are not matched. If a negative control produces a T2 change,
it would
reveal a malfunction of the system. An advantage of running positive and
negative
controls is that the entire sample collection, fluidics, sample processing,
and detection
stages are tested realistically. For comparison, the positive and negative
comparator
standards discussed in the previous paragraph test only the magnetic resonance
portion of
the system, not the sample processing stages.
[0101] The method can include the steps of producing both an increase and a
decrease in
T2 of the sample. The increase or decrease in T2 depends on the properties of
the
nanoparticles, ratios of other reagents such as antibodies, and on other
processing
parameters. Thus a sample may be tested for a T2 increase using processing
steps to
generate a T2 increase when analyte is present, and then the same sample may
be tested
for a T2 decrease by adding the ingredients or processing steps which produce
a T2
decrease. Observation of both increasing and decreasing T2 values would
enhance the
reliability of the analysis and reduce the false alarm rate. Alternatively,
two aliquots
drawn from the same sample may be processed to generate a T2 increase in one
and a
decrease in the other.
[0102] Interferents are materials which, if present in a sample, cause a
change in T2
mimicking that of the target analyte. Most interferents produce a shorter T2,
including
materials containing chelated iron and materials causing an increase in
viscosity of the
liquid. Thus the effects of analyte and interferents may be discriminated by
processing the
sample so that the analyte will produce a T2 increase. For even greater
analyte-interferent
discrimination, both increases and decreases in T2 may be arranged, either by
sequential
processing of the same sample or by comparison of parallel aliquots.
[0103] The method can include the step of measuring the T2 of a nanoparticle
mixture
prior to adding the sample material to that mixture. The advantage of this
step is that any
errors in the nanoparticle concentration or properties would be revealed
before the sample
material is used. If the nanoparticle solution exhibits an unexpected value of
T2 (for
example due to a high or low nanoparticle concentration from a metering error)
then the
nanoparticle solution may be dumped and a new nanoparticle solution may be
prepared. If
the nanoparticle solution exhibits a value of T2 close to that expected, then
the
nanoparticle solution may be employed. Preferably the measured value of T2 is
then used
CA 02604150 2007-10-09
WO 2007/086840 PCT/US2006/002368
-27-
in the analysis for comparison against the T2 of the mixed and reacted sample,
thereby
negating errors due to nanoparticle concentration and also improving
reproducibility.
[0104] The method may include the steps of mixing the sample material and
nanoparticles
in the liquid, then measuring the T2 of the mixture, then promoting reactions
between
analyte and nanoparticles, and then measuring the T2 after such reactions. For
example,
the sample may be shaken or heated to promote the reactions. Simultaneous
mixing and
heating may be used to accelerate reactions. Comparison of the T2 of the
mixture before
and after the reactions reveals the analyte. An advantage of these steps is
that any errors
in the volumes of sample and nanoparticles would be detected and negated.
[0105] In one embodiment hazardous chemicals are generally not required. For
example,
analytes can be tested using only water, salts, nanoparticles, and harmless
proteinaceous
reagents such as antibodies.
System description
[0106] One embodiment of a system which can carry out or implement the
measurement
or detection techniques described above will now be described with reference
to Figure 5
which is a functional block diagram of a magnetic resonance system generally
indicated as
500. The system includes magnet or magnet system 512. In one embodiment the
magnet
512 is a permanent magnet configured to produce a 0.5 Tesla magnetic field
with 0.01 %
uniformity within a sample area or volume 514 of I ml. Alternatively, the
magnet system
may include an electromagnet, a superconducting coil, or any other source of
magnetic
field. A coil or antenna 516 is located adjacent to the sample volume. In one
embodiment
the coil encircles the sample volume 514. A pulse generator 518 is coupled to
the coil 516
to provide electromagnetic pulses at the desired Larmor frequency to the
sample volume
514. An amplifier 519 may be placed between the pulse generator and the
antenna to
amplify the signal from the pulse generator. A receiver 520 is also coupled to
the coil 516
so as to receive signals picked up by the coil. A preamplifier 521 may be
placed between
the receiver and the antenna to amplify the antenna signals. The receiver 520
converts the
received signals into a digital form. A controller 522 is in communication
with the pulse
generator 518 and the receiver 520. The controller controls the operation of
receiver and
the pulse generator. The controller also receives the signals received by the
receiver after
they have been converted into the digital form. The controller 522 can be a
general
purpose processor, a digital signal processor (DSP), an application specific
integrated
CA 02604150 2007-10-09
WO 2007/086840 PCT/US2006/002368
-28-
circuit (ASIC), a field programmable gate array (FPGA) or other programmable
logic
device, discrete gate or transistor logic, discrete hardware components, or
any combination
thereof designed to perform the functions described herein. Alternatively, the
functions of
the controller, pulse generator, receiver, and user interface may be combined
into a single
unit such as an ASIC or FPGA, or a board integrating such circuits. A user
interface
system 524 is coupled with the controller 522. The user interface system 524
provides a
mechanism for interaction between a user and the system 500. The interface
system can
include, for example, a display such as a liquid crystal screen, indicator
lights, a key
board, a mouse, an audio speaker, a microphone, switches, or a touch screen.
[0107] The RF coil can be made small enough to interrogate volumes of micro
liter size
sample volumes or large enough to accommodate liters of sample. This is a
scalable
system. Figures 6a-d are a representation of four configurations of the
antenna, each in
perspective view. In part a of the figure, a solenoidal coil is shown having a
density of
windings which is constant along the length of the coil. The sample is placed
inside the
coil for measurement. The coil acts as an antenna to couple RF energy into the
sample
nuclei, and also to couple the magnetic resonance signal from the nuclei out
to the rest of
the system.
[0108] In part b of the figure, a solenoidal coil having a variable winding
density is
shown. The winding densities are higher at the ends of the coil than at the
middle. An
advantage of using a variable winding density is that the RF magnetic field
generated by
the coil may be made more uniform than that of a coil of the same size with
constant
winding density.
[0109] In part c of the figure, a two-turn single-sided coil is shown. An
advantage of this
configuration is that an elongated container such as a tube may be inserted
and removed
without disconnecting either the coil or the tube.
[0110] In part d of the figure, a coil configuration is shown wherein four
loops
cooperatively generate a transverse RF magnetic field. Elongated samples may
be inserted
without disconnecting the coil or the tube.
[0111] The specific user interface and output of the system is highly
application-
dependent, but will typically include transmission of information dependent on
detection
of analyte. For example, such communication may involve recording or archiving
test
CA 02604150 2007-10-09
WO 2007/086840 PCT/US2006/002368
-29-
results, displaying a threat alert message, illuminating an alarm or beacon,
or activating an
acoustical alarm. Communicating data also includes sending signals to other
devices, such
as automatically shutting off an HVAC system or sequestering a test sample
responsive to
detection of selected analytes. The communication via the user interface can
include
electronic, optical, infrared, radio, microwave, mechanical, or acoustical
means, or any
other means for transmitting data or commands responsive to analyte test
results.
Additionally, the user interface can include remote communication interfaces
such as a
network interface card and a wireless access card which are in communication
with the
controller. These can allow an operator or another device to communicate with
the
system, to relay commands or retrieve data or, convey an alarm. The
communication may
include transmitting information by the internet, by a local network, or by
direct electronic
or wireless link.
[0112] In one embodiment, the system is configured in two separate chassis,
one with the
magnet 512, the pulse generator 518 and the receiver 520. The other chassis
has the
controller 522 and the user interface 524. The two chassis exchange
information such as
commands and data by an electronic communication link, for example, cables, a
wireless
link, or a fiber optic link. In a preferred embodiment, the communication link
comprises a
USB interface employing standard USB connections on each chassis.
[0113] The magnetic resonance system 500 can excite magnetic resonance signals
from
the hydrogen nuclei in water in the sample volume 514 by applying
electromagnetic pulses
for example, radio frequency (RF) pulses, generated by the pulse generator 518
via the
coil. The system detects the magnetic resonance signals from the hydrogen
nuclei in the
water by inductively picking up the signals in the coil 516. The receiver
processes the
received signals using amplifiers, mixers, and analog-to-digital converters.
[0114] In one embodiment the system 500 measures the T2 of the water by the
CPMG
procedure or technique under the control of the controller 522. The
measurement includes
a 90-degree RF pulse generated by the pulse generator followed by a 2 msec
delay, and
then a string of 2000 180-degree pulses at 4 msec intervals. The phase of the
180-degree
pulses is orthogonal to that of the 90-degree pulse. The procedure generates
spin echoes
in the 4 msec intervals which are received by the receiver 520. In one
embodiment the
controller 522 performs an analysis routine which determines and records the
spin echoes,
performs FFT analysis to obtain spectral peaks, finds the maximum value of the
peaks,
CA 02604150 2007-10-09
WO 2007/086840 PCT/US2006/002368
-30-
and fits the peak values to a formula with three variables: the amplitude and
decay time of
an exponential, plus a time-independent background. The observed T2 value is
the best-fit
exponential decay time.
[0115] The analysis performed by the controller includes a comparison between
the
observed T2 value and a previously calibrated or measured T2 value. The
analyte is
detected by the system when the observed T2 value of the sample differs from
that of an
analyte-free sample. The previously calibrated T2 value can be determined by
measuring
a solution of water with the same concentration of nanoparticles as is used
for the
measurement of the analyte. The T2 of the water is influenced by the
concentration of
nanoparticles. The T2 is also influenced by analyte binding to the
nanoparticles and
occupying the high-gradient region around the nanoparticles. In the preferred
embodiment, the nanoparticle concentration is controlled by formulation of the
solution.
The T2 values of the solution without analyte, and with various concentrations
of the
analyte, are also known by prior calibration.
[0116] In one embodiment the nanoparticles are dissolved or suspended in a
water
medium. The nanoparticles have a sup erparainagnetic magnetite core with a
diameter of 8
nm, surrounded by a shell with a diameter of 50 nm. Antibody molecules (or
other
binding or attracting mechanism as described herein) specific to the analyte
are bound to
the shell. When the nanoparticles are in the sample 514, the core is
magnetized by the
field applied by the magnet 512, producing a local dipole field which adds to
the applied
field. The resulting net field includes spatial gradients of up to 0.1 T/nm,
within a region
extending radially from the surface of the nanoparticle to about 20 mu from
the surface.
The nanoparticles are most effective for detection and measurement purposes in
low
concentrations of about 1:10000 in water. That results in very little
consumption of the
nanoparticles per test. In one embodiment the magnet 512 of the magnetic
resonance
system 500 uses a permanent magnet for this purpose. The permanent magnet
requires no
power, may be made arbitrarily compact, and is economical. Most prior magnetic
resonance systems employed electromagnets or superconducting coils to generate
the
magnetic field. It is not feasible to arbitrarily reduce the size of
electromagnets or
superconducting magnets. If an electromagnet is scaled down in size, the
magnetic field
scales proportionately. If the field is held constant, then the current
density in the
electromagnet coils must be increased. Current density can not be increased
arbitrarily
because of a fundamental limit, the conductivity of copper. Above a certain
current
CA 02604150 2007-10-09
WO 2007/086840 PCT/US2006/002368
-31-
density limit, roughly 100 amps/cm2, the coils must be water-cooled. Above a
second
limit, roughly 200 amps/cm2, the coils self-destruct. Small, high-field,
steady-state copper
coils are not feasible.
[0117] It is likewise not feasible to reduce the size of superconducting
magnets arbitrarily.
Superconducting coils may be made much smaller and more powerful than
nonsuperconducting coils, and can carry high current densities. However,
superconducting coils must be surrounded by a vacuum-insulated cryostat,
usually having
multiple shells maintained at different cryogenic temperatures. Also, the
various shells are
mechanically and thermally interconnected by support struts. It is not
possible to make the
cryostat arbitrarily thin because of the thermal conductivity of support
members. The
cryostat limits the miniaturization feasible in superconducting magnets.
[0118] Permanent magnets have neither of these defects. A given magnet design
using
permanent magnets will scale precisely, with no change in geometry or field or
field
quality, to arbitrarily large or small dimensions. The only fundamental
limitation is the
ferromagnetic domain size, about 1 micron. By designing permanent magnet
systems, the
magnets may be scaled to a size determined by the sample volume, the RF coil
properties,
or other parameters of the system, rather than forcing the other parameters to
comply with
the magnet scale. As a result, it is feasible to miniaturize the entire
electromagnetic
system. This leads to improved detection sensitivity in smaller sample
volumes, reduced
cost and weight of the sensor portion of the system, and reduced RF power
required.
[0119] One embodiment of the magnet 512 is depicted schematically in cross
section in
Figure 7. The magnet includes a frame 710, such as a hollow steel frame. In
one
embodiment, the height H of the frame is less than 50 cm and may be less than
5 cm. The
width W can also be less than 50 cm and can be less than 5 cm. An upper
permanent disk
magnet 714 and a lower permanent disk magnet 716 located opposite the upper
permanent
magnet are attached to an upper section of the frame and a lower section of
the frame,
respectively. For example, they can be mechanically attached using screws or
bolts and/or
they can be attached with an adhesive. A disk shaped upper pole piece 718 is
located atop
the upper permanent magnet and opposite a disk shaped lower pole piece 720
located atop
the lower pole piece. Around the periphery of each pole piece are eight fine-
threaded
holes with adjustment bolts, which may be varied to improve the uniformity of
the field.
The magnet is assembled by bolting the frame together, sliding the permanent
magnet
CA 02604150 2007-10-09
WO 2007/086840 PCT/US2006/002368
-32-
disks into position, sliding the pole pieces into position, and then shimming.
The
permanent magnet disks are very strongly attracted to the steel frame, and the
pole pieces
are very strongly attracted to the permanent magnet disks. The attractions,
and resulting
friction among the various contacting members, provide mechanical stability to
hold the
assembly together. Further robustness may be obtained by applying clamps or
adhesives
to the magnet disks or pole pieces, preferably not interfering with field
shimming or
magnetic resonance measurements. Forces on permanent magnet components are
strong
and potentially dangerous. Not shown are jigs and tools used to control the
assembly
process in view of the strong forces involved.
[0120] Shimming is the process of adjusting a magnet, such as magnet 512, to
produce the
necessary uniformity. As built, most magnets provide insufficient uniformity
due to
manufacturing tolerances. Shimming consists of measuring the field
distribution,
adjusting built-in parameters of the magnet, and repeating until the desired
uniformity is
achieved. In one embodiment a simple shimming design is utilized which focuses
on the
most important field parameters, rather than providing an exhaustive set of
parameters of
which most are never needed.
[0121] First, the magnetization of the two permanent magnet disks is
equalized. Based on
the observed axial gradient, one or more thin ferromagnetic sheets are affixed
by magnetic
attraction circumferentially around only the stronger of the two magnets.
Iterative
adjustment of the number and thickness of the sheets results in near-perfect
negation of the
axial gradient. The sheets may then be secured by clamps or adhesives.
[0122] Then, one or more of the miniature bolts, for example bolt 722, in the
periphery of
the pole pieces are adjusted. These bolts press against the permanent magnet
disks to
slightly rock the pole pieces as needed to negate transverse field gradients.
Either or both
pole pieces may be adjusted, depending on the details of the observed field.
Final
adjustment of the various bolts results in near-perfect negation of transverse
gradients.
[0123] Typically the shape of the pole pieces need not be altered, although
they can be
demounted and their shape revised if needed to achieve the desired field.
Alternatively,
the spacing between the pole pieces may be reduced slightly by tightening all
of the bolts
around both pole pieces. Such an adjustment is almost equivalent,
magnetically, to
adjusting the depth of the pole piece relief step.
CA 02604150 2007-10-09
WO 2007/086840 PCT/US2006/002368
-33-
[0124] To fabricate the magnet parts, powdered metals such as iron or steel
can be placed
inside a mold of desired shape. Then in the press pressure and heat are
applied to generate
the final part. While only small parts can be made by this technique, mass
manufacturing
can be achieved. Alternatively machining can be used to make the individual
parts.
[0125] The pole pieces can be designed to provide the highest field uniformity
and field
volume for sample testing, with the constraint that the gap be sufficient for
inserting and
tuning the magnetic resonance sample coil. Design constraints include the
maximum field
in the pole pieces to limit saturation, minimum number of shimming parameters
to achieve
target field uniformity, and use of low-cost commercial permanent magnet
components
where possible.
[0126] The permanent magnet material provides very high magnetization density,
but is
temperature sensitive. In applications where the frequency may be adjusted to
the field,
thermal drift of the magnetic field is not a problem. For precision T2
measurements,
however, it is necessary to stabilize the magnetic field. A temperature-
controlled
enclosure can be used. In one embodiment, the enclosure can be built using
foam
insulation and a pair of patch heaters. A thermocouple sensor and controller
complete the
arrangement.
[0127] Precise determination of T2 using the CPMG procedure is enhanced with
an
extremely stable local oscillator with minimal phase noise on a time scale of
at least the
spin echo spacing. Even high-cost crystal oscillators usually do not provide
sufficient
stability due to the noisy computer power lines. Sufficient stability can be
obtained using
inexpensive integrated crystal oscillators by buffering both the DC power
input, and the
RF clock output. Such an arrangement is depicted schematically in Figure 8. In
one
embodiment the oscillator shown in Figure 8 is used in the pulse generator 518
of Figure
5. In general, the DC (direct current) power input is buffered by wiring two
or more
voltage regulators in series. The circuit depicted in Figure 8 includes a
first voltage
regulator 802 (for example an 8 volt regulator which receives a +12V input). A
second
voltage regulator 804 receives the output of the first voltage regulator and
provides its
output to the oscillator 806 (for example, a 5 volt regulator, receiving the
output of the 8
volt regulator). A third voltage regulator 808 (for example, a 5 volt
regulator) can also
receive the output of the first voltage regulator and can provide its output
to a digital logic
gate 810 with high speed and high source isolation, such as the 74F3037 line
driver
CA 02604150 2007-10-09
WO 2007/086840 PCT/US2006/002368
-34-
NAND (available from Philips Semiconductors and others). The digital logic
gate 810
buffers the output of the oscillator.
[0128] The magnetic resonance system 500 (Figure 5) interacts with the sample
using the
antenna 516 which, in operation, is electromagnetically coupled to the
precessing nuclei of
the sample. In one embodiment the coil is mounted in a modular,
interchangeable
platform to enable changing the sample size, replacing the coil in case of
contamination,
or other changes needed.
[0129] The antenna may be encapsulated in a contamination-resistant material.
Contamination is a serious issue when multiple samples bearing multiple
diseases or
toxins are to be tested. Prior antennas are difficult to clean because they
are highly
convoluted geometrically and include non-hygienic insulator and conductor
materials.
Encapsulation of the antenna can resolve this issue. For example, the antenna
could be a
copper coil embedded in a hollow cylindrical Teflon form so that any
contamination
coming from the sample container would encounter only a Teflon surface, never
the actual
conductor. Since Teflon is non-absorbing and relatively easy to clean up,
contamination
issues are greatly reduced. Also, the encapsulated antenna would be more
stable and
mechanically rugged than a freely mounted coil. Magnetic resonance signals
from an
element in the encapsulant, such as deuterium or fluorine, may be used to
control a
frequency or a magnetic field.
[0130] Cancellation of noise, interference signals, baseline offsets and other
background
effects can be improved by performing magnetic resonance measurements multiple
times
with various RF phases alternated. This can be implemented under the control
of the
controller. For example, the excitation may be alternated between positive and
negative
phase rotation of the spins during RF pulses. During signal processing by the
controller,
the phase of the receiver oscillator can also be rotated by 90 degrees or its
multiple.
Analysis software in the controller controlling these phase alternations also
performs the
corresponding addition or subtraction of the digitized data to accumulate the
desired signal
while canceling backgrounds.
[0131] Various user interfaces can be provided with the system. For example,
the system
500 depicted in Figure 5 can carry out measurements to detect a selected
analyte or
analytes and report the results by issuing an alarm if detected or provide a
visual indication
CA 02604150 2007-10-09
WO 2007/086840 PCT/US2006/002368
-35-
or report via the user interface 524. In one version, the operator inserts a
mixed sample
into the system and presses a single button on the user interface to initiate
a previously
prepared series of instructions for the controller to carry out and analyze
the sample. If
more than one analyte is to be searched for, the instructions automatically
direct the
mixing of nanoparticles sensitized to each analyte and carries out the
measurements
sequentially. In another version of the instrument, a mechanical or optical
switch senses
the insertion of the sample into the magnetic resonance system, and
automatically initiates
the measurement sequence.
[0132] In one embodiment, a T2 change is the primary indicator that analyte is
present.
To check for drifts or errors which could affect the T2 measurement, the
system can
compare the measured T2 of the sample, with that of a sealed calibration
sample having a
previously measured T2 value. The sealed sample may contain copper sulfate in
water,
mineral oil, or other liquid having a stable T2 for comparison. Alternatively,
the sealed
calibration sample can be periodically measured.
[0133] A wide diversity of mechanisms for presenting the sample into the
magnetic
resonance system can be used. The sample, comprising liquid medium, analyte,
and
nanoparticles, can be mixed in a container such as a glass NMR tube, a plastic
tube or vial,
a disposable container such as a plastic Eppendorf tube or flask, or other
suitable
container. An advantageous polymer is PEEK (polyetheretherketone) due to its
toughness,
intertness, and machinability. The container may be coated with a material to
prevent
nanoparticles from adhering to the walls, clumping, or precipitating out of
the mixture.
For example, the coating may be a protein such as BSA (bovine serum albumin).
The
container including the sample may be inserted, manually or by a mechanical
feeder, into
the magnetic resonance system. Alternatively, a fixed container in the
magnetic resonance
system may be used for multiple sample measurements by inserting sample
liquids into the
container, for example by pumping the sample or its ingredients through tubes
into the
container. After the measurements, the sample is then drawn from the fixed
container
using pumps, tubes, valves, and related fluid flow devices. A washing or
rinsing step can
be carried out between samples. Ultraviolet treatment of reservoirs holding
distilled water
and nanoparticles can be carried out to prevent bacteria formation.
Alternatively, a
fungicide such as sodium azide can be mixed in the distilled water in trace
quantities to
prevent growth of bacteria and algae in the water.
CA 02604150 2007-10-09
WO 2007/086840 PCT/US2006/002368
-36-
[01341 In one embodiment depicted schematically in Figure 9, multiple sensor
units are
connected to a single controller. For example, an automated, fixed-site system
may
consist of one central controller 902 with power supplies and a pulse
generator or
transmitter, connected by cables to multiple remote sensor heads 906 a and b.
Though
only two sensor heads are depicted, more can be used. Each head 906 includes a
sample
preparation apparatus along with selected nanoparticles, a magnetic resonance
magnet, a
preamplifier and a coil, for example as were described in connection with
Figure 5. RF
power pulses are routed to the sensor units through an output multiplexer 908
which is
controlled by the controller 902. Signals from the sensor units are routed to
the receiver
910 through the input multiplexer 912, also controlled by the controller.
Interconnects are
preferably by coaxial cable. Alternatively, each sensor unit may include an RF
amplifier.
When the RF amplifier is located at the sensor unit, the interconnects do not
carry high
power RF pulses and thus may be wireless, fiber optics, or other communication
means as
well as coaxial cable. The elements of the system depicted in Figure 9 operate
in the
manner described above.
[01351 In one embodiment, particulate matter suspended in air may be drawn
from free
air, HVAC ducts, interior spaces such as shopping malls, subway trains and
other mass
transit areas, or any other air system to test for diseases or terrorist
attack. (HVAC stands
for heating, ventilation, and air conditioning.) Collection preferably
includes drawing
particulate matter into the system or concentrating particles from the air
into the liquid
medium. Figure 10 shows a schematic of such a monitor system. The collector
1002 can
be situated within a duct or in any other area to be monitored, and can
include a shroud
(not shown) to exclude dirt and insects. The collector 1002 can include an
electrostatic
concentrator to attract analyte or sample material. A fluidics system 1004
transports the
analyte from the collector 1002 to the sample area of the magnetic resonance
analyzer or
system 1006. The magnetic resonance system 1006 can be the system described in
connection with Figure 5. The fluidics system 1004 can include an automated
microfluidic mixer to mix analyte with a liquid, such as the water medium and
with
nanoparticles configured for the one or more analytes to be detected. A
reservoir of the
nanoparticles and the water 1008 can also be part of the fluidics system. The
mixed
sample is then transferred by the fluidics system to the sample area of the
magnetic
resonance system where measurements are made. In one embodiment a fluidic
transport
system is in communication with the mixer and extends into the sample area.
Depending
CA 02604150 2007-10-09
WO 2007/086840 PCT/US2006/002368
-37-
on the measurement results, the sample may be dumped into a waste container,
stored as
archive material, or sent to secondary analysis systems. The waste water may
be recycled
to be used again by passing through a filter.
[0136] Figures 11 a-e depict an embodiment of a fixed installation system as
described in
connection with Figure 10 and three collector intakes. Figure 11 a is a
perspective view
and Figure 11 b is a plan view of the system showing the intake 1102 and a
display 1104.
The other elements depicted in Figure 10 are contained within the casing.
Figures 11 c-e
depict three inlet options for the system.. Once started the controller causes
the system to
collect samples periodically for analysis. The system can also be operated
manually. A
user interface may be provided through buttons or a touch screen. The display
1104 can
show the status of operation. User access can be controlled through, for
example,
biometric identification, such as fingerprint identification, or a password.
[0137] Figure 12 is a front perspective view of a hand portable system. The
system can
operate in a single button autonomous operation mode. A sample can be
introduced via
vials and tubes. A sample in a container 1202 can be introduced into the
system through a
receptacle or opening 1204 at the top. Inside the system the fluidics system
will handle
the sample mixing and moving into the NMR system in the manner described above
in
connection with Figure 10. The user interface 1206 can include "biohazard" and
"safe"
lighted areas on a display screen. To start operation, a start button is
provided on the
touch screen. The status of system operation is indicated on the screen.
[01381 One embodiment of a system which can carry out or implement the
measurement
or detection techniques described above for medical diagnostic purposes will
now be
described with reference to Figure 13 which is a functional block diagram of
an automated
sample testing system. For clinical applications, the sample comprises a
specimen of
material from a patient. The material may include living or dead cellular
material such as
skin, blood, prions, marrow, hair, biopsy samples, or other tissue; or non-
cellular
biological material such as saliva, mucous, sputum, intravenous fluid, urine,
feces, pus,
spinal fluid, and contents of the stomach or intestines; or any other sample
material
obtained from a human or animal body. Collecting that material comprises a
patient or
subject producing the material, a clinician extracting the material from the
body of a
patient or subject, an investigator retrieving sample material from a crime
scene or
accident, or any other steps resulting in the accumulation of biological
material for testing.
CA 02604150 2007-10-09
WO 2007/086840 PCT/US2006/002368
-38-
[0139] First, the fluidic system 1302 draws a patient's specimen 1304, or a
portion thereof,
or a solution thereof, into a mixer which mixes the sample material with a
solvent, for
example stored in a solvent reservoir 1306, and one or more types of
nanoparticles stored
in reservoirs 1308a-c. Each type of nanoparticle can be sensitized for one or
more
chemicals or analytes related to diseases or medical conditions. Figure 13
shows three
nanoparticle types, but any number of nanoparticle types, each sensitized to
one or more
analytes related to one or more medical conditions can be used. Diseases
include
communicable pathogens such as viruses and bacteria, and non-communicable
diseases
such as cancer or hypercholestreinia. Chemicals include enzymes or other
markers
produced by the body, toxins, and drugs. In one embodiment, the user selects
the types of
nanoparticles to be used in testing a particular patient's specimen. For
example, a
physician may extract a sample of a patient's blood to check the concentration
of a
medication so as to control dosage, or guards at an airport or border crossing
may take
tissue samples of live or dead chickens to check for avian flu. Additional
processing steps
may include lysing the sample to release DNA or RNA or other components of the
sample, heating or cooling the sample, adjusting the pH of the sample, or
other steps
needed to promote selective reaction between the nanoparticles and the
analyte. The
mixed sample, or an aliquot thereof, is then transferred into the magnetic
resonance system
1310, such as the system depicted in Figure 5. The sample may alternatively be
mixed
with nanoparticles within a container which is within the magnetic resonance
instrument,
thereby avoiding the step of transferring the mixed sample, and additional
processing steps
may be taken while the sample is within the magnetic resonance instrument.
[0140] The magnetic resonance instrument then measures signals from the
sample, such as
the T2 of the sample, and analyzes those signals to determine the presence or
absence or
concentration of the selected analytes. Then, based on the measurement
results, a
physician may then diagnose the patient's disease.
[0141] In one embodiment of the systems described above, the system detects
analyte by
measuring signals from the liquid, the signals being related to the magnetic
field.
Specifically, the signals are sensitive to the distinct magnetic field in the
special region
around the nanoparticles. When analyte binds to the corresponding antibody or
other
binding agent, the analyte is caused to remain in the special region, and thus
in the distinct
magnetic field. The analyte displaces the liquid from that region, so the
liquid no longer
emits magnetic resonance signals characteristic of the magnetic field in that
region. Also,
CA 02604150 2007-10-09
WO 2007/086840 PCT/US2006/002368
-39-
it is important to note that the analyte does not emit magnetic resonance
signals, or at least
does not emit signals which are similar to those of the liquid. This is
because the analyte
is held tightly to the solid nanoparticle, causing the analyte to exhibit the
short T2
characteristic of solids. Thus, in one embodiment, the analyte, while
occupying the
special region, does not produce signals that mimic the liquid.
[0142] Agglomeration can cause a change in T2 but not Ti, whereas both Ti and
T2
change in response to increased concentration of nanoparticles. Therefore, a
measurement
of T1 can be used as a calibration or an independent measure of nanoparticle
concentration. In one embodiment, the system measures both the Ti and T2 of
the
sample, applies analysis relating the Ti value to determine the nanoparticle
concentration,
and the T2 value to detect analyte. Alternatively, other methods are available
to measure
the iron content, and hence nanoparticle concentration, in the sample.
[0143] The data processing step performed by the controller includes fitting
the data for
parameters related to the presence of analyte, such as a T2 change in CPMG
data.
Normally the echo train in CPMG is fit to a single exponential formula, a
three-parameter
fit for amplitude, time constant, and background. A simple but efficient way
to ,
accomplish this is a grid search in which all three parameters are first
estimated from the
data, and then a three-dimensional grid of values is generated by varying all
three
parameters above and below the estimated values. Then the best values are
selected as the
minimum chi-square, or mean squared deviation of the data from the formula.
Starting
from the best value, a new search grid is again calculated, the deviations
calculated, and
the best values again derived. This process is repeated a number of times
(typically 9) to
obtain the best global fit. Optionally, the scale of the grid maybe reduced by
a factor
(typically 0.95) each time it is used, so that the same values are not
appearing repeatedly.
[0144] The primary subsystems of the magnetic resonance system are the pulse
generator,
the signal receiver, and the controller. These subsystems may reside on
separate boards,
interconnected by cables. Alternatively, the subsystems may be integrated as a
single
circuit on a single computer board. The advantage of the latter is that cable
interconnects
are not needed, and also that a single time base may be used for all.
[0145] The system can be battery powered. The system uses very little power
during data
acquisition, and can be programmed to use essentially zero power in a sleep
mode.
CA 02604150 2007-10-09
WO 2007/086840 PCT/US2006/002368
-40-
[0146] In one embodiment the system also includes a radiation detector
interfaced to the
controller. The purpose of the radiation detector is to detect radioactive
materials in the
sample. The radiation detector may be any radiation sensor, preferably
sensitive to
gamma rays, such as semiconductor, scintillator, and gas-filled counters. The
detector
may be positioned proximate to the sample collection means, the sample mixing
system,
or a holding chamber placed downstream of the magnetic resonance system.
[0147] Insects such as spiders may obscure the air inlets and collectors.
First barrier to
entry for these bugs are filters. For outside installations, a slow release
insecticide,
preferably harmless to humans and pets, can be incorporated. Such insecticides
can be
implemented along the shaft of the inlet or near the mouth of the inlet.
[01481 In one embodiment the systems and methods detect explosives and
chemical
weapon materials. The systems and methods can perform the detection using
nanoparticles as disclosed above, wherein specific binding sites on the
nanoparticles bind
to the explosive or chemical weapon molecules. Alternatively, the systems and
methods
can detect explosives or chemical weapon materials by measuring magnetic
resonance
signals from the sample material itself, without use of nanoparticles. The
system may
employ the Spin Nuclear Overhauser Effect to detect chemical weapons and
explosives.
No nanoswitches are required in this case. Another configuration could be a
hybrid
system incorporating gas chromatography, mass spectroscopy, ion mobility
spectroscopy,
other analytical techniques, and NMR with or without nanoparticles
[01491 An advantage of the inventive systems and methods is that confirmation
tests may
be carried out for certain analytes using the same apparatus. For example, a
confirming
test for explosives comprises measuring the Ti parameter using a magnetic
resonance
system, since the Ti for most explosives is extremely long (many seconds). As
another
example, a confirming measurement for chemical weapons such as nerve agents is
a
magnetic resonance scan for fluorine or phosphorus based on the characteristic
Larmor
frequencies of those elements.
[01501 In one embodiment the system detects toxins and biological weapons in
mail
envelopes, by testing particulate matter collected from mail. In this
application, the
system would preferably include means for extracting particulate matter from
envelopes,
such as shaking, vibrating, blowing air through the mail piece or compressing
the
CA 02604150 2007-10-09
WO 2007/086840 PCT/US2006/002368
-41-
envelopes. The system may include means for cutting envelopes to retrieve
powder,
preferably only after other sensors had directed suspicion at a particular
mail piece.
[0151] A preferred embodiment for applications sampling air includes an air
inlet, a
collector, concentrator and an automated fluidic system. The air inlet
includes a filter to
exclude dirt and insects, and a cyclone to separate sample particles from air.
Inlets may
use "impactor" or "pre-separator", or "fractionator" and serves the role of
preventing large
(e.g., particles with sizes greater than about 10 micrometers aerodynamic
diameter) from
entering the detector or identifier. The large-particle fractionator is an
integral component
in the ambient sampler -it is the combination of the internal nozzle and the
plate that is
normal to the nozzle. For the HVAC unit or the occupied environment sampler,
there
could be an optional pre-separator cartridge that is placed downstream of the
inlet. In
addition, for the ambient sampler, there could be a bug screen that is placed
just upstream
of the exhaust port. The collector includes concentrator means including a
virtual
impactor to insert the sample particles into a liquid medium. The fluidic
system then
mixes the sample with nanoparticles.
[0152] In one embodiment the systems and methods are adapted to inspect
shipping
containers, for example to detect hazardous materials or drugs or microbes
among items in
a shipping container. The embodiment includes means for drawing air from the
interior
space of the shipping container, means for collecting or concentrating any
material
suspended or entrained in that air, means for mixing the material with
nanoparticles, and
means for presenting that mixture to the magnetic resonance system for
testing. The
inspection may be carried out by opening a door of the shipping container.
Alternatively,
the interior air may be drawn through a port or reclosable opening on the
shipping
container. Further details are provided in Provisional Application serial
number
60/669,019, filed 4/7/2005, titled SHIPPING CONTAINER INSPECTION DEVICE.
[0153] Those of skill will further appreciate that the various illustrative
logical blocks,
modules, circuits, and algorithm steps described in connection with the
embodiments
disclosed herein can often be implemented as electronic hardware, computer
software, or
combinations of both. To clearly illustrate this interchangeability of
hardware and
software, various illustrative components, blocks, modules, circuits, and
steps have been
described above generally in terms of their functionality. Whether such
functionality is
implemented as hardware or software depends upon the particular application
and design
CA 02604150 2007-10-09
WO 2007/086840 PCT/US2006/002368
-42-
constraints imposed on the overall system. Skilled persons can implement the
described
functionality in varying ways for each particular application, but such
implementation
decisions should not be interpreted as causing a departure from the scope of
the invention.
In addition, the grouping of functions within a module, block, circuit or step
is for ease of
description. Specific functions or steps can be moved from one module, block
or circuit
without departing from the invention.
[0154] The various illustrative logical blocks, modules, and circuits
described in
connection with the embodiments disclosed herein can be implemented or
performed with
a general purpose processor, a digital signal processor (DSP), an application
specific
integrated circuit (ASIC), a field programmable gate array (FPGA) or other
programmable
logic device, discrete gate or transistor logic, discrete hardware components,
or any
combination thereof designed to perform the functions described herein. A
general-
purpose processor can be a microprocessor, but in the alternative, the
processor can be any
processor, controller, microcontroller, or state machine. A processor can also
be
implemented as a combination of computing devices, for example, a combination
of a
DSP and a microprocessor, a plurality of microprocessors, one or more
microprocessors in
conjunction with a DSP core, or any other such configuration.
[0155] The steps of a method or algorithm described in connection with the
embodiments
disclosed herein can be embodied directly in hardware, in a software module
executed by
a processor, or in a combination of the two. A software module can reside in
RAM
memory, flash memory, ROM memory, EPROM memory, EEPROM memory, registers,
hard disk, a removable disk, a CD-ROM, or any other form of storage medium. An
exemplary storage medium can be coupled to the processor such the processor
can read
information from, and write information to, the storage medium. In the
alternative, the
storage medium can be integral to the processor. The processor and the storage
medium
can reside in an ASIC.
[0156] The above description of the disclosed embodiments is provided to
enable any
person skilled in the art to make or use the invention. Various modifications
to these
embodiments will be readily apparent to those skilled in the art, and the
generic principles
defined herein can be applied to other embodiments without departing from the
spirit or
scope of the invention. Thus, the invention is not intended to be limited to
the
CA 02604150 2007-10-09
WO 2007/086840 PCT/US2006/002368
-43-
embodiments shown herein but is to be accorded the widest scope consistent
with the
principles and novel features disclosed herein.