Note: Descriptions are shown in the official language in which they were submitted.
CA 02611205 2013-09-06
71495-73
- 1 -
CONTINUOUS, CONTINENTAL-SHELF-SCALE
MONITORING OF FISH POPULATIONS AND BEHAVIOR
RELATED APPLICATION
[0001] This application claims the benefits of and priority to U.S.
Provisional Application
Serial No. 60/688,619 (filed on June 8, 2005).
BACKGROUND
[0002] Fish stocks are =declining worldwide, yet conventional approaches to
studying fish
abundance and behavior rely heavily on imprecise local sonar and capture-
trawling
measurements.
[0003] In particular, fish in continental-shelf environments have been
monitored by
line-transect techniques from slow moving research vessels; these techniques
significantly
= under-sample fish populations in time and space, leaving an incomplete
abundance and
behavioral picture. Conventional fish-finding sonar (CFFS) operates in the 10-
500 kHz range
and measures the local depth distribution of fish by echo sounding within a
narrow, downward-
directed beam along the line transect of a slowly moving research vessel.
Typically systems
survey habitats at rates in the vicinity of 0.2 km2/hour, which is similar to
the survey rates of
capture-trawl vessels. Survey rates can increase by roughly an order of
magnitude with
conventional side-scan sonar, which exploits only local, linear, waterborne
propagation paths. In
= contrast, isolated fish schools are often widely separated in space and
difficult to detect by
conventional methods. Sinai] schools spanning hundreds of meters in diameter
are known to
undergo rapid variation in size and shape. Larger schools often extend over
tens to hundreds of
square kilometers and can also undergo drastic morphological changes,
including fragmentation
and clustering, in periods less than one hour.
CA 02611205 2013-09-06
71495-73
- 2 -
[0004] Consequently, measurement of the size, spatial distribution, and
temporal evolution of
fish schools is generally not practical with conventional methods. The fish
are too widely
dispersed and, during the course of a measurement using CFFS, their spatial
concentrations
and distributions change dramatically.
SUMMARY OF THE INVENTION
[0005] Embodiments of the present invention may permit the areal population
density and
detailed behavior of fish schools and their interaction to be continuously
monitored at short
(e.g., roughly one-minute) intervals over continental-shelf-scale areas
spanning thousands of
square kilometers by ocean acoustic-waveguide remote sensing. This is possible
because of
the capacity of certain geophysical environments, such as continental shelves,
islands, etc. to
behave as acoustic waveguides where sound propagates over long ranges via
trapped modes
that suffer only cylindrical spreading loss, rather than the spherical loss
suffered in CFFS
transmission. Embodiments of the invention could also be used in deep water
away from
continental shelves by relying on variations in the water-column sound speed
to generate a
waveguide.
[0006] To form an instantaneous image in accordance with an embodiment the
invention,
waveguide modes may be excited uniformly in azimuth by a vertical source array
employing a
pulsed, preferably short broadband transmission. Scattered returns from
environmental
features are then continuously received by a horizontal line array and charted
in horizontal
range and bearing (e.g., by temporal matched filtering and beamfonning). The
resulting
image is an instantaneous snapshot of the ocean environment over the two-way
travel times of
the signal returns. Embodiments of the invention could be useful in localizing
and
characterizing fish with and without swim bladders, and may be applied to
detect, image and
localize other marine creatures such as krill.
[0007] Accordingly, in a first aspect, the invention features a method of
characterizing a
population of fish. The method comprises generating, within an aquatic
environment,
horizontally directed acoustic signals via trapped modes whereby the signals
eventually
undergo cylindrical spreading loss. In embodiment, the acoustic signals have
frequencies
CA 02611205 2013-09-06
=
71495-73
- 2a -
that cause a fish to scatter the acoustic signals substantially
omnidirectionally. The method
also involves receiving return acoustic signals stimulated or excited by the
generated acoustic
signals, which may have a scatter function factorable therefrom; and
interpreting the return
acoustic signals so as to detect and characterize the fish population. In some
embodiments,
= the acoustic signals are pulsed. Preferably, the generated acoustic signals
are azimuthally
uniform and propagate within bounding geophysical features that act as a
waveguide, such as
the seafloor and ocean-
CA 02611205 2007-12-04
WO 2006/133304
PCT/US2006/022143
-3 -
atmosphere surface. The waveguide may also arise from variations in the
watercolumn sound
speed.
[0008] The interpreting step preferably comprises temporal matched filtering
and
beamforming; this approach charts return acoustic signal intensities to the
horizontal spatial
location of the scattering feature that returned them, thereby forming an
image of return acoustic
intensities. The step may also include compensating for two-way waveguide
transmission loss,
resolution footprint, fish target strength, and source power. In some
embodiments, the
interpreting step comprises establishing a fish target strength and, based
thereon, identifying
return signals indicative of fish populations. This may involve establishing
target strengths of
different species of fish and distinguishing among different fish populations
based on the
established target strengths, and establishing areal population density of the
fish groups. In some
embodiments, the interpreting step may also involve log-transformation of the
return acoustic-
signal intensities to convert return-signal-dependent speckle noise into
return-signal-independent
additive noise, thereby optimizing pattern recognition of fish target strength
or population
distributions.
[0009] The characterization typically (although not necessarily) occurs over a
region having an
area in excess of 25 km2. The generated acoustic signals desirably propagate,
and the return
acoustic signals span, 360 degrees in azimuth. They may be generated from a
vertically oriented
array of acoustic sources disposed within the aquatic environment. A
horizontal aperture in the
source array may be used to direct the generated acoustic signals to certain
preferred azimuths in
some embodiments.
[0010] Steps may be taken to optimize the wavelength of the acoustic signals.
For example, the
optimized wavelength may be large enough that the return acoustic signals are
expressible as the
product of (i) a factor representing transmission to a fish, (ii) a factor
representing scattering
from the fish, and (iii) a factor representing transmission from the fish. The
optimized
wavelength may be such that a far-field range of the acoustic signals is
shorter than a mean
spacing between fish to be characterized. In some embodiments, the optimized
wavelength is
such that a shadow length from fish to be characterized is smaller than the
mean distance
between the fish. The optimized wavelength may be chosen so that return
acoustic signals are
independent of the aspect of any individual fish. The optimized wavelength may
be chosen so
that the total acoustic attenuation caused by waveguide scattering (many
incident angles in and
CA 02611205 2013-09-06
71495-73
- 4 -
out) from fish or fish groups is less than 1 dB. (CFFS systems typically
operate at much
higher frequency and can have significant attenuation in propagating through
even small
schools of fish, leading to significant errors in population estimation.) The
optimized
wavelength and acoustic signal power level may be chosen such that return
acoustic signals
from fish exceed an ambient noise level at a maximum detection range by at
least 5 dB. The
maximum detection range may exceed tens of kilometers or more. The optimized
acoustic
wavelength may be chosen such that scattering from fish groups or other marine
creatures
exceeds seafloor scattering at the maximum detection range.
100111 Measures may be taken to optimize the waveguide modes stimulated by the
source
array to maximize return acoustic signals from fish and to minimize return
acoustic signals
from the seafloor.
[0012] In some embodiments, successive images of returned acoustic signal
intensity, fish
target strength or areal population density, may, if desired, be concatenated
into a movie.
[0013] Embodiments of the invention may characterize a total area occupied by
a detected
fish group, and identify a center of population of the fish group. This, in
turn, may be used to
detect a velocity of the fish group by time differencing the identified center
of population.
The velocity vectors of an entire field of fish may also be determined by time
and space
differencing following conservation of mass, and the environmental pressures
on the fish
causing them to move may also then be quantified following conservation of
momentum.
Alternatively, the velocity of a fish group may be estimated based on a
Doppler frequency
shift of the return acoustic signals.
[0014] In another aspect, the invention features an apparatus for
characterizing a population
offish. The apparatus comprises a transmission device for generating, within
an aquatic
environment, horizontally directed acoustic signals via trapped modes whereby
the signals
undergo cylindrical spreading loss. The acoustic signals may have frequencies
that cause a
fish to scatter the acoustic singals substantially omnidirectionally. The
apparatus also
includes a receiver for receiving return acoustic signals stimulated by the
generated acoustic
signals, which may have a scatter function factorable therefrom; and an
analysis module for
CA 02611205 2013-09-06
71495-73
- 4a -
interpreting the return acoustic signals so as to detect and characterize the
fish population.
This may be accomplished in real time or by subsequent analysis.
[00151 The transmission device desirably generates azimuthally uniform
acoustic signals,
which ideally propagate 360 degrees in azimuth, and which may be pulsed. In
some
embodiments, the analysis module interprets the return acoustic signals by
temporal matched
CA 02611205 2007-12-04
WO 2006/133304
PCT/US2006/022143
- 5 -
filtering and beamforming. The transmission device may, for example, comprise
a vertically
oriented array of acoustic sources. The array of sources may transmit a
spatially filtered
signal to optimize return acoustic signals from fish or marine creatures and
minimize return
acoustic signals from the seafloor. Desirably, the generated signals have a
wavelength and power
level jointly optimized such that return acoustic signals from fish exceed an
ambient noise level
at a maximum detection range by at least 5 dB.
[0016] The analysis module may be configured to compensate for two-way
waveguide
transmission loss, resolution footprint, fish target strength, signal-
dependent noise and source
power. In some embodiments, the analysis module is configured to establish a
fish target
strength and, based thereon, to identify return signals indicative of fish
populations. In this
regard, the analysis module may be further configured to establish target
strengths of different
species of fish and to distinguish among different fish populations based on
the established target
strengths, and to establish areal population density of the fish groups. In
some embodiments, the
analysis module is configured to optimize a wavelength of the acoustic signals
as described
above.
[0017] The analysis module may be configured to characterize the total
population of fish in a
given area and the variations of this population with time. The analysis
module may be
configured to characterize a total area occupied by a detected fish group and,
if desired, a center
of population of the fish group. The analysis module may be further configured
to detect a
velocity of the fish group by time differencing the identified center of
population. The analysis
module may be still further configured to determine velocity vectors of an
entire field of fish by
time and space differencing following conservation of mass, as well as the
environmental
pressures on the fish causing them to move using conservation of momentum.
Alternatively, the
analysis module may estimate a velocity of a fish group based on a Doppler
frequency shift of
the return acoustic signals.
[0018] The apparatus may also include image-processing module for generating
images of a
fish population based on the return acoustic signals. The image processing
module may be
configured to establish the spatial spectrum of fish population. The image-
processing module
may, if desired, be configured to concatenate successive images into a movie.
The image
processing module may, if desired, be configured to estimate time series of
fish population, fish
CA 02611205 2007-12-04
WO 2006/133304
PCT/US2006/022143
- 6 -
group area, fish major and minor axes within a given region, as well as the
spectrum and
correlation lengths of these time series.
BRIEF DESCRIPTION OF THE DRAWINGS
[0019] The foregoing discussion will be understood more readily from the
following detailed
description of the invention when taken in conjunction with the accompanying
drawings, in
which:
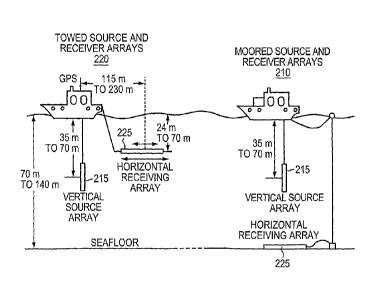
[0020] FIG. 1 schematically illustrates the imaging field of a system in
accordance with the
present invention, as contrasted with a CFFS track.
[0021] FIG. 2 schematically illustrates a deployment of the present invention.
[0022] FIG. 3 schematically illustrates a data-processing system in accordance
with the present
invention.
DETAILED DESCRIPTION
Basic approach
[0023] In an exemplary implementation, the location of the source and receiver
are known, and
the time of source transmission is known. Scattered returns from environmental
features such as
fish are then continuously received by a horizontal line array and charted in
horizontal range and
bearing, preferably by temporal matched filtering and beamforming using the
known
propagation speeds of acoustic modes in the ocean (e.g., as determined from
local sound speed
measurements). The resulting image is an instantaneous snapshot of the ocean
environment over
the two-way travel times of the signal returns spanning 360 degrees in
azimuth. Each pixel in
such a raw image has units of sound pressure level in decibels relative to a
reference pressure.
The range resolution is fixed at the mean sound speed, c --- 1475 m/s, divided
by twice the signal
bandwidth. Azimuthal resolution in radians varies as the acoustic wavelength A
divided by the
projected array length Leos 0, where L is the full array length and the
azimuth angle 0 is zero at
broadside, which is normal to the array axis. At endfire, parallel to the
array axis, the resolution
A[22.
becomes roughly ¨L radians. FIG. 1 gives a horizontal view of the resolution
and contrasts
this with a CFFS line transect. As shown in FIG. 1, the array does not have
left-right ambiguity
about its axis because the array has some aperture normal to its long axis to
give two-
CA 02611205 2007-12-04
WO 2006/133304
PCT/US2006/022143
- 7 -
dimensionality to the aperture and thereby eliminate this ambiguity, e.g., as
in a cardiod array or
towing of multiple-line arrays. For a single-line array, with no aperture
normal to the array's
axis, ambiguity may be resolved both by changing the receiver array position
and orientation.
The endfire beam in the direction of tow is sometimes not useful for
environmental imaging
since it is sometimes contaminated with noise from the tow-ship.
[0024] A variety of source waveforms can be used, including linear frequency
modulated (lfm),
hyperbolic frequency modulated (hfm), and sinusoidal or constant wave (cw)
sequences of
pulses. The frequency-modulated waveforms, such as lfms and hfms, are
advantageous because
they enable pulse compression or matched-filter techniques to be used that
improve range
resolution, single-to-noise ratio, and signal-to-background reverberation
ratio.
[0025] The transmission repeat rate puts a limit on the range coverage. A 50-
second repeat rate
corresponds to roughly 30-km radius coverage for each instantaneous image,
while a 100-sec.ond
repeat rate corresponds to roughly 60-km radius coverage, leaving some non-
record time
between the previous reception and the next transmission to obtain optimal
acquisition. Both 50-
and 100-second repeat rates have been used to advantage.
Equipment
[0026] A typical implementation is shown in FIG. 2. A moored, towed or
drifting source array
210 utilizes one or more vertical linear arrays 215 each of which contains one
or more
underwater acoustic sources, sending sound out over 360 degrees in horizontal
azimuth.
Waveguide modes are excited by vertical source array 215, which is suspended,
for example, 35-
70 m below the tow vessel. The source array employs a spatial window to
stimulate modes that
will maximize returns from fish and minimize returns from the seafloor. A
moored, towed or
drifting receiver array 220 includes one or more horizontal linear receiving
arrays 225 of
hydrophones (each array preferably containing multiple hydrophones to enable
the direction of
underwater acoustic waves to be determined). In the example shown in FIG. 2,
this is suspended,
for example, 24-55 m below and 115-230 m behind another research vessel.
Scattered returns
are received by horizontal receiving array 225. In general, the sources and
receivers may be
towed from moving research vessels or they may be moored to the seafloor.
Typical seafloor
depths range from 70 m to 140 m in this example.
CA 02611205 2007-12-04
WO 2006/133304
PCT/US2006/022143
- 8 -
[0027] Deployable arrays of acoustic sources or receivers can take any
suitable form as well
known in the art. A typical array includes a buoyancy package, a connecting
line or cable, a
cable release, a depth sensor, and a pressure case that houses the sources or
receivers, as well as
associated control electronics. The buoyancy package may, for example,
comprise a buoy or
float that serves to support the array in an upright vertical or horizontal
orientation. Multiple
depth sensors are typically employed, but if a single one is used it is
generally positioned close to
the array and, in the case of the receiver array, is also electrically
connected to the control system
so that depth information is conveyed for analysis along with acoustic
signals.
[0028] With reference to FIG. 3, a system 300 for processing signals from
receiver array 225 in
accordance with the invention is conceptually organizes as a series of
functional modules
including a signal conditioning and filtering module 310, which, in accord
with conventional
practice, reduces noise and improves underwater acoustic data; a data-analysis
module 320,
which analyzes conditioned, digitized signals to form images in range by
temporal matched
filtering and in azimuth by planewave beamforming; and, if desired, an image-
processing
module 330 to assemble or further process the images output by data-analysis
module 320. The
images may be displayed on a computer display 340. The present invention uses
sound less
intense than CFFS, typically by more than three orders of magnitude. The
obtainable range
resolution is Ar = ¨2B where c is the mean ocean sound speed during an
experiment, and B is the
bandwidth of transmitted signals.
[0029] Modules 320, 330 can be implemented in whole or in part as a software
program using
any suitable programming language or languages (C++, C#, java, FORTRAN, LISP,
BASIC,
PERL, etc.) and/or as a hardware device (e.g., ASIC, FPGA, processor, memory,
storage and the
like). The functions performed by modules 320, 330 are described in greater
detail below.
Mode filtering with the source array
[0030] The vertical source array can be designed to filter the modes
stimulated and propagated
into the waveguide. This is done by shading the amplitude and phase of each
individual element
of the source array during signal transmission. Typically it is preferable to
stimulate lower-order
modes of the water column with the source array, since these have wavenumber
vectors with
more horizontal orientation and so interact less, or are incident with
shallower angles on the
seafloor and seasurface, thereby minimizing returns from seafloor and
seasurface
CA 02611205 2007-12-04
WO 2006/133304
PCT/US2006/022143
- 9 -
inhomogeneities and features. These lower modes still fill the water column
and yield strong
returns from fish populations.
[0031] Lower-order modes may also be stimulated by advantageous placement of
the source
array in an environment with known bathymetry. Placement of the source array
in shallower
bathymetry can sometimes be advantageous since fewer modes are excited, and
these are at the
lower end. As a result, when these modes travel into deeper water, incident
angles on the
seafloor and seasurface will be shallower than if the source had been placed
in deeper water, so
returns from the seafloor and seasurface will again be minimized.
Deriving target strength of a unit area and population density
[0032] The typical output of data-analysis module 320 is typically one or more
images of the
target strength of a unit area of the ocean environment, including fish
schools and other aquatic
life. These are determined by compensating the received sound pressure-levels
for (i) two-way
transmission loss in the range-dependent continental-shelf waveguide (using,
for example,
parabolic equation modeling as described, for example, in Malcris et al.,
Science 311:660-663
(2006) including the supporting online material)); (ii) the spatially varying
resolution footprint of
the OARS source-receiver system; (iii) fish target strength; and (iv) source
power.
Ocean acoustic waveguide scattering model for a general target
[0033] For illustrative purposes, we describe a normal mode formulation for
the scattered field
from a general target in a stratified ocean waveguide. Let the origin of the
coordinate system be
placed at the air-water interface with the positive z-axis pointing downward.
Let the coordinates
of the source be defined by re = (xo, yo, z0), the receiver coordinates by r =
(x, y, z), and the
coordinates of the centroid of a target by r, = (xõ y1, z1) . Spatial
cylindrical (p,0,z) and
spherical systems (r, 0, 0) are defined by x r sin û cos 0, y = r sin 0 sin 0,
z = r cos 0 and
p2 = x2 + y2 The acoustic wavenumber k is given by the angular frequency co =
27zf divided
by the sound speed c.
[0034] The time-harmonic scattered field measured by a receiver at r for a
source at ro from an
arbitrary target in a stratified ocean waveguide with target center at r, is
given by
CA 02611205 2007-12-04
WO 2006/133304
PCT/US2006/022143
- 10 -=
(4702
(r )ro, rõ f ) E E _______ [Am (r ¨ rt)flo(r, ¨ ro)Sr, (7r¨ aõ,, p( , 4), an,
got, 0.))
m., fl=1k
¨ (r ¨ rt)4 (rt ¨ ro)S(am , P(95, ),
P(0/ 00))
¨ (r ¨ rt)Bõ (rt ¨ ro)Sri (r ¨ aõ,, p(0, 0,),7r - an, POI, AO)
+ (r ¨ rt)Bõ (r, ¨ ro (a m , fl (0, 0,), ¨ a, AO/ q50))]
(Eq. 1)
[00351 where Aõ(r, ¨ro) and Bn(r, ¨ ro) are the amplitudes of the down- and
upgoing modal
plane wave components incident on the inhomogeneity at rõ A,11 (r ¨ rt) and Bm
(r ¨rt)
[00361 are the amplitudes of the up- and downgoing modal components scattered
from the
inhomogeneity, 8r,(7r¨ am, P(0,0,),an, )6(0õ0)) is the scatter function of the
object centered at
, )6(0,0). 0¨ sin-' t sin( 0t ¨ 0) is the azimuth of the receiver
from the target,
P ¨Pt
13(0õ00) is the azimuth of the target from the source, aõ are the modal
elevation angles, and
Mma, is the mode number at which the modal summations can be truncated and
still accurately
represent the field, as in P. Ratilal and N. C. Makris, J. Acoust. Soc. Am.
118:3532-3559 (2005).
An equivalent formulation in terms of wavenumber integrals is found in N. C.
Makris, F.
Ingenito, and W. A. Kuperman, "Detection of a submerged object insonified by
surface noise in
an ocean waveguide," J. Acoust. Soc. Am. 96:1703-1724 (1994). The target
strength of an
object is TS =10logloIS I kr in dB re 1 m for k measured in 1/m.
[0037] For any given object in an ocean waveguide, the object scatter function
couples the
incident and scattered waveguide modes, so that propagation and scattering are
coherently
convolved as seen in Eq. 1. This coupling between propagation and scattering
can be especially
significant for highly directional objects, such as those large compared to
the acoustic
wavelength, since these will couple incident and scattered modes differently
depending on their
equivalent planewave directions at the object. For such highly directional
objects, this coupling
makes it challenging to accurately estimate the scattering function or target
strength from
CA 02611205 2007-12-04
WO 2006/133304
PCT/US2006/022143
- 11 -
measured return acoustic signals in an ocean waveguide, as noted in P.
Ratilal, Y. Lai, and N. C.
Makris, J. Acoust. Soc. Am. 112:1797-1816 (2002). This is a problem for CFFS
operating
frequencies which range above roughly 10 kHz, where individual fish tend to
become highly
directional scatterers. At these frequencies, there is also significant
shadowing from one fish to
the next and significant multiple scattering in dense fish schools. This also
makes estimation of
fish population densities challenging at CFFS frequencies, since the effects
of shadowing and
multiple scattering also need to be factored into the analysis of return
acoustic signals to estimate
fish target strength and population.
[0038] At the lower acoustic frequencies below 10 kHz, most fish become
acoustically
compact, small compared to the acoustic wavelength. The scatter function of
these fish become
omnidirectional for both the swimbladder as well as the body of the fish. The
scatter function in
Eq. 1 can then be expressed as a constant, independent of the direction of the
incident and
scattered modal plane waves so that Cir ¨m ,8(0, Of), a, ( o)) so (r, f)
can be
factored from the summations. As shown in P. Ratilal, Y. Lai, and N. C.
Makris, i Acoust. Soc.
Am. 112:1797-1816 (2002), the scattered field simplifies to,
(r I ro,r,,f) = (4702 G(r, I ro,f)G(r(rt, f)S0(rõ f) (Eq. 2)
[0039] where waveguide propagation determined by the Green's function G to and
from the
scatterer become factorable and hence separable from the scatter function
which depends on the
target properties.
Expected scattered intensity from fish within the resolution footprint
[0040] Let q(t) be the source signal with Fourier transform or spectrum Q+0.
Then given a
distribution of N fish within the sonar resolution footprint at centered at
horizontal location r,,
where each fish is numbered by i, the frequency spectrum of the scattered
field from the N fish
can be expressed as a sum of those from each fish,
CA 02611205 2007-12-04
WO 2006/133304
PCT/US2006/022143
- 12 -
N
[0041] An ocean waveguide is temporally and spatially random due to the
presence of water
column internal wave fluctuations and other inhomogeneities and variations in
the medium and
waveguide boundaries. The random waveguide leads to temporal and spatial
fluctuations in the
multi-modal acoustic field propagation and hence randomness in the measured
acoustic intensity.
The fish contained in the resolution footprint of the present invention will
also be randomly
distributed in size, shape, spatial density, and other physical properties, as
well as their location
within the sonar resolution footprint. The measured scattered intensity within
the sonar
resolution footprint will then be random due to both waveguide fluctuations
and randomness in
fish distribution. A statistical approach is then necessary to analyze the
measured acoustic data.
[0042] The mean scattered field within the sonar resolution footprint is found
by taking the
expected value of Eq. 3.
02
E Q(f) -G(r, I ro, f )G(r I ri, f )So(ro f)) (Eq. 4)
[0043] where waveguide Green functions G(r, I re, f ) , G(r I rõ f), the
position ri of the ith
fish, and the scatter function So (r, f) of the ith fish are all raondom
variables, as can be the
number of fish within the resolution footprint of the system over time. Since
the scatter function
of the fish is independent of the waveguide Green's function, the expectation
in the right hand
side of Eq. 4 is factorable for these terms.
[0044] The expected squared magnitude of the scattered field spectrum within
the sonar
resolution footprint, proportional to intensity, is
=
CA 02611205 2007-12-04
WO 2006/133304
PCT/US2006/022143
- 13 -
KµIfs(riro,põ fyll,*(r iro, põ ft))
N( N ( a \ 2
. E Q(f)( 70-2--G(r, I ro,f )G(r I r , , f )S 0(r' , f)EQ(f')`=7-1-1G* (r
. I ro, f')G* (r I r* f')S * (r* f')
1=1
(Eq. 5)
from Eq. 3.
[0045] The expected squared magnitude of the scattered field spectrum can also
be written in
terms of the square of the mean, a coherent term, and the variance of the
scattered field
spectrum, an incoherent term,
(I'lls (r I r0, p, f )12 = KT, (r Iro, pt, f))12 + Var(I',(r i ro,põ f ))
(Eq. 6)
[0046] The mean scattered field spectrum is effectively zero, based on both
theory and
experimentation, since the sonar resolution footprint has dimensions that are
large compared to
the acoustic wavelength and the distribution of fish within the resolution
footprint is random. So
the coherent term vanishes.
[0047] The expected squared magnitude of the scattered field spectrum the
within the sonar
resolution footprint is then,
(1111,(r 1 ro, põ f)12) = ilQ(f)12(47z-)4 IG(ri ) ro,. (Eq. 7)
f )121G(r ) ri, f)121S0(ri, f)12
[0048] Randomness in the fish scattering properties is effectively independent
of the ocean
transmission fluctuations in the Green functions. The expected squared
magnitude of
the scattered field spectrum can then be written as,
=
CA 02611205 2007-12-04
WO 2006/133304
PCT/US2006/022143
- 14 -
(IT, (r ro, f )12 ) = iQ ( f )12 (4r)4(1G(r, ro, f )121G(rIri, f )12 ) o
(r f )
k2
(Eq. 8)
where the first parenthetical factor on the right hand describes the known
source power of the
present system, the second factor in the expectation value describes
transmission to and from the
fish which can be computed from known bathemtry and sound speed measurements,
and the
third factor in the last expectation value describes the total scattering
cross section of the fish
within the resolution footprint, 10 log,, of which is the target strength of
fish within the
resolution footprint. Often the forward path and the return path are
uncorrelated, especially in
bistatic geometries, making the expectation of the product of magnitude
squared Green functions
equal the product of the expectations of the magnitude squared Green
functions. Eq. 8 is
typically implemented by using the Parabolic Equation to determine the Green
function in a
range-dependent waveguide connecting any two points in the waveguide at the
given frequency.
[0049] The total scattering cross-section of the fish within the resolution
footprint can then be
obtained by dividing these source and transmission factors from measurements
of the magnitude
squared of the scattered field. If the expected scattering cross-section of a
randomly selected
individual fish in the group is known, the total number of fish N can be
estimated by subtracting
this expected cross section for an individual from the total cross section of
the resolution
footprint.
[0050] The expected value of the magnitude square of the Green functions is
typically a very
slowly varying function over depth and range in comparison to fish group
distributions,
especially in continental shelf environments. The expected value of the
magnitude square of the
Green functions can be computed using a number of methods including, for
example, Monte-
Carlo simulation with the parabolic equation for a range-dependent fluctuating
ocean, as well as
the methods in P. Ratilal, N. C. Makris, "Mean and covariance of the forward
field propagated
through a stratified ocean waveguide with three-dimensional random
inhomogeneities,"
Acoust. Soc. Am. 118:3532-3559 (2005), and T. Chen, P. Ratilal, and N. C.
Makris "Mean and
variance of the forward field propagated through three-dimensional random
internal wav.es in a
continental-shelf wavegued," J. Acoust. Soc. Am. 118:3560-3574 (2005). (In
many continental-
shelf environments, it is also possible to simply estimate the expected value
of the magnitude
CA 02611205 2007-12-04
WO 2006/133304
PCT/US2006/022143
- 15 -
square of the Green function by depth averaging the magnitude square of the
deterministic Green
function calculated by the parabolic equation or another propagation model at
the range of the
sonar resolution footprint. This typically works well because randomization
does not
significantly change the total power transmitted through the waveguide, but
rather often mixes
and spreads that power relatively uniformly in depth.) Also, finite band
source signals are often
used so that integration of Eq. 7 or 8 over the source frequency band can on
its own significantly
smooths variations in the expected magnitude square of the Green function in
range and depth.
Expected scattered intensity from general environmental inhomogeneites
[0051] Here we describe an approach that can be used to model the scattering
from volumetric
inhomogeneities in the ocean, including fish, and the sea bottom. This can be
used
advantageously to optimize detection of fish and minimize reverberation from
the sea bottom in
the resolution footprint by adjusting controllable parameters such as source
frequency, source-
receiver location, and source array spatial windowing/mode-filtering.
[0052] Consider a volume V in the medium imaged at horizontal location p,
within its
resolution footprint. Given inhomogeneities at locations r, within the volume
with density d,
and sound speed c, that differ from the surrounding medium with ambient
density d and sound
speed c, the field scattered from the inhomogeneities can be modeled using the
first-order
Rayleigh-Born approximation to Green's theorem as,
Ts (r r0, põ f) = Q(f)(47r)2 filleCKG(r, j ro, f)G(r rõ f) dV G(r,1 ro, f)=
VG(r rõ f))dV,
(Eq. 9)
CA 02611205 2007-12-04
WO 2006/133304
PCT/US2006/022143
- 16 -
[0053] where lc = dc2 is the compressibility, rk. = is the fractional
difference in
compressibility, and f'd d,¨ d is the fractional difference in the density of
the
d,
inhomogeneities relative to the background medium.
[0054] Since the inhomogeneities are randomly distributed in their physical
and acoustical
scattering properties, a statistical approach is desirable. The expected
squared magnitude of the
scattered field spectrum from the volumetric inhomogeneities can be written,
as in Eq. 6, as the
sum of a coherent and an incoherent term. The coherent term is the square of
the mean scattered
field. The mean scattered field is given by,
('FS (r)ro,põ f)). Q(f)(4g)2fJJ(k2(F,c)(G(r, ) ro, f)G(r ) rõ f)) + Ord
)(VG(r, ro, f)=VG(rIrõ f))):1V,
(Eq. 10)
[0055] As with scattering from fish within the resolution footprint, the
coherent term is
negligibly small for scattering from the sea bottom. The mean square values of
r, and rd are
typically much smaller (by two orders of magnitude) than their variances and
their covariance.
The latter parameters are obtained by direct measurement, acoustic inversion,
or inference. The
expected squared magnitude of the scattered field spectrum within the sonar
resolution footprint
is then given by the incoherent term which is the variance of the scattered
field as,
(r ro,PõD12)
= IQ(f)12 (4704 IV, (k4VarK. XIG(r, I ro , f )12IG(r I rõ f )12 + Var(rd
)(1VG(r, re, , f) = VG(r rõ f )12 )
+Cov(1,,, rd X 291{G( r, I ro, f )G(r, I ro, f)S7 G* (r, I rõ f) = VG* (r rõ
f)})c1V,,
(Eq. 11)
where V, is the coherence volume for the 3D random inhomogeneities.
CA 02611205 2007-12-04
WO 2006/133304
PCT/US2006/022143
[0056] Eq. 11 is typically implemented by using the Parabolic Equation to
determine the Green
function in a range-dependent waveguide connecting any two points in the
waveguide at the
given frequency.
Scatter functions for fish and air-filled bubbles
[0057] Here we describe some typical scatter functions that can be used to
model the scattered
field from fish with Eqs. 7 or 8 or bubbles in the ocean.
[0058] For fish with swimbladders, a dominant source of scattering is often
that air-filled
organ. When,acoustically compact, their scatter function or target strength
can be modeled using
the target strength formulation of an equivalent bubble of the same volume
ISO (ri, f)I2 a2
(Eq. 12)
(fr2 f2 _1).4_ (52
[0059] where a is the swimbladder radius, fr is the resonance frequency of the
swimbladder,
and g is the total damping constant comprising of thermal, radiation and
viscous damping
effects. The resonance frequency of the swimbladder is a function of the
submergence depth D
of fish, where D and a are in meters, and is given by,
fr.26111+ 0.0984D (Eq. 13)
a
[0060] With these equations, the resonance frequency, or equivalently fish
depth, as well as
bubble radius and total damping constant can be determined by direct acoustic
measurements of
the spectral peak in fish scattering across frequency, fish target strength,
the spread of the
resonance peak across frequency. They may also be determined by from prior
knowledge, or
from other suitable means such as local capture trawl data.
[0061] For fish without swimbladders, the body of the fish provides the main
source of
scattering as a volumetric inhomogeneity. The Rayleigh-Born scattering model
described earlier
can also be applied to analyze scattering from such fish. Most fish of
interest at frequencies
CA 02611205 2007-12-04
WO 2006/133304
PCT/US2006/022143
- 18 -
contemplated herein have body sizes that are small compared to the acoustic
wavelength. Eq. 9
can be applied to derive the scatter function of an inhomogeneous fish body of
volume Vo as,
S(rõ f)=Vo¨k3 (r, +771"d) (Eq. 14)
47r
_______________ [0062] where 77 = k is the dot product of the incident and
scattered wavevectors. This
k2
scatter function can be used in Eqs. 7 and 8 to provide the scattered field-
intensity spectrum for
fish due to scattering from their bodies, given the density and
compressibility contrast of fish
relative to water. Typically, the density and compressibility ratios for fish
are well known a
priori, making the primary variable the fish volume, which can be determined
from acoustic
target strength measurements.
Maximization of fish returns and minimization of returns from boundary
reverberation
[0063] Returns within the resolution footprint from fish modeled via Eqs. 7-8
and Eqs. 12-14
can be maximized, and those from other environmental scatterers such as
seafloor
inhomogeneities modeled via Eq. 11 can be minimized, by adjusting controllable
parameters
such as source frequency, source-receiver location, and source array spatial
windowing. For
example, scattering from the seafloor tends to increase more slowly with
frequency than resonant
scattering from fish with swimbladders, below the resonance peak, as can be
inferred from Eqs.
11-14. Hence choosing the operational frequency near fish resonance can
maximize fish returns
and minimize those from seafloor scattering. Also, since seafloor scattering
is highly dependent
upon the depth of significant penetration of sound into the seafloor, as seen
in the volume
integral of Eq. 11 over the inhomogeneities causing the scattering, it can be
advantageous to
minimize seafloor scattering by stimulating lower-order modes that still fill
the watercolumn, but
do so at relatively shallow grazing angles and so do not penetrate as deeply
into the seafloor.
This can be accomplished by source array spatial windowing and placement of
sources in
shallower bathymetric locations, for example. Minimization of returns from
seasurface
roughness can be handled with the same equations analogously. Such returns are
not typically
CA 02611205 2007-12-04
WO 2006/133304
PCT/US2006/022143
- 19 -
significant except at very high sea states where seagoing research vessels
typically tend not to
operate.
Frequency optimization
[0064] A wide range of transmission frequencies may be used, ranging froin
very low
frequencies from several Hz to very high frequencies of tens of kHz. Long-
range sound
propagation in the ocean is less attenuated at lower frequencies and is less
sensitive to
oceanographic fluctuations. Also, reverberation from the seafloor tends to be
lower at lower
frequencies. Finally, the frequency range from 100 Hz to 3 kHz is particularly
optimal for the
present invention since it encompasses the swim-bladder resonance for many
species of fish,
where target strengths are high.
[0065] In practice, the optimal frequency or frequency band will be dictated
by several factors.
First, scattering from any fish is effectively omni-directional. In accordance
with the present
invention, an individual fish may be viewed from any direction (or many
directions at once) and
have the same target strength. There are no fluctuations in scattering due to
changes in fish
orientation as in CFFS. In particular, the fish generally will be larger than
the wavelengths used
in CFFS, and aspect-dependent fluctuations consequently cause errors in fish
detection and
abundance estimation. (Scatterers small compared to the acoustic wavelength
are known as
"acoustically compact" scatterers.)
[0066] The optimal wavelength is desirably large enough that the received
acoustic field
scattered from any given fish is expressible as the product of three factors ¨
one for
transmission to the given fish, one for scattering from the fish, and one for
transmission from the
fish. At CFFS wavelengths, this factorization is typically not possible in a
waveguide remote
sensing system because propagation and scattering effects are convolved
together. Standard
CFFS methods for removing transmission effects can then cause significant
error when used for
remote sensing in a waveguide at CFFS frequencies. The reason is that in a
waveguide, there are
no single incident and scattered directions as in free space, but rather many
such directions in
elevation angle. These arise from the multipath or multi-modal nature of
waveguide
propagation. If the scatterer is large compared to the wavelength, it will
have a directional
scattering pattern with many lobes. These may stimulate the modes differently,
leading to
convolved scattering and propagation, as is true at most CFFS frequencies. If
the object scatters
CA 02611205 2007-12-04
WO 2006/133304
PCT/US2006/022143
- 20 -
omni-directionally over the elevation angles spanned by the modes as in the
present invention,
the scattering can factor from propagation.
[0067] At the wavelengths utilized herein, and again in contrast to typical
CFFS systems,
acoustic attenuation due to propagation through the fish is negligible even
over long ranges.
This is because the extinction per unit volume due to scattering from fish is
very small at such
wavelengths. This is often not true for CFFS, where shorter wavelengths lead
to attenuation
through fish schools that can be significant and cause fading and shadowing of
distant schools or
distant parts of schools in the forward direction. This, in turn, can lead to
significant errors in
detection and abundance estimates.
[0068] The optimal acoustic wavelength k is also chosen such that the far-
field range (L2A) is
shorter than the mean spacing between fish, where L is the length scale of the
dominant scatterer
within a fish, which may be the entire fish or just the swimbladder. This is
often not true in
CFFS frequencies, which can lead to multiple-scattering effects that impair
inversion for fish
population density.
= [0069] The optimal wavelength will also be large enough that the shadow
length from any
individual fish or group of fish is smaller than the mean distance between the
fish. This may not
be true at CFFS frequencies and can lead to significant multiple-scattering
effects that impair
accurate detection of fish and inversion for fish population density. Again,
in accordance with
the present invention, sound is incident on a given fish from many elevation
angles at once, and
propagates back to the receiver after scattering into many elevation angles at
once. The kind of
shadowing caused by dense groups of fish in direct-path CFFS is then greatly
reduced by the
waveguide propagation contemplated herein. Furthermore, attenuation from
absorption and
scattering in the water and seabed from non-fish related properties of the
medium increase with
increasing frequency. At the transmission frequencies suitable for the present
invention, which
encompass both the optimal frequency for long-range waveguide propagation as
well as the
optimal frequency for remote waveguide imaging of fish, these attenuation
effects are greatly
reduced in comparison to CFFS frequencies. As well, scattering from the
seafloor and
seasurface tends to increase with increasing frequency, which can mask remote
returns from fish
as frequency increases into CFFS regimes; this is not a problem over the range
of frequencies
contemplated herein.
CA 02611205 2007-12-04
WO 2006/133304
PCT/US2006/022143
- 21 -
[0070] Another constraint on transmission wavelength is the need to support
modal
propagation. If the chosen wavelength is too large, the waveguide can no
longer support modal
propagation, so remote sensing becomes inefficient. Also, fish scattering
levels will be reduced,
but often so is interference from unwanted seafloor and seasurface scatterers.
[0071] Source power is also an important consideration, and is preferably
chosen so that fish
scattering stands above ambient noise level in the waveguide by 5 dB at the
maxiumum range of
detection for the given wavelength.
Variance stabilization by log-transformation for optimal imaging display and
pattern
recognintion and reducing fluctuations due to randonz scattering and
propagation scintillation
[0072] Scattering from random surfaces and volumes leads to randomness in the
received field,
as does propagation through the fluctuating ocean. Both of these forms of
randomness lead, in
turn, to fluctuations in the received acoustic scattered returns from the fish
schools. The
instantaneous received acoustic field returned from a group of fish, or the
sea floor or sea
surface, is a circular complex Gaussian random variable, as is the field
transmitted through a
fluctuating ocean waveguide. This is a consequence of the central limit
theorem given the many
random contributions to the field from fish, seafioor or seasurface
scatterers, or propagation
through the random ocean. The magnitude square of the instantaneous returned
acoustic field,
proportional to instantaneous intensity and for simplicity here defined as
instantaneous intensity,
then follows a negative exponential distribution. Consecutive pings produce
statistically
independent samples of the returned acoustic field from a group of fish within
the resolution
footprint of the system. Averaging independent samples of instantaneous
intensity leads to the
averaged intensity, which follows the gamma distribution. Both instantaneous
intensity and
averaged intensity have standard deviations proportional to the expected or
mean intensity. This
means that an intensity image of the environment has signal-dependent noise
such that the
standard deviation or error in intensity at any pixel is proportional to the
mean, and so is larger
where the mean is larger and smaller where the mean is smaller. The non-
uniform standard
deviation throughout the image is known as speckle noise.
[0073] It is generally not optimal to search for fish patterns in an image
with signal-dependent
noise because methods that remove noise will typically also remove information
about the signal
(since the noise depends on the signal). The log-transformation of averaged
intensity is taken to
CA 02611205 2007-12-04
WO 2006/133304
PCT/US2006/022143
- 22 -
address this problem. The log transform homomorphically transforms signal-
dependent noise to
signal-independent noise such that the standard deviation at each pixel in the
image is constant
and independent of the mean of the log-transformed averaged intensity. The
variance is then
stablized throughout the image so that the standard deviation or error at each
pixel is uniform
throughout the log-transformed image, and is independent of the signal level
(in dB) at each
pixel. Standard correlation or matched filtering is then optimal for finding
patterns of fish
distributions within the log-transformed image. Averaging is done in intensity
before log-
transformation to reduce and effectively eliminate biases inherent in log-
transformation.
[0074] The standard deviation at any pixel in an averaged intensity image is
reduced by
1
-:ril from that of the instantaneous intensity (N=1 case) at that pixel, where
N is the number of
independent samples in the average. The averaged intensity will vary
throughout the image, to
produce a scene, as will the standard deviation of averaged intensity. The
standard deviation of
4.3
the log-transformed image in dB, however, is roughly the constant Jr- for N> 2
for every
pixel in the image. By averaging both adjacent range bins and consecutive
images, at, for
example, N = 10, a standard deviation of roughly 1.36 dB is obtained, which
translates to a
standard deviation of roughly 37% of the true population density at the given
pixel. This
percentage error is further reduced when total population is estimated as
noted below.
Species identification by frequency analysis
[0075] Different species of fish can have unique acoustic target strengths.
The frequency
dependence of these target strengths can be used to remotely identify species
in accordance with
the present invention. This can be achieved, for example, by sending a
transmission over a
distinct frequency band, forming a wide-area image of target strength per unit
area for this
transmission, and repeating the process immediately over a different frequency
band. The
separate transmissions can be sent within seconds of each other or
simultaneously if the
frequency content is non-overlapping. The difference in target strength per
unit area by a pixel-
to-pixel subtraction of any two images taken at approximately the same time
will yield a spatial
image of the difference in fish target strength per unit area for the
different frequency bands of
CA 02611205 2007-12-04
WO 2006/133304
PCT/US2006/022143
- 23 -
the two transmissions. Comparison of the differences, as well as absolute
levels, are used to
distinguish fish species at various locations in wide area images.
[0076] Social groupings of fish, such as schools and shoals, may be
automatically detected and
located in images obtained as described herein based on sound pressure level,
target strength or
population density. This may be accomplished by identifying all pixels in the
image above a
specified threshold with respect to the background level and contouring these
high-level regions.
The contours segment fish populations as regions of locally high sound
pressure level, target
strength or fish population density in a given image.
[0077] Indeed, image-processing module 330 may create wide-area movies of the
evolution of
fish populations as a concatenated sequence of images. The images may be based
on sound
pressure level, scattering strength and/or areal fish population density. The
movies make it
possible to quantitatively study the real-time behavior of fish populations,
and to potentially
identify species from observed behavior.
Areal fish population density, spatial spectra, and time series of population
and temporal spectra
and correlation scales
[0078] Once the representative or mean target strength of an individual fish
has been identified
at a given location (from the frequency analysis described above, by direct
trawl sampling or
CFFS, or by prior knowledge), an image of the areal population density of the
fish can be
determined from the image of target strength at each pixel. This is
accomplished by subtracting
the mean target strength of an individual fish in that location from every
pixel where that mean
target strength was determined to be representative in the image.
[0079] Two-dimensional images of the spatial spectra of fish population
density then may be
obtained by taking the two-dimensional Fourier transform of an image of areal
fish population
density. The standard deviation at each pixel of the spectral images can be
reduced by averaging
statistically independent spectral images from consecutive pings. Log
transformation can be used
to stabilize the variance and to determine if power laws exist in the spectra
that can be used for
characterization and prediction of spatial distributions.
[0080] The total fish.population in a given fish population-density image may
be obtained by
summing the values of each pixel and multiplying by the pixel area. Time
series of fish
CA 02611205 2007-12-04
WO 2006/133304
PCT/US2006/022143
- 24 -
population density are then generated by computing the total fish population
for a temporal
sequence of images. Besides total fish population, it is possible to determine
fish population
within a particular areal density range, or fish population within a given
segmented school of fish
or spatial region, by summing only the relevant pixels.
[0081] Since contributions from millions of fish from hundreds of independent
pixels are added
in these population estimates, fluctuations from propagation scintillation and
variations in fish
scattering cross-section should lead to errors of less than 1% of the
estimated value for any given
temporal population sample. (This is a consequence of the "law of large
numbers." The
percentage standard deviation of the total population is the ratio of the
standard deviation to
mean population density at a single pixel in an averaged image divided by the
square root of the
number of independent pixels summed to obtain the total population.)
7. Time series offish school area, center of population and morphology
Data-analysis
module 320 can characterize the total area occupied by a detected and
segmented fish school by
determining the number of pixels in a segmented school and multiplying by the
pixel area. The
center of population of the segmented school in a fish-population density
image can be
determined by finding the first moment of the horizontal position vector with
respect to the
spatially varying fish population density within the school. The principal
axis and of the fish
school's extent and its direction can be determined from the second central
moment of the
horizontal position vector within the school. These principal axes
quantitatively characterize the
school's morphology. Alternatively, the normalized two-dimensional
autocoffelation function
of an image of fish population density may be used to determine the area of
coherence of a
population center, where this coherence area may be defined by the nearest
contour to the peak
correlation at zero lag that has fallen to a given value, such as the
convention 1/e. Time series of
fish school area, center of population and morphology are generated by
computing these
quantities for a temporal sequence of images.
Fish velocity estimation by differential rnotion, conservation of mass,
environmental pressures
estimated by conservation of momentum
[0082] The absolute velocity vectors of an entire field of fish may also be
determined by time
differencing the population density and space differencing the mass flow as
constrained by
CA 02611205 2007-12-04
WO 2006/133304
PCT/US2006/022143
- 25 -
conservation of mass and, for example, minimization of kinetic energy in the
fish flow field
following Fermat's principle of least action. The environmental pressures on
the fish causing
them to move may also then be quantified using the equation of conservation of
momentum and
using the computed velocity field and the measured population density field.
Low-pass filtering
of the spatial population density data may be used to estimate higher
velocities in the flow field.
[0083] The absolute velocities of fish groups may also be determined by time
differencing the
center of mass or spatial gradient for the given school with respect to
charted returns from a
target of fixed and known location. The relative velocities of fish centers of
mass may be
determined by time differencing the positions of the centers of mass.
Instantaneous fish-school velocity estimation by Doppler
[0084] For bottom-moored sources and receivers that are well fixed to the
seafloor, the mean
instantaneous velocity of a fish school within the resolution footprint of the
system and its
variance may be determined by examining the mean and variance in the Doppler
frequency shift
of the scattered return. Suitable waveforms for determining the Doppler shift
include windowed
m-sequences, since these provide both high range resolution and high Doppler
resolution for
low-mach-number targets like fish. For a single source and receiver, only the
radial component
of velocity is determinable. For multi-static scenarios with multiple
receivers and/or sources,
both horizontal velocity components are determinable. Long-range fish velocity
estimation from
moving source-receiver systems is more difficult because motion of the
platform can mask the
Doppler signal from the fish.
Exemplary results
[0085] A system in accordance with the present invention was used to survey
the East Coast
Continental Shelf of the United States 200 km south of Long Island, New York,
near the shelf
edge in May 2003 simultaneously with line-transect measurements made by CFFS.
High spatial
and temporal correlation was found between the Eularian system of the present
invention and the
Lagrangian CFFS system in detecting, imaging and charting both large and small
fish schools.
While the CFFS system had a 10-m diameter horizontal resolution footprint, the
system of the
CA 02611205 2007-12-04
WO 2006/133304
PCT/US2006/022143
- 26 -
present invention had a resolution of 15 m along the CFFS transect and roughly
2 degrees in
azimuth across it, e.g. 350 m cross-range resolution at 10 km.
[0086] Many of the fish shoals co-registered in time and space by the two
systems persisted
over time in wide-area images before and after CFFS transection. This observed
persistence was
also exhibited in a purely spatial correspondence in detecting, imaging and
charting fish schools
by the two systems. After statistical analysis, it was found that at locations
where the present
system imaged features prominent enough to exceed background intensity by at
least an order of
magnitude, at a temporal repeatability rate exceeding 25% over the given day,
CFFS always
detected highly concentrated fish layers of at least 0.4 fish/m3 areal
density. These corresponded
to very large and densely populated fish schools. No correlation was found
between features in
images generated in accordance herewith and those of the sub-bottom after
extensive
investigation and seafloor features on the shelf typically lacked sufficient
relief to cause
noticeable returns.
[0087] Fish population densities were continuously estimated over wide-areas
from imagery
generated in accordance herewith. The areal population densities are
consistent with those
obtained from CFFS over the same time period. Our population density estimates
depend on the
expected scattering cross section of an individual fish, which we find to have
a corresponding
target-strength of -45 dB in the 390-440 Hz band of our experiment. This
follows from a
combination of statistical modeling and empirical evidence gathered across
species by trawl
samples previously obtained in the same location and local simultaneous CFFS
measurements of
both volumetric and areal fish population density. Catches consisted of a
variable component of
Atlantic herring, scup, hake, black sea bass, dogfish and mackerel all of
which have target
strengths within an order of magnitude of each other in the 390-440 Hz band,
which is near or
just below swim-bladder resonance for many of these species. A standard
deviation of less than
1-dB per pixel corresponds to an error of less than 25% in any intensity or
population density
estimate for the given pixel. Variations in the scattering cross-section of
individual fish are
expected to introduce a standard deviation of less than 1 dB for any pixel
corresponding to a fish
shoal, since a very large number of fish are summed in a corresponding
resolution footprint of
the present system. Transmission scintillation from randomness in the ocean
medium due to such
effects as internal waves and turbulence ultimately also introduces relatively
little uncertainty in
CA 02611205 2007-12-04
WO 2006/133304
PCT/US2006/022143
- 27 -
obtained images since a standard deviation of roughly 1 dB per pixel is
expected after averaging
over five consecutive instantaneous images and two adjacent range bins per
image.
[0088] Time series of fish populations were generated by sampling at 50-second
intervals.
They covered the total fish population as well as the population above or
below various
significant areal density thresholds. The population contribution from
moderate-to-low densities
(nA <0.2 fish/m2), apparently corresponding to small scattered fish groups,
and the outskirts of
large fish shoals, was relatively stable throughout the day and accounted for
roughly 1/5 to 1/3 of
the total fish population, and roughly 90% of the total area. A dramatic
decrease in moderate-to-
high-density populations (nA 0.2 fish/m2) from roughly 4/5 to 1/2 of the total
occurred in
roughly hour-long events on two separate occasions. Fragmentation in the
latter case was
severe. A decrease in area occupied by moderate-to-high fish densities
occurred with a
corresponding increase in the area occupied by moderate-to-low density
populations was
observed. The loss of population is either due to fish leaving the survey area
or dispersal of fish
to below the 0.01 fish/m2 density where seafloor scattering mechanisms
dominate. The latter
apparently masks fish returns over at most 30% of the area surveyed. This non-
biologic
mechanism still contributes to the areal density images in all other regions
but is not included in
population time series. Extremely high-density regions, with concentrations
greater than 0.5
fish/m2 account for less than 16% of the total population and less than 1% of
the total area. Since
contributions from millions of fish from hundreds of independent pixels were
added in these
population estimates, fluctuations from propagation scintillation and
variations in fish scattering
cross-section should lead to errors of less than 1% of the estimated value for
any given temporal
population sample.
[0089] The availability of temporally continuous imagery also makes it
possible to
quantitatively analyze the behavior and interaction of both large and small
fish groups over very
wide areas in an unprecedented manner. Data-analysis module 320 may utilize an
automated
procedure to segment, track and estimate the population and area of each of
the individual fish
groups found within a series of images. This facilitates study of the
evolution and fragmentation
of a fish school. First, individual schools are identified and segmented for
moderate-to-high fish
densities (nA > 0.2 fish/m2). Time series of population, area, and population
center are then
generated for these groups.
CA 02611205 2013-09-06
71495-73
-28-
[0090] The relative velocity of fish groups can also be remotely determined
from imagery
obtained in accordance herewith. A histogram of the differential speed between
population
centers may be generated for purposes of analysis. In our experiments, a mean
separation rate of
-0.30 m/s and standard deviation of 3.0 m/s were obtained, and these are
consistent with speeds
expected for individual fish. Extreme values in the histogram, of up to 15
m/s, however, are
likely apparent speeds resulting from abrupt fish density changes propagating
like waves across a
school.
[0091] One skilled in the art will realize the invention may be embodied in
other specific forms.
The foregoing embodiments
l 0 are therefore to be considered in all respects illustrative rather than
limiting of the invention
described herein. Scope of the invention is thus indicated by the appended
claims, rather than by
the foregoing description, and all changes that come within the meaning and
range of
equivalency of the claims are therefore intended to be embraced therein. The
scope of the claims
should not be limited by the examples herein, but should be given the broadest
interpretation
consistent with the description as a whole.