Note: Descriptions are shown in the official language in which they were submitted.
CA 02613817 2013-12-31
,
,
- 1 -
WELL MODELING ASSOCIATED WITH EXTRACTION OF HYDROCARBONS
FROM SUBSURFACE FORMATIONS
BACKGROUND
[0001]
This section is intended to introduce the reader to various aspects of
art, which may be associated with exemplary embodiments of the present
techniques, which are described and/or claimed below. This discussion is
believed to be helpful in providing the reader with information to facilitate
a better
understanding of particular aspects of the present techniques. Accordingly, it
should be understood that these statements are to be read in this light, and
not
necessarily as admissions of prior art.
[0002]
The production of hydrocarbons, such as oil and gas, has been
performed for numerous years. To produce these hydrocarbons, one or more
wells of a field are typically drilled into a subsurface location, which is
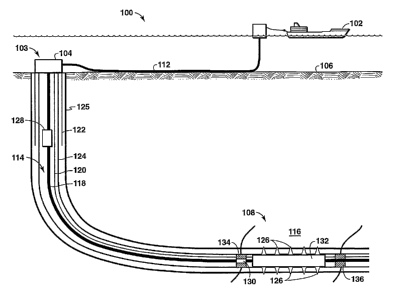
generally
referred to as a subterranean formation or basin. The process of producing
hydrocarbons from the subsurface location typically involves various phases
from
a concept selection phase to a production phase. Typically, various models and
tools are utilized in the design phases prior to production of the
hydrocarbons to
determine the locations of wells, estimate well performance, estimation of
reserves, and plan for the development of the reserves.
In addition, the
subsurface formation may be analyzed to determine the flow of the fluids and
structural properties or parameters of rock geology. In the production phase,
the
wells operate to produce the hydrocarbons from the subsurface location.
[0003]
Generally, the phases from concept selection to production are
performed in serial operations. Accordingly, the models utilized in the
different
phases are specialized and directed to a specific application for that phase.
As a
result of this specialization, the well models employed in different phases
CA 02613817 2013-12-31
- 2 -
typically use simplistic assumptions to quantify well performance potential,
which
introduce errors in the well performance evaluation and analysis. The errors
in
the prediction and/or assessment of well performance may impact economics for
the field development. For example, during one of the well design phases, such
as a well completion phase, failure to accurately account for the effects of
well
completion geometry, producing conditions, geomechanical effects, and changes
in produced fluid compositions may result in estimation errors of production
rates.
Then, during the subsequent production phase, the actual production rates and
well performance may be misinterpreted because of the errors in simplified
well
performance models. As a result, well remedial actions (i.e., well workovers),
which are costly and potentially ineffective, may be utilized in attempts to
stimulate production from the well.
[0004] Further, other engineering models may be specifically designed for a
particular application or development opportunity. These models may be overly
complicated and require large amounts of time to process the specific
information
for the particular application. That is, the engineering models are too
complex
and take considerable amounts of time to perform the calculations for a single
well of interest. Because these models are directed at specific application or
development opportunities, it is not practical or possible to conduct
different
studies to optimize the well completion design and/or use the engineering
model
to ensure that each well is producing at its full capacity.
[0005] Accordingly, the need exists for a method and apparatus to model
well
performance for prediction, evaluation, optimization, and characterization of
a
well in various phases of the well's development based on a coupled physics
model.
[0006] Other related material may be found in Yarlong Wang et al., "A
Coupled Reservoir-Geomechanics Model and Applications to Wellbore Stability
and Sand Prediction", SPE 69718, March 12, 2001; and David L. Tiffin,
CA 02613817 2013-12-31
=
- 3 -
"Drawdown Guidelines for Sand Control Completions", SPE 84495, October 5,
2003.
SUMMARY OF INVENTION
[0007]
In one embodiment, a method is described. The method includes
identifying failure modes for a well completion. At least one technical limit
associated with each of the failure modes is obtained. Then, an objective
function for well performance optimization is formulated. Then, an
optimization
problem is solved using the objective function and at least one technical
limit to
optimize well performance.
[0008]
In an alternative embodiment, an apparatus is disclosed. The
apparatus includes a processor with a memory coupled to the processor and an
application that is accessible by the processor. The application is configured
to
receive failure modes for a well or well completion; obtain at least one
technical
limit associated with each of the failure modes; formulate an objective
function for
well performance optimization; solve an optimization problem using the
objective
function and at least one technical limit to optimize well performance; and
provide
the optimized solution to a user.
BRIEF DESCRIPTION OF THE DRAWINGS
[0009]
The foregoing and other advantages of the present technique may
become apparent upon reading the following detailed description and upon
reference to the drawings in which:
[0010]
FIG. 1 is an exemplary production system in accordance with certain
aspects of the present techniques;
[0011]
FIG. 2 is an exemplary modeling system in accordance with certain
aspects of the present techniques;
CA 02613817 2013-12-31
- 4 -
[0012] FIG. 3
is an exemplary flow chart of the development of response
surfaces for well operability limits in accordance with aspects of the present
techniques;
[0013] FIG. 4
is an exemplary chart of well drawdown versus well drainage
area depletion of the well in FIG. 1 in accordance with the present
techniques;
[0014] FIG. 5
is an exemplary flow chart of the development of response
surfaces for well producibility limits in accordance with aspects of the
present
techniques;
[0015] FIGS.
6A and 6B are exemplary charts of well producibility limit of the
well in FIG. 1 in accordance with the present techniques;
[0016] FIG. 7
is an exemplary flow chart of the development of coupled
physics limits in accordance with aspects of the present techniques;
[0017] FIG. 8
is an exemplary chart of the drawdown versus depletion of the
well in FIG. 1 in accordance with the present techniques;
[0018] FIG. 9
is an exemplary flow chart of the optimization of technical limits
in accordance with aspects of the present techniques; and
[0019] FIGs.
10A-100 are exemplary charts of the performance optimization
of the well of FIG. 1 in accordance with the present techniques.
DETAILED DESCRIPTION
[0020] In the
following detailed description, the specific embodiments of the
present invention will be described in connection with its preferred
embodiments.
However, to the extent that the following description is specific to a
particular
embodiment or a particular use of the present techniques, this is intended to
be
illustrative only and merely provides a concise description of the exemplary
embodiments.
Accordingly, the invention is not limited to the specific
embodiments described below, but rather, the invention includes all
alternatives,
CA 02613817 2013-12-31
- 5 -
modifications, and equivalents falling within the true scope of the appended
claims.
[0021] The
present technique is direct to a method for optimizing integrated
well performance for a specific well. Under the present technique a well
performance related parameter, such as maximizing hydrocarbon recovery from
the well, may be selected for optimization. Based
on well performance
parameter or well function, an Objective Function and optimization constraints
are defined by one or more technical limits, such as the well operability
limit, well
producibility limit, or coupled physics technical limits. The results from
this
Objective Function are translated in well operating parameters, such as
drawdown and depletion over well life cycle. Then, a field surveillance plan,
which may enable measurement of optimized well operating parameters in field
operations, is developed for use in operating the well. The above process
enhances well operations in field in an integrated manner that accounts for
various physics based technical limits.
[0022]
Turning now to the drawings, and referring initially to FIG. 1, an
exemplary production system 100 in accordance with certain aspects of the
present techniques is illustrated. In the exemplary production system 100, a
floating production facility 102 is coupled to a well 103 having a subsea tree
104
located on the sea floor 106. To access the subsea tree 104, a control
umbilical
112 may provide a fluid flow path between the subsea tree 104 and the floating
production facility 102 along with a control cable for communicating with
various
devices within the well 103.
Through this subsea tree 104, the floating
production facility 102 accesses a subsurface formation 108 that includes
hydrocarbons, such as oil and gas. However, it should be noted that the
production system 100 is illustrated for exemplary purposes and the present
techniques may be useful in the production of fluids from any location.
[0023] To
access the subsurface formation 108, the well 103 penetrates the
sea floor 106 to form a wellbore 114 that extends to and through at least a
CA 02613817 2013-12-31
- 6 -
portion of the subsurface formation 108. As may be appreciated, the subsurface
formation 108 may include various layers of rock that may or may not include
hydrocarbons and may be referred to as zones. In this example, the subsurface
formation 108 includes a production zone or interval 116. This production zone
116 may include fluids, such as water, oil and/or gas. The subsea tree 104,
which is positioned over the wellbore 114 at the sea floor 106, provides an
interface between devices within the wellbore 114 and the floating production
facility 102. Accordingly, the subsea tree 104 may be coupled to a production
tubing string 118 to provide fluid flow paths and a control cable 120 to
provide
communication paths, which may interface with the control umbilical 112 at the
subsea tree 104.
[0024] The wellbore 114 may also include various casings to provide support
and stability for the access to the subsurface formation 108. For example, a
surface casing string 122 may be installed from the sea floor 106 to a
location
beneath the sea floor 106. Within the surface casing string 122, an
intermediate
or production casing string 124 may be utilized to provide support for walls
of the
wellbore 114. The production casing string 124 may extend down to a depth
near or through the subsurface formation 108. If the production casing string
124
extends through the subsurface formation 108, then perforations 126 may be
created through the production casing string 124 to allow fluids to flow into
the
wellbore 114. Further, the surface and production casing strings 122 and 124
may be cemented into a fixed position by a cement sheath or lining 125 within
the wellbore 114 to provide stability for the well 103 and subsurface
formation
108.
[0025] To produce hydrocarbons from the subsurface formation 108, various
devices may be utilized to provide flow control and isolation between
different
portions of the wellbore 114. For instance, a subsurface safety valve 128 may
be
utilized to block the flow of fluids from the production tubing string 118 in
the
event of rupture or break in the control cable 120 or control umbilical 112
above
CA 02613817 2013-12-31
- 7 -
the subsurface safety valve 128. Further, the flow control valve 130 may be a
valve that regulates the flow of fluid through the wellbore 114 at specific
locations. Also, a tool 132 may include a sand screen, flow control valve,
gravel
packed tool, or other similar well completion device that is utilized to
manage the
flow of fluids from the subsurface formation 108 through the perforations 126.
Finally, packers 134 and 136 may be utilized to isolate specific zones, such
as
the production zone 116, within the annulus of the wellbore 114.
[0026] As noted above, the various phases of well development are typically
performed as serial operations that utilize specialized or overly simplified
models
to provide specific information about the well 103. For the simplistic models,
general assumptions about certain aspects of the well 103 results in errors
that
may impact field economics. For example, compaction is a mechanical failure
issue that has to be addressed in weak, highly compressible subsurface
formation 108. Typically, compaction is avoided by restricting the flowing
bottom
hole pressure of the well based upon hog's laws or rules of thumb. However, no
technical basis supports this practice, which limits the production of
hydrocarbons from the well. In addition, faulty assumptions during the well
design phases may result in the actual production rates being misinterpreted
during the production phase. Accordingly, costly and potentially ineffective
remedial actions may be utilized on the well 103 in attempts to stimulate
production.
[0027] Further, complicated models that account for the physical laws
governing well performance are time consuming, computationally intensive, and
developed for particular well of interest. Because these complicated models
are
directed to a specific application, it is not practical to conduct different
studies to
optimize the completion design and/or ensure that other wells are producing at
full capacity based upon these models. For example, a field may include
numerous wells that produce hydrocarbons on a daily basis. It is not practical
to
utilize the complicated models to prevent well failures and optimize the
CA 02613817 2013-12-31
- 8 -
performance of each well. Also, it is unreasonable to utilize the complicated
models during each phase of the development of the well because the time
associated with the analysis or processing of the data. As such, the
complicated
models leave many wells unevaluated for potential failures and maintained in a
non-optimized state.
[0028]
Beneficially, the present technique is directed to a user tool that
models well performance prediction, evaluation, optimization, and
characterization of a well. Under the present technique, the engineering model
based response surfaces provide physics based well producibility limits and
well
operability limits. Alternatively, engineering coupled physics simulators are
used
to develop coupled physics technical limits. The well producibility limit
along with
the well operability limit and the coupled physics limits are used to develop
integrated well performance limits, which are discussed below in greater
detail.
The response surfaces may be utilized to efficiently evaluate the well through
each of the different phases of the well's development.
Accordingly, an
exemplary embodiment of the user tool is discussed in greater detail in FIG.
2.
[0029] FIG. 2
is an exemplary modeling system 200 in accordance with
certain aspects of the present techniques. In this modeling system 200, a
first
device 202 and a second device 203 may be coupled to various client devices
204, 206 and 208 via a network 210. The first device 202 and second device
203 may be a computer, server, database or other processor-based device, while
the other devices 204, 206, 208 may be laptop computers, desktop computers,
servers, or other processor-based devices. Each of these devices 202, 203,
204,
206 and 208 may include a monitor, keyboard, mouse and other user interfaces
for interacting with a user.
[0030]
Because each of the devices 202, 203, 204, 206 and 208 may be
located in different geographic locations, such as different offices,
buildings,
cities, or countries, the network 210 may include different devices (not
shown),
such as routers, switches, bridges, for example. Also, the network 210 may
CA 02613817 2013-12-31
- 9 -
include one or more local area networks, wide area networks, server area
networks, or metropolitan area networks, or combination of these different
types
of networks. The connectivity and use of network 210 by the devices 202, 203,
204, 206 and 208 may be understood by those skilled in the art.
[0031] The first device 202 includes a user tool 212 that is configured to
provide different well operability limits and well producibility limits based
on
response surfaces 214 to a user of the devices 202, 204, 206 and/or 208. The
user tool 212, which may reside in memory (not shown) within the first device
202, may be an application, for example. This application, which is further
described below, may provide computer-based representations of a well
completion, such as well 103 of FIG. 1, connected to a petroleum reservoir or
a
depositional basin, such as subsurface formation 108 of FIG. 1. The user tool
212 may be implemented as a spreadsheet, program, routine, software package,
or additional computer readable software instructions in an existing program,
which may be written in a computer programming language, such as Visual
Basic, Fortran, C++, Java and the like. Of course, the memory storing the user
tool 212 may be of any conventional type of computer readable storage device
used for storing applications, which may include hard disk drives, floppy
disks,
CD-ROMs and other optical media, magnetic tape, and the like.
[0032] As part of the user tool 212, various engineering models, which are
based on complex, coupled physics models, may be utilized to generate
response surfaces for various failure modes. The response surfaces 214 may
include various algorithms and equations that define the technical limits for
the
well for various failure modes. Further, the user tool 212 may access
previously
generated response surfaces, which may be applied to other wells. That is, the
user tool 212 may be based on a common platform to enable users to evaluate
technical limits at the same time, possibly even simultaneously. Further, the
user
tool 212 may be configured to provide graphical outputs that define the
technical
limit and allow the user to compare various parameters to modify technical
limits
CA 02613817 2013-12-31
- 10 -
to enhance the production rates without damaging the well. These graphical
outputs may be provided in the form of graphics or charts that may be utilized
to
determine certain limitations or enhanced production capacity for a well. In
particular, these technical limits may include the well operability limits,
well
producibility limits and coupled physics limits, which as each discussed below
in
greater detail.
[0033] The second device 203 includes a coupled physics tool 218 that is
configured to integrate various engineering models together for a well
completion. The coupled physics tool 218, which may reside in memory (not
shown) within the second device 203, may be an application, for example. This
application, which is further described below in FIGS. 7 and 8, may provide
computer-based representations of a well completion, such as well 103 of FIG.
1,
connected to a petroleum reservoir or a depositional basin, such as subsurface
formation 108 of FIG. 1. The coupled physics tool 218 may be implemented as a
program, routine, software package, or additional computer readable software
instructions in an existing program, which may be written in a computer
programming language, such as Visual Basic, Fortran, C++, Java and the like.
Of course, the memory storing the coupled physics tool 218 may be of any
conventional type of computer readable storage device used for storing
applications, which may include hard disk drives, floppy disks, CD-ROMs and
other optical media, magnetic tape, and the like.
[0034] Associated with the coupled physics tool 218, various engineering
models, which are based on complex, coupled physics models, may be utilized to
generate coupled physics technical limits 220 for various failure modes. The
coupled physics technical limits 220 may include various algorithms and
equations that define the technical limits for the well for various failure
modes
that are based on the physics for the well completion and near well
completion.
Similar to the user tool 212, the coupled physics technical limits 220 may be
accessed by other devices, such as devices 202, 204, 206 and 208, and may be
CA 02613817 2013-12-31
- 11 -
configured to provide graphical outputs that define the technical limit. A
more
detailed discussion of the coupled physics limits or coupled physics technical
limits is discussed in FIGs. 7 and 8 below.
[0035]
Beneficially, under the present technique, the operation of the well may
be enhanced by technical limits derived from utilizing the user tool 212 which
is
based on response surfaces 214 developed using engineering simulation models
or computational simulation models based on either finite difference, 3D
geomechanical finite-element, finite element, finite volume, or another point
or
grid/cell based numerical discretization method used to solve partial
differential
equations. Unlike the complicated engineering models, the user tool 212 is
based response surfaces 214 that are derived from the use of engineering
models not designed for a specific application or development opportunity. The
user tool 212 based on response surfaces 214 may be utilized for a variety of
different wells. That is, the response surfaces 214 may represent detailed
engineering models without requiring tremendous amount of computing power
and skilled expertise to operate, configure, and evaluate the software
packages,
such as, but not limited to, ABAQUSTM, FluentTM, ExcelTM, and MatlabTM. Also,
in contrast to the simplified models, the technical limits developed using the
user
tool 212 accounts for the physics governing well performance. That is, the
user
tool 212 accounts for various physical parameters, which are ignored by
analysis's based solely on simplified models, such as rates, hog's laws,
and/or
rules-of-thumb, for example.
[0036] Furthermore, because detailed engineering models have been
simplified to response surfaces 214, the user tool 212 may be applied to a
variety
of wells to assess the risk of mechanical well integrity or operability
failure,
potential for well producibility or flow capacity limit, optimize well
performance
using the well operability limits along with the well producibility limits,
and/or the
coupled physics technical limit that addresses other physical phenomenon not
addressed by the operability and producibility limits, as discussed below. As
an
CA 02613817 2013-12-31
- 12 -
example, a risk assessment may be conducted during the concept selection
phase to aid in well completion selection decisions, well planning phase to
aid in
well and completion designs, and production phase to prevent failures and
increase the production rates based on the technical limits. That is, the
response
surfaces 214 of the user tool 212 may be applied to various phases of the
well's
development because the user may adjust a wide range of input parameters for a
given well without the time and expense of engineering models or the errors
associated with limiting assumptions within simplified models. Accordingly,
the
user tool 212 may be utilized to provide well technical limits relating to
well
operability, as discussed in association with FIGS. 3-4, well producibility
limits, as
discussed in association with FIGs. 5-6. Further, the user tool 212 derived
well
operability limits and/or well producibility limits and/or coupled physics
limits, as
discussed in association with FIGs. 7-8, may be employed in the optimization
of
various technical limits or well operating parameters, as discussed in
association
with FIGs. 9-10.
[0037] As one
embodiment, the user tool 212 may be utilized to provide
response surfaces 214 that are directed to determining the well operability
limits.
The well operability limits relate to the mechanical integrity limits of a
well before
a mechanical failure event occurs. The mechanical failure may be an event that
renders the well unusable for its intended purpose. For example, the
mechanical
failure of the well 103 of FIG. 1 may result from compaction, erosion, sand
production, collapse, buckling, parting, shearing, bending, leaking, or other
similar mechanical problems during production or injection operations of a
well.
Typically, these mechanical failures result in costly workovers, sidetracking
of the
well or redrilling operations utilized to capture the hydrocarbon reserves in
the
subsurface formation 108 of FIG. 1. These post failure solutions are costly
and
time-consuming methods that reactively address the mechanical failure.
However, with the user tool 212, potential mechanical well failure issues may
be
CA 02613817 2013-12-31
- 13 -
identified during the different phases to not only prevent failures, but
operate the
well in an efficient manner within its technical limit.
[0038] FIG. 3 is an exemplary flow chart of the generation and use well
operability limits with the user tool 212 of FIG. 2 in accordance with aspects
of
the present techniques. This flow chart, which is referred to by reference
numeral 300, may be best understood by concurrently viewing FIGS. 1 and 2. In
this flow chart 300, response surfaces 214 may be developed and utilized to
provide completion limits and guidelines for the conception selection, well
planning, economic analysis, completion design, and/or well production phases
of the well 103. That is, the present technique may provide response surfaces
214 for various mechanical or integrity failure modes from detailed
simulations
performed and stored on an application, such as the user tool 212, in an
efficient
manner. Accordingly, the response surfaces 214, which are based on the
coupled-physics engineering model, provide other users with algorithms and
equations that may be utilized to solve mechanical well integrity problems
more
efficiently.
[0039] The flow chart begins at block 302. At block 304, the failure mode
is
established. The establishment of the failure mode, which is the mechanical
failure of the well, includes determining how a specific well is going to
fail. For
example, a failure mode may be sand production that results from shear failure
or tensile failure of the rock. This failure event may result in a loss of
production
for the well 103.
[0040] At block 306, an engineering model for a failure mode is constructed
to
model the interaction of the well construction components. These components
include pipe, fluid, rocks, cement, screens, and gravel under common producing
conditions, flowing bottom hole pressure (FBHP), drawdown, depletion, rate,
water-oil ratio (WOR), gas-oil ratio (GOR), or the like. The failure criteria
are
identified based on well characteristics, which may relate to a specific
failure
event for the well. As an example, with the failure mode being sand
production,
CA 02613817 2013-12-31
- 14 -
the engineering model may utilize the rock mechanical properties with a
numerical simulation model of the reservoir and well to predict when sand
production occurs under various production conditions, which may include
production rate, drawdown, and/or depletion. The engineering models are then
verified to establish that the engineering models are valid, as shown in block
308.
The verification of the engineering models may include comparing the results
of
the engineering models with actual data from the well 103, comparing the
results
of the response surface to the results of the engineering models, or comparing
the engineering models to other wells within the field to establish that the
simplifying assumptions are valid.
[0041]
Because the engineering models are generally detailed finite element
models that take a significant amount of time to evaluate, such as one or more
hours to multiple days, the engineering model is converted into one or more
algorithms or equations that are referred to as the response surfaces 214, as
shown in block 310. The conversion includes performing a parametric study on a
range of probable parameters with the engineering model to create the
different
response surfaces 214. The parametric study may utilize a numerical design of
experiments to provide the algorithms for various situations. Beneficially,
the
parametric study captures the various physical parameters and properties that
are not accounted for with analytical models that are typically utilized in
place of
numerical models. The results of the parametric study are reduced to simple
equations through fitting techniques or statistical software packages to form
the
response surfaces 214. These curve and surface fitting techniques define
generalized equations or algorithms, which may be based on engineering
judgement and/or analytical simplifications of the engineering models.
Specifically, a trial and error approach may be utilized to define a
reasonable
form of the response surfaces 214 that may be fit to the large number of
results
from the parametric study. Accordingly, the response surfaces 214 may be
further simplified by using various assumptions, such as homogeneous rock
CA 02613817 2013-12-31
- 15 -
properties in a reservoir zone, linear well paths through the production
intervals,
and/or disc-shaped reservoir, for example.
[0042] At block 312, the algorithms and equations that define the response
surfaces 214 are included in the user tool 212. As noted above, the user tool
212 may be utilized to provide graphical outputs of the technical limit for
users.
These graphical outputs may compare production or injection information, such
as rate and pressures. In this manner, the user, such as an operator or
engineer, may evaluate current production or injection rates versus the
technical
limit indicated from the response surfaces 214 to adjust the certain
parameters to
prevent well failure or improve the performance of the well 103. This
evaluation
may be performed in a simplified manner because the previously generated
response surfaces may be accessed instead of having to utilize the engineering
models to simulate the respective conditions for the well. As such, a user may
apply a quantitative risk analysis to the technical limit generated by the
response
surfaces 214 to account for the uncertainty of input parameters and manage the
associated risk. At block 314, the user tool 212 may be utilized to
efficiently
apply the previously generated response surfaces 214 to economic decisions,
well planning, well concept selection, and well operations phases.
Accordingly,
the process ends at block 316.
[0043] As a specific example, the well 103 may be a cased-hole completion
that includes various perforations 126. In this type of completion, changes in
the
pore pressure at the sand face of the subsurface formation 108, which may be
based upon the reservoir drawdown and depletion, may increase the stress on
the perforations 126 in the rock of the production interval or zone 116. If
the
effective stresses on the rock in the production zone 116 exceed the shear
failure
envelope or rock failure criterion, then sand may be produced through the
perforations 126 into the wellbore 114. This production of sand into the
wellbore
114 may damage equipment, such as the tree 104 and valves 128 and 130, and
facilities, such as the production facility 102. Accordingly, the shear
failure of the
CA 02613817 2013-12-31
- 16 -
rock in the subsurface formation 108 or crossing the rock failure criterion in
the
engineering model may be identified as the failure mode, as discussed in block
304.
[0044] Once
the failure mode is identified, the engineering model may be
constructed to describe the mechanical well operability limits (WOL), as
discussed in block 306. The engineering model construction may include
defining finite element models to simulate well drainage from the production
zone
116 through perforations 126 into the wellbore 114. These three dimensional
(3-D) models may include parameters that represent the reservoir rock in the
production interval 116, cement lining 125, and production casing string 124.
For
instance, the perforations 126 in the production casing string 124 may be
modeled as cylindrical holes, and the perforations 126 in the cement lining
125
and reservoir rock may be modeled as truncated cones with a half-sphere at the
perforation tip.
[0045]
Further, properties and parameters may also be assigned to the
reservoir rock, cement lining 125, and production casing string 124. For
example, symmetry in the model is based on perforation phasing and shot
density. Also, boundary conditions are applied to represent reservoir pressure
conditions. Then, each model is evaluated at various levels of drawdown to
determine the point at which the rock at the perforations 126 exceeds the
shear
failure envelope or rock failure criterion. Drawdown is modeled as radial
Darcy
flow from the well drainage radius to the perforations 126. The well drainage
area is the area of the subsurface formation 108 that provides fluids to the
wellbore 114.
[0046] As an
example, one or more finite element models may be created by
varying the certain parameters. These parameters may include: (1) rock
properties rock unconfined compressive strength (USC), rock friction angle
(RFA); elastic or shear modulus, and/or rock Poisson's ratio (RPR), (2) casing
properties, such as pipe grades (e.g. L80, P110, T95, Q125); (3) cement
CA 02613817 2013-12-31
- 17 -
properties (unconfirmed compressive strength UCS), friction angle, elastic or
shear modulus, Poisson's ratio); (4) well drainage radius (WDR); (5)
perforation
geometry (PG) (perforations entrance diameter (PED), perforations length (PL),
and perforations taper angle (PTA); (6) casing size (casing outer diameter
(COD)
and casing diameter/thickness (D/T) ratio (CDTR); (7) cemented annulus size;
(8) perforation phasing; and (9) perforation shots per foot (PSPF). While each
of
these parameters may be utilized, it may be beneficial to simplify, eliminate,
or
combine parameters to facilitate the parametric study. This
reduction of
parameters may be based upon engineering expertise to combine experiments
or utilizing an experimental design approach or process to simply the
parametric
study. The automation scripts may be used to facilitate model construction,
simulation, and simulation data collection to further simplify the parametric
study.
For this example, casing properties, perforation phasing, and perforation
shots
per foot are determined to have a minimal impact and are removed from the
parametric study. Accordingly, the parametric study may be conducted on the
remaining parameters, which are included in the Table 1 below.
TABLE 1: WOL Parametric Study.
Model RC RFA RPR WDR PED PL PTA COD CDTR
1 1 1 1 1 1 1 1 1 1
2 1 2 1 3 2 1 3 2 2
3 3 2 2 3 1 1 1 3 1
4 2 3 2 2 1 3 1 3 2
[0047] In
this example, three values may be defined for each of the nine
parameters listed above. As a result, 19683 possible combinations or models
may have to be evaluated as part of the parametric study. Each of the models,
and may be evaluated at multiple values of drawdown to develop the individual
technical limit states for each model (e.g. drawdown versus depletion).
CA 02613817 2013-12-31
- 18 -
[0048] With
the engineering models created, the engineering models may be
verified and converted into response surfaces 214. The verification of the
engineering models, as discussed in block 308, may involve comparing the
individual engineering model results with actual field data to ensure that the
estimates are sufficiently accurate. The actual field data may include sand
production at a specific drawdown for the completion. Then, the engineering
models may be converted into the response surface, which is discussed above in
block 310. In particular, the results and respective parameters for the
different
engineering models may be compiled in a spreadsheet or statistical evaluation
software. The
effects of changing the nine parameters individually and
interactively are evaluated to develop the response surfaces 214 for the
engineering models. The resulting response surface equation or equations
provide a technical limit or well operability limit, as a function of
drawdown.
[0049] If the
user tool 212 is a computer program that includes a spreadsheet,
the response surfaces 214 and the associated parameters may be stored within
a separate file that is accessible by the program or combined with other
response
surfaces 214 and parameters in a large database. Regardless, the response
surfaces and parameters may be accessed by other users via a network, as
discussed above. For instance, the user tool 212 may accept user entries from
a
keyboard to describe the specific parameters in another well. The response
surfaces 214, which are embedded in the user tool 212, may calculate the well
operability limits from the various entries provided by the user. The entries
are
preferably in the range of values studied in the parametric study of the
engineering model.
[0050] As
result of this process, FIG. 4 illustrates an exemplary chart of the
drawdown verses the depletion of a well in accordance with the present
techniques. In FIG. 4, a chart, which is generally referred to as reference
numeral 400, compares the drawdown 402 of a well to the depletion 404 of the
well 103. In this example, the response surfaces 214 may define a technical
limit
CA 02613817 2013-12-31
- 19 -
406, which is well operability limit, generated from the user tool 212. As
shown in
the chart 400, the technical limit 406 may vary based on the relative values
of the
drawdown 402 and the depletion 404. The well 103 remains productive or in a
non-failure mode as long as the production or injection level 408 is below the
technical limit 406. If the production or injection level 408 is above the
technical
limit 406, then a shear failure of the rock in the subsurface formation 108 is
likely
to occur. That is, above the technical limit 406, the well 103 may become
inoperable or produce sand. Accordingly, the response surface may be utilized
to manage reservoir drawdown and depletion based on a technical limit
indicated
from the response surface.
[0051] Beneficially, under the present technique, the different
developmental
phases of the well 103 may be enhanced by utilizing the user tool 212 to
determine the well operability limits and to maintain the well 103 within
those
limits. That is, the user tool 212 provides users with previously generated
response surfaces 214 during each of the development phases of the well 103.
Because the response surfaces 214 have been evaluated versus parameters
and properties, the user tool 212 provides accurate information for the
mechanical integrity or well operability limits without the delays associated
with
complex models and errors present in simplistic models. Further, the user tool
212 may provide guidelines for operating the well 103 to prevent failure
events
and enhance production up to well operability limits.
[0052] As another benefit, the response surface may be utilized to generate
a
well injectibility limit. The well injectibility limit defines the technical
limit for an
injection well in terms of the well's ability to inject a specified rate of
fluids or
fluids and solids within a specific zone of a subsurface formation. An example
of
a failure mode that may be addressed by the injectibility limit is the
potential for
injection related fracture propagating out of the zone and thereby resulting
in loss
of conformance. Another example of failure mode that can be addressed is the
potential for shearing of well casing or tubulars during multi-well
interactions
CA 02613817 2013-12-31
- 20 -
resulting from injection operations in closed spaced well developments. The
well
injectibility limit response surface may also be utilized as a well inflow
performance model in a reservoir simulator to simulate injection wells or
within
standalone well or a well completions simulator to simulate well performance.
[0053]
Similarly, to the discussion of mechanical failures, impairments to the
flow capacity and characteristics of a well influence production or injection
rates
from the well. The impairments may be due to perforation geometry and/or high
velocity (i.e. non-Darcy) flow, near-wellbore rock damage, compaction-induced
perm loss, or other similar effects.
Because models that describe the
impairments are oversimplified, the well productivity or injectivity analysis
that is
provided by these models neglect certain parameters and provide inaccurate
results.
Consequently, errors in the prediction and/or assessment of well
productivity or injectivity from other models may adversely impact evaluation
of
field economics. For example, failure to accurately account for the effects of
completion geometry, producing conditions, geomechanical effects, and changes
in fluid composition may result in estimation errors for production rates.
During
the subsequent production phase, the estimate errors may result in
misinterpretations of well test data, which may lead to costly and potentially
ineffective workovers in attempts to stimulate production. In addition to the
errors
with simple models, complex models fail because these models are solely
directed to a particular situation. As a result, various wells are
insufficiently
evaluated or ignored because no tools exist to provide response surfaces for
these wells in a comprehensive, yet efficient manner.
[0054] Under
the present technique, the producibility or injectibility of the well
may be enhanced by utilizing the data, such as response surfaces in the user
tool. As discussed above, these response surfaces may be simplified
engineering models based on engineering computational models, such as 3D
geomechanical finite element model. This enables different users to access the
previously generated response surfaces for the analysis of different wells in
CA 02613817 2013-12-31
- 21 -
various phases, such as conception selection, well planning, economic
analysis,
completion design and/or well production phases. During well surveillance, for
example, impairment is often interpreted from measured "skin" values. Yet, the
skin values are not a valid indication of a well's actual performance relative
to its
technical limit. Accordingly, by converting the engineering models into
response
surfaces, as discussed above, other parameters may be utilized to provide the
user with graphs and data that are more valid indications of the technical
limit of
the well. This enhances the efficiency of the analysis for the user and may
even
be utilized in each phase of well development. The exemplary flow chart of
this
process for use in determining the well producibility limit is provided in
FIG. 5.
[0055] As shown in FIG. 5, an exemplary flow chart relating to the use of
well
producibility limits in the user tool 212 of FIG. 2 in accordance with aspects
of the
present techniques is shown. This flow chart, which is referred to by
reference
numeral 500, may be best understood by concurrently viewing FIGS. 1, 2 and 3.
In this embodiment, response surfaces associated with the flow capacity and
characteristics may be developed and utilized to provide technical limits and
guidelines for the concept selection, well planning, economic analysis,
completion design, and/or well production phases. That is, the user tool 212
may
provide response surfaces 214 for various well producibility limits based upon
detailed simulations previously performed for another well in an efficient
manner.
[0056] The flow chart begins at block 502. At block 504, the impairment
mode
is identified for the well 103. The identification of the impairment mode
includes
determining conditions that hinder the flow capacity of fluids to and within
the well
103 or injection capacity of fluids and/or solids from well 103 into the
formation
108. As noted above, impairments are physical mechanisms governing near-
wellbore flow or are a failure of the well 103 to flow or inject at its
theoretical
production or injection rate, respectively. For example, the impairment mode
may include perforations acting as flow chokes within the well 103.
CA 02613817 2013-12-31
- 22 -
[0057] At block 506, an engineering model for the impairment mode is
constructed to model the interaction of well characteristics. These
characteristics
include well and completion components, pipe, fluid, rocks, screens,
perforations,
and gravel under common producing conditions, flowing bottom hole pressure
(FBHP), drawdown, depletion, rate, water/oil ration (WOR), gas/oil ratio (GOR)
or
the like. As an example, with the impairment being perforations acting as a
flow
choke, the engineering model may utilize rock and fluid properties with a
numerical simulation model of the reservoir, well, and perforations to predict
the
amount of impairment under various production conditions, such as rate,
drawdown, and/or depletion. Then, the engineering models are verified, as
shown in block 508. The verification of the engineering models may be similar
to
the verification discussed in block 308.
[0058] Because the engineering models are generally detailed finite element
models, as discussed above in block 306, the engineering model is converted
into response surfaces 214 that include one or more algorithms or equations,
as
shown in block 510. Similar to the discussion above regarding block 310,
parametric studies are performed to provide the response surfaces from various
parameters and properties. Beneficially, the parametric studies capture
aspects
not accounted for with analytical models normally utilized to replace
numerical
models. Again, these results from the parametric studies are reduced to
numerical equations through fitting techniques or statistical software
packages to
form the response surfaces 214.
[0059] At block 512, the algorithms of the response surfaces 214 are
included
in a user tool 212. As noted above in block 312, the user tool 212 may be
utilized to provide graphical outputs of the technical limit for the well
producibility
limits to the users. In this manner, the user may evaluate current production
or
injection versus the technical limit to adjust the rate or determine the
impairments
of the well. At block 514, the response surfaces 214 may be utilized to
efficiently
apply previously generated response surfaces 214 to economic decisions, well
CA 02613817 2013-12-31
- 23 -
planning, well concept selection, and/or well production phases. Accordingly,
the
process ends at block 516.
[0060] As a specific example, the well 103 may be a cased-hole completion
that includes various perforations 126. In this type of completion, the flow
of fluids
into the wellbore 114 may be impaired because of the "choke" effect of the
perforations 126. If the impairment is severe enough, the well may fail to
achieve
target rates with the associated drawdown. In this sense, impairment may be
synonymous with failure. In such situations, the lower production rates may be
accepted, but these lower production rates adversely impact the field
economics.
Alternatively, the drawdown pressure of the well 103 may be increased to
restore
the well 103 to the target production rate. However, this approach may not be
feasible because of pressure limitations at the production facility 102,
drawdown
limits for well operability, and other associated limitations. Accordingly,
the
pressure drop into and through the perforations 126 of the well completion may
be identified as the impairment or failure mode for the well 103, as discussed
above in block 504.
[0061] Once the impairment mode is identified, the engineering model may be
constructed to describe the well producibility limit (WPL), as discussed in
block
506. The engineering model construction for well producibility limits may
include
defining engineering computational models, such as finite element models, to
simulate convergent flow into the wellbore through perforations 126 in the
well
103. Similar to the engineering model construction of the well operability
limits
discussed above, the engineering models may include the parameters that
represent the reservoir rock in the production interval 116, cement lining
125, and
production casing string 124.
[0062] Further, properties or parameters may again be assigned to the
reservoir rock, cement lining 125, and production casing string 124. For
example, each engineering model is evaluated at various levels of drawdown to
determine the drawdown at which the impairment exceeds a threshold that
CA 02613817 2013-12-31
- 24 -
prevents target production rates from being achieved. From this, multiple
finite
element models are created for a parametric study by varying the following
parameters: (1) rock permeability; (2) perforation phasing; (3) perforation
shot
density; (4) perforation length; (5) perforation diameter; (6) well drainage
radius;
and (7) wellbore diameter. This example may be simplified by removing the
drainage radius and wellbore diameter parameters, which are believed to have a
minimal impact on the results of the parametric study.
Accordingly, the
parametric study is conducted on the remaining parameters, which are included
in the Table 2 below.
TABLE 2: WPL Parametric Study.
Model Rock Perforation Shot Perforation Perforation
Number Permeability Phasing Density Length Diameter
1 1 1 1 1 1
2 1 2 1 3 2
3 3 2 2 3 1
4 2 3 2 2 1
[0063] In this example, if three values are defined for each of the five
parameters listed above, two hundred forty three possible combinations or
models may have to be evaluated. Each of the models is evaluated at multiple
values of drawdown to develop the individual limit states for each model (e.g.
production rate vs. drawdown).
Accordingly, for this example, the well
producibility limit (WPL) may be defined by the failure of the well completion
to
produce at a specified target rate.
[0064] With the engineering models created, the engineering models may be
verified and converted into response surfaces, as discussed in blocks 508 and
510 and the example above. Again, the response surfaces 214 are created from
fitting techniques that generalize the equations of the engineering models.
The
CA 02613817 2013-12-31
- 25 -
resulting equation or equations provides the limit state or well producibility
limit,
which may be stored in the user tool 212, as discussed above.
[0065] As result of this process, FIGS. 6A and 6B illustrate exemplary
charts
of the well producibility limit in accordance with the present techniques. In
FIG.
6A, a chart, which is generally referred to as reference numeral 600, compares
the measure of impairment 602 to the drawdown 604 of the well 103. In this
example, the response surfaces 214 may define a technical limit 606, which is
the well producibility limit, generated from the user tool 212. As shown in
the
chart 600, the technical limit 606 may vary based on the relative values of
the
impairment 602 and the drawdown 604. The well 103 remains productive or in
non-impairment mode as long as the measured impairment is below the technical
limit 606. If the measured impairment is above the technical limit 606, then
the
"choke" effect of the perforations 126 or other impairment modes may limit
production rates. That is, above the technical limit 606, the well 103 may
produce less than a target rate and remedial actions may be performed to
address the impairment.
[0066] In FIG. 6B, a chart, which is generally referred to as reference
numeral
608, compares the drawdown 610 with depletion 612 of the well 103. In this
example, the technical limit 606 may be set to various values for different
well
profiles 614, 616 and 618. A well profile may include the completion geometry,
reservoir and rock characteristics, fluid properties, and producing
conditions, for
example. As shown in the chart 608, the well profiles 614 may be perforations
packed with gravel, while the well profile 616 may be natural perforations
without
gravel. Also, the well profile 618 may include fracture stimulation. The well
profiles 614, 616 and 618 illustrate the specific "choke" effects of the
perforations
126 or other impairment modes based on different geometries, or other
characteristics of the well.
[0067] Beneficially, as noted above, users from any location may access the
user tool 212 to create the well producibility limit and determine the amount
of
CA 02613817 2013-12-31
- 26 -
impairment expected for particular parameters, such as the perforation design,
rock characteristics, fluid properties, and/or producing conditions of a well.
The
user tool 212 may be efficient mechanism because it accesses previously
determined response surfaces 214 and provides them during various phases or
stages of a well's development. For example, during the concept selection and
well planning phase, the user tool 212 may be utilized to review expected
performance rates of a variety of well completion designs. Similarly, during
the
design phase, the user tool 212 may enhance or optimize specific aspects of
the
well design. Finally, during the production phase, the user tool 212 may be
utilized to compare observed impairments with expected impairments to monitor
the performance of the well completion.
[0068] As a
third embodiment of the present techniques, the user tool 212 of
FIG. 2 may be utilized to predict, optimize, and evaluate the performance of
the
well 103 based on engineering models that are associated with physics
describing flow into or out of the well. As noted above, the well 103, which
may
operate in a production or injection mode, may be utilized to produce various
fluids, such as oil, gas, water, or steam. Generally, engineering modeling
techniques do not account for the complete set of first principle physics
governing fluid flows into or out of the wellbore and within a well
completion. As
a result, engineering models typically employ analytical solutions based on
highly
simplifying assumptions, such as the wide spread use of superposition
principles
and linearized constitutive models for describing physics governing well
performance. In particular, these simplifying assumptions may include single
phase fluid flow theories, application of simple superposition principles,
treating
the finite length of the well completion as a "point sink," single phase
pressure
diffusion theories in the analysis of well pressure transient data, and use of
a
single "scalar" parameter to capture the wellbore and near-well pressure drops
associated with flows in the wellbore, completion, and near-wellbore regions.
Also, as previously discussed, ihe engineering models may rely upon hog laws
CA 02613817 2013-12-31
- 27 -
and non-physical free parameters to attempt to cure the deficiencies arising
from
these simplifications. Finally, the simplified versions of the engineering
models
fail to assist in diagnosing the problems with a well because the diagnostic
data
obtained from the engineering models is often non-unique and does not serve
its
intended purpose of identifying the individual root cause problems that affect
well
performance. Thus, the engineering models fail to account for the coupling and
scaling of various physical phenomenons that concurrently affect well
performance.
[0069] To compound the problems with the simplified assumptions,
engineering models are generally based on a specific area of the well and
managed in a sequential manner. That is, engineering models are designed for
a specific aspect of the operation of a well, such as well design, well
performance
analysis, and reservoir simulators. By
focusing on a specific aspect, the
engineering models again do not consistently account for the various physical
phenomena that concurrently influence well performance. For
example,
completion engineers design the well, production engineers analyze the well,
and
reservoir engineers simulate well production within their respective isolated
frameworks. As a result, each of the engineering models for these different
groups consider the other areas as isolated events and limit the physical
interactions that govern the operations and flow of fluids into the well. The
sequential nature of the design, evaluation, and modeling of a well by the
individuals focused on a single aspect does not lend itself to a technique
that
integrates a physics based approach to solve the problem of well performance.
[0070]
Accordingly, under the present technique, coupled physics tool 218 of
FIG. 2 may be configured to provide a coupled physics limits for a well. The
coupled physics limits, which are technical limits, may be utilized in various
phases of the well, which are discussed above. This coupled physics limits may
include effects of various parameters or factors; such as reservoir rock
geology
and heterogeneity, rock flow and geomechanical properties, surface facility
CA 02613817 2013-12-31
- 28 -
constraints, well operating conditions, well completion type, coupled physical
phenomenon, phase segregation, rock compaction related permeability reduction
and deformation of wellbore tubulars, high-rate flow effects, scale
precipitation,
rock fracturing, sand production, and/or other similar problems. Because each
of
these factors influences the flow of fluids from the subsurface reservoir rock
into
and through the well completion for a producing well or through the well
completion into the subsurface formation for an injection well, the
integration of
the physics provides an enhanced well performance modeling tool, which is
discussed in greater detail in FIG. 7.
[0071] FIG. 7 is an exemplary flow chart of the development of a coupled
physics limit in accordance with aspects of the present techniques. In this
flow
chart, which is referred to by reference numeral 700, a coupled physics
technical
limit or coupled physics limit may be developed and utilized to quantify
expected
well performance in the planning stage, design and evaluate various well
completion types to achieve desired well performance during field development
stage, perform hypothetical studies and Quantitative Risk Analysis (QRA) to
quantify uncertainties in expected well performance, identify root issues for
under
performance of well in everyday field surveillance and/or optimize individual
well
operations. That is, the present technique may provide technical limit(s),
which
are a set of algorithms for various well performance limits based on
generalized
coupled physics models generated from detailed simulations performed for this
well or another. These simulations may be performed by an application, such as
the user tool 212 or coupled physics tool 218 of FIG. 2.
[0072] The flow chart begins at block 702. In blocks 704 and 706, the
various
parameters and first principle physical laws are identified for a specific
well. At
block 704, the physical phenomenon and first principle physical laws
influencing
well performance are identified. The first principle physical laws governing
well
performance include, but are not limited to, fluid mechanics principles that
govern
multi-phase fluid flow and pressure drops through reservoir rocks and well
CA 02613817 2013-12-31
- 29 -
completions, geomechanics principles that govern deformation of near-wellbore
rock and accompanying well tubular deformations and rock flow property
changes, thermal mechanics that are associated with the phenomenon of heat
conduction and convection within near-well reservoir rock and well completion,
and/or chemistry that governs the phenomenon behind non-native reservoir
fluids
(i.e. acids, steam, etc.) reacting with reservoir rock formations, formation
of
scales and precipitates, for example. Then, the parameters associated with the
well completion, reservoir geology (flow and geomechanical) and fluid
(reservoir
and non native reservoir) properties are also identified, as shown in block
706.
These parameters may include the various parameters, which are discussed
above.
[0073] With
the physical laws and parameters identified, the coupled physics
limit may be developed as shown in blocks 708-714. At block 708, a set of
coupled physics simulators may be selected for determining the well
performance. The coupled physics simulators may include engineering
simulation computer programs that simulate rock fluid flow, rock mechanical
deformations, reaction kinetics between non-native fluids and reservoir rock
and
fluids, rock fracturing, etc. Then,
well modeling simulations using the coupled
physics simulators may be conducted over a range of well operating conditions,
such as drawdown and depletion, well stimulation operations, and parameters
identified in block 706. The results from these simulations may be used to
characterize the performance of the well, as shown in block 710. At block 712,
a
coupled physics limit, which is based on the well modeling simulations, may be
developed as a function of the desired well operating conditions and the
parameters. The coupled physics limit is a technical limit that incorporates
the
complex and coupled physical phenomenon that affects performance of the well.
This coupled physical limit includes a combination of well operating
conditions for
maintaining a given level of production or injection rate for the well.
Accordingly,
the process ends at block 714.
CA 02613817 2013-12-31
- 30 -
[0074]
Beneficially, the coupled physics limit may be utilized to enhance the
performance of the well in an efficient manner. For instance, integrated well
modeling based on the coupled physics simulation provides reliable
predictions,
evaluations, and/or optimizations of well performance that are useful in
design,
evaluation, and characterization of the well. The coupled physics limits
provide
physics based technical limits that model the well for injection and/or
production.
For instance, the coupled physics limits are useful in designing well
completions,
stimulation operations, evaluating well performance based on pressure
transient
analysis or downhole temperature analysis, combined pressure and temperature
data analysis, and/or simulating wells inflow capacity in reservoir simulators
using inflow performance models. As a result, the use of coupled physics
limits
eliminates the errors generated from non-physical free parameters when
evaluating or simulating well performance.
Finally, the present technique
provides reliable coupled physics limits for evaluating well performance, or
developing a unique set of diagnostic data to identify root cause problems
affecting well performance.
[0075] As a
specific example, the well 103 may be a fracture gravel packed
well completion that is employed in deepwater GOM fields having reservoirs in
sandstone and characterized by weak shear strengths and high compressibility.
These rock geomechanical characteristics of the sandstone may cause reservoir
rock compaction and an accompanying loss in well flow capacities based on the
compaction related reduction in permeability of the sandstone. As such, the
physical phenomenon governing the fluid flow into the fracture gravel packed
well
completion may include rock compaction, non-Darcy flow conditions, pressure
drops in the near-well region associated with gravel sand in the perforations
and
fracture wings.
[0076]
Because each of these physical phenomena may occur simultaneously
in a coupled manner within the near-well region and the well completion, a
Finite
Element Analysis (FEA) based physical system simulator may be utilized to
CA 02613817 2013-12-31
- 31 -
simulate in a coupled manner the flow of fluids flowing through a compacting
porous medium into the fractured gravel packed well completion. The rock
compaction in this coupled FEA simulator may be modeled using common rock
constitutive behaviors, such as elastic, plastic (i.e., Mohr-Coulomb, Drucker-
Prager, Cap Plasticity. etc.) or a visco-elastic-plastic. To account for
pressure
drops associated with porous media flow resulting from high well flow rates,
the
pressure gradient is approximated by a non-Darcy pressure gradient versus the
flow rate relationship. As a
result, a FEA engineering model that is
representative of the wellbore (i.e. the casing, tubing, gravel filled
annulus,
casing and cement perforations), the near-wellbore regions (perforations and
fracture wings), and reservoir rock up to the drainage radius is developed.
This
FEA engineering model employing appropriate rock constitutive model and non-
Darcy flow model for pressure drops is used to solve the coupled equations
resulting from momentum balance and mass balance governing rock deformation
and flow through the porous media, respectively. The boundary conditions
employed in the model are the fixed flowing bottom hole pressure in the
wellbore
and the far-field pressure at the drainage radius. Together, these boundary
conditions may be varied to simulate a series of well drawdown and depletion.
[0077] The
parameters governing the performance of the well completion may
be identified. For example, these parameters may include: (1) well drawdown
(i.e. the difference between the far field pressure and flowing bottom hole
pressure); (2) well depletion (i.e. the reduction in the far field pressure
from
original reservoir pressure); (3) wellbore diameter; (4) screen diameter; (5)
fracture wing length; (6) fracture width; (7) perforation size in casing and
cement;
(8) perforation phasing; (9) gravel permeability; and/or (10) gravel non-Darcy
flow
coefficient. Some
of these parameters, such as rock constitutive model
parameters and rock flow properties, may be obtained from core testing.
[0078] In
this example, the parameters (3) through (7) may be fixed at a given
level within the FEA model. With these parameters fixed, the FEA model may be
CA 02613817 2013-12-31
- 32 -
utilized to conduct a series of steady-state simulations for changing levels
of
drawdown and depletion. The results of the coupled FEA model may be used to
compute well flow efficiency. In particular, if the FEA model is used to
predicted
flow stream for a given level of depletion and drawdown, the well flow
efficiency
may be defined as the ratio of coupled FEA model computed well flow rate to
the
ideal flow rate. In this instance, the ideal flow rate is defined as the flow
into a
fully-penetrating vertical well completed an openhole completion, which has
the
same wellbore diameter, drawdown, depletion, and rock properties as the fully
coupled FEA model. The rock flow property and permeability used is the ideal
flow rate calculation, which is the same as the fully coupled modeled because
the
rock compaction and non-Darcy flow effects are neglected. Accordingly, a
series
of well completion efficiencies are evaluated for varying level of drawdown
and
depletion and for a fixed set of parameters (3) through (7). Then, a
simplified
mathematical curve of well completion efficiencies may be generated for
varying
levels of drawdown and depletion for the coupled physics limit.
[0079] As
result of this process, FIG. 8 illustrates an exemplary chart of the
drawdown verses the depletion of a well in accordance with the present
techniques. In FIG. 8, a chart, which is generally referred to as reference
numeral 800, compares the drawdown 802 to the depletion 804 of the well 103.
In this example, the coupled physics limit may define a technical limit 806
generated from flow chart 700. As shown in the chart 800, the technical limit
806
may vary based on the relative values of the drawdown 802 to depletion 804.
The well 103 remains productive as long as the well drawdown and depletion are
constrained within the technical limit 806. The technical limit in this
example
represents the maximum pressure drawdown and depletion that a well may
sustain before the well tubulars experience mechanical integrity problems
causing well production failure when producing from a compacting reservoir
formation. Alternatively, the technical limit 806 also may represent the
maximum
level of well drawdown and depletion for a given level of flow impairment
caused
CA 02613817 2013-12-31
- 33 -
by reservoir rock compaction related reduction in rock permeability when
producing from a compacting reservoir formation. In another example scenario,
the coupled physics limit may represent the combined technical limit on well
performance for a given of flow impairment manifesting from the combined
coupled physics of high rate non-Darcy flow occurring in combination with rock
compaction induced permeability reduction.
[0080]
Regardless of the technical limits, which may include the coupled
physics limits, well operability limits, well producibility limits or other
technical
limits, the performance of the well may be optimized in view of the various
technical limits for various reasons. FIG. 9 is an exemplary flow chart of the
optimization of well operating conditions and/or well completion architecture
with
the user tool 212 of FIG. 2 or in accordance with the coupled physics limits
tool
203 of FIG. 2 in accordance with aspects of the present techniques. In this
flow
chart, which is referred to by reference numeral 900, one or more technical
limits
may be combined and utilized to develop optimized well operating conditions
over the life of a well or optimized well completion architecture to achieve
optimized inflow profile along a well completion by completing the well in
accordance with the well production technical limits. The well optimization
process may be conducted during the field development planning stage, well
design to evaluate various well completion types to achieve desired well
performance consistent with technical limits during field development stage,
identify root issues for under performance of well in everyday field
surveillance
and/or to perform hypothetical studies and Quantitative Risk Analysis (QRA) to
quantify uncertainties in expected well performance. That is, the present
technique may provide optimized well operating conditions over the life of the
well or optimized well architecture (i.e., completion hardware) to be employed
in
well completion, which are based on various failure modes associated with one
or more technical limits. Again, this optimization process may be performed by
a
CA 02613817 2013-12-31
- 34 -
user interacting with an application, such as the user tool 212 of FIG. 2, to
optimize integrated well performance.
[0081] The
flow chart begins at block 901. At blocks 902 and 904, the failure
modes are identified and the technical limits are obtained. The failure modes
and technical limits may include the failure modes discussed above along with
the associated technical limits generated for those failure modes. In
particular,
the technical limits may include the coupled physics limit, well operability
limit,
and well producibility limit, as discussed above. At block 906, an objective
function may be formulated. The objective function is a mathematical
abstraction
of a target goal that is to be optimized. For example, the objective function
may
include optimizing production for a well to develop a production path over the
life-
cycle of the well that is consistent with the technical limits. Alternatively,
the
objective function may include optimize of the inflow profile into the well
completion based upon various technical limits that govern production from the
formation along the length of the completion. At block 908, an optimization
solver may be utilized to solve the optimization problem defined by the
objective
function along with the optimization constraints as defined by the various
technical limits to provide an optimized solution or well performance. The
specific situations may include a comparison of the well operability limit and
well
producibility limit or even the coupled physics limit, which includes multiple
failure
modes. For example, rock compaction related permeability loss, which leads to
productivity impairment, may occur rapidly if pore collapse of the reservoir
rock
occurs. While, enhancing production rate is beneficial, flowing the well at
rates
that cause pore collapse may permanently damage the well and limit future
production rates and recoveries. Accordingly, additional drawdown may be
utilized to maintain production rate, which may be limited by the well
operability
limit that defines the mechanical failure limit for the well. Thus, the
optimized
solution may be the well drawdown and depletion over a well's life-cycle that
simultaneously reduces well producibility risks due to flow impairment effects
as
CA 02613817 2013-12-31
- 35 -
a result of compaction related permeability loss and the well operability
risks due
to rock compaction, while maximizing initial rates and total recovery from the
well. The previous discussion may also be applied to injection operating when
injecting fluids and/or solids into a formation. In another optimization
example,
technical limits may be developed for inflow along the length of the
completion
from the various rock formations as intersected by the well completion. An
objective function may be formulated to optimize the inflow profile for a
given of
amount of total production or injection rate for the well. Also, an
optimization
solver may be utilized to solve the optimization problem defined by this
objective
function along with the optimization constraints as defined by the various
technical limits. This optimization solver may provide an optimized solution
that
is the optimized inflow profile consistent with desired well performance
technical
limits and target well production or injection rates.
[0082] Based on the solutions from the optimization solver, a field
surveillance
plan may be developed for the field, as shown in block 910 and discussed
further
below. The field surveillance plan may follow the optimization solution and
technical limit constraints to provide the hydrocarbons in an efficient and
enhanced manner. Alternatively, well completion architecture, i.e., completion
type, hardware, and inflow control devices, may be designed and installed
within
well to manage well inflow in accordance with technical limits governing
inflow
from various formations into the well. Then, at block 912, the well may be
utilized
to produce hydrocarbons or inject fluids and/or solids in a manner that
follows the
surveillance plan to maintain operation within the technical limits.
Accordingly,
the process ends at block 914.
[0083] Beneficially, by optimizing the well performance, lost opportunities
in
the production of hydrocarbons or injection of fluids and/or solids may be
reduced. Also, the operation of the well may be adjusted to prevent
undesirable
events and enhance the economics of a well over its life cycle. Further,
present
approach provides a technical basis for every day well operations, as opposed
to
CA 02613817 2013-12-31
- 36 -
the use to hog-laws, or other empirical rules that are based on faulty
assumptions.
[0084] As a specific example, the well 103 may be a cased-hole completion,
which is a continuation of the example discussed above with reference to the
processes of FIGS. 3 and 5. As previously discussed, the well operability
limits
and well producibility limits may be obtained from the processes discussed in
FIGs. 3-6B or a coupled physics limit may be obtained as discussed in FIGs. 7-
8.
Regardless of the source, the technical limits are accessed for use in
defining the
optimization constraints. Further, any desired Objective Function from
well/field
economics perspective may be employed. The objective function may include
maximizing the well production rate, or optimize well inflow profile, etc.
Accordingly, to optimize the well production rate, the well operability limit
and well
producibility limit may be simultaneously employed as constraints to develop
optimal well drawdown and depletion history over the well's life cycle. Well
=
operating conditions developed in this manner may systematically manage the
risk of well mechanical integrity failures, while reducing the potential
impact of
various flow impairment modes on well flow capacity. Alternatively, to
optimize
the inflow profile into the well completion, the well operability limit and
well
producibility limit for each formation layer as intersected by the well
completion
may be simultaneously employed as constraints to develop the optimal inflow
profile along the length of the completion over a well's life cycle. This
optimal
inflow profile is used to develop well completion architecture, i.e., well
completion
type, hardware, and inflow control devices that enable production or injection
using the optimized flow conditions.
[0085] With the optimized solution to the objective function and the
technical
limits, a field surveillance plan is developed. The field surveillance may
include
monitoring of data such as measured surface pressures or the downhole flowing
bottom hole pressures, estimates of static shut-in bottom hole pressures, or
any
other surface or downhole physical data measurements, such as temperature,
CA 02613817 2013-12-31
- 37 -
pressures, individual fluid phase rates, flow rates, etc. These measurements
may be obtained from surface or bottom hole pressure gauges, distributed
temperature fiber optic cables, single point temperature gauges, flow meters,
and/or any other real time surface or downhole physical data measurement
device that may be utilized to determine the drawdown, depletion, and
production
rates from each formation layers in the well. Accordingly, the field
surveillance
plan may include instruments, such as, but not limited to, bottom hole
pressure
gauges, which are installed permanently downhole or run over a wireline. Also,
fiber-optic temperature measurements and other devices may be distributed over
the length of the well completion to transmit the real time data measurements
to
a central computing server for use by engineer to adjust well production
operating conditions as per the field surveillance plan. That
is, the field
surveillance plan may indicate that field engineers or personnel should review
well drawdown and depletion or other well producing conditions on a daily
basis
against a set target level to maintain the optimized well's performance.
[0086] FIGs. 10A-100 illustrate exemplary charts associated with the
optimization of the well of FIG. 1 in accordance with the present techniques.
In
particular, Fig. 10A compares the well operability limit with the well
producibility
limit of a well for well drawdown 1002 versus well depletion 1004 in
accordance
with the present techniques. In FIG. 10A, a chart, which is generally referred
to
as reference numeral 1000, compares well operability limit 1006, as discussed
in
FIG. 4, with the well producibility limit 1007 of FIG. 6A. In this example, a
non-
optimized or typical production path 1008 and an optimized integrated well
performance production path 1009 are provided. The non-optimized production
path 1008 may enhance the day-to-day production based on a single limit state,
such as the well operability limit, while the IWP production path 1009 may be
an
optimized production path that is based on the solution to the optimization
problem using the objective function and the technical limits discussed above.
The immediate benefits of the integrated well performance production path 1009
CA 02613817 2013-12-31
- 38 -
over the non-optimized production path 1008 are not immediately evident by
looking at the drawdown versus the depletion alone.
[0087] In FIG. 10B, a chart, which is generally referred to as reference
numeral 1010, compares the production rate 1012 with time 1014 for the
production paths. In this example, the non-optimized production path 1016,
which is associated with the production path 1008, and the IWP production path
1018, which is associated with the production path 1009, are represented by
the
production rate of the well over a period of operation for each production
path.
With the non-optimized production path 1016, the production rate is initially
higher, but drops below the IWP production path 1018 over time. As a result,
the
IWP production path 1018 presents a longer plateau time and is economically
advantageous.
[0088] In FIG. 100, a chart, which is generally referred to as reference
numeral 1020, compares the total bbl (barrels) 1022 with time 1024 for the
production paths. In this example, the non-optimized production path 1026,
which is associated with the production path 1008, and the IWP production path
1028, which is associated with the production path 1009, are represented by
the
total bbl from the well over a period of operation for each production path.
With
the non-optimized production path 1026, the total bbl is again initially
higher than
the IWP production path 1028, but the IWP production path 1028 produces more
than the non-optimized production path 1026 over the time period. As a result,
more hydrocarbons, such as oil, are produced over the same time interval as
the
non-optimized production path 1026, which results in the capture of more of
the
reserve for the IWP production path.
[0089] Alternatively, the optimization may use the coupled physics limit
along
with the objective function to optimize the well performance. For example,
because economics of most of the deepwater well completions are sensitive to
the initial plateau well production rates and length of the plateau time, the
objective function may be maximizing the well production rate. Accordingly, a
CA 02613817 2013-12-31
- 39 -
standard reservoir simulator may be used to develop a single well simulation
model for the subject well whose performance is to be optimized (i.e.,
maximize
the well production rate). The reservoir simulation model may rely on
volumetric
grid/cell discretization methods, which are based on the geologic model of the
reservoir accessed by the well. The volumetric grid/cell discretization
methods
may be Finite Difference, Finite Volume, Finite Element based methods, or any
other numerical method used for solving partial difference equations. The
reservoir simulation model is used to predict the well production rate versus
time
for a given set of well operating conditions, such as drawdown and depletion.
At
a given level of drawdown and depletion, the well performance in the
simulation
model is constrained by the coupled physics limit developed in coupled physics
process 700. Additional constraints on well performance, such as upper limit
on
the gas-oil-ratios (GOR), water-oil-rations (WOR), and the like, may also be
employed as constraints in predicting and optimizing well performance. An
optimization solver may be employed to solve the above optimization problem
for
computing the time history of well drawdown and depletion that maximizes the
plateau well production rate. Then, a field surveillance plan may be developed
and utilized, as discussed above.
[0090] While
the present techniques of the invention may be susceptible to
various modifications and alternative forms, the exemplary embodiments
discussed above have been shown by way of example. However, it should again
be understood that the invention is not intended to be limited to the
particular
embodiments disclosed herein. Indeed, the present techniques of the invention
are to cover all modifications, equivalents, and alternatives falling within
the
scope of the invention as defined by the following appended claims.