Note: Descriptions are shown in the official language in which they were submitted.
CA 02626116 2011-02-02
1
SYSTEMS AND METHOD FOR ENDOSCOPIC ANGLE-RESOLVED
LOW COHERENCE INTERFEROMETRY
Field of the Invention
[0003] Fourier domain angle-resolved low coherence interferometry (faLCI)
system
and method that enables data acquisition of angle-resolved and depth-resolved
spectra
information of a sample, in which depth and size information about the sample
can be
obtained with a single scan at rapid rates for in vivo applications in
particular.
Background of the Invention
[0004] Examining the structural features of cells is essential for many
clinical and
laboratory studies. The most common tool used in the examination for the study
of cells
has been the microscope. Although microscope examination has led to great
advances in
understanding cells and their structure, it is inherently limited by the
artifacts of
preparation. The characteristics of the cells can only been seen at one moment
in time
with their structure features altered because of the addition of chemicals.
Further,
invasion is necessary to obtain the cell sample for examination.
[0005] Thus, light scattering spectrography (LSS) was developed to allow for
in vivo
examination applications, including cells. The LSS technique examines
variations in the
elastic scattering properties of cell organelles to infer their sizes and
other dimensional
information. In order to measure cellular features in tissues and other
cellular structures,
CA 02626116 2008-04-10
WO 2007/044821 PCT/US2006/039771
2
it is necessary to distinguish the singly scattered light from diffuse light,
which has been
multiply scattered and no longer carries easily accessible infonnation about
the scattering
objects. This distinction or differentiation can be accomplished in several
ways, such as
the application of a polarization grating, by restricting or limiting studies
and analysis to
weakly scattering samples, or by using modeling to remove the diffuse
component(s).
[0006] As an alternative approach for selectively detecting singly scattered
light from
sub-surface sites, low-coherence interferometry (LCI) has also been explored
as a method
of LSS. LCI utilizes a light source with low temporal coherence, such as
broadband
white light source for example. Interference is only achieved when the path
length delays
of the interferometer are matched with the coherence time of the light source.
The axial
resolution of the system is determined by the coherent length of the light
source and is
typically in the micrometer range suitable for the examination of tissue
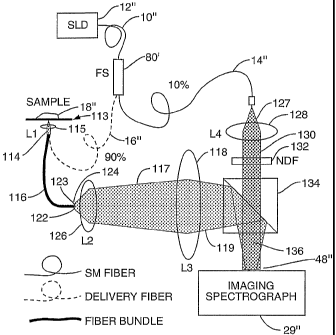
samples.
Experimental results have shown that using a broadband light source and its
second
harmonic allows the recovery of information about elastic scattering using
LCI. LCI has
used time depth scans by moving the sample with respect to a reference arm
directing the
light source onto the sample to receive scattering information from a
particular point on
the sample. Thus, scan times were on the order of 5-30 minutes in order to
completely
scan the sample.
[0007] Angle-resolved LCI (a/LCI) has been developed as a means to obtain sub-
surface structural information regarding the size of a cell. Light is split
into a reference
and sample beam, wherein the sample beam is projected onto the sample at
different
angles to examine the angular distribution of scattered light. The a/LCI
technique
combines the ability of (LCI) to detect singly scattered light from sub-
surface sites with
the capability of light scattering methods to obtain structural information
with sub-
wavelength precision and accuracy to construct depth-resolved tomographic
images.
Structural information is determined by examining the angular distribution of
the back-
scattered light using a single broadband light source is mixed with a
reference field with
an angle of propagation. The size distribution of the cell is determined by
comparing the
osciallary part of the measured angular distributions to predictions of Mie
theory. Such a
system is described in Cellular Organization and Substructure Measured Using
Angle-
CA 02626116 2011-02-02
3
Resolved Low-Coherence Inteferometry, Biophysical Journal, 82, April 2002,
2256-2265.
[0008] The aJLCI technique has been successfully applied to measuring cellular
morphology and to diagnosing intraepithelial neoplasia in an animal model of
carcinogenesis. The inventors of the present application described such a
system in
Determining nuclear morphology-using an improved angle-resolved low coherence
interferometry system in Optics Express, 2003, 11(25): p. 3473-3484
The a/LCI method of obtaining structural information about a sample has been
successfully applied to measuring cellular morphology in tissues and in vitro
as well as
diagnosing intraepithelial neoplasia and assessing the efficacy of
chemopreventive agents
in an animal model of carcinogenesis. a/LCI has been used to prospectively
grade tissue
samples without tissue processing, demonstrating the potential of the
technique as a
biomedical diagnostic.
[0009] Initial prototype and second generation a/LCI systems required 30 and 5
minutes respectively to obtain similar data. These earlier systems relied on
time domain
depth scans just as provided in previous LCI based systems. The length of the
reference
arm of the interferometer had to be mechanically adjusted to achieve serial
scanning of
the detected scattering angle. The method of obtaining angular specificity was
achieved
by causing the reference beam of the interferometry scheme to cross the
detector plane at
a variable angle. This general method for obtaining angle-resolved, depth-
resolved
backscattering distributions was disclosed in U.S. Patent No. 6,847,456
entitled
"Methods and systems using field-based light scattering spectroscopy
[0010] Other LCI prior systems are disclosed in U.S. Patent Nos. 6,002,480
and 6,501,551. U.S. Patent No. 6,002,480 covers obtaining depth-resolved
spectroscopic distributions and discusses obtaining the size of scatterers by
observing changes in wavelength due to elastic scattering properties. U.S.
Patent
No. 6,501,551 covers endoscopic application of interferometric imaging and
does
anticipate the use of Fourier domain concepts to obtain depth resolution. U.S.
Patent No. 6,501,551 does not discuss measurement of angularly resolved
scattering distributions, the use of scattered light to determine scatterer
size by
CA 02626116 2008-04-10
WO 2007/044821 PCT/US2006/039771
4
analysis of elastic scattering properties, nor the use of an imaging
spectrometer to record
data in parallel, whether that data is scattering or imaging data. Finally, U.
S. Patent No.
7,061,622 discusses fiber optic means for measuring angular scattering
distributions, but
does not discuss the Fourier domain concept. Also because it describes an
imaging
technique, the embodiments all include focusing optics which limit the region
probed.
Summary of the Invention
[0011] The present invention involves a new aaLCI technique called Fourier
domain
aJLCI (faLCI), which enables data acquisition at rapid rates using a single
scan, sufficient
to make in vivo applications feasible. The present invention obtains angle-
resolved and
depth-resolved spectra information about a sample, in which depth and size
information
about the sample can be obtained with a single scan, and wherein the reference
arm can
remain fixed with respect to the sample due to only one scan required. A
reference signal
and a reflected sample signal are cross-correlated and dispersed at a
multitude of
reflected angles off of the sample, thereby representing reflections from a
multitude of
points on the sample at the same time in parallel.
[0012] Since this angle-resolved, cross-correlated signal is spectrally
dispersed, the
new data acquisition scheme is significant as it permits data to be obtained
in less than
one second, a threshold determined to be necessary for acquiring data from in
vivo
tissues. Information about all depths of the sample at each of the multitude
of different
points on the sample can be obtained with one scan on the order of
approximately 40
milliseconds. From the spatial, cross-correlated reference signal, structural
(size)
information can also be obtained using techniques that allow size information
of
scatterers to be obtained from angle-resolved data.
[0013] The faLCI technique of the present invention uses the Fourier domain
concept
to acquire depth resolved information, Signal-to-noise and commensurate
reductions in
data acquisition time are possible by recording the depth scan in the Fourier
(or spectral)
domain. The faLCI system combines the Fourier domain concept with the use of
an
imaging spectrograph to spectrally record the angular distribution in
parallel. Thereafter,
the depth-resolution of the present invention is achieved by Fourier
transforming the
spectrum of two mixed fields with the angle-resolved measurements obtained by
locating
CA 02626116 2008-04-10
WO 2007/044821 PCT/US2006/039771
the entrance slit of the imaging spectrograph in a Fourier transform plane to
the sample.
This converts the spectral information into depth-resolved information and the
angular
information into a transverse spatial distribution. The capabilities of faLCI
have been
initially demonstrated by extracting the size of polystyrene beads in a depth-
resolved
measurement.
[0014] Various mathematical techniques and methods are provided for
determining
size information of the sample using the angle-resolved, cross-correlated
signal.
[0015] The present invention is not limited to any particular arrangement. In
one
embodiment, the apparatus is based on a modified Mach-Zehnder interferometer,
wherein
broadband light from a superluminescent diode is split into a reference beam
and an input
beam to the sample by a beamsplitter. In another embodiment, a unique optical
fiber
probe can be used to deliver light and collect the angular distribution of
scattered light
from the sample of interest.
[0016] The a/LCI method can be a clinically viable method for assessing tissue
health
without the need for tissue extraction via biopsy or subsequent
histopathological
evaluation. The aaLCI system can be applied for a number of purposes: early
detection
and screening for dysplastic epithelial tissues, disease staging, monitoring
of therapeutic
action and guiding the clinician to biopsy sites. The non-invasive, non-
ionizing nature of
the optical a./LCI probe means that it can be applied frequently without
adverse affect.
The potential of aaLCI to provide rapid results will greatly enhance its
widespread
applicability for disease screening.
Brief Description of the Drawing Figures
[0017] The accompanying drawing figures incorporated in and forming a part of
this
specification illustrate several aspects of the invention, and together with
the description
serve to explain the principles of the invention.
[0018] Figure 1A is a schematic of one exemplary embodiment of the faLCI
system
employing Mach-Zehnder interferometer;
[0019] Figure 1B is an illustration showing the relationship of the detected
scattering
angle to slit of spectrograph in the interferometer arrangement of Figure 1A;
CA 02626116 2008-04-10
WO 2007/044821 PCT/US2006/039771
6
[0020] Figure 2 is a flowchart illustrating the steps performed by the
interferometer
apparatus to recover depth-resolved spatial cross-correlated information about
the sample
for analysis;
[0021] Figures 3A-D illustrate examples of faLCI data recovered in the
spectral
domain for an exemplary sample of polystyrene beads, comprising the total
acquired
signal (Figure 3A), the reference field intensity (Figure 3B), the signal
field intensity
(Figure 3C), and the extracted, cross-correlated signal between the reference
and signal
field intensities (Figure 3D);
[0022] Figure 4A is an illustration of the axial spatial cross-correlated
function
performed on the cross-correlated faLCI data illustrated in Figure 3D as a
function of
depth and angle;
[0023] Figure 4B is an illustration of an angular distribution plot of raw and
filtered
data regarding scattered sample signal intensity as a function of angle in
order to recover
size information about the sample;
[0024] Figure 5A is an illustration of the filtered angular distribution of
the scattered
sample signal intensity compared to the best fit Mie theory to determine size
information
about the sample;
[0025] Figure 5B is a Chi-squired minimization of size information about the
sample
to estimate the diameter of cells in the sample;
[0026] Figure 6 is a schematic of exemplary embodiment of the faLCI system
employing an optical fiber probe;
[0027] Figure 7A is a cutaway view of an a/LCI fiber-optic probe tip that may
be
employed by the faLCI system illustrated in Figure 6;
[0028] Figure 7B illustrates the location of the fiber probe in the faLCI
system
illustrated in Figure 7A;
[0029] Figure 8A is an illustration of an alternative fiber-optic faLCI system
that may
be employed with the present invention;
[0030] Figure 8B is an illustration of sample illumination and scattered light
collection with distal end of probe in the faLCI system illustrated in Figure
8B; and
[0031] Figure 8C is an illustration of an image of the illuminated distal end
of probe
of the faLCI system illustrated in Figure 8A.
CA 02626116 2008-04-10
WO 2007/044821 PCT/US2006/039771
7
Detailed Description of the Preferred Embodiments
[0032] The embodiments set forth below represent the necessary information to
enable those skilled in the art to practice the invention and illustrate the
best mode of
practicing the invention. Upon reading the following description in light of
the
accompanying drawing figures, those skilled in the art will understand the
concepts of the
invention and will recognize applications of these concepts not particularly
addressed
herein. It should be understood that these concepts and applications fall
within the scope
of the disclosure and the accompanying claims.
[0033] The present invention involves a new aaLCI technique called Fourier
domain
aaLCI (faLCI), which enables data acquisition at rapid rates using a single
scan, sufficient
to make in vivo applications feasible. The present invention obtains angle-
resolved and
depth-resolved spectra information about a sample, in which depth and size
information
about the sample can be obtained with a single scan, and wherein the reference
arm can
remain fixed with respect to the sample due to only one scan required. A
reference signal
and a reflected sample signal are cross-correlated and dispersed at a
multitude of
reflected angles off of the sample, thereby representing reflections from a
multitude of
points on the sample at the same time in parallel.
[0034] Since this angle-resolved, cross-correlated signal is spectrally
dispersed, the
new data acquisition scheme is significant as it permits data to be obtained
in less than
one second, a threshold determined to be necessary for acquiring data from in
vivo
tissues. Information about all depths of the sample at each of the multitude
of different
points on the sample can be obtained with one scan on the order of
approximately 40
milliseconds. From the spatial, cross-correlated reference signal, structural
(size)
information can also be obtained using techniques that allow size information
of
scatterers to be obtained from angle-resolved data.
[0035] The faLCI technique of the present invention uses the Fourier domain
concept
to acquire depth resolved information. Signal-to-noise and commensurate
reductions in
data acquisition time are possible by recording the depth scan in the Fourier
(or spectral)
domain. The faLCI system combines the Fourier domain concept with the use of
an
imaging spectrograph to spectrally record the angular distribution in
parallel. Thereafter,
the depth-resolution of the present invention is achieved by Fourier
transforming the
CA 02626116 2008-04-10
WO 2007/044821 PCT/US2006/039771
8
spectrum of two mixed fields with the angle-resolved measurements obtained by
locating
the entrance slit of the imaging spectrograph in a Fourier transform plane to
the sample.
This converts the spectral information into depth-resolved information and the
angular
information into a transverse spatial distribution. The capabilities of faLCI
have been
initially demonstrated by extracting the size of polystyrene beads in a depth-
resolved
measurement.
[0036] The key advances of the present invention can be broken down into three
components: (1) new rapid data acquisition methods, (2) fiber probe designs,
and (3) data
analysis schemes. Thus, the present invention is described in this matter for
convenience
in its understanding.
[0037] An exemplary apparatus, as well as the steps involved in the process of
obtaining angle and depth-resolved distribution data scattered from a sample,
are also set
forth in Figure 2. The faLCI scheme in accordance with one embodiment of the
present
invention is based on a modified Mach-Zehnder interferometer as illustrated in
Figure
IA. Broadband light 10 from a superluminescent diode (SLD) 12 is directed by a
mirror
13 (step 60 in Figure 2) and split into a reference beam 14 and an input beam
16 to a
sample 18 by beamsplitter BS 1 20 (step 62 in Figure 3). The output power of
the SLD 12
may be 3 milliWatts, having a specification of ?,o=850 rim, A? =20 nm FWHM for
example, providing sufficiently low coherence length to isolate scattering
from a cell
layer within tissue. The path length of the reference beam 14 is set by
adjusting
retroreflector RR 22, but remains fixed during measurement. The reference beam
14 is
expanded using lenses Ll (24) and L2 (26) to create illumination (step 64 in
Figure 2),
which is uniform and collimated upon reaching a spectrograph slit 48 in an
imaging
spectrograph 29. For example, Ll may have a focal length of 1.5 centimeters,
and L2 26
may have focal length of 15 centimeters.
[0038] Lenses L3 (31) and L4 (38) are arranged to produce a collimated pencil
beam
30 incident on the sample 18 (step 66 in Figure 2). By displacing lens L4 (38)
vertically
relative to lens L3 (31), the input beam 30 is made to strike the sample at an
angle of 0.10
radians relative to the optical axis. This arrangement allows the full angular
aperture of
lens L4 (38) to be used to collect scattered light 40 from the sample 18. Lens
L4 (38)
may have a focal length of 3.5 centimeters.
CA 02626116 2008-04-10
WO 2007/044821 PCT/US2006/039771
9
[0039] The light 40 scattered by the sample 18 is collected by lens L4 (32)
and
relayed by a 4f imaging system comprised of lenses L5 (43) and L6 (44) such
that the
Fourier plane of lens L4 (32) is reproduced in phase and amplitude at the
spectrograph
slit 48 (step 68 in Figure 2). The scattered light 40 is mixed with the
reference field 14 at
a second beamsplitter BS2 42 with the combined fields 46 falling upon the
entrance slit
(illustrated in Figure lB as element 48) to the imaging spectrograph 29 (step
70 in Figure
2). The imaging spectrograph 29 may be the model SP2150i, manufactured by
Acton
Research for example. Figure lB illustrates the distribution of scattering
angle across the
dimension of the slit 48. The mixed fields are dispersed with a high
resolution grating
(e.g. 12001/mm) and detected using a cooled CCD 50 (e.g. 1340 X 400, 20 m X
20 m
pixels, Specl0:400, manufactured by Princeton Instruments) (step 72 in Figure
2).
[0040] The detected signal 46 is a function of vertical position on the
spectrograph
slit 48, y, and wavelength 2 once the light is dispersed by the spectrograph
29. The
detected signal at pixel (m, n) can be related to the signal 40 and reference
fields 16 (Es,
E,) as:
I(Am'YJ=(Er(AmIYyI 2)+{IEs(2m,.yn12) +2ReKEs(Am,y,,)Er(A.,y,,))Cos0 (1)
where 0 is the phase difference between the two fields 30, 16 and denotes an
ensemble average in time. The interference term is extracted by measuring the
intensity
of the signal 30 and reference beams 16 independently and subtracting them
from the
total intensity.
[0041] In order to obtain depth resolved information, the wavelength spectrum
at
each scattering angle is interpolated into a wavenumber (k = 2 i / X) spectrum
and
Fourier transformed to give a spatial cross correlation, rsR (z) for each
vertical pixel y,,:
FSR (z, y,,)= f dk e'er (Es (k, y,,)Er (k, yõ)) cos 0 (2)
The reference field 14 takes the form:
CA 02626116 2008-04-10
WO 2007/044821 PCT/US2006/039771
Er(k)=E,, exp[ ((k-k,)/4k)2]exp[ ((y-yo)/Ly)2]exp[ikdl] (3)
where ko (yo and Ak (Ay) represent the center and width of the Gaussian
wavevector
(spatial) distribution and Al is the selected path length difference. The
scattered field 40
takes the form
E,(k,0)_E.E.exp[ ((k-ko)/L\k)2]exp[iklJ]SJ(k,0) (4)
where Sj represents the amplitude distribution of the scattering originating
from thejth
interface, located at depth 1j. The angular distribution of the scattered
field 40 is
converted into a position distribution in the Fourier image plane of lens L4
through the
relationship y =f4 0. For the pixel size of the CCD 50 (e.g. 20 gm), this
yields an angular
resolution (e.g. 0.57 mrad) and an expected angular range (e.g. 228 mrad.).
[0042] Inserting Eqs. (3) and (4) into Eq. (2) and noting the uniformity of
the
reference field 14 (Ay >> slit height) yields the spatial cross correlation at
the nth vertical
position on the detector 29:
rsn(z,yj=Y, fdklEoI'exp[ 2((k-ko)/4k)2]exp[ik(z-Al+1j)] xSi (k,9õ=Yn/fa)cos
(5)
Evaluating this equation for a single interface yields:
rsn(z,Yõ)=IEol'exp[ ((z-Al+lj)tk)2/81j(ka,e Y,, /f4)cos0 (6)
[0043] Here we have assumed that the scattering amplitude S does not vary
appreciably over the bandwidth of the source light 12. This expression shows
that we
obtain a depth resolved profile of the scattering distribution 40 with each
vertical pixel
corresponding to a scattering angle.
[0044] Figure 3A below shows typical data representing the total detected
intensity
(Equation (1), above) of the sum of the reference field 16 and the field
scattered 40 by a
sample of polystyrene beads, in the frequency domain given as a function of
wavelength
CA 02626116 2011-02-02
11
and angle, given with respect to the backwards scattering direction. In an
exemplary
embodiment, this data was acquired in 40 milliseconds and records data over
186 mrad,
approximately 85% of the expected range, with some loss of signal at higher
angles.
[0045] Figures 3B and 3C illustrate the intensity of the reference and signal
fields 14,
30 respectively. Upon subtraction of the signal and reference fields 14, 30
from the total
detected intensity, the interference 46 between the two fields is realized as
illustrated in
Figure 3D. At each angle, interference data 46 are interpolated into k-space
and Fourier
transformed to give the angular depth resolved profiles of the sample 18 as
illustrated in
Figure 4A. The Fourier transform of the angle-resolved, cross correlated
signal 46,
which is the result of signal 40 scattered at a multitude of reflected angles
off the sample
18 and obtained in the Fourier plane of lens L4 (38), produces depth-resolved
information
about the sample 18 as a function of angle and depth. This provides depth-
resolved
information about the sample 18. Because the angle-resolved, cross-correlated
signal 46
is spectrally dispersed, the data acquisition permits data to be obtained in
less than one
second. Information about all depths of the sample 18 at each of the multitude
of
different points (i.e. angles) on the sample 18 can be obtained with one scan
on the order
of approximately 40 milliseconds. Normally, time domain based scanning is
required to
obtain information about all depths of a sample at a multitude of different
points, thus
requiring substantial time and movement of the reference arm with respect to
the sample.
[0046] In the experiments that produced the depth-resolved profile of the
sample 18
illustrated in Figure 4A, the sample 18 consists of polystyrene microspheres
(e.g. n=1.59,
10.1 pm mean diameter, 8.9% variance, NIST certified, Duke Scientific)
suspended in a
mixture of 80% water and 20% glycerol (n=1.36) to provide neutral buoyancy.
The
solution was-prepared to obtain a scattering length 1= 200 m. The sample is
contained
in a round well (8mm diameter, 1mm deep) behind a glass coverslip (thickness,
d - 170
m) (not shown). The sample beam 30 is incident on the sample 18 through the
coverslip. The round trip thickness through the coverslip (2 n d = 2 (1.5)
(170 m) =
0.53 mm - see Figure 4A) shows the depth resolved capability of the approach.
The data
are ensemble averaged by integrating over one mean free path (MFP). The
spatial
average can enable a reduction of speckle when using low-coherence light to
probe a
scattering sample. To simplify the fitting procedure, the scattering
distribution is low
CA 02626116 2008-04-10
WO 2007/044821 PCT/US2006/039771
12
pass filtered to produce a smoother curve, with the cutoff frequency chosen to
suppress
spatial correlations on length scales above 16 m.
[0047] In addition to obtaining depth-resolved information about the sample
18, the
scattering distribution data (i.e. a/LCI data) obtained from the sample 18
using the
disclosed data acquisition scheme can also be used to make a size
determination of the
nucleus using the Mie theory. A scattering distribution 74 of the sample 18 is
illustrated
in Figure 4B as a contour plot. The raw scattered information 74 about the
sample 18 is
shown as a function of the signal field 30 and angle. A filtered curve is
determined using
the scattered data 74. Comparison of the filtered scattering distribution
curve 76 (i.e. a
representation of the scattered data 74) to the prediction of Mie theory
(curve 78 in
Figure 5A) enables a size determination to be made.
[0048] In order to fit the scattered data 76 to Mie theory, the a/LCI signals
are
processed to extract the oscillatory component which is characteristic of the
nucleus size.
The smoothed data 76 are fit to a low-order polynomial (4th order was used for
example
herein, but later studies use a lower 2T'd order), which is then subtracted
from the
distribution 76 to remove the background trend. The resulting oscillatory
component is
then compared to a database of theoretical predictions obtained using Mie
theory 78 from
which the slowly varying features were similarly removed for analysis.
[0049] A direct comparison between the filtered a/LCI data 76 and Mie theory
data
78 may not possible, as the chi-squared fitting algorithm tends to match the
background
slope rather than the characteristic oscillations. The calculated theoretical
predictions
include a Gaussian distribution of sizes characterized by a mean diameter (d)
and
standard deviation (8D) as well as a distribution of wavelengths, to
accurately model the
broad bandwidth source.
[0050] The best fit (Figure 5A) is determined by minimizing the Chi-squared
between the data 76 and Mie theory (Figure 5B), yielding a size of 10.2 +/-
1.7 m, in
excellent agreement with the true size. The measurement error is larger than
the variance
of the bead size, most likely due to the limited range of angles recorded in
the
measurement.
[0051] As an alternative to processing the a/LCI data and comparing to Mie
theory,
there are several other approaches which could yield diagnostic information.
These
CA 02626116 2008-04-10
WO 2007/044821 PCT/US2006/039771
13
include analyzing the angular data using a Fourier transform to identify
periodic
oscillations characteristic of cell nuclei. The periodic oscillations can be
correlated with
nuclear size and thus will possess diagnostic value. Another approach to
analyzing aaLCI
data is to compare the data to a database of angular scattering distributions
generated with
finite element method (FEM) or T-Matrix calculations. Such calculations may
offer
superior analysis as there are not subject to the same limitations as Mie
theory. For
example, FEM or T-Matrix calculations can model non-spherical scatterers and
scatterers
with inclusions while Mie theory can only model homogenous spheres.
[0052] As an alternative embodiment, the present invention can also employ
optical
fibers to deliver and collect light from the sample of interest to use in the
aaLCI system
for endoscopic applications. This alternative embodiment is illustrated in
Figure 6.
[0053] The fiber optic aaLCI scheme for this alternative embodiment makes use
of
the Fourier transform properties of a lens. This property states that when an
object is
placed in the front focal plane of a lens, the image at the conjugate image
plane is the
Fourier transform of that object. The Fourier transform of a spatial
distribution (object or
image) is given by the distribution of spatial frequencies, which is the
representation of
the image's information content in terms of cycles per mm. In an optical image
of
elastically scattered light, the wavelength retains its fixed, original value
and the spatial
frequency representation is simply a scaled version of the angular
distribution of scattered
light.
[0054] In the fiber optic a/LCI scheme, the angular distribution is captured
by
locating the distal end of the fiber bundle in a conjugate Fourier transform
plane of the
sample using a collecting lens. This angular distribution is then conveyed to
the distal
end of the fiber bundle where it is imaged using a 4f system onto the entrance
slit of an
imaging spectrograph. A beamsplitter is used to overlap the scattered field
with a
reference field prior to entering the slit so that low coherence
interferometry can also be
used to obtain depth resolved measurements.
[0055] Turning now to Figure 6, the fiber optic faLCI scheme is shown. Light
12'
from a broadband light source 10' is split into a reference field 14' and a
signal field 16'
using a fiber splitter (FS) 80. A splitter ratio of 20:1 is chosen in one
embodiment to
CA 02626116 2008-04-10
WO 2007/044821 PCT/US2006/039771
14
direct more power to a sample 18' via the signal aim 82 as the light returned
by the tissue
is typically only a small fraction of the incident power.
[0056] Light in the reference fiber 14' emerges from fiber F1 and is
collimated by
lens L1 (84) which is mounted on a translation stage 86 to allow gross
alignment of the
reference arm path length. This path length is not scanned during operation
but may be
varied during alignment. A collimated beam 88 is arranged to be equal in
dimension to
the end 91 of fiber bundle F3 (90) so that the collimated beam 88 illuminates
all fibers in
F3 with equal intensity. The reference field 14' emerging from the distal tip
of F3 (90)
is collimated with lens L3 (92) in order to overlap with the scattered field
conveyed by
fiber F4 (94). In an alternative embodiment, light emerging from fiber Fl
(14') is
collimated then expanded using a lens system to produce a broad beam.
[0057] The scattered field is detected using a coherent fiber bundle. The
scattered
field is generated using light in the signal arm 82 which is directed toward
the sample 18'
of interest using lens L2 (98). As with the free space system, lens L2 (98) is
displaced
laterally from the center of single-mode fiber F2 such that a collimated beam
is produced
which is traveling at an angle relative to the optical axis The fact that the
incident beam
strikes the sample at an oblique angle is essential in separating the elastic
scattering
information from specular reflections. The light scattered by the sample 18'
is collected
by a fiber bundle consisting of an array of coherent single mode or multi-mode
fibers.
The distal tip of the fiber is maintained one focal length away from lens L2
(98) to image
the angular distribution of scattered light. In the embodiment shown in Figure
6, the
sample 18' is located in the front focal plane of lens L2 (98) using a
mechanical mount
100. In the endoscope compatible probe shown in Figure 7, the sample is
located in the
front focal plane of lens L2 (98) using a transparent sheath (element 102).
[0058] As illustrated in Figure 6 and also Figure 7B, scattered light 104
emerging
from a proximal end 105 of the fiber probe F4 (94) is recollimated by lens L4
(104) and
overlapped with the reference field 14' using beamsplitter BS (108). The two
combined
fields 110 are re-imaged onto the slit (element 48' in Figure 7) of the
imaging
spectrograph 29' using lens L5 (112). The focal length of lens L5 (112) may be
varied to
optimally fill the slit 48'. The resulting optical signal contains information
on each
CA 02626116 2011-02-02
scattering angle across the vertical dimension of the slit 48' as described
above for the
apparatus of Figures 1A and 1B.
[0059] It is expected that the above-described a/LCI fiber-optic probe will
collect the
angular distribution over a 0.45 radian range (approx. 30 degrees) and will
acquire the
complete depth resolved scattering distribution 110 in a fraction of a second.
[0060] There are several possible schemes for creating the fiber probe which
are the
same from an optical engineering point of view, One possible implementation
would be
a linear array of single mode fibers in both the signal and reference arms.
Alternatively,
the reference arm 96 could be composed of an individual single mode fiber with
the
signal arm 82 consisting of either a coherent fiber bundle or linear fiber
array.
[0061] The fiber probe tip can also have several implementations which are
substantially equivalent. These would include the use of a drum or ball lens
in place of
lens L2 (98). A side-viewing probe could be created using a combination of a
lens and a
minor or prism or through the use of a convex mirror to replace the lens-
mirror
combination. Finally, the entire probe can be made to rotate radially in order
to provide a
circumferential scan of the probed area.
[0062] Yet another data acquisition embodiment of the present invention could
be a
fa/LCI system is based on a modified Mach-Zehnder interferometer as
illustrated in
Figure 8A. The output 10" from a fiber-coupled superluminescent diode (SLD)
source
12" (e.g. Superlum, P. = 15 mW, ko = 841.5 am, Al = 49.5 nm, coherence length
= 6.3
p.m) is split into sample arm delivery fiber 16" and a reference arm delivery
fiber 14" by
a 90/10 fiber splitter FS (80') (e.g. manufactured by AC Photonics). The
sample arm
delivery fiber 16" can consist of either of the following for example: (1) a
single mode
fiber with polarization control integrated at the tip; or (2) a polarization
maintaining fiber.
A sample probe 113 is assembled by affixing the delivery fiber 16"(NA =_ 0.12)
along the
ferrule 114 at the distal end of a fiber bundle 116 such that the end face of
the delivery
fiber 16" is parallel to and flush with the face of the fiber bundle 116. Ball
lens Ll (115)
(e.g. f1= 2.2 mm) is positioned one focal length from the face of the probe
113 and
centered on the fiber bundle 116, offsetting the delivery fiber 16" from the
optical axis of
lens Ll (115). This configuration, which is also depicted in Figure 8B,
produces a
CA 02626116 2011-02-02
16
collimated beam 120 (e.g. P = 9 mW) with a diameter (e.g. 2 f, NA) of 0.5 mm
incident on
the sample 18" at an angle of 0.25 rad. for example.
[0063] The scattered light 122 from the sample is collected by lens L1 (115)
and, via
the Fourier transform property of the lens Ll (115, the angular distribution
of the
scattered field 122 is converted into a spatial distribution at the distal
face of the
multimode coherent fiber bundle 116 (e.g. Schott North America, Inc., length =
840 mm,
pixel size = 8.2 m, pixel count = 13.5K) which is located at the Fourier
image plane of
lens Ll (115). The relationship between vertical position on the fiber bundle,
y', and
scattering angle, 0 is given by y'= j,0 . As an illustration, the optical path
of light
scattered 122 at three selected scattering angles is shown in Figure 8B.
Overall, the
angular distribution is sampled by approximately 130 individual fibers for
example,
across a vertical strip of the fiber bundle 116", as depicted by the
highlighted area in
Figure 8C. The 0.2 mm, for example, thick ferrule (dl) separating the delivery
fiber 16"
and fiber bundle 116 limits the minimum theoretical collection angle (8min,th
= d, If, ) to
0.09 rad in this example. The maximum theoretical collection angle is
determined by d7
and d2, the diameter of the fiber bundle, by 0m,,,,,, = (d, + d, )/ f, to be
0.50 rad.
Experiments using a standard scattering sample 122 indicate the usable angular
range to
be em,, = 0.12 rad. to 0, = 0.45 rad. d1, , for example, can be minimized by
fabricating a
channel in the distal ferrule 123 and positioning the delivery fiber 16" in
the channel.
The fiber bundle 116 is spatially coherent, resulting in a reproduction of the
collected
angular scattering distribution at the proximal face. Additionally, as all
fibers in the
bundle 116 are path length matched to within the coherence length, the optical
path
length traveled by scattered light 122 at each angle is identical. The system
disclosed in
"Fiber-optic-bundle-based optical coherence tomography," by T. Q. Xie, D.
Mukai, S. G.
Guo, M. Brenner, and Z. P. Chen in Optics Letters 30(14), 1803-1805 (2005)
(hereinafter
"Xie"), incorporated by reference herein in its entirety, discloses a
multimode coherent
fiber bundle into a time-domain optical coherence tomography system and
demonstrated
that the modes of light coupled into an individual fiber will travel different
path lengths.
In the example herein of the present invention, it was experimentally
determined that the
higher order modes are offset from the fundamental mode by 3.75 mm, well
beyond the
CA 02626116 2008-04-10
WO 2007/044821 PCT/US2006/039771
17
depth (-100 m) required for gathering clinically relevant data. Additionally,
the power
in the higher order modes had a minimal affect on dynamic range as the sample
arm
power is significantly less than the reference arm power. Finally, it should
be noted that
while the system disclosed in Xie collected data serially through individual
fibers, the
example of the present invention herein uses 130 fibers to simultaneously
collect
scattered light across a range of angles in parallel, resulting in rapid data
collection.
[0064] The angular distribution exiting a proximal end 124 of the fiber bundle
116 is
relayed by the 4f imaging system of L2 and L3 (f2 = 3.0 cm, f3 = 20.0 cm) to
the input slit
48" of the imaging spectrograph 29" (e.g. Acton Research, InSpectrum 150). The
theoretical magnification of the 4f imaging system is (f3/f2) 6.67 in this
example.
Experimentally, the magnification was measured to be M = 7.0 in this example
with the
discrepancy most likely due to the position of the proximal face 124 of the
fiber bundle
116 with relation to lens L2 (126). The resulting relationship between
vertical position
on the spectrograph slit 48", y, and 0 is y = Mf, (0 -O.j") . The optical path
length of the
reference arm is matched to that of the fundamental mode of the sample arm.
Light 127
exiting the reference fiber 14" is collimated by lens L4 (128) (e.g. f = 3.5
cm, spot size =
8.4 mm) to match the phase front curvature of the sample light and to produce
even
illumination across the slit 48" of the imaging spectrograph 29". A reference
field 130
maybe attenuated by a neutral density filter 132 and mixed with the angular
scattering
distribution at beamsplitter BS (134). The mixed fields 136 are dispersed with
a high
resolution grating (e.g. 1200 lines/mm) and detected using an integrated,
cooled CCD
(not shown) (e.g. 1024 x 252, 24 m x 24 m pixels, 0.1 nm resolution)
covering a
spectral range of 99 urn centered at 840 run, for example.
[0065] The detected signal 136, a function of wavelength, 2, and 0, can be
related to
the signal and reference fields (Es, Er) as:
1( .'0)-(IE,(A" 0n~I) (JE's(A" '0n~2) +2Re(E,(A.,0n)E,(A,,,0,)cos(O)), (1~
where 0 is the phase difference between the two fields, (in, n) denotes a
pixel on the
CCD, and (...) denotes a temporal average. I(~.õb O) is uploaded to a PC using
LabVIEW
manufactured by National Instruments software and processed in 320 ms to
produce a
depth and angle resolved contour plot of scattered intensity. The processing
of the angle-
CA 02626116 2008-04-10
WO 2007/044821 PCT/US2006/039771
18
resolved scattered field to obtain depth and size information described above,
and in
particular reference to the data acquisition apparatus of Figures 1A and 1B,
can then used
to obtain angle-resolved, depth-resolved information about the sample 18"
using the
scattered mixed field 136 generated by the apparatus in Figure 8.
[0066] The embodiments set forth above represent the necessary information to
enable those skilled in the art to practice the invention and illustrate the
best mode of
practicing the invention. Upon reading the following description in light if
the
accompanying drawings figures, those skilled in the art will understand the
concepts of
the invention and will recognize applications of these concepts not
particularly addressed
herein. It should be understood that these concepts and applications fall
within the scope
of the disclosure.
[0067] Those skilled in the art will recognize improvements and modifications
to the
preferred embodiments of the present invention. All such improvements and
modifications are considered within the scope of the concepts disclosed herein
and the
claims that follow.