Note: Descriptions are shown in the official language in which they were submitted.
CA 02634877 2008-06-23
WO 2007/078897 PCT/US2006/048110
SYSTEMS AND METHODS FOR DESIGNING EXPERIMENTS
FIELD OF THE INVENTION
The present invention relates to methods and systems for designing true
experiments.
BACKGROUND
Experiments are typically conducted to determine empirically if there are
relationships between two or more variables. An experiment typically begins
with the
formation of one or more hypotheses positing that there is a relationship
between one or more
independent variables and one or more dependent variables. For example, a
researcher at a
pharmaceutical company might formulate a hypothesis that the amount of a new
drug that
patients take will be related to the blood pressure of patients. Independent
variables are the
variables defined or manipulated by the experimenter during an experiment
(e.g., the amount
and/or frequency of a drug administered to patients). Dependent variables are
the variables
posited to depend on the value of the independent variable (e.g., the blood
pressure of
patients). The experimenter then conducts an experiment to determine if there
is indeed a
relationship between the independent and dependent variables (e.g., if the
amount of a drug
patients receive is related to the blood pressure of patients).
Confounding variables (things that vary systematically with the levels of the
independent variable) may also influence the dependent variable. These
confounding
variables are not of primary interest in the experiment, yet can influence the
dependent
variables. Some examples of confounding variables include regression to the
mean, order
effects, floor-effects, ceiling effects, Hawthorne effects, and demand
characteristics.
Confounding variables make it impossible to know which factor (variable)
caused any
observed change in the dependent variable(s). And thus, the existence of
confounding
variables that are not properly controlled during the experiment renders it
impossible to make
statistical inferences about causal relationships between the independent and
dependent
variables. Various types of experiments may be distinguished by the manner and
degree to
which they are able to reduce or eliminate the effects of confounding
variables. The term
"true experiment" denotes an experiment in which:
1. There are at least two levels of an independent variable.
1
CA 02634877 2008-06-23
WO 2007/078897 PCT/US2006/048110
2. Samples are randomly assigned to levels of the independent variable. That
is, each
sample in the experiment is equally likely to be assigned to levels of the
independent
variable.
3. There is some method of controlling for or eliminating confounds.
Experiments that lack any of the above three characteristics are not true
experiments,
and are often referred to as quasi-experiments or correlational designs. Only
true
experiments allow statistical inferences to be drawn regarding the causal
relationships
between independent and dependent variables. Quasi-experiments and
correlational designs
may allow relationships between independent and dependent variables to be
established, but
it is not possible to determine whether those relationships are causal.
Various types of
experimental designs (including true experiments) have been described, for
example, in
Campbell, D. T., & Stanley, J. C. (1963) Experimental and quasi-experimental
designs for i
research, Chicago: Rand McNally. Data produced by a true experiment are
substantially
unaffected by confounding variables. However, the complexity of designing of a
true
experiment that appropriately controls or eliminates confounding variables-may
be
significant.
It is also desirable to design experiments that have a sufficient degree of
internal and
external validity. Internal validity refers to the confidence that the
independent variables
caused any observed difference in the dependent variables. External validity
refers to the
confidence that the observed relationship between the independent and
dependent variable in
the experiment will apply to settings or situations outside of the settings of
the experiment.
Designing a true experiment having sufficient internal and external validity
may be daunting
for investigators who have only a limited knowledge of the statistical and
experimental
design principles. Systems and methods that provide investigators with a
simplified
approach to designing true experiments are desirable.
2
CA 02634877 2008-06-23
WO 2007/078897 PCT/US2006/048110
SUMMARY OF THE INVENTION
The present invention is directed to systems and methods for designing
experiments.
One embodiment of the invention involves a method for designing an experiment
using a
computer to determine whether the experiment is a true experiment.
According to various approaches, the computer may select one or more
independent
variables of the experiment and/or may select one or more dependent variables.
The
computer may automatically form one or more control groups of the experiment
and/or one
or more treatment groups of the experiment, including automatically
randomizing the
treatment or control groups. In some implementations, the computer may apply
techniques
(for example, blocking and counterbalancing) to reduce effects of one or more
confounding
variables.
According to other approaches, the computer may assist the user in various
steps
involving the experiment. For example, the computer may assist the user in
selection of one
or more independent variables and/or one or more dependent variables. The
computer may
assist the user in forming at least one of a control group and a treatment
group. The computer
may assist the user in randomizing samples to control and treatment groups and
may
alternatively or additionally apply techniques to reduce effects of one or
more confounding
variables of the experiment.
Another aspect of the invention involves performing the experiment. The
computer
may automatically run the experiment or may perform various functions to
assist the user in
running the experiment.
Another aspect of the invention is directed to analyzing results of the true
experiment.
Some implementations allow for the analysis to be performed automatically by
the computer.
In other implementations, the computer assists the user in analyzing the
results of the
experiment.
Another embodiment of the invention is directed to system for experimental
design,
the system including a design processor configured to determine whether an
experiment is a
true experiment. In some implementations, the design processor may be
configured to select
at least one of an independent variable and a dependent variable of the
experiment. The
design processor may be configured to form at least one of a control group and
a treatment
group of the experiment, including performing randomizing and blocking.
3
CA 02634877 2008-06-23
WO 2007/078897 PCT/US2006/048110
In some implementations, the system may assist the user in various functions
associated with the experiment. In these implementations, the system includes
a user
interface configured to accept input from a user. The design processor may be
configured to
assist the user in selection of at least one of an independent variable and a
dependent variable
of the experiment using the user input. The design processor may be configured
to assist the
user in selection of at least one of a control group and a treatment group of
the experiment
based on the user input and may also assist the user in randomizing the groups
and in
applying blocking to reduce effects of one or more confounding variables of
the experiment
based on the user input.
According to another aspect of the invention, the system may include a
deployment =
unit configured to run the experiment and/or an analysis unit configured to
analyze results of
the experiment. Deployment and/or analysis of the experiment may be performed
automatically by the system or using input from a user.
In one implementation, the experiment comprises a digital signage experiment.
In
another implementation, the experiment involves an advertisement.
The above summary of the present invention is not intended to describe each
embodiment or every implementation of the present invention. Advantages and
attainments,
together with a more complete understanding of the invention, will become
apparent and
appreciated by referring to the following detailed description and claims
taken in conjunction
with the accompanying drawings.
BRIEF DESCRIPTION OF THE DRAWINGS
Figure 1 illustrates elements needed for a true experiment;
Figure 2A is a block diagram of a digital signage system that may incorporate
the
capability for designing true experiments in accordance with embodiments of
the invention;
Figure 2B is a block diagram of a system for designing true experiments in
accordance with embodiments of the invention;
Figure 3 is a flowchart illustrating a method that includes the design of a
true
experiment in accordance with embodiments of the invention;
Figures 4A-4C are flowcharts of a method incorporating designing experiments
for
digital signage implementations in accordance with embodiments of the
invention;
4
CA 02634877 2008-06-23
WO 2007/078897 PCT/US2006/048110
Figure 5 illustrates an exemplary layout for a digital signage display,
including a
weather/news panel, store logo, text crawl and area for video advertisements
that may be
implemented in accordance with embodiments of the invention;
Figure 6 conceptually illustrates the functionality of a semi-automatic
digital signage
system in accordance with embodiments of the invention;
Figure 7 illustrates the process flow of creating and deploying content using
the
components and functionality of a digital signage system in accordance with
embodiments of
the invention;
Figure 8 is a flowchart illustrating an exemplary implementation of a digital
signage
system for a sporting goods retailer in accordance with an embodiment of the
invention; and
Figure 9 is a flowchart illustrating a method of determining if an
experimental design
eliminates confounds from the experiment in accordance with embodiments of the
invention.
While the invention is amenable to various modifications and alternative
forms,
specifics thereof have been shown by way of example in the drawings and will
be described
in detail. It is to be understood, however, that the intention is not to limit
the invention to the
particular embodiments described. On the contrary, the intention is to cover
all
modifications, equivalents, and alternatives falling within the scope of the
invention as
defined by the appended claims.
DETAILED DESCRIPTION OF VARIOUS EMBODIMENTS
In the following description of the illustrated embodiments, reference is made
to the
accompanying drawings that form a part hereof, and in which is shown by way of
illustration,
various embodiments in which the invention may be practiced. It is to be
understood that the
embodiments may be utilized and structural changes may be made without
departing from
the scope of the present invention.
The present invention is directed to methods and systems that use a computer
to
determine whether the design of an experiment is a true experiment. The
elements needed
for a true experiment are illustrated in Figure 1. A true experiment includes
development of a
hypothesis or objective. Dependent and independent variables are identified,
and at least two
levels of an independent variable are used. Samples are randomly assigned to
levels of the
independent variable. There is some kind of method for controlling for or
eliminating
confounding variables. If all of these elements are appropriately applied, the
experiment
5
CA 02634877 2008-06-23
WO 2007/078897 PCT/US2006/048110
produces results that can be used to make statistical inferences about the
relationship between
the dependent and independent variables. Methods and systems described herein
allow a user
who is unsophisticated in the complexities of true experimental design to
design and deploy
an experiment that produces substantially confound-free results and can be
used to determine
and quantify any causal relationship between independent and dependent
variables.
A true experiment has at least two levels of an independent variable. As
described
herein, some embodiments of the invention provide methods and systems that
assist users in
choosing independent variables for the experiment and in balancing between
internal and
external validity. For example, with respect to threats to internal validity,
the methods and
systems of the present invention assist the user through the process of
identifying threats to
internal validity, and may suggest and/or automate methods of controlling
these threats, such
as through counterbalancing and/or blocking. Some embodiments herein assist
the user
and/or automate the process of assigriing samples randomly to groups so that
each sample in
an experiment is equally likely to be assigned to levels of the independent
variable. In some
configurations, the randomization, counterbalancing and/or blocking may be
automatically
performed. The system may select, or may assist the user in selecting,
independent variables
(or levels of independent variables) and dependent variables based factors
associated with
internal and/or external validity.
In.yet other embodiments, the methods and systems of the present invention may
be
used to evaluate previously designed or conducted experiments. In these
embodiments,
based on input from the user regarding how an experiment was previously
designed or
conducted, the system determines if the experiment was indeed a true
experiment (as opposed
to a quasi-experiment or correlational study) and/or identifies the existence
of confounds in
the experiment. In some implementations, the approaches of the present
invention may be
used to determine the internal and/or external validity of an experimental
design.
In some embodiments, the computer may operate in a semi-automatic mode,
wherein
the user is led by the computer through one or more interactive sessions to
design, deploy,
and/or analyze data acquired from a true experiment. In other embodiments, the
computer is
programmed to operate fully automatically without user interaction. In a fully
automatic
mode, a computer-based system may perform one or more of designing the
experiment,
deploying the experiment, acquiring data produced by the experiment, analyzing
the data,
determining internal validity of the experiment, determining external validity
of the
6
CA 02634877 2008-06-23
WO 2007/078897 PCT/US2006/048110
experiment, and/or modifying or implementing one or more processes based on
the analysis.
In yet other embodiments, the system may perform one or more of the steps
described above
semi-automatically and may perform another one or more of the steps fully
automatically.
The computer-based approaches to experimental design are described herein
based on a
computerized signage information system. The present invention is not limited,
however, to
the fields of communications systems or signage. The approaches of the present
invention
may be applied to the design of a true experiment regardless of the field of
interest. For
example, the methods and systems described herein may be applied to the design
of
experiments for any number of subject areas, including, but not limited to,
biology,
chemistry, linguistics, medicine, cognitive sciences, social sciences,
education, economics,
and/or other scientific fields. The examples are described in the context of a
digital signage
information system to allow the reader to develop an understanding of the
principles of the
invention which generally span all fields of scientific endeavor.
Figure 2A is a block diagram of a digital signage system (DSS) that may
incorporate
the capability for designing true experiments in accordance with embodiments
of the
invention. The block diagram of Figure 2A illustrates one configuration of a
DSS divided
into functional blocks. Those skilled in the art will appreciate that the DSS
may be
alternatively illustrated using different function blocks and that various
components of the
DSS may be implemented as hardware, software, firmware, or any combination of
hardware,
software and firmware.
The DSS illustrated in Figure 2A is a computerized system configured to
present
informational content via audio, visual, and/or other media formats. The DSS
may include
functionality to automatically or semi-automatically generate playlists, which
provide a list of
the information content to be presented, and schedules, which define an order
for the
presentation of the content. In a semi-automatic mode, a user may access a DSS
control
processor 205 via an interactive user interface 210. Assisted by the DSS
control processor
205, the user may identify content to be presented and generate playlists and
schedules that
control the timing and order of presentations on one or more DSS players 215.
Each player
215 presents content to recipients according to a playlist and schedule
developed for the
player. The informational content may comprise graphics, text, video clips,
still images,
audio clips, web pages, and/or any combination of video and/or audio content,
for example.
In some implementations, after a playlist and schedule are developed, the DSS
7
CA 02634877 2008-06-23
WO 2007/078897 PCT/US2006/048110
control processor 205 determines the content required for the playlist,
downloads the content
from a content server, and transfers the content along with the playlist and
schedule to a
player controller 220 that distributes content to the players 215. Although
Figure 2A shows
only one player controller 220, multiple player controllers may be coupled to
a single DSS
control processor 205. Each player controller 220 may control a single player
215 or
multiple players 215. The content and/or the playlists and schedules may be
transferred from
the DSS control processor 205 to the one or more player controllers 220 in a
compressed
format with appropriate addressing providing information identifying the
player 215 for
which the content/playlist/schedule is intended. In some applications, the
players 215 may be
distributed in stores and the content presented on the players 215 may be
advertisements.
In other implementations, the DSS control processor 205 may transfer only the
playlists and schedules to the player controller 220. If the content is not
resident on the
player controller 220, the player controller 220 may access content storage
225 to acquire the
content to be presented. In some scenarios, one or more of the various
components of the
DSS system, including the content storage 225, may be accessible via a network
connection,
such as an intranet or Internet connection. The player controller 220- may
assemble the
desired content, or otherwise facilitate display of the desired content on the
players according
to the playlist and schedule. The playlists, schedules, and/or content
presented on the players
215 can be modified periodically or as desired by the user through the player
controller 220,
or through the DSS control processor 205, for example.
In some implementations, the DSS control processor 205 facilitates the
development
and/or formatting of a program of content to be played on a player. For
example, the DSS
control processor 205 may facilitate formatting of an audiovisual program
through the use of
a template. The template includes formatting constraints and/or rules that are
applied in the
development of an audiovisual program to be presented. For example, the
template may
include rules associated with the portions of the screen used for certain
types of content, what
type of content can be played in each segment, and in what sequence, font
size, and/or other
constraints or rules applicable to the display of the program. A separate set
of rules and/or
constraints may be desirable for each display configuration. In some
embodiments,
formatting a program for different displays may be performed automatically by
the DSS
control processor 205.
In some embodiments, the DSS may create templates, generate content, select
8
CA 02634877 2008-06-23
WO 2007/078897 PCT/US2006/048110
content, assemble programs, and/or format programs to be displayed based on
information
acquired through research and experimentation in the area of cognitive
sciences. Cognitive
science seeks to understand the mechanisms of human perception. The
disciplines of
cognitive and vision sciences have generated a vast knowledge base regarding
how human
perceptual systems process information, the mechanisms that underlie
attention, how the
human brain stores and represents information in memory, and the cognitive
basis of
language and problem solving. Application of the cognitive sciences to content
design,
layout, formatting, and/or content presentation yields information that is
easily processed by
human perceptual systems, is easy to understand, and is easily stored in human
memory.
Knowledge acquired from the cognitive sciences and stored in a cognitive
sciences database
230 may be used automatically or semi-automatically to inform one or more
processes of the
DSS including creation of templates, content design, selection of content,
distribution of
content, assembly of programs, and/or formatting of programs for display. The
cognitive
sciences database 230 used in conjunction with the programming of the DSS
yields
advertisements or other digital signage programs that are enhanced by the
teachings of
cognitive science, while relieving the system user from needing specific
training in the field.
In development of a digital signage program, e.g., ad campaign or the like,
the DSS
control processor 205 may guide a user through various processes that are
enhanced using
knowledge acquired through the cognitive sciences. For example, information
stored in the
cognitive sciences database 230 may be applied to the choice of templates to
produce an
optimal program layout and/or to the selection of content, such as whether
content elements
should be graphical, text, involve movement, color, size, and/or to the
implementation of
other aspects of program development.
The DSS may include the capability for designing alternative versions of a
digital
signage program to accommodate diverse display types and viewing conditions.
Display
technology is diverse and there are large differences in the types of displays
used to present
content on a digital signage network. For example, the size, shape,
brightness, and viewing
conditions will vary greatly across a digital signage network (e.g., some
displays will be
small, flexible and non-rectilinear, whereas others will be standard large
format Liquid
Crystal Display (LCD) and plasma displays). The variation in display types and
viewing
conditions means that any single version of a piece of coritent will not be
optimal for all the
displays across a network. In order to overcome this problem, it may be
necessary to generate
9
CA 02634877 2008-06-23
WO 2007/078897 PCT/US2006/048110
versions of each piece of content for each display type and viewing
environment, and to
selectively distribute these versions of content to their corresponding
screens in the network.
However, it is not realistic to expect content designers to have such detailed
knowledge of the
display types and viewing conditions across a large DSS network. Furthermore,
even if such
content designers had such detailed knowledge, it wouldl be time-consuming to
manually
create versions of content for each display and to manually schedule the
content to play on
each corresponding display at the appropriate time.
The DSS may include a data acquisition unit 235 for collecting data used to
improve
the effectiveness of deployed content. The data acquisition unit 235 allows
distribution
factors that underlie the effectiveness of digital signage networks to be
continuously gathered
in real-time during deployment of content. The information acquired can
facilitate
continuous improvement in content effectiveness of the DSS as well as
improvement of
individual versions of content pieces. Real-time data may be used to learn
what sensor or
sales events should trigger the display of specific types of content, for
example.
Individual pieces of content in any content program each have a specific goal
(e.g., to
sell a specific product). It is usually the case that there is variability in
the value of each goal
to the user of the digital signage network. For example, there may be
variability in the profit
margin and inventory level for each product which factor into the value of the
goal for the
product. The value of achieving each goal continuously changes during the time
a digital
signage program is deployed. For example, the inventory level of a product may
change,
thus affecting the goal for sales of the product.
Enhancing the effectiveness of a DSS as a whole, involves 1) accurate
prediction of
the impact of deploying a digital signage program on the goal associated with
the digital
signage program, and 2) continuously changing the distribution patterns
(timing, frequency,
and location) of individual pieces of content as the value of each individual
goal
corresponding to the pieces of content change. In many cases, it is unfeasible
for users of the
DSS to predict the impact of deploying content and to manually change content
distribution
patterns based on continuously changing values of goals associated with each
piece of
content. The DSS provides the functionality to predict the impact of digital
signage programs
and to alter the distribution of content based on the predictions.
As previously stated, content is displayed on the players 215 with the goal of
affecting human behavior (e.g., to impact purchasing behavior). However, prior
digital
CA 02634877 2008-06-23
WO 2007/078897 PCT/US2006/048110
signage systems are unable to demonstrate a cause-and-effect relationship
between signage
content and human behavior or to measure the strength of the cause and effect
relationship.
This difficulty arises because the methods by which content is delivered
across current digital
signage networks does not support the determination of whether any measured
change in
human behavior was caused by signage content or the result of some confounding
factors
(e.g., change in weather, change in general demand for the product, change in
price of the
product). The only way to decisively determine cause-and-effect relationships
between
signage content and human behavior is to conduct a true experiment during
which signage
content is systematically manipulated using complex experimental designs, and
the effects of
those manipulations on human behavior are carefully measured. Manually
conducting such
experiments is time consuming and requires significant knowledge and training
in the
scientific method of how to design true experiments. The users of digital
signage systems
may not have sufficient training to understand how to design a true experiment
to acquire
confound-free results.
The DSS may include components that provide the capability to design, deploy,
and/or analyze data acquired from true experiments. As previously discussed,
the
components providing this functionality may be incorporated into a DSS or may
be
implemented by other types of systems. Components that may be used in the
design,
deployment, and/or analysis of true experiments, regardless of the particular
type of system in
which they are implemented, are set forth separately in the block diagram of
Figure 2B. A
system according to the present invention may include one or more of the
features, structures,
methods, or combinations thereof described herein. For example, a system may
be
implemented to include one or more of the advantageous features and/or
processes illustrated
in Figures 2A or 2B. It is intended that such a system need not include all of
the features
described herein, but may be implemented to include selected features that
provide for useful
structures and/or functionality.
Figure 2B illustrates an experiment design system (EDS) including experiment
design
processor that is configured to ensure the design of a true experiment. As
previously
discussed, the experiment design processor 240 may be configured to operate
fully
automatically or semi-automatically with user interaction. In semi-automatic
mode, the
experiment design processor 240 may lead a user through various interactive
sessions
conducted via the user interface 210 to design a true experiment. In such a
process, the
11
CA 02634877 2008-06-23
WO 2007/078897 PCT/US2006/048110
experiment design processor 240 ensures the design of a true experiment that
produces
confound-free data. Thus, a user is able to rely on the programming of the
experiment design
processor 240 and is not required to have knowledge or experience in designing
true
experiments. The EDS may comprise only an experiment design processor 240, or
may
include additional elements such as an experiment deployment unit 245, a data
acquisition
unit 235, and data analysis unit 250.
The experiment design processor 240 may, automatically or semi-automatically,
develop an objective or hypothesis for the experiment, identify independent
and dependent
variables of the experiment, form control and treatment groups applying
appropriate
randomization, counterbalancing. and/or blocking. In the context of a DSS, for
example, the
experimental objective may be to evaluate the effectiveness of a content
element in an ad
campaign promoting sales of a certain product. The independent variable(s) may
be
associated with some aspect of the display of the content element. The
dependent variable(s)
may be associated with an increase in sales of the product.
The experiment design processor 240 may form appropriate treatment and control
groups including the selection of various venues of the DSS system where the
experimental
content and control content is to be displayed. Presentation of the
experimental content,
including content format, schedule, presentation location, and/or other
factors that may
produce confounds into the experimental process, are controlled by the
experiment design
processor 240. The experiment design processor 240 may ensure adequate
randomization,
counterbalancing, and blocking of the control and treatment groups to achieve
experimental
results that are confound-free. Design of the experiment in the context of the
DSS system
may involve, for example, generating appropriate playlists and schedules for
the presentation
of content to be tested via the experiment, and may also involve generating
playlists and
schedules for presentation of control content.
The EDS may further include an experiment deployment unit 245. The experiment
deployment unit 245 is configured to facilitate deployment of the experiment.
In the context
of the exemplary DSS system, the experiment deployment unit 245 formats the
experimental
content and the control group content for various player configurations and
facilitates the
transfer of the experimental content and the control content to the player
controller 220 for
presentation on players'215 as specified by the playlists and schedules.
The data acquisition unit 235 may be configured to collect experimental data
from the
12
CA 02634877 2008-06-23
WO 2007/078897 PCT/US2006/048110
control and treatment groups. The data acquisition unit 235 may perform or
facilitate
acquisition of data associated with the experiment via any means. For example,
in the
context of the exemplary DSS, the data acquisition unit 235 may be coupled to
various sensor
or data acquisition devices 262, 264, 266 that gather information including
product
movement, product sales, customer actions or reactions, and/or other
information. Sensors
262 may be used to detect, for example, if a customer picks up the product, or
if a customer is
in the vicinity of the display when the content is displayed. Sales may be
determined based
on information acquired by a point of sales (POS) system 264. Other devices
266 that
measure the dependent variable may also be used. Changes in inventory levels
of a product
may be available via an inventory control system. Customer reactions may be
acquired via
questionnaires. If the conducted experiment is a true experiment, the data
acquired by the
data acquisition unit 235 is substantially confound-free.
The data acquisition unit 235 may be coupled to a data analysis module 250
that is
configured to analyze the experimental data collected by the data acquisition
unit 235. The
data analysis module 250 may determine and/or quantify cause and effect
relationships
between the independent and dependent variables of the experiment. For the
illustrated DSS,
the results of the analysis may be used to determine if the content is
effective at influencing
product sales.
The results of the analysis may be additionally or alternatively used to
implement or
modify various processes. For example, if the content was effective at
influencing product
sales, an advertisement campaign may be developed incorporating the content. A
value may
be assigned to the content by a content valuation process 272 based on the
effectiveness of
increasing sales. An advertiser using the content may be invoiced by a billing
unit 274
according the value of the content. The data analysis module 250 may also
provide
information to inventory control 276. Additionally, the data analysis module
250 may
provide information to a prediction unit 278 that generates a prediction of
sales when the
advertising campaign is deployed. The prediction unit 278 may additionally or
alternatively
predict the product inventory needed to support the sales generated by the
advertisement
campaign.
The flowchart illustrated in Figure 3 provides an overview of a method that
may be
implemented by the DSS (Figure 2A) and/or the EDS (Figure 2B) in accordance
with
embodiments of the invention. The method includes design 310 and performance
320 of a
13
CA 02634877 2008-06-23
WO 2007/078897 PCT/US2006/048110
true experiment. Data produced by the experiment are collected 330 and
analyzed 340. One
or more processes may be modified or implemented 350 based on the data
analysis.
The flowcharts of Figures 4A-4C provide a more specific example of these
processes
in the context of digital signage in accordance with embodiments of the
invention. In.this
example, the objective of the experiment is to determine the effect of a video
advertisement
for a DSS incorporating Content A on sales of Product X. For example, Content
A may be
an advertisement featuring a video of an actor, athlete, or other famous
person. The content
to be tested (Content A) is identified 402 and control content 404 is
selected. A video
advertisement incorporating Content A is produced 406 using template rules
stored in local
memory. The template rules may also be applied to produce video content to be
used for the
control group. The template rules may be used to provide a structure for
arranging the layout
of content on the display. In some cases, the template rules are based on
information derived
from the cognitive sciences. An exemplary layout for a digital signage display
including a
weather/news panel, store logo, text crawl, and area for video advertisements
is illustrated in
Figure 5.
Playlists and schedules are specified 412, 414 for the video advertisement
incorporating Content A and the control content. Venues for the advertisement
and the
control content are selected 416, 418. For example, the venues of the
advertisement and
control content may be restaurants, stores, shopping malls, or other
locations. Development
412, 414 of the playlists and schedules, and selection 416, 418 of venues is
performed using
appropriate randomization and blocking to exclude or reduce confounding
variables in the
experimental results.
The advertisement and control content may be deployed to a number of venues,
each
venue having a particular set of viewing characteristics. For example, venues
may vary with
respect to display size, display shape, viewing distance, ambient lighting,
noise level, and
other viewing conditions. The advertisement is adjusted 422 to conform to the
attributes of
each display on which the advertisement it deployed. Similar adjustments are
performed 424
for the control content. The advertisement and the control content are shown
426, 428
according to their respective playlists and schedules.
Data may be collected at each venue before, during and after display of the
advertisement and/or the control content. The data may be collected via
sensors, point of sale
terminals, inventory control systems, and/or other input devices. For example,
viewer
14
CA 02634877 2008-06-23
WO 2007/078897 PCT/US2006/048110
presence in the vicinity of the display during presentation of the
advertisement may be
detected. The number of times the advertisement and control content was
displayed 432, 434
or viewed 436, 438 may be detected. Viewer motion, eye movements, and/or
interaction
with Product X may be sensed 442. The volume and timing of sales of Product X
may be
determined 444 from point of sales terminals. Viewer responses to the
advertisement may be
acquired via questionnaires. For example, the questionnaires may be used to
determine if the
viewers reported a generally positive or generally negative reaction to the
advertisement.
Before and after questionnaires may be used to determine if the advertisement
changed the
consumer's level of familiarity with Product X. Changes in inventory levels of
product X
may be determined.
The collected data may be analyzed 446 to determine causal relationships
between
display of the advertisement containing Content A and sales of Product X.
Based on the
analysis, a value may be assigned 448 to Content A. If Content A is successful
at increasing
sales, an advertisement campaign may be generated 452 incorporating Content A.
The return
on investment (ROI) for the advertising campaign may be determined 454. The
business
providing the advertisement campaign or the systems for presenting the
advertisement
campaign may bill 456 their customers according to the value of Content A or
predicted ROI
as determined by the experiment. The sellers of Product X may predict
inventory
requirements 458 for Product X during an advertisement campaign incorporating
Content A
based on the results of the experiment. The system may iteratively modify 462
one or more
processes based on the experimental results.
Figure 5 illustrates an exemplary layout for a digital signage display that
may be
controlled by the DSS of the present invention. The digital signage display
may be
configured to include a number of areas such as a weather/news panel, a store
logo graphic,
text crawl, and area for video advertisements.
Figure 6 conceptually illustrates the functionality of a semi-automatic DSS,
such as
the system illustrated in Figure 2A, in accordance with embodiments of the
invention. The
DSS may functionally be broadly grouped into four areas. The first functional
area illustrated
in Figure 6 provides for the application of cognitive and vision sciences 610
to digital
signage. Programming tools are provided that allow content designers without
advanced
training in the visual and cognitive sciences to apply principles from these
disciplines during
the content creation process, in order to improve content effectiveness. The
system prompts
CA 02634877 2008-06-23
WO 2007/078897 PCT/US2006/048110
the user to input both the goal and the intended message (the critical
information) for each
piece of content. The user is assisted in the identification of key=attributes
across the digital
signage network that have implications for content design. The system guides
the user
through the process of applying the cognitive and visual sciences to design
content based on
the goals and key digital signage network attributes. For example, the system
would help
users choose the templates (i.e., best layout) and the elements (e.g., whether
elements should
be graphical, text; involve movement, color, size, etc.) to display on the
signs.
Another functional component of the DSS provides content effectiveness
measurement 620. The programming of the DSS allows the user with little or no
training or
skills in conducting experiments to generate complex experimental designs. The
experimental designs may be used to investigate the content design and
distribution factors
that underlie effective digital signage networks, and to measure the impact of
content on
human behavior. Users are assisted in identifying the independent variables
likely to be
critical to content effectiveness and the dependent variables corresponding to
the independent
variables. An appropriate experimental design is generated by the system,
including
identifying appropriate control and experimental conditions, appropriate
blocking,
counterbalancing, and randomization, to determine the strength of any causal
relationship
among and between those independent and dependent variables. The experiment is
performed, data are collected via sensors and/or other processes, and is the
data are analyzed.
Results of the experiment are may be used by various other components of the
system and/or
may be reported to users.
The use of true experiments provides complex and rigorous methods to deliver
content that allows the collection of very clear (confound-free) data. This is
in contrast with
the approach of using quasi-experiments which require extremely complex
analysis methods
(i.e., behavioral analytics) to analyze and use data that are fraught with
confounds.
The DSS provides automated content design 630 that automatically generates new
templates and applies transformations to existing elements. New templates and
elements
may be generated to improve the content effectiveness, and/or to create
appropriate content to
fulfill the needs of the experimental designs previously described. The tools
provided by the
DSS are capable of generating unique versions of pieces of content for each
player in the
system. The DSS system may prompt users to provide input or may use
information supplied
from other components regarding the network attributes and factors that
underlie content
16
CA 02634877 2008-06-23
WO 2007/078897 PCT/US2006/048110
effectiveness. Knowledge from the cognitive and visions sciences may be used
to
extrapolate, fill in, and otherwise explore the information space for the
particular pieces of
content the system aims to enhance. The functionality of the DSS provides the
ability to
generate completely new content that is not simply a reconfiguration of
deployed templates
or elements associated with deployed versions of content. That is, the DSS
does not simply
rely on the hybridization/blending of deployed templates and elements that
data suggest are
effective, although the system is capable of hybridization/blending.
The DSS system includes the funetionality to distribute 640 different content
pieces
across a network of displays to enhance the system level (i.e., superordinate-
level) goals. For
example, content pieces may be distributed system-wide to coordinate the sales
of different
items, or to respond to different inventory levels (sales rates, profit
margins) at different
geographic locations.
The functional components 610-640 illustrated in Figure 6 are individually
useful.
However, when the components 610-640 are combined into a unified system, a
number of
other key benefits arise out of the combined system. Application of cognitive
and vision
sciences 610 allows users with little or no background in the cognitive and
visual sciences to
apply these disciplines in order to create more effective content. This
functionality can be
used in either a single or multi-screen environment. On a system-wide level,
application of
cognitive and vision sciences provides input and constraints for the automated
content design
system in order to tailor content on a screen-by screen basis. For example, if
the average
viewing distance is known for each network sign, then the component for
applying the
cognitive and visual sciences will determine the ideal font size for each
sign, and this
information will be used by the automated content design component to generate
text with
those font-size parameters. The system may suggest the key parameters that
should be
manipulated during the experiment process, and may provide the upper and lower
bounds of
those parameters.
Content effectiveness measurement 620 can operate in either a single or multi-
screen
environment to generate experimental designs and analyze data regarding the
impact of
content on any measurable human behavior. Content effectiveness measurement
620 can
determine causal relationships between signage content and human behavior. In
one
example, it is possible to determine the precise financial value of content
(and thus of the
digital signage system) for any human behavior that can itself be assigned a
precise value.
17
CA 02634877 2008-06-23
WO 2007/078897 PCT/US2006/048110
The human behavior having the most obvious known value is purchasing behavior.
However, through the system's ability to sense other human behaviors, users
could assign
dollar values to a wide variety of actions, such as eye movements, picking up
products,
reduction in wayfinding times, etc.
In another example, market researchers could test their hypotheses regarding
what
feature sets in products are most valuable by generating content describing
different feature
sets of the same product. By determining what content pieces are the most
effective, it would
be possible to make inferences regarding what feature sets are the most
valuable to
consumers.
On a system level, content effectiveness measurement 620 provides input to the
automated content design component regarding the effectiveness of design
parameters, which
allows the automated content design component to continuously improve the
effectiveness of
deployed content. Further, continuously updated input can be provided to allow
the content
distribution component to predict the impact that specific content
distribution patterns will
have on a given goal-state.
Content distribution functionality 640 provides for continuous changes in the
relative
frequency with which individual pieces of content are presented across the
network in order
to attain or maximize a goal of the digital signage network. Changing the
relative frequency
involves increasing or decreasing the number of times individual pieces of
content are shown
on individual signs. All other content distribution factors, such as the
versions of pieces of
content that are shown on specific screens remain the same. For example, the
system can
decrease the frequency of presenting pieces of content corresponding to
products that have
lower inventory levels and increase the frequency of presenting content
corresponding to
products with higher inventory levels.
System wide, the content distribution component 640 can receive input from the
content effectiveness measurement component 620, and leverage that input to
strategically
distribute content on a screen-by-screen basis based on the predictions that
arise out of the
cause and effect information gathered by the content effectiveness measurement
component.
Figure 7 illustrates the process flow of creating and deploying content using
the
components and functionality of the DSS described above. During the first
cycle, or
initialization, the process uses data from outside the system to optimize the
system goals.
During subsequent cycles, the process may rely on data acquired by the system
itself to
18
CA 02634877 2008-06-23
WO 2007/078897 PCT/US2006/048110
modify and/or enhance the system goals. To elaborate, during the first cycle,
the process
illustrated in Figure 7 uses prior knowledge from the cognitive and vision
sciences to
optimize goals; and subsequent cycles use cognitive and vision sciences and
also results from
real-time experimental data to optimize system goals. Thus, during
initialization, the process
uses a priori sources of data. During subsequent cycles no user-interaction is
required.
During the subsequent cycles, both a-priori and a postiori data are used.
The process walks the user through a series of tools and scripts, and creates
710 a
number of alternative templates that specify how categories of content
elements might appear
on the screen (e.g., the location, size, and orientation of elements such as
text, graphics and
videos). The tools and scripts suggest recommended templates by drawing on
three sets of
information: a) principles from the cognitive and visual sciences regarding
effective display
of information, b) the goals for the content (e.g., way-finding, advertising),
and c) the known
attributes of the digital signage network (e.g., size and shape of the
different displays,
different viewing distances, and viewer demographics across the network). For
example, the
tools and scripts might help a user determine whether an element should be
represented
graphically or via text. The tools and scripts might also help a user
determine which of a large
number of pre-defined templates are appropriate given the viewing conditions
across the
network, goals for the content, and if available, metrics regarding the types
of templates that
have been effective from previous campaigns.
The process walks the user through a series of tools and scripts to generate
720 the
particular content elements that will later be placed within the templates
created at block 710.
The individual content elements can include specific text messages, static
images,
animations, movie clips, sound bites, etc. Each element could have many
variants, and
software helps the user determine which elements of content can be combined
within a
template, the rules for how those elements can be combined, and the parameters
on which the
content elements can be manipulated during the content creation process. For
example, it
may be legal to change the color of a font during deployment, but not the
color of the face of
a famous person used in the template.
The software tools and scripts facilitate content generation by drawing on
three sets
of information: a) data regarding the types of content elements that were
effective in previous
campaigns, b) principles from the cognitive and visual sciences, and c) the
known attributes
of the digital signage network. After the content is created, in this example,
user interaction
19
CA 02634877 2008-06-23
WO 2007/078897 PCT/US2006/048110
is no longer necessary.
Content creation is enhanced 730. The process may involve various constraints
to
combine elements and templates to create a number of versions of content. The
first time
through this process, the constraints will be based on: a) the factors
previously used for used
in creation of templates and content elements above, b) pre-programmed
guidelines for' how
to combine elements and templates, c) goals for the piece of content being
deployed, and d)
the parameters of experimental design. On subsequent passes through this
block, the process
will also use effectiveness data to alter existing or create novel templates
(through
interpolation) and elements before creating new versions of content. Because
each display in
a network may have different attributes (e.g., different lighting levels,
noise levels, shape,
size, and mean viewing distances), a unique version of content may be created
for each
display in the network.
The content is distributed 740 across the digital signage network. Content
distribution involves the determination of what, where, and when individual
pieces of content
are displayed in order to: a) allow cause-and-effect relationships between
content and viewer
behavior to be determined, b) enhance the system-level goals of the active
signage network,
and thus the overall network return on investment, c) allow accurate
measurement of the
effectiveness of specific templates and content elements.
The content distribution process allows versions of content to be distributed
using
appropriate blocking and counterbalancing procedures. Further, appropriate
baseline control
conditions are used for known attributes of the signs across the network, and
versions of
content are properly randomized for unknown factors. These algorithms
determine the
appropriate experimental design given the signage network attributes, e.g.,
the number of
attributes, and the relations among the attributes. This functionality
coordinates the playback
requirements, such as the frequency and timing of playback and location of
playback of
individual pieces of content across the system.
Using sensor data, point of sale, inventory data, and/or other data in
conjunction with
the experimental procedures used to distribute content, the impact of content
is calculated and
analyzed 750. To describe this step in terms of perceptual experiments, the
effect-size of the
content elements and templates is calculated. Effect size refers to the amount
of variability in
the data that any defined variable can explain. The process analyzes and
predicts what
content would be effective for a given attribute across the network. Also, co-
occurrences of
CA 02634877 2008-06-23
WO 2007/078897 PCT/US2006/048110
sensor data, content presentation, and movement towards the goal are detected.
Therefore, it
is possible to learn that some detected event, when paired with content,
increases the
direction towards the goal. These co-occurrences then become new digital
signage network
attributes. Content may be distributed in order to take advantage of co-
occurrences of sensor
data, content presentation, and movement towards the goal state.
The analysis performed at block 750 forms the basis of reporting return on
investment
(ROI), future content creation, and future content deployment. Inferential
statistics may be
conducted on the pre-identified dependent variables. From these inferential
statistics, the
system can calculate effect sizes and confidence in cause and effect
relationships, including
the effects of content elements, templates, and deployment.
Figure 8 is a flowchart illustrating an exemplary implementation of the DSS
system
in accordance with an embodiment of the invention. The implementation involves
a sporting
goods retailer with 200 stores. The retailer desires to advertise four
overstocked products and
four products that are not overstocked but that have higher profit margins
than the
overstocked products. The super ordinate-level goal of the campaign is to
maximize gross
profit while eliminating excessive inventory of the overstocked items. That
is, once the
excessive inventory is eliminated, the goal will simply reduce to maintaining
a balanced
inventory at each store location.
Using cognitive and visual-science driven software, the signage manager of the
retailer creates 810 a number of different templates that will be used to
develop content for
each of the eight= product lines. These templates include layout of messages,
color schemes,
and/or other variables that make up the program. These templates can be used
for each of the
eight product lines, and are not specific to a single product. Additionally,
pre-existing or
stock templates are available for use during this phase.
After creating the base templates for this campaign, the signage manager
creates 820
individual content elements that are needed to populate the templates. The
individual
elements are specific to the product lines being promoted, and include product
branding and
messages for given products. As in the template creation process, creation of
individual
elements is guided by software wizards using cognitive and visual-science
driven software.
The templates are automatically populated 830 with the individual content
elements
to generate a number of different content packages for each of the eight
products that the
signage network is promoting. Potentially hundreds of differing versions of
each content
21
CA 02634877 2008-06-23
WO 2007/078897 PCT/US2006/048110
piece are created for each product line by merging elements with templates to
accommodate
varying signage attributes such as screen size or viewing distance.
Using pre-existing or learned knowledge about the signage network, content is
distributed 840 by using algorithms that enable collection of success metrics
for individual
pieces of content. The content is distributed across the network in a way that
ensures proper
counterbalancing, blocking, and confound-free measurement can be made.
Additionally, the
deployment algorithm ensures that relevant content is sent to the appropriate
signs in the
network, considering network attributes, viewer demographics, and viewing
conditions
among others.
Point of sale and sensor data allow the impact of the various content packages
to be
monitored 850 and analyzed to determine what templates and content elements,
and their
combinations, are most effective for each screen on the network. From this
information,
cause and effect, as well as return on investment can be analyzed, enabling
value-based
billing. This example may determine whether across a11200 stores, the signage
system itself
was responsible for X% increase in profits and Y% decrease in excessive
inventory.
Exploratory data analysis generates new possible network attributes. For
example, there is a
spike in sales when customers pick up product X and when content Y is
concurrently shown.
On the next iteration, this new network attribute will be tested
experimentally, not just
measured from a correlation study. For example, the system may determine
whether content
pieces presented on X type screens is most effective using Y-type templates,
and that the
most effective content elements have XYZ properties.
Based on the effectiveness data, the system automatically generates 860 new
templates, new content elements, and new combinations thereof. Again, using
signage
network attributes (both old and new), the software deploys these new pieces
of content
across the network.
During the remainder of the campaign, the processes described in blocks 830
through
860 are repeated, for example, without user interaction. The signage network
manager is able
to monitor the impact that the content has on sales at any given point during
the campaign
while the system automatically attempts to achieve the campaign goals.
Upon completion of this campaign, templates and elements that were manually or
automatically generated during the campaign are available for future campaigns
as well.
Furthermore, the knowledge that was gained regarding the types of templates
and elements
22
CA 02634877 2008-06-23
WO 2007/078897 PCT/US2006/048110
that are effective for particular displays, demographics, or other factors, is
used create and
distribute content more effectively across the network during future
campaigns.
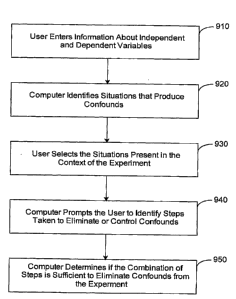
Determination of whether an experiment is a true experiment can be performed
proactively or retroactively with respect to running the experiment. According
to some
embodiments, a computer may be used to determine if an experiment that is yet
to be
performed is a true experiment. According to other embodiments, a computer may
be used to
determine if an experiment that was previously performed is a true experiment.
According to
the approach illustrated in Figure 9, the computer determines, based on
information provided
by the user, whether an experimental design eliminates or controls confounds.
In this
example, the user enters 910 information about the experiment, including the
independent
and dependent variables of the experiment. The computer identifies 920
situations that may
produce confounds in the experiment. The user selects 930 the confound-
producing
situations identified by the computer that are present in the context of the
experiment. The
computer prompts 940 the user to identify steps taken to eliminate or control
the identified
confounds. The computer determines 950 if the combination of steps is
sufficient to
eliminate confounds in the experiment.
The foregoing description of the various embodiments of the invention has been
presented for the purposes of illustration and description. It is not intended
to be exhaustive
or to limit the invention to the precise form disclosed. Many modifications
and variations are
possible in light of the above teaching. For example, embodiments of the
present invention
may be implemented in a wide variety of applications. It is intended that the
scope of the
invention be limited not by this detailed description, but rather by the
claims appended
hereto.
23