Note: Descriptions are shown in the official language in which they were submitted.
CA 02674361 2009-06-30
WO 2008/058263 PCT/US2007/084182
COMPLEX NETWORK MAPPING
Cross Reference To Related Applications
[0001] This application claims priority under 35 U.S.C.
119(e)(1) from U.S. Provisional Patent Application No.
60/864,957, entitled "COMPLEX NETWORK MAPPING" and filed
on November 8, 2006. The provisional application is
incorporated herein by reference in its entirety.
Statement as to Federally Sponsored Research
[0002] The research and development for inventions
described in this application received funding under NIH
Grant No. R01 NS054736-01 from the National Institutes of
Health. The U.S. Government may have rights to various
technical features described in this application.
Background
[0003] This application relates to techniques for
analyzing activities of networked systems, including
signaling behaviors and information flow in networked
systems.
[0004] A networked system includes nodes and links that
connect the nodes. The activities of the nodes and the
links can dynamically change. Hence, such a networked
system can be complex in the sense that the properties and
activities of the nodes can dynamically change in space
and time. Examples of networked systems include but are
not limited to, computer networks such as the Internet,
integrated circuit networks, a power grid network, a
biological network such as the neural network in the human
brain or protein interaction networks in a cell, social
networks, software objects in a computer database or web
pages in a search engine, and artificial neural networks
consisting of artificial neuronal elements.
-1-
CA 02674361 2009-06-30
WO 2008/058263 PCT/US2007/084182
Summary
[0005] Examples and implementations of techniques, system
designs, computer program products are described to
analyze activities of networked systems and provide a
functional mapping of a complex network. In one aspect,
a method for analyzing a networked system monitors
activation and deactivation of nodes in the networked
system to obtain information on activation times and
deactivation times of nodes and locations of nodes, and
uses activation times and deactivation times of nodes to
generate a connection link between first and second nodes
at two different node locations when the first node is
activated at the same time as a signaling from the second
node reaches the location of the first node, thus
producing a connection map of nodes in the networked
system.
[0006] In another aspect, the techniques for analyzing
activities of networked systems described in this
application include a method for analyzing a networked
system which monitors activation and deactivation of nodes
in a networked system to obtain information on activation
times and deactivation times of nodes and locations of
nodes, and applies a signaling model to generate a timing
matrix of the nodes in the networked system to hold
signaling times for a signal to travel from one node to a
different node. This method further compares signaling
times in the timing matrix and monitored activation times
of the nodes to generate a map of connection links between
different nodes.
[0007] In another aspect, a method for constructing a
functional structure map of a networked system includes
capturing activation states of a set of network vertices
over a period of time; comparing a first vertex that is
activated in a current time to one or more second vertices
-2-
CA 02674361 2009-06-30
WO 2008/058263 PCT/US2007/084182
that are newly activated in a later time; and adding a
connection between the first vertex and the one or more
second vertices if a signaling volume expanding from first
vertex can reach the one or more second vertices within a
tolerance.
[0008] In another aspect, a system for analyzing a
networked system includes an imaging module to process a
set of sequential images of a networked system to
determine locations of nodes and activation times of the
nodes in the networked system; and a mapping module in
communication with the imaging module to generate network
connections based on the determined locations of the nodes
and the determined activation times of the nodes in the
networked system.
[0009] These and other aspects, implementations of
described techniques and their variations are described in
greater detail in the drawings, the detailed description
and the claims.
Brief Description of Drawings
[0010] FIG. 1A is a complex network with signaling
volumes.
[0011] FIG. 1B shows functional connections between the
nodes of Fig. 1A.
[0012] FIG. 2 illustrates one exemplary implementation of
a system for analyzing a networked system and associated
processes for a network mapping algorithm.
[0013] FIG. 3 depicts multiple modules for analyzing
complex networks.
[0014] FIG. 4 is a flow diagram of a network mapping
algorithm.
[0015] FIG. 5 is a detailed flow diagram of a network
mapping algorithm.
-3-
CA 02674361 2009-06-30
WO 2008/058263 PCT/US2007/084182
Detailed Description
[0016] The characterization, classification, and analysis
of complex networks using graph theoretical, statistical,
and correlation methods provide descriptive and predictive
insight into their behaviors. Various graph theoretical,
statistical, and correlation methods tend not to readily
provide an approach for determining or deriving the
spatiotemporal evolving functional structure of a network,
e.g., how the links between nodes that make up the network
connect to each other in space and time. Given the very
large number of potential links in a complex network, it
may not be practical or possible to individually probe for
the existence of all individual connections between nodes.
Various statistical methods for analysis of networks
require knowledge of a large number of connections to
provide valid analysis and this knowledge can be difficult
to obtain for a complex network. Many statistical methods
are designed to derive only the probability of a
connection between nodes of a network and are not capable
of deriving the functional structure of the network.
[0017] The functional structure of a network can be
defined as a product of the network's internal states
(e.g., which nodes or vertices in the network were
recently active and when they can be re-activated) and the
history of how the network was stimulated (e.g.,
activating different starting nodes may produce different
patterns of activated links). As such, the functional
structure of a network at any given moment can be distinct
from the static physical structural map of existing links.
The information in the functional structure directly takes
into account the dynamic temporal evolution of signaling
events in the network as a function of the spatial
relationship between nodes and therefore the spatial
topology of the network, considerations that are usually
-4-
CA 02674361 2009-06-30
WO 2008/058263 PCT/US2007/084182
not taken into account by graph theory and related
approaches. The functional structure can be different from
the concept of periodic and cyclic motifs that describe
potential functional loops in networks but do not
distinguish what links are active at any given moment. The
functional structure can be represented by a connection
map or connectivity map which includes data of the
spatiotemporal evolution of the functional topology or
structure of the nodes in the networked system.
[0018] The dynamic functional structure of a network as
presented here can be deterministically mapped by taking
into account the signaling speed with which signals
propagate between nodes, the delay time between when a
node receives a signal and when the node begins to
propagate the signal on to other nodes, a refractory
period during which a node cannot be re-activated, and the
spatial organization of nodes relative to each other. The
parameters used in the mapping can be measured or
estimated by qualitatively observing signaling events in
the network.
[0019] Fig. 1A depicts one exemplary configuration of a
complex network of vertices or nodes and associated
potential signal propagations between those vertices. The
physical locations of the vertices can be in a two
dimensional plane or in a three dimensional volume.
Vertices 110-115 can be implemented in various
configurations, including, but not limited to,
interconnects, circuit nodes, neurons, digital processors
such as Internet routers, content objects in a computer
database, etc.
[0020] A signaling model can be used to determine the
functional connections between vertices 110-115. The model
can describe the time for a signal to propagate between a
first vertex and a second vertex. When the functional
-5-
CA 02674361 2009-06-30
WO 2008/058263 PCT/US2007/084182
connections are unknown, all potential paths for signal
propagation have to be considered in order to determine
the actual paths of the signal propagation. In the example
in Fig. 1A, these potential paths are contained in the
concentric circles centered on the vertices.
[0021] Signals can spread from vertices within the growing
circles, referred to as signaling volumes (or signaling
areas or signaling surfaces), in two dimensional networks
and spheres in three dimensions with Ay as the thickness
of the perimeter of the expanding circle in two dimensions
or shell in three dimensions. The vertices 110-115 are
connected by edges whose physical dimensions represent the
shortest Euclidian distance between the pair of vertices.
The activation time of a particular vertex sets the
initial time reference for the circles centered about the
vertex. The growth rate, i.e., rate of change, of a
signaling volume represents the signaling speed of the
network. The growth rate can be a constant value, a
scalar, or vector valued function. Vertex 110 is the first
vertex to be activated in the network. Circles surrounding
vertex 110 discretely indicate growing signaling volumes
with larger radii indicating a signaling volume where
greater time has elapsed. Signaling volumes grow
continuously, but, for the sake of clarity, the signaling
volumes are discretely shown as circles in Fig. 1A.
[0022] A functional connection between two vertices, also
called an edge or a connection link, is established when a
vertex goes from being inactive to active at the same
moment (within a Ay tolerance) a signaling volume reaches
the vertex from a previously activated vertex. Hence, when
a potential signal reaches a vertex and the vertex becomes
activated, a functional connection is assumed to exist
between the vertex that propagates the signal to the newly
activated vertex.
-6-
CA 02674361 2009-06-30
WO 2008/058263 PCT/US2007/084182
[0023] Fig. 1B depicts an example of a deterministic
mapping showing the functional connections 120-124 based
on the network's dynamics of Fig 1A. When a signaling
volume centered around vertex 110 reaches vertex 111 and
vertex 111 becomes activated, where vertex 111 has not
previously been activated, an edge 121 is created between
vertices 110 and 111 in the mapping. When the signaling
volume expands further and vertex 112 becomes activated,
edge 120 is created between vertices 110 and 112 in the
mapping. When vertex 111 becomes activated, the vertex 111
starts a new signal propagation. When the signaling volume
from vertex 111 reaches vertex 113 and vertex 113 becomes
active, an edge 122 is created between vertices 111 and
113. This process continues for the remaining vertices of
the figure.
[0024] A system for analyzing a networked system can be
constructed to include an imaging module to process a set
of sequential images of a networked system to determine
locations of nodes and activation times of the nodes in
the networked system. This system can include a mapping
module in communication with the imaging module to
generate network connections based on the determined
locations of the nodes and the determined activation times
of the nodes in the networked system. In one
implementation of this system, a simulation module can be
provided to be in communication with the mapping module to
use the generated network connections to simulate the
networked system to produce a set of sequential images of
the simulated networked system and to compare the set of
sequential images of the simulated networked system to the
set of sequential images of the networked system. Such a
system can be used in various applications to analyze
complex networked systems and to construct artificial
networked systems.
-7-
CA 02674361 2009-06-30
WO 2008/058263 PCT/US2007/084182
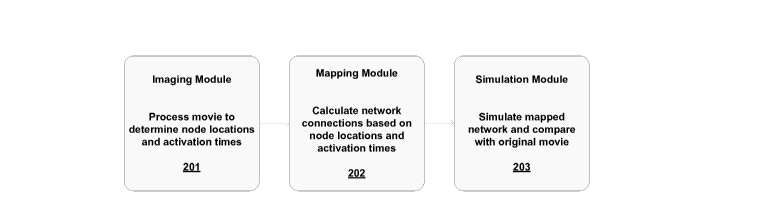
[0025] Fig. 2 illustrates one exemplary implementation of
a system for analyzing a networked system and associated
processes for a network mapping algorithm. This system can
be implemented in a single computer or two or more
networked computers. The imaging module 201 processes a
movie to determine node locations and activation times.
The movie captures network activity over a period of time.
The period of time can be configured by the user. The
movie can be a series in time of photographs of a complex
network that capture node activity within the network.
Individual photographs can be referred to as frames. In
other embodiments, a frame can contain true/false
indications of node activity for each node in the network
at a particular time and a spatial description of each
node; in other embodiments, the spatial description can be
stored in a metadata file associated with the movie and
not in every frame of the movie. The imaging module 201
can be configured to monitor the frames of a movie to
generate an activation state matrix (indexed by node id
and frame time stamp). The activation state matrix
specifies the time and location of node activations. The
mapping module 202 can take as input the node locations
and the activation matrix determined by the imaging module
202. The mapping module 202 applies a mapping algorithm to
derive the dynamic functional structure of the network.
The structure contains the functional links (edges)
between the nodes and can be referred to as the edge
matrix or the connection map. In the simulation module
203, a user can simulate the mapped network and compare
the mapped network with the original movie.
[0026] Fig. 3 depicts one implementation of a series of
processes needed for an analyzing a complex network where
the network contains biological neurons (cells). These
biological neurons have been treated with a chemical to
-8-
CA 02674361 2009-06-30
WO 2008/058263 PCT/US2007/084182
give off light when activated which can be captured by a
movie. Step 300 captures a movie of a network such as a
sequence of images of the network over time at different
times or a time lapse series of photographs of the treated
neurons or a continuous video stream of the network. In
step 301, a user can identify a region of interest (ROI)
within the movie. A user can configure the algorithm to
process either a subset of the nodes shown in the movie or
all of the nodes shown in the movie. A user can select a
different ROI and rerun the analyze. Step 303 determines
the cell centroid locations (spatial description) and
further derives the set of node locations. From the
spatial description of the nodes, a Cartesian distance
between the nodes can be computed. Step 302 analyzes each
frame and for each frame computes the cell intensities for
all of the frame's cells. The intensity is a measure of
light given of by a cell. Step 304 translates each of the
cell's light intensity of step 302 into a binary
indication of the cell's state: activated or not
activated. A threshold value can be used to determine
whether a cell's light intensity merits an activated
indication. Step 304 then takes the cell state
information for each frame and constructs the activation
state matrix. Step 305 receives an input parameter range
for each parameter of the mapping algorithm.
[0027] The mapping algorithm 306 can contain three steps
307-309. In step 307, a user selects an initial set of
parameters within the input range. Step 308 executes the
core mapping algorithm where the algorithm analyzes the
activation state matrix based on the set of parameters to
produce an edge matrix containing the functional links
between the cells. In optional step 309, step 309 can be
used to optimize the parameters selected in step 307 and
step 308 can be rerun using the optimized parameters.
-9-
CA 02674361 2009-06-30
WO 2008/058263 PCT/US2007/084182
Simulated annealing can be used to perform the
optimizations.
[0028] Steps 310-312 cover post-processing of the edge
matrix generated by the mapping algorithm. In step 310, a
user can overlay the edge matrix over the cells of the
movie to illustrate the propagation of signals through the
network (an overlay animation). In step 311, a user can
extract sample frames from the overlay animation for
display. In step 312, a user can compare the mapped
network with known network classes.
[0029] The following describes one example of the mapping
algorithm. The algorithm can be configured to operate on a
graph G comprising a set of network vertices V and a set
of connections between those vertices. The algorithm will
generate an edge matrix E. Vertex locations can be
specified in either two or three dimensional points. Vi
refers to the spatial coordinates of vertex i. One of the
inputs to the algorithm is the activation state matrix A
generated by the imaging module 201. Matrix A contains the
states of each vertex i at each discretely sampled time
frame k, with elements aik defined as follows:
1. 3 f ~~'1l;":~. t~'~:~_j:ÃTii~ w .~:a ~.9 ~~' :i~ 1~.!'w PoE.t3F.
[0030] Once a vertex becomes active, the vertex can
propagate a signal to other vertices. A signaling model
can describe how signals travel between vertices. The
signaling model contains a signaling surface that is
initially zero in surface area or volume. The signaling
surface will propagate through space with a finite speed
after the signaling event occurs. The signal can travel in
any or all directions and can terminate at some distance
-10-
CA 02674361 2009-06-30
WO 2008/058263 PCT/US2007/084182
from or time after activation. The signaling surface
originating at vertex i can be defined as:
s .jT
1'~ = 1 .i=
~, #+~...a .t~t~ ~.'~
.. \ . . .. . ~
[0031] Here Si(Vi, x, t) describes the surface in space
where the signal from vertex Vi can be at time t, given an
activation event of the vertex at time t = 0. f(x, t) is a
non-negative, spatially (x) and temporally (t) variant
signaling function which is 0 at time 0. Thus at time t
0, Si equals the starting point of the signal, Vi. The
activation event of a vertex happens when the vertex is
capable of being activated and the vertex receives a
signal from one or more vertices. In one embodiment,
vertex activation requires a signal from only one
different vertex and activation is followed by a
refractory period p in which no other activations of the
vertex can occur.
[0032] In an alternative representation of Si, Si can be a
function of the originating vertex Vi and time. The
function r(t) represents a sphere with linearly growing
radius of rate ~, following a delay a from the moment of
activation:
r
F~ , it'. 2: .E t -_ t[ i 1i t < 4
, - ~ c
~.. w ... _ .____ . =___= l.i :1,~ ~
Then:
[0033] Time t is relative to the moment of activation of
the vertex Vi and r(t) = 0 for the duration of the delay a.
Time is bound between 0 and a maximum value tmaxr when the
signaling surface reaches a maximum radius rmax. The
inverse of function r is function f. Function f represents
the time it would take a signaling surface to reach a
-11-
CA 02674361 2009-06-30
WO 2008/058263 PCT/US2007/084182
particular radius r: f(r) = a+ r/(3 and tmaX = f(rmaX) .
Table 1 summarizes a portion of the algorithm's input
parameters:
Parameter llni~~ Description
P Ur~~~ fta m~~~ ~~~~~act~ry period after actÃv-atioÃ~
trr~~:~e .~{=~:1~~~s si~~Ã~~~i ~~f~~pa`~
.~.tio~~ dpiiy ~.#~'er4~.~~fi~<r~t~~~~
~o&,P/&4ia1vP 'frames iiÃ~ear rate ~~ ~igriai .~~~~~agw~~on
Pi:~els-. Ma-XIMUM sj~~~~~ :~~~rf~Ce :ra:~i~~s
a,t
~abie 1 : Model ~~~~ameters
[0034] Next the signaling model can be applied to all
possible pairs of vertices whether they exist or not by
computing a timing matrix T. The value of matrix element
tij represents the time a signal takes to propagate from
vertex i to vertex j. The value of tijis expressed by tj=
f ( I I U, - Uj I I) where f takes as input the Cartesian
distance between the two vertices.
[0035] Functional connections can be made between two
vertices if the timing difference between their
activations is within some tolerance (tol or Ay) of the
timing difference stored in matrix T. The tolerance can be
configured by a user using knowledge of the network under
consideration. The tolerance can take into consideration
the statistical noise associated with a specific ligand-
receptor interaction in a cell or hardware response time
of a router in the internet. For example, assume a cell's
activation is delayed (either actually or the instrument
measuring the cell is delayed in processing the
activation) from when the signaling volume reaches the
cell, then the tolerance factor would compensate for this
delay.
-12-
CA 02674361 2009-06-30
WO 2008/058263 PCT/US2007/084182
[0036] Functional connections are introduced to the
initially empty edge matrix E as follows:
for all combinations of starting time frame p, ending time
frame q, starting vertex i, and ending vertex j where the
following conditions are met from the activation state
matrix A:
Thus, for two vertices i and j, with activation times p
and q, a directed edge from i to j is created if the
timing offset between their activations is within some
acceptable tolerance of the modeled timing stored in the
matrix T.
[0037] The refractory period parameter p is not used
directly in the mapping algorithm when the other
parameters of Table 1 are known. When any or all of the
parameters are unknown, p can be used during the
optimization phase 309.
[0038] Fig. 4 depicts one example of a mapping algorithm
used to generate an edge matrix. In step 401, the
algorithm takes as input a activation state matrix and
node locations. Other inputs can include the delay time,
signaling speed, rmaxr and tolerance parameters. In step
402, the algorithm iterates through the frames that were
used to make up the activation state matrix. At this step,
the frames are referred to as start frames. In step 403,
the end frames are determined for the current start frame.
-13-
CA 02674361 2009-06-30
WO 2008/058263 PCT/US2007/084182
The end frames come after a current start frame. The
algorithm loops through the end frames. Step 404 generates
pairs of vertex activations from a current start frame to
a current end frame. For each pair, step 405 will add an
edge in the edge matrix between the vertices of the pair
if a timing criteria is satisfied. At step 406, the
algorithm will loop through the various loops until
completion. When completed in step 407, the generation of
the edge matrix is finished.
Fig. 5 illustrates a detailed flow chart of one embodiment
of the network mapping algorithm. The algorithm takes as
input the locations of n vertices in a vector V, an
activation state matrix of size n x m where m is the
number of frames and n is the number of vertices,
parameters a, ~, rmax as described in table 1, and a
tolerance parameter tol in step 501. Step 502 calculates
the timing matrix T, where each element tij is computed as
previously described. Step 503 initializes all elements
of an edge matrix E of size n x n to zero. Step 504 loops
over each frame index from 1 to m with p being the
iterator. Step 505 loops from p + 1 to minimum (m, s +
tmax) with q being the iterator. As previously mentioned,
tmax = f(rmax) . At the time index of p, Step 506 loops
through all of elements of A*p that are equal to 1 with i
being the iterator. At the time index of q, Step 507 loops
through all of the elements of A*q that are equal to 1 with
j being the iterator. At step 508, the absolute value of
the difference between tij and the difference between q and
p is computed and is expressed by I (q-p) - tij I . If the
absolute difference is less than the tolerance value, tol,
then step 509 occurs, otherwise the loop continues at step
510. If the comparison is true in step 508, eij is set to 1
in step 509 otherwise eij remains at 0. If the loop of 507
is finished, then control flows back to the loop of 506.
-14-
CA 02674361 2009-06-30
WO 2008/058263 PCT/US2007/084182
If the loop of 506 is finished, then control flows back to
the loop of 505. If the loop of 505 is finished, then
control flows back to 504. If 504 is finished, then return
E to the caller of the algorithm.
=. `r ~~, il%t~4~'+
< f9l '`-\: 'y!ir .:.=i;3 ;C ~,.~y ~. _,
The following describes one particular mathematical
expression of an algorithm to determine a functional
mapping. The position of vertex i in space (e.g. pi =(xi,
yi, zi)) can be represented by pi. An expanding volume,
whose surface represents the region of active signaling,
begins at the moment of vertex i activation nati and is
defined as:
where T= t- nati. The signaling volume Vi(z) is bounded
for values of t so that the signaling volume is positive
and limited to a maximum radius rmax for all vertices. rmax
is the maximum length an edge can take between any two
vertices; rmax is can be a known or measurable network
specific parameter. In one implementation, rmax can be the
maximum diffusion distance of a signaling molecule between
neurons. In another implementation, rmax can be the
effective distance between routers in the Internet. S(z)
is the effective radius of the expanding volume that takes
into account the tolerance Ay and is defined as
<
~y I t ) - ~, R, < y ,~ =rr ~ ~ ~
_..
r(t) is the positive time dependent expanding radius of
the volume with r(t) ~ rmax given by
-15-
CA 02674361 2009-06-30
WO 2008/058263 PCT/US2007/084182
f
where f(t) is the speed of the expanding signaling volume.
In some network systems there can be a delay between
receiving a signal and sending a signal. If a delay time D
is assumed, defined as the time delay between the arrival
of a signal at a vertex and the signals subsequent
propagation to other vertices, r(t) becomes
+rr
[0039]
[0040] In other implementations of a complex network, a
signal speed f(t) can vary across vertices. In such
inhomogeneous networks, fi(t) can be defined for each
vertex i which results in a set of inhomogeneous vertex
dependent signaling volumes Vi(t) given by ri(t). In this
embodiment an edge eij can be mapped if
P;r,`, E v
If a vertex pj which activates at time natj is in the set of
points describing the expanding shell Vi(t), then the edge
eij can be mapped.
[0041] A graph, G = (V, E), can contain a set V of n
vertices and a set E of edges between those vertices. E is
matrix of size n x n, where an element of E, eij,, denotes
a directed edge from vertex i to vertex j if the value of
the element is 1. T represents a timing matrix where an
element, tij, represents the time that a signal would take
to propagate from vertex i to vertex j based upon the
-16-
CA 02674361 2009-06-30
WO 2008/058263 PCT/US2007/084182
signaling model regardless of a physical connection
existing or not between the two vertices. A vertex
activation time matrix is represented by F (size n x m) in
which fvt describes the state of vertex v at time t. The
value of an element of F can either be active (1) or
inactive (0). However in other embodiments, other values
for elements of F are possible. The imaging module 201
can be configured to produce the vertex activation time
matrix. A frame denotes a particular time slice (all
elements of a time index) of F. For each frame k in F, naVk
denotes the set of newly active vertices (changing state
from 0 to 1) and can be referred to as the activation set.
The sets of newly active vertices at frames s and e, naVs
and naVe, where s ranges from 1 to m and e ranges from s +
1 to m or s + viewframes. Viewframes is the timing matrix
equivalent of rmax= Frame s is the starting or reference
frame of when a signal originates at a given vertex. Frame
e is the ending frame that starts at s + 1 and ranges to
viewframes. The maximum length of an edge is bounded by
viewframes. Each set naVe from s to viewframes keeps track
of newly activated vertices in frame e. The time deference
between s and e is given by b= e - s. s is iterated from
1 to m - 1 (one frame less than the length of the movie)
and for each value of s, e is iterated from s + 1 to s +
viewframes or until the end of the movie. T represents an
observed timing matrix with the following definition for
the matrix elements:
,, na
~ .~~~ ~~~: r ~~Il ~.~~r~.itjii l~~lIS f t~~id Vre
~.~t.~~envise,
17
CA 02674361 2009-06-30
WO 2008/058263 PCT/US2007/084182
with i being the vertex index in contained in naVs and j
the vertex index contained in naVe. T is the same size as T
(n x n). By comparing the set of all vertices in the
network activated as given by T with the calculated timing
matrix T that describes when vertices can be activated,
and iterating over the entire evolving network, the
functional links that connect vertices can be calculated.
[0042] The following describes one example of the mapping
algorithm called NodeTrac. The mapping module 202 can be
configured to run NodeTrac. The algorithm generates a
network structure based on the activation times and
locations of individual nodes. When a node (vertex) is
activated, a signaling circle of constant growth rate
emanates from the node center. The node activation times
and growing signaling circles are color coded with respect
to time. If a node activates at the same time as a
signaling circle from a previously activated node, then
the algorithm adds a connection between the nodes. In
regards to FIG. 1A, for two nodes to be connected, e.g.,
node 110 and node 111, the node color (the node's
activation time) and a signaling circle from another node
must intersect and have the same color (time) in order to
have a connection. The computed network connections from
this algorithm are similar to those shown in Fig. 1B.
[0043] Define N as the set of nodes (vertices) in the
network. Each Ni is a vector containing the x and y
coordinates of the node relative to the viewport origin.
Where the viewport refers to the frame dimensions of the
movie. Define D as the distance matrix. Dij is the
Cartesian distance between two nodes in the network and
can be alternatively expressed by distij. Define signal
function Tij = deltime + sigSpeed * distj. Tij specifies
the time for the signal to propagate from node i to node
j. The time delay is represented by deltime and the
-18-
CA 02674361 2009-06-30
WO 2008/058263 PCT/US2007/084182
signaling speed by sigSpeed. Define Fnt as the matrix
containing the individual node activation states where n
is the node id and t is the frame number. An element of F
can take on the following values 1 (ACTIVE), 0 (INACTIVE),
and -1 (INHIBITED). In other embodiments of the algorithm
more or less values can be permitted. Define E as the
connectivity matrix. A directed link from node i to node j
is indicated by Eij equaling 1.
[0044] The following is a pseudo-code description of the
network mapping algorithm, NodeTrac, implemented in the
mapNet method.
function mapNet(Matrix F, Vector N, sigspeed, delTime)
determine the viewport size (can also be passed in as a parameter)
sizex = max(Nx)
sizey = max(Ny)
setup the estimated network with given node positions and viewport
generate the D distance matrix for all nodes
define a timing matrix: Tij = delTime + Dij / sigSpeed
define the maximum view frame window viewfrs
viewfrs = delTime + sqrt(sizex-2 + sizey^2)*sigSpeed
for(f from 0 to #frames)
fromnodes = newly activated nodes at frame f
foreach(node in fromnodes)
for(nf from f to f+viewframes) -lookahead for future
active nodes
tonodes = newly activated nodes at frame nf
foreach(fnode in fromnodes AND tnode in tonodes)
if (nf - f = Ttnode , f node) then
add link between tnode and fnode in
network
endif
end foreach
end for
end foreach
end for
[0045] The first step in the mapping algorithm is the
generation of a timing matrix T, that holds the times a
signal would take to go from one node to another. T is
defined as Tij = delTime + Dj/sigSpeed where delTime is the
time between a node receiving a signal and the node
passing a signal to the connected cell(s), and sigSpeed is
the signal speed. delTime can be in time units and
sigSpeed can be in units of distance units over time
unites.
-19-
CA 02674361 2009-06-30
WO 2008/058263 PCT/US2007/084182
[0046] The next step involves looping twice through the
frames matrix, first to determine source nodes and second
to determine target nodes. The primary loop parses the
entire matrix, while the secondary loop only looks ahead
viewframes, which is the maximum time that a signal would
take to diagonally traverse the viewport: viewframes =
delTime + sqrt(sizex2 + sizey2) /sigSpeed.
[0047] The newly activated nodes of any frame are the
nodes which became active in that frame. Nodes may stay
active for more than one frame, but only the activation
time is taken into account. From the primary frame loop a
list of newly active nodes is generated, fromnodes, while
tonodes is the list of newly active nodes for each frame
in the secondary loop. A link exists for each node in
fromnodes to each node in tonodes if the time delta
between the primary and secondary loop counters is within
tolerance of the T matrix for that from/to node
combination. In other words, if signaling time between
node a and b as observed in the movie matches a distance
based signaling model, then a link between a and b can
exist.
[0048] Mapped subgraphs can be added together to provide a
more accurate mapped network. One approach to determining
real networks connectivity, for example, is adding
together subgraphs generated from movies with different
starting nodes (points). Better results can be obtained
using multiple short movies of the same node, activated at
different locations. The resulting mapped networks from
these movies can be added together to form a larger
network graph that is more accurate and more complete.
[0049] In one embodiment of the mapping algorithm, the
delay time and signaling parameters can be solved for by
using linear algebra and the signaling model of Tij: Tij _
delTime + Dj/sigSpeed.
-20-
CA 02674361 2009-06-30
WO 2008/058263 PCT/US2007/084182
[0050] For a given node i, a set of two or more additional
nodes that have different distances and signaling times
from i can form a set of equations that can be used to
solve for delTime and sigspeed.
[0051] It is useful for a user of the mapping algorithm to
simulate the network as previously described in the
simulation module 203. The simulation module can be
configured to measure accuracy. Accuracy can be defined as
follows:
a t
~J.+~M ~c~ i+~ ' Pt~ ~ Fir3i~~~~~?~~ ~"Q. dF ~:.1 - iit}i~~ ~/^{ t~+ r'~`,rirY
i
t}~~ y',~~ ~
~' ~ . { ;., ~: Lõ
~ ,
d ~~cv. ~ -
Ac~~t::
~.s.~~i. g
~+ i ~.~~~~j,~pl~~ij+' ~J44 es
do+~
[0052] In one embodiment of the optimization step 309,
simulated annealing can be used to determine the
parameters used in the network mapping step 308. Simulated
annealing involves the dynamic simulation of the mapped
network to obtain a simulated activation state matrix, the
comparison of the simulated to the observed activation
state matrix, and the optimization of the parameters to
minimize the difference between the observed and modeled
activation state matrices.
[0053] An allowable range can be established for each
parameter being optimized of the signaling model; initial
values can be chosen at random within that range. With the
initial values, a network edge matrix can be obtained
using a mapping algorithm. Using the same activation and
signaling model used for mapping and with a refractory
period, a simulated activation state matrix A' can be
constructed starting with the same initial state as in the
observed activation state matrix A. If one vertex is
initially active in A at the first frame, then that vertex
-21-
CA 02674361 2009-06-30
WO 2008/058263 PCT/US2007/084182
will be active in A' and be the seed vertex for A'. All
vertices connected to the seed vertex will be activated at
later times based on the signaling speeds, delay times,
and distance from seed vertex, thus propagating a signal
through the network, using only the edges mapped in E. A'
will be of the same dimensions as the observed state
matrix A, and the initial state of A' will be the same as
A, implying that the first columns of A' will be set equal
to A.
[0054] By comparing the observed and simulated state
matrices A and A', we can obtain a fitness metric of the
mapping and of the parameters used in the mapping. Because
simulated annealing is the optimization algorithm for this
embodiment, the fitness metric is the energy function and
a perfect match can be obtained when A' = A which means
that the energy function will be zero. Because both A' and
A can be sparse matrices with values of 0 or 1, one
approach is to smooth out the active frames aif = 1 over
multiple frames using a Gaussian filter g, thus making the
definition of an energy function U more suitable for
minimization:
t. ,?a
}F' _ {[t
~lT J~f ' =
[0055] Taking the difference of the signals between
observed and simulated activation states for a particular
vertex, convolving the outcome with a smoothing Gaussian,
then taking the absolute value and summing the resultant
vector across all frames of that vertex produces a non-
negative metric of closeness between the two signals. If
the observed and simulated activation states for that
vector match, the vertex energy is zero and the vertex
energy increases with increasing distance between the
-22-
CA 02674361 2009-06-30
WO 2008/058263 PCT/US2007/084182
activation times. The total energy U is the sum of the all
the individual vertex energies, and ranges from zero when
a perfect match is achieved up to Umax where no edges were
mapped and thus A' is also empty. Since the area under a
Gaussian filter is 1, and A' = 0:
~... _
aE:st
_ai ; _:1
[0056] By having an energy measure of the mapping
algorithm that compares the observed activation states
with the simulated activation states from the mapped
network, the optimization step anneals the parameters to a
value which minimizes the energy and thus optimizes the
mapping. Through this step, the network connectivity map
and the signaling model parameters, among other
parameters, can be obtained.
[0057] The disclosed and other embodiments and the
functional operations described in this specification can
be implemented in digital electronic circuitry, or in
computer software, firmware, or hardware, including the
structures disclosed in this specification and their
structural equivalents, or in combinations of one or more
of them. The disclosed and other embodiments can be
implemented as one or more computer program products,
i.e., one or more modules of computer program instructions
encoded on a computer readable medium for execution by, or
to control the operation of, data processing apparatus.
The computer readable medium can be a machine-readable
storage device, a machine-readable storage substrate, a
memory device, a composition of matter effecting a
machine-readable propagated signal, or a combination of
one or more them. The term "data processing apparatus"
encompasses all apparatus, devices, and machines for
-23-
CA 02674361 2009-06-30
WO 2008/058263 PCT/US2007/084182
processing data, including by way of example a
programmable processor, a computer, or multiple processors
or computers. The apparatus can include, in addition to
hardware, code that creates an execution environment for
the computer program in question, e.g., a code that
constitutes processor firmware, a protocol stack, a
database management system, an operating system, or a
combination of one or more of them. A propagated signal
is an artificially generated signal, e.g., a machine-
generated electrical, optical, or electromagnetic signal,
that is generated to encode information for transmission
to suitable receiver apparatus.
[0058] A computer program (also known as a program,
software, software application, script, or code) can be
written in any form of programming language, including
compiled or interpreted languages, and it can be deployed
in any form, including as a stand alone program or as a
module, component, subroutine, or other unit suitable for
use in a computing environment. A computer program does
not necessarily correspond to a file in a file system. A
program can be stored in a portion of a file that holds
other programs or data (e.g., one or more scripts stored
in a markup language document), in a single file dedicated
to the program in question, or in multiple coordinated
files (e.g., files that store one or more modules, sub
programs, or portions of code). A computer program can be
deployed to be executed on one computer or on multiple
computers that are located at one site or distributed
across multiple sites and interconnected by a
communication network.
[0059] The processes and logic flows described in this
specification can be performed by one or more programmable
processors executing one or more computer programs to
perform functions by operating on input data and
-24-
CA 02674361 2009-06-30
WO 2008/058263 PCT/US2007/084182
generating output. The processes and logic flows can also
be performed by, and apparatus can also be implemented as,
special purpose logic circuitry, e.g., an FPGA (field
programmable gate array) or an ASIC (application specific
integrated circuit).
[0060] Processors suitable for the execution of a computer
program include, by way of example, both general and
special purpose microprocessors, and any one or more
processors of any kind of digital computer. Generally, a
processor will receive instructions and data from a read
only memory or a random access memory or both. The
essential elements of a computer are a processor for
performing instructions and one or more memory devices for
storing instructions and data. Generally, a computer will
also include, or be operatively coupled to receive data
from or transfer data to, or both, one or more mass
storage devices for storing data, e.g., magnetic, magneto
optical disks, or optical disks. However, a computer need
not have such devices. Computer readable media suitable
for storing computer program instructions and data include
all forms of non volatile memory, media and memory
devices, including by way of example semiconductor memory
devices, e.g., EPROM, EEPROM, and flash memory devices;
magnetic disks, e.g., internal hard disks or removable
disks; magneto optical disks; and CD ROM and DVD-ROM
disks. The processor and the memory can be supplemented
by, or incorporated in, special purpose logic circuitry.
[0061] To provide for interaction with a user, the
disclosed embodiments can be implemented on a computer
having a display device, e.g., a CRT (cathode ray tube) or
LCD (liquid crystal display) monitor, for displaying
information to the user and a keyboard and a pointing
device, e.g., a mouse or a trackball, by which the user
can provide input to the computer. Other kinds of devices
-25-
CA 02674361 2009-06-30
WO 2008/058263 PCT/US2007/084182
can be used to provide for interaction with a user as
well; for example, feedback provided to the user can be
any form of sensory feedback, e.g., visual feedback,
auditory feedback, or tactile feedback; and input from the
user can be received in any form, including acoustic,
speech, or tactile input.
[0062] The disclosed embodiments can be implemented in a
computing system that includes a back end component, e.g.,
as a data server, or that includes a middleware component,
e.g., an application server, or that includes a front end
component, e.g., a client computer having a graphical user
interface or a Web browser through which a user can
interact with an implementation of what is disclosed here,
or any combination of one or more such back end,
middleware, or front end components. The components of
the system can be interconnected by any form or medium of
digital data communication, e.g., a communication network.
Examples of communication networks include a local area
network ("LAN") and a wide area network ("WAN"), e.g., the
Internet.
[0063] A computer system for implementing the disclosed
embodiments can include client computers (clients) and
server computers (servers). A client and a server are
generally remote from each other and typically interact
through a communication network. The relationship of
client and server can arise by virtue of computer programs
running on the respective computers and having a client-
server relationship to each other.
[0064] While this specification contains many specifics,
these should not be construed as limitations on the scope
of any invention or of what may be claimed, but rather as
descriptions of features specific to particular
embodiments. Certain features that are described in this
specification in the context of separate embodiments can
-26-
CA 02674361 2009-06-30
WO 2008/058263 PCT/US2007/084182
also be implemented in combination in a single embodiment.
Conversely, various features that are described in the
context of a single embodiment can also be implemented in
multiple embodiments separately or in any suitable
subcombination. Moreover, although features may be
described above as acting in certain combinations and even
initially claimed as such, one or more features from a
claimed combination can in some cases be excised from the
combination, and the claimed combination may be directed
to a subcombination or variation of a subcombination.
[0065] Similarly, while operations are depicted in the
drawings in a particular order, this should not be
understand as requiring that such operations be performed
in the particular order shown or in sequential order, or
that all illustrated operations be performed, to achieve
desirable results. In certain circumstances, multitasking
and parallel processing may be advantageous. Moreover,
the separation of various system components in the
embodiments described above should not be understood as
requiring such separation in all embodiments, and it
should be understood that the described program components
and systems can generally be integrated together in a
single software product or packaged into multiple software
products.
[0066] Thus, particular embodiments have been described.
Other embodiments are within the scope of the following
claims.
-27-