Note: Descriptions are shown in the official language in which they were submitted.
CA 02676459 2011-07-19
METHOD AND APPARATUS FOR COLLECTING
DRILL BIT PERFORMANCE DATA
10 TECHNICAL FIELD
The present invention relates generally to drill bits for drilling
subterranean
formations and more particularly to methods and apparatuses for monitoring
operating
parameters of drill bits during drilling operations.
BACKGROUND
The oil and gas industry expends sizable sums to design cutting tools, such as
downhole drill bits including roller cone rock bits and fixed cutter bits,
which have
relatively long service lives, with relatively infrequent failure. In
particular,
considerable sums are expended to design and manufacture roller cone rock bits
and
fixed cutter bits in a manner that minimizes the opportunity for catastrophic
drill bit
failure during drilling operations. The loss of a roller cone or a
polycrystalline diamond
compact (PDC) from a fixed cutter bit during drilling operations can impede
the drilling
operations and, at worst, necessitate rather expensive fishing operations. If
the fishing
operations fail, sidetrack-drilling operations must be performed in order to
drill around
the portion of the wellbore that includes the lost roller cones or PDC
cutters. Typically,
during drilling operations, bits are pulled and replaced with new bits even
though
significant service could be obtained from the replaced bit. These premature
replacements of downhole drill bits are expensive, since each trip out of the
well
prolongs the overall drilling activity, and consumes considerable manpower,
but are
nevertheless done in order to avoid the far more disruptive and expensive
process of, at
best, pulling the drill string and replacing the bit or fishing and sidetrack
drilling
operations necessary if one or more cones or compacts are lost due to bit
failure.
CA 02676459 2012-04-03
2
With the ever-increasing need for downhole drilling system dynamic data, a
number of
"subs" (i.e., a sub-assembly incorporated into the drill string above the
drill bit and used to collect
data relating to drilling parameters) have been designed and installed in
drill strings.
Unfortunately, these subs cannot provide actual data for what is happening
operationally at the bit
due to their physical placement above the bit itself.
Data acquisition is conventionally accomplished by mounting a sub in the
bottom hole
assembly (BHA), which may be several meters to tens of meters away from the
bit. Data gathered
from a sub this far away from the bit may not accurately reflect what is
happening directly at the
bit while drilling occurs. Often, this lack of data leads to conjecture as to
what may have caused a
bit to fail or why a bit performed so well, with no directly relevant facts or
data to correlate to the
performance of the bit.
Recently, data acquisition systems have been proposed to install in the drill
bit itself.
However, data gathering, storing, and reporting from these systems has been
limited. In addition,
conventional data gathering in drill bits has not had the capability to adapt
to drilling events that
may be of interest in a manner allowing more detailed data gathering and
analysis when these
events occur.
There is a need for a drill bit equipped to gather and store long-term data
that is related to
performance and condition of the drill bit. Such a drill bit may extend useful
bit life enabling re-
use of a bit in multiple drilling operations and developing drill bit
performance data on existing
drill bits, which also may be used for developing future improvements to drill
bits.
DISCLOSURE OF THE INVENTION
The present invention includes a drill bit and a data analysis system disposed
within the
drill bit for analysis of data sampled from physical parameters related to
drill bit performance
using a variety of adaptive data sampling modes.
In one embodiment of the invention, there is provided a drill bit for drilling
a subterranean
formation, comprising:
a bit body bearing at least one cutting element;
a shank including a central bore formed therethrough, the shank secured to the
bit body
and adapted for coupling to a drillstring;
an end-cap configured for disposition in the central bore to form an annular
chamber in the shank between a wall of the central bore and a sidewall of the
end-cap;
at least one sensor disposed in the drill bit and configured for developing
sensor data by
sensing at least one physical parameter; and
a data analysis module disposed in the annular chamber formed between the wall
of the
central bore and the sidewall of the end-cap and comprising:
CA 02676459 2012-04-03
3
a memory; and
a processor operably coupled to the memory and the at least one sensor, the
processor configured for executing computer instructions, wherein the computer
instructions are
configured for:
collecting the sensor data by sampling the at least one sensor; and
determining at least one state of the drill bit responsive to the sensor data.
Another embodiment of the invention comprises an apparatus for drilling a
subterranean
formation including a drill bit and a data analysis module disposed in the
drill bit. The drill bit
carries at least one blade or cutter and is adapted for coupling to a drill
string. The data analysis
module comprises at least one sensor, a memory, and a processor. The at least
one sensor is
configured for sensing at least one physical parameter. The memory is
configured for storing
information comprising computer instructions and sensor data. The processor is
configured for
executing the computer instructions to collect the sensor data by sampling the
at least one sensor.
The computer instructions are further configured to analyze the sensor data to
develop a severity
index, compare the severity index to at least one adaptive threshold, and
modify a data sampling
mode responsive to the comparison.
Another embodiment of the invention includes a method comprising collecting
sensor data
at a sampling frequency by sampling at least one sensor disposed in a drill
bit. In this method, the
at least one sensor is responsive to at least one physical parameter
associated with a drill bit state.
The method further comprises analyzing the sensor data to develop a severity
index, wherein the
analysis is performed by a processor disposed in the drill bit. The method
further comprises
comparing the severity index to at least one adaptive threshold and modifying
a data sampling
mode responsive to the comparison.
Another embodiment of the invention includes a method comprising collecting
background data by sampling at least one physical parameter associated with a
drill bit state at a
background sampling frequency while in a background mode. The method further
includes
transitioning from the background mode to a logging mode after a predetermined
number of
background samples. The method may also include transitioning from the
background mode to a
burst mode after a predetermined number of background samples. The method may
also include
transitioning from the logging mode to the background mode or the burst mode
after a
predetermined number of logging samples. The method may also include
transitioning from the
burst mode to the background mode or the logging mode after a predetermined
number of burst
samples.
Another embodiment of the invention includes a method comprising collecting
background data by sampling at least one physical parameter associated with a
drill bit
CA 02676459 2009-07-20
WO 2008/106022 PCTIUS2008/002078
4
state while in a background mode. The method further includes analyzing the
background data to develop a background severity index and transitioning from
the
background mode to a logging mode if the background severity index is greater
than a
first background threshold. The method may also include transitioning from the
background mode to a burst mode if the background severity index is greater
than a
second background threshold.
DESCRIPTION OF THE DRAWINGS
FIG. I illustrates a conventional drilling rig for performing drilling
operations;
FIG. 2 is a perspective view of a conventional matrix-type rotary drag bit;
FIG. 3A is a perspective view of a shank, receiving an embodiment of an
electronics module with an end-cap;
FIG. 3B is a cross sectional view of a shank and an end-cap;
FIG. 4 is a drawing of an embodiment of an electronics module configured as a
flex-circuit board enabling formation into an annular ring suitable for
disposition in the
shank of FIGS. 3A and 3B;
FIGS. 5A-5E are perspective views of a drill bit illustrating example
locations
in the drill bit wherein an electronics module, sensors, or combinations
thereof may be
located;
FIG. 6 is a block diagram of an embodiment of a data analysis module
according to the present invention;
FIG. 6A illustrates placement of multiple accelerometers, which may be used,
by way of example, for redundancy, trajectory analysis, and combinations
thereof;
FIG. 6B illustrates an example of data sampled from a temperature sensor;
FIG. 6C is a perspective view showing an embodiment of placement of a
pressure activated switch in an end cap of the drill bit;
FIG. 6D is a perspective view of a fixed member portion of the pressure
activated switch of FIG. 6C;
FIG. 6E is a perspective view of a load cell including strain gauges bonded
thereon;
FIG. 6F is a perspective view showing an embodiment of placement of the load
cell in the bit body;
FIG. 7A is an example of a timing diagram illustrating various data sampling
modes and transitions between the modes based on a time based event trigger;
CA 02676459 2009-07-20
WO 2008/106022 PCT/US2008/002078
FIG. 7B is an example of a timing diagram illustrating various data sampling
modes and transitions between the modes based on an adaptive threshold based
event
trigger;
FIGS. 8A-8H are flow diagrams illustrating embodiments of operation of the
5 data analysis module in sampling values from various sensors, saving sampled
data, and
analyzing sampled data to determine adaptive threshold event triggers in
accordance
with the present invention;
FIG. 9 illustrates examples of data sampled from magnetometer sensors along
two axes of a rotating Cartesian coordinate system;
FIG. 10 illustrates examples of data sampled from accelerometer sensors and
magnetometer sensors along three axes of a Cartesian coordinate system that is
static
with respect to the drill bit, but rotating with respect to a stationary
observer;
FIG. 11 illustrates examples of data sampled from accelerometer sensors,
accelerometer data variances along a y-axis derived from analysis of the
sampled data,
and accelerometer adaptive thresholds along the y-axis derived from analysis
of the
sampled data;
FIG. 12 illustrates examples of data sampled from accelerometer sensors,
accelerometer data variances along an x-axis derived from analysis of the
sampled data,
and accelerometer adaptive thresholds along the x-axis derived from analysis
of the
sampled data;
FIG. 13 illustrates a waveform and contemplated time encoded signal
processing and recognition (TESPAR) encoding of the waveform in accordance
with
the present invention;
FIG. 14 illustrates a contemplated TESPAR alphabet for use in encoding
possible sampled data in accordance with the present invention;
FIG. 15 is a histogram of TESPAR symbol occurrences for a given waveform;
FIG. 16 illustrates a neural network configuration that may be used for
pattern
recognition of TESPAR encoded data in accordance with the present invention;
and
FIG. 17 is a flow diagram illustrating a contemplated software flow for using
a
TESPAR alphabet for encoding and pattern recognition of sampled data in
accordance
with the present invention.
CA 02676459 2009-07-20
WO 2008/106022 PCT/US2008/002078
6
MODE(S) FOR CARRYING OUT THE INVENTION
The present invention includes a drill bit and an electronics module disposed
within the drill bit for analysis of data sampled from physical parameters
related to drill
bit performance using a variety of adaptive data sampling modes.
FIG. I depicts an example of conventional apparatus for performing
subterranean drilling operations. Drilling rig 110 includes a derrick 112, a
derrick floor
114, a draw works 116, a hook 118, a swivel 120, a Kelly joint 122, and a
rotary table
124. A drill string 140, which includes a drill pipe section 142 and a drill
collar section
144, extends downward from the drilling rig 110 into a borehole 100. The drill
pipe
section 142 may include a number of tubular drill pipe members or strands
connected
together and the drill collar section 144 may likewise include a plurality of
drill collars.
In addition, the drill string 140 may include a measurement-while-drilling
(MWD)
logging subassembly and cooperating mud pulse telemetry data transmission
subassembly, which are collectively referred to as an MWD communication system
146, as well as other communication systems known to those of ordinary skill
in the art.
During drilling operations, drilling fluid is circulated from a mud pit 160
through a mud pump 162, through a desurger 164, and through a mud supply line
166
into the swivel 120. The drilling mud (also referred to as drilling fluid)
flows through
the Kelly joint 122 and into an axial central bore in the drill string 140.
Eventually, it
exits through apertures or nozzles, which are located in a drill bit 200,
which is
connected to the lowermost portion of the drill string 140 below drill collar
section 144.
The drilling mud flows back up through an annular space between the outer
surface of
the drill string 140 and the inner surface of the borehole 100, to be
circulated to the
surface where it is returned to the mud pit 160 through a mud return line 168.
A shaker screen (not shown) may be used to separate formation cuttings from
the drilling mud before it returns to the mud pit 160. The MWD communication
system 146 may utilize a mud pulse telemetry technique to communicate data
from a
downhole location to the surface while drilling operations take place. To
receive data at
the surface, a mud pulse transducer 170 is provided in communication with the
mud
supply line 166. This mud pulse transducer 170 generates electrical signals in
response
to pressure variations of the drilling mud in the mud supply line 166. These
electrical
signals are transmitted by a surface conductor 172 to a surface electronic
processing
system 180, which is conventionally a data processing system with a central
processing
CA 02676459 2009-07-20
WO 2008/106022 PCTIUS2008/002078
7
unit for executing program instructions, and for responding to user commands
entered
through either a keyboard or a graphical pointing device. The mud pulse
telemetry
system is provided for communicating data to the surface concerning numerous
downhole conditions sensed by well logging and measurement systems that are
conventionally located within the MWD communication system 146. Mud pulses
that
define the data propagated to the surface are produced by equipment
conventionally
located within the MWD communication system 146. Such equipment typically
comprises a pressure pulse generator operating under control of electronics
contained in
an instrument housing to allow drilling mud to vent through an orifice
extending
through the drill collar wall. Each time the pressure pulse generator causes
such
venting, a negative pressure pulse is transmitted to be received by the mud
pulse
transducer 170. An alternative conventional arrangement generates and
transmits
positive pressure pulses. As is conventional, the circulating drilling mud
also may
provide a source of energy for a turbine-driven generator subassembly (not
shown)
which may be located near a bottom hole assembly (BHA). The turbine-driven
generator may generate electrical power for the pressure pulse generator and
for various
circuits including those circuits that form the operational components of the
measurement-while-drilling tools. As an alternative or supplemental source of
electrical power, batteries may be provided, particularly as a back up for the
turbine-driven generator.
FIG. 2 is a perspective view of an example of a drill bit 200 of a fixed-
cutter, or
so-called "drag" bit, variety. Conventionally, the drill bit 200 includes
threads at a
shank 210 at the upper extent of the drill bit 200 for connection into the
drill string 140
(FIG. 1). At least one blade 220 (a plurality shown) at a generally opposite
end from
the shank 210 may be provided with a plurality of natural or synthetic
diamonds
(polycrystalline diamond compact) PDC cutters 225, arranged along the
rotationally
leading faces of the blades 220 to effect efficient disintegration of
formation material as
the drill bit 200 is rotated in the borehole 100 under applied weight on bit
(WOB). A
gage pad surface 230 extends upwardly from each of the blades 220, is proximal
to, and
generally contacts the side wall of the borehole 100 (FIG. 2) during drilling
operation of
the drill bit 200. A plurality of channels 240, termed "junk slots," extend
between the
blades 220 and the gage pad surfaces 230 to provide a clearance area for
removal of
formation chips formed by the PDC cutters 225.
CA 02676459 2009-07-20
WO 2008/106022 PCT/US2008/002078
8
A plurality of gage inserts 235 are provided on the gage pad surfaces 230 of
the
drill bit 200. Shear cutting gage inserts 235 on the gage pad surfaces 230 of
the drill bit
200 provide the ability to actively shear formation material at the side wall
of the
borehole 100 and to provide improved gage-holding ability in earth-boring bits
of the
fixed cutter variety. The drill bit 200 is illustrated as a PDC
(polycrystalline diamond
compact) bit, but the gage inserts 235 may be equally useful in other fixed
cutter or drag
bits that include gage pad surfaces 230 for engagement with the side wall of
the
borehole 100.
Those of ordinary skill in the art will recognize that the present invention
may
be embodied in a variety of drill bit types. The present invention possesses
utility in the
context of a tricone or roller cone rotary drill bit or other subterranean
drilling tools as
known in the art that may employ nozzles for delivering drilling mud to a
cutting
structure during use. Accordingly, as used herein, the term "drill bit"
includes and
encompasses any and all rotary bits, including core bits, roller cone bits,
fixed cutter
bits; including PDC, natural diamond, thermally stable produced (TSP)
synthetic
diamond, and diamond impregnated bits without limitation, eccentric bits,
bicenter bits,
reamers, reamer wings, as well as other earth-boring tools configured for
acceptance of
an electronics module 290.
FIGS. 3A and 3B illustrate an embodiment of a shank 210 secured to a drill bit
200 (not shown), an end-cap 270, and an embodiment of an electronics module
290 (not
shown in FIG. 3B). The shank 210 includes a central bore 280 formed through
the
longitudinal axis of the shank 210. In conventional drill bits 200, this
central bore 280
is configured for allowing drilling mud to flow therethrough. In the present
invention,
at least a portion of the central bore 280 is given a diameter sufficient for
accepting the
electronics module 290 configured in a substantially annular ring, yet without
substantially affecting the structural integrity of the shank 210. Thus, the
electronics
module 290 may be placed down in the central bore 280, about the end-cap 270,
which
extends through the inside diameter of the annular ring of the electronics
module 290 to
create a fluid tight annular chamber 260 (FIG. 3B) with the wall of central
bore 280 and
seal the electronics module 290 in place within the shank 210.
The end-cap 270 includes a cap bore 276 formed therethrough, such that the
drilling mud may flow through the end cap, through the central bore 280 of the
shank
210 to the other side of the shank 210, and then into the body of drill bit
200. In
CA 02676459 2009-07-20
WO 2008/106022 PCT/US2008/002078
9
addition, the end-cap 270 includes a first flange 271 including a first
sealing ring 272,
near the lower end of the end-cap 270, and a second flange 273 including a
second
sealing ring 274, near the upper end of the end-cap 270.
FIG. 3B is a cross-sectional view of the end-cap 270 disposed in the shank
without the electronics module 290 (FIG. 4), illustrating the annular chamber
260
formed between the first flange 271, the second flange 273, the end-cap body
275, and
the walls of the central bore 280. The first sealing ring 272 and the second
sealing ring
274 form a protective, fluid tight, seal between the end-cap 270 and the wall
of the
central bore 280 to protect the electronics module 290 (FIG. 4) from adverse
environmental conditions. The protective seal formed by the first sealing ring
272 and
the second sealing ring 274 may also be configured to maintain the annular
chamber
260 at approximately atmospheric pressure.
In the embodiment shown in FIGS. 3A and 3B, the first sealing ring 272 and the
second sealing ring 274 are formed of material suitable for high-pressure,
high
temperature environment, such as, for example, a Hydrogenated Nitrile
Butadiene
Rubber (HNBR) O-ring in combination with a PEEK back-up ring. In addition, the
end-cap 270 may be secured to the shank 210 with a number of connection
mechanisms
such as, for example, a secure press-fit using first and second sealing rings
272 and 274,
respectively, a threaded connection, an epoxy connection, a shape-memory
retainer,
welded, and brazed. It will be recognized by those of ordinary skill in the
art that the
end-cap 270 may be held in place quite firmly by a relatively simple
connection
mechanism due to differential pressure and downward mud flow during drilling
operations.
An electronics module 290 configured as shown in the embodiment of FIG. 3A
may be configured as a flex-circuit board, enabling the formation of the
electronics
module 290 into the annular ring suitable for disposition about the end-cap
270 and into
the central bore 280. This flex-circuit board embodiment of the electronics
module 290
is shown in a flat uncurled configuration in FIG. 4. The flex-circuit board
292 includes
a high-strength reinforced backbone (not shown) to provide acceptable
transmissibility
of acceleration effects to sensors such as accelerometers. In addition, other
areas of the
flex-circuit board 292 bearing non-sensor electronic components may be
attached to the
end-cap 270 in a manner suitable for at least partially attenuating the
acceleration
CA 02676459 2009-07-20
WO 2008/106022 PCT/US2008/002078
effects experienced by the drill bit 200 during drilling operations using a
material such
as a visco-elastic adhesive.
FIGS. 5A-5E are perspective views of portions of a drill bit illustrating
examples of locations in the drill bit 200 wherein an electronics module 290
(FIG. 4),
5 sensors 340 and 370 (FIG. 6), or combinations thereof may be located. FIG.
5A
illustrates the shank 210 of FIG. 3 secured to a bit body 231. In addition,
the shank 210
includes an annular race 260A formed in the central bore 280. This annular
race 260A
may allow expansion of the electronics module into the annular race 260A as
the
end-cap 270 (FIGS. 3A and 3B) is disposed into position.
10 FIG. 5A also illustrates two other alternate locations for the electronics
module 290, sensors 340, or combinations thereof. An oval cut out 260B,
located
behind the oval depression (may also be referred to as a torque slot) used for
stamping
the bit with a serial number may be milled out to accept the electronics. This
area could
then be capped and sealed to protect the electronics. Alternatively, a round
cut out
260C located in the oval depression used for stamping the bit may be milled
out to
accept the electronics, then may be capped and sealed to protect the
electronics.
FIG. 5B illustrates an alternative configuration of the shank 210. A circular
depression 260D may be formed in the shank 210 and the central bore 280 formed
around the circular depression 260D, allowing transmission of the drilling
mud. The
circular depression 260D may be capped and sealed to protect the electronics
within the
circular depression 260D.
FIGS. 5C-5E illustrate circular depressions (260E, 260F, 260G) formed in
locations on the drill bit 200. These locations offer a reasonable amount of
room for
electronic components while still maintaining acceptable structural strength
in the
blade.
An electronics module may be configured to perform a variety of functions.
One embodiment of an electronics module 290 (FIG. 4) may be configured as a
data
analysis module, which is configured for sampling data in different sampling
modes,
sampling data at different sampling frequencies, and analyzing data.
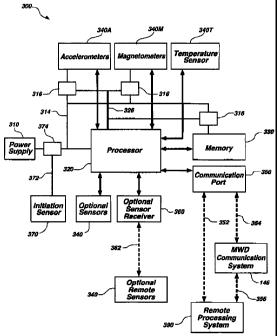
An embodiment of a data analysis module 300 is illustrated in FIG. 6. The data
analysis module 300 includes a power supply 310, a processor 320, a memory
330, and
a at least one sensor 340 configured for measuring a plurality of physical
parameter
related to a drill bit state, which may include drill bit condition, drilling
operation
CA 02676459 2009-07-20
WO 2008/106022 PCT/US2008/002078
11
conditions, and environmental conditions proximate the drill bit. In the
embodiment of
FIG. 6, the sensors 340 include a plurality of accelerometers 340A, a
plurality of
magnetometers 340M, and at least one temperature sensor 340T.
The plurality of accelerometers 340A may include three accelerometers 340A
configured in a Cartesian coordinate arrangement. Similarly, the plurality of
magnetometers 340M may include three magnetometers 340M configured in a
Cartesian coordinate arrangement. While any coordinate system may be defined
within
the scope of the present invention, one example of a Cartesian coordinate
system,
shown in FIG. 3A, defines a z-axis along the longitudinal axis about which the
drill bit
200 rotates, an x-axis perpendicular to the z-axis, and a y-axis perpendicular
to both the
z-axis and the x-axis, to form the three orthogonal axes of a typical
Cartesian
coordinate system. Because the data analysis module 300 may be used while the
drill
bit 200 is rotating and with the drill bit 200 in other than vertical
orientations, the
coordinate system may be considered a rotating Cartesian coordinate system
with a
varying orientation relative to the fixed surface location of the drilling rig
110 (FIG. 1).
The accelerometers 340A of the FIG. 6 embodiment, when enabled and
sampled, provide a measure of acceleration of the drill bit 200 along at least
one of the
three orthogonal axes. The data analysis module 300 may include additional
accelerometers 340A to provide a redundant system, wherein various
accelerometers 340A may be selected, or deselected, in response to fault
diagnostics
performed by the processor 320. Furthermore, additional accelerometers may be
used
to determine additional information about bit dynamics and assist in
distinguishing
lateral accelerations from angular accelerations.
FIG. 6A is a top view of a drill bit 200 within a borehole. As can be seen,
FIG. 6A illustrates the drill bit 200 offset within the borehole 100, which
may occur due
to bit behavior other than simple rotation around a rotational axis. FIG. 6A
also
illustrates placement of multiple accelerometers with a first set of
accelerometers 340A
positioned at a first location and a second set of accelerometers 340A'
positioned at a
second location within the bit body. By way of example, the first set 340A
includes a
first coordinate system 341 with x, y, and z accelerometers, while the second
set 340A'
includes a second coordinate system 341' with x and y accelerometers. Of
course, other
embodiments may include three coordinates in the second set of accelerometers
as well
as other configurations and orientations of accelerometers alone or in
multiple
CA 02676459 2009-07-20
WO 2008/106022 PCT/US2008/002078
12
coordinate sets. With the placement of a second set of accelerometers at a
different
location on the drill bit 200, differences between the accelerometer sets may
be used to
distinguish lateral accelerations from angular accelerations. For example, if
the two
sets of accelerometers are both placed at the same radius from the rotational
center of
the drill bit 200 and the drill bit 200 is only rotating about that rotational
center, then
the two accelerometer sets will experience the same angular rotation. However,
the bit
may be experiencing more complex behavior, such as, for example, bit whirl,
bit
wobble, bit walking, and lateral vibration. These behaviors include some type
of lateral
motion in combination with the angular motion. For example, as illustrated in
FIG. 6A,
the drill bit 200 may be rotating about its rotational axis and at the same
time, walking
around the larger circumference of the borehole 200. In these types of motion,
the two
sets of accelerometers disposed at different places will experience different
accelerations. With the appropriate signal processing and mathematical
analysis, the
lateral accelerations and angular accelerations may be more easily determined
with the
additional accelerometers.
Furthermore, if initial conditions are known or estimated, bit velocity
profiles
and bit trajectories may be inferred by mathematical integration of the
accelerometer
data using conventional numerical analysis techniques. As is explained more
fully
below, acceleration data may be analyzed and used to determine adaptive
thresholds to
trigger specific events within the data analysis module. Furthermore, if the
acceleration
data is integrated to obtain bit velocity profiles or bit trajectories, these
additional data
sets may be useful for determining additional adaptive thresholds through
direct
application of the data set or through additional processing, such as, for
example,
pattern recognition analysis. By way of example and not limitation, an
adaptive
threshold may be set based on how far off center a bit may traverse before
triggering an
event of interest within the data analysis module. For example, if the bit
trajectory
indicates that the bit is offset from the center of the borehole by more than
one inch (2.5
centimeters), a different algorithm of data collection from the sensors may be
invoked,
as is explained more fully below.
The magnetometers 340M of the FIG. 6 embodiment, when enabled and
sampled, provide a measure of the orientation of the drill bit 200 along at
least one of
the three orthogonal axes relative to the earth's magnetic field. The data
analysis
module 300 may include additional magnetometers 340M to provide a redundant
CA 02676459 2009-07-20
WO 2008/106022 PCT/US2008/002078
13
system, wherein various magnetometers 340M may be selected, or deselected, in
response to fault diagnostics performed by the processor 320.
The temperature sensor 340T may be used to gather data relating to the
temperature of the drill bit 200, and the temperature near the accelerometers
340A,
magnetometers 340M, and other sensors 340. Temperature data may be useful for
calibrating the accelerometers 340A and magnetometers 340M to be more accurate
at a
variety of temperatures.
Other optional sensors 340 may be included, as part of the data analysis
module 300. Some non-limiting examples of sensors that may be useful in the
present
invention are strain sensors at various locations of the drill bit,
temperature sensors at
various locations of the drill bit, mud (drilling fluid) pressure sensors to
measure mud
pressure internal to the drill bit, and borehole pressure sensors to measure
hydrostatic
pressure external to the drill bit. Sensors may also be implemented to detect
mud
properties, such as, for example, sensors to detect conductivity or impedance
to both
alternating current and direct current, sensors to detect influx of fluid from
the hole
when mud flow stops, sensors to detect changes in mud properties, and sensors
to
characterize mud properties such as synthetic based mud and water based mud.
These optional sensors 340 may include sensors that are integrated with and
configured as part of the data analysis module 300. These sensors may also
include
optional remote sensors 340 placed in other areas of the drill bit 200, or
above the drill
bit 200 in the bottom hole assembly. The optional remote sensors 340 may
communicate across a communication link 362 using a direct-wired connection,
or
through a wireless connection to an optional sensor receiver 360. The sensor
receiver
360 is configured to enable wireless remote sensor communication across
limited
distances in a drilling environment as are known by those of ordinary skill in
the art.
One or more of these optional sensors may be used as an initiation sensor 370.
The initiation sensor 370 may be configured for detecting at least one
initiation
parameter, such as, for example, turbidity of the mud, and generating a power
enable
signal 372 responsive to the at least one initiation parameter. A power gating
module
374 coupled between the power supply 310, and the data analysis module 300 may
be
used to control the application of power to the data analysis module 300 when
the
power enable signal 372 is asserted. The initiation sensor 370 may have its
own
independent power source, such as a small battery, for powering the initiation
sensor
CA 02676459 2009-07-20
WO 2008/106022 PCT/US2008/002078
14
370 during times when the data analysis module 300 is not powered. As with the
other
optional remote sensors 340, some non-limiting examples of parameter sensors
that
may be used for enabling power to the data analysis module 300 are sensors
configured
to sample; strain at various locations of the drill bit, temperature at
various locations of
the drill bit, vibration, acceleration, centripetal acceleration, fluid
pressure internal to
the drill bit, fluid pressure external to the drill bit, fluid flow in the
drill bit, fluid
impedance, and fluid turbidity.
By way of example and not limitation, an initiation sensor 370 may be used to
enable power to the data analysis module 300 in response to changes in fluid,
impedance
for fluids such as, for example, air, water, oil, and various mixtures of
drilling mud.
These fluid property sensors may detect a change in DC resistance between two
terminals exposed to the fluid or a change in AC impedance between two
terminals
exposed to the fluid. In another embodiment, a fluid property sensor may
detect a
change in capacitance between two terminals in close proximity to, but
protected from,
the fluid.
For example, water may have a relatively high dielectric constant as compared
with typical hydrocarbon-based lubricants. The data analysis module 300, or
other
suitable electronics, may energize the sensor with alternating current and
measure a
phase shift therein to determine capacitance, for example, or alternatively
may energize
the sensor with alternating or direct current and determine a voltage drop to
measure
impedance.
In addition, at least some of these sensors may be configured to generate any
required power for operation such that the independent power source is self-
generated
in the sensor. By way of example and not limitation, a vibration sensor may
generate
sufficient power to sense the vibration and transmit the power enable signal
372 simply
from the mechanical vibration.
As another example of an initiation sensor 370 embodiment, FIG. 6B illustrates
an example of data sampled from a temperature sensor as the drill bit
traverses up and
down a borehole. In FIG. 6B, point 342 illustrates the sensed temperature when
the
drill bit is at the surface. The increasing temperature along duration 343 is
indicative of
the temperature increase experienced as the drill bit traverses down a
previously drilled
borehole. At point 344, the mud pumps are turned on and the graph illustrates
a
corresponding decrease in temperature of the drill bit to about 90 C. Duration
345
CA 02676459 2009-07-20
WO 2008/106022 PCTIUS2008/002078
illustrates that the mud pumps have been turned off and the drill bit is being
partially
withdrawn from the borehole. Duration 346 illustrates that the drill bit,
after being
partially withdrawn, is again traversing down the previously drilled borehole.
Point 347
illustrates that the mud pumps are again turned on. Finally, the steadily
increasing
5 temperature along duration 348 illustrates normal drilling as the drill bit
achieves
additional depth.
As can be seen from FIG. 6B, the sensed temperature differential between the
surface ambient temperature and the down hole ambient temperature may be used
as in
initiation point to enable additional sensor data processing, or enable power
to
10 additional sensors, such as, for example, via power controllers 316 (FIG.
6) . The
temperature differential may be programmable for the application for which the
bit is
intended. For example, surface temperature during transport may range from
about
70 F (21.11 C) to 105 F (40.55 C), the down hole temperature at the point
where
addition features would be turned on may be about 175 F (61.58 C). The
differential
15 may be about 70 F (21.11 C) and would be wide enough to ensure against
false starts.
When the drill bit 200 enters the 175 F (61.58 C) zone in the hole the module
may turn
on automatically and begin gathering data. The activation can be triggered by
absolute
temperature or by differential temperature change. After the module is
triggered it may
be locked on and continue to run for the duration of the time in the hole, or
if a large
enough temperature drop is detected, the additional features may be turned
off. In the
example discussed, and referring to FIG. 6, the temperature sensor 340T is
configured
to be sampled by the processor running in a low power configuration and the
processor
may perform the decisions for enabling additional features based on the sensed
temperature. Of course as discussed earlier, the temperature sensor may be an
initiation
sensor 370 (FIG. 6) with its own power source, or a sensor that does not
require power.
In this stand-alone configuration, the initiation sensor 370 (FIG. 6) maybe
configured
to enable power to the entire data analysis module 300 via the power gating
module
374.
As another example, the initiation sensor 370 may be configured as a pressure
activated switch. FIG. 6C is a perspective view showing a possible placement
of a
pressure activated switch 250 assembly in a recess 259 of the end-cap 270. The
pressure activated switch includes a fixed member 251, a deformable member
252, and
a displacement member 256. In this embodiment of a pressure activated switch,
the
CA 02676459 2009-07-20
WO 2008/106022 PCT/US2008/002078
16
fixed member 251 is cylindrically shaped and may be disposed in the
cylindrically
shaped recess 259 and seated against a ledge (not shown) within the recess
259. A
sealing material (not shown) may be placed in the recess 259 between the ledge
and the
fixed member 251 to form a high-pressure seal. In addition, the fixed member
251
includes a first annular channel 253 around the perimeter of the cylinder.
This first
annular channel 253, which may also be referred to as a seal gland, may also
be filled
with a sealing material to assist in forming a high-pressure and watertight
seal.
The deformable member 252 maybe a variety of devices or materials. By way
of example and not limitation, the deformable member 252 may be a
piezoelectric
device. The piezoelectric device may be configured between the fixed member
251 and
the displacement member 256 such that movement of the displacement member 256
exerts a force on the piezoelectric device causing a change in a voltage
across the
piezoelectric material. Electrodes attached to the piezoelectric material may
couple a
signal to the data analysis module 300 (FIG. 6) for sampling as the initiation
sensor 370
(FIG. 6). The piezoelectric device may be formed from any suitable
piezoelectric
material such as, for example, lead zirconate titanate (PZT), barium titanate,
or quartz.
In FIG. 6C, the deformable member 252 is an O-ring that will deform somewhat
when the displacement member 256 is forced closer to the fixed member 251. The
flexibility, or durometer, of the O-ring may be selected for the desired
pressure at which
contact will be made. Of course, other displacement members 256, such as, for
example, springs are contemplated within the scope of the invention. As shown,
the
deformable member 252 is seated on a top surface of the fixed member 251. The
displacement member 256 may be placed in the recess 259 on top of the
deformable
member 252 such that the displacement member 256 may move up and down within
the
recess 259 relative to the fixed member 251. The displacement member 256 is
cylindrically shaped and includes a second annular channel 257 around the
perimeter of
the cylinder. This second annular channel 257, which may also be referred to
as a seal
gland, may also be filled with a sealing material to assist in forming a high-
pressure and
watertight seal. The displacement member 256 is made of an electrically
conductive
material, or the bottom surface of the displacement member 256 is coated with
an
electrically conductive material. A retaining clip 258 may be placed in the
recess 259
in a configuration to hold the pressure activated switch 250 assembly in place
within
the recess 259.
CA 02676459 2009-07-20
WO 2008/106022 PCT/US2008/002078
17
FIG. 6D is a perspective view showing details of the fixed member 251. The
fixed member 251 includes the first annular channel 253 and the deformable
member
252. In this embodiment, the fixed member 251 includes a borehole therethrough
such
that leads 263 may be disposed through the borehole. The leads 263 are coupled
to
contacts 262 disposed in the borehole and slightly below the highest point of
the
deformable member 252. The borehole may be filled with quartz glass or other
suitable
material to form a high-pressure seal.
In operation, the pressure activated switch 250 may be configured to activate
the
data analysis module 300 as the drill bit 200 traverses down hole when a given
depth is
achieved based on the hole pressure sensed by the pressure activated switch
250. In the
configuration illustrated in FIG. 6C, the pressure activated switch 250 is
actually
sensing pressure of the mud within the drill string near the top of the drill
bit 200.
However, as mud is pumped, the pressure within the drill string at the drill
bit 200
substantially matches the pressure in the borehole near the drill bit. The
increasing
pressure exerts increasing force on the displacement member 256 causing it to
displace
toward the fixed member 251. As the displacement member 256 moves closer to
the
fixed member 251, it comes in contact with the contacts 262 forming a closed
circuit
between the leads 263. The leads are coupled to the data analysis module (not
shown in
FIGS. 6C and 6D) to perform the initiation function when the closed circuit is
achieved.
In addition, while the embodiment of the pressure activated switch 250 has
been
described as disposed in a recess 259 of the end-cap 270, other placements are
possible.
For example, the cutouts illustrated in FIGS. 5A-5E may be suitable from
placement of
the pressure activated switch. Furthermore, while the discussion may have
included
directional indicators for ease of description, such as top, up, and down, the
directions
and orientations for placement of the pressure activated switch are not
limited to those
described.
The pressure activated switch is one of many types of sensors that may be
placed in a recess such as that described in conjunction with the pressure
activated
switch. Any sensor that may need to be exposed to the environment of the
borehole
may be disposed in the recess with a configuration similar to the pressure
activated
switch to form a high-pressure and watertight seal within the drill bit. By
way of
example and not limitation, some environmental sensors that may be used are
passive
CA 02676459 2009-07-20
WO 2008/106022 PCT/US2008/002078
18
gamma ray sensors, corrosion sensors, chlorine sensors, hydrogen sulfide
sensors,
proximity detectors for distance measurements to the borehole wall, and the
like.
Another significant bit parameter to measure is stress and strain on the drill
bit.
However, just placing strain gauges on various areas of the drill bit or
chambers within
the drill bit may not produce optimal results. In an embodiment of the present
invention, a load cell may be used to obtain stress and strain data at the
drill bit that
may be more useful. FIG. 6E is a perspective view of a load cell 281 including
strain
gauges (285 and 285') bonded thereon. The load cell 281 includes a first
attachment
section 282, a stress section 284, and a second attachment section 283. The
load cell
281 may be manufactured of a material, such as, for example, steel or other
suitable
metal that exhibits a suitable strain based on the expected loads than may be
placed
thereon. In the embodiment shown, the attachment sections (282 and 283) are
cylindrical and the stress section 284 has a rectangular cross section. The
rectangular
cross section creates a flat surface for strain gauges to be mounted thereon.
In the
embodiment shown, first strain gauges 285 are bonded to a front visible
surface of the
stress section 284 and second strain gauges 285' are bonded to a back hidden
surface of
the stress section 284. Of course, strain gauges 285 may be mounted on one,
two, or
more sides of the stress section 284, and the cross section of the stress
section 284 may
be other shapes, such as for example, hexagonal or octagonal. Conductors 286
from the
strain gauges 285, 285' extend upward through grooves formed in the first
attachment
section 282 and may be-coupled to the data analysis module 300 (not shown in
FIG.
6E).
FIG. 6F is a perspective view showing one contemplated placement of the load
cell 281 in the drill bit 200. A cylindrical tube 289 extends downward from a
cavity
288 near the top of the drill bit 200 where the data analysis module 300 (not
shown)
may be placed. The tube 289 would extend into an area of the bit body that may
be of
particular interest and is configured such that the load cell 281 may be
disposed and
attached within the tube and the conductors 286 (not shown in FIG. 6F) may
extend
through the tube 289 to the data analysis module 300. The load cell 281 may be
attached within the tube 289 by any suitable means such that the first
attachment
section 282 and second attachment section 283 are held firmly in place. This
attachment mechanism may be, for example, a secure press-fit, a threaded
connection,
an epoxy connection, a shape-memory retainer, and the like.
CA 02676459 2009-07-20
WO 2008/106022 PCT/US2008/002078
19
The load cell configuration may assist in obtaining more accurate strain
measurements by using a load cell material that is more uniform, homogenous,
and
suitable for bonding strain gauges thereto when compared to bonding strain
gauges
directly to the bit body or side walls within a cavity in the bit body. The
load cell
configuration also may be more suitable for detecting torsional strain on the
drill bit
because the load cell creates a larger and more uniform displacement over
which the
torsional strain may occur due to the distance between the first attachment
section and
the second attachment section.
Furthermore, with the placement of the load cell 281, or strain gauges, in the
drill bit, it may be placed in a specific desired orientation relative to
elements of interest
on or within the drill bit. With conventional placement of load cells, and
other sensors,
above the bit in another element of the drill string it may be difficult to
obtain the
desired orientation due to the connection mechanism (e.g., threaded fittings)
of the drill
bit to the drill string. By way of example, embodiments of the present
invention allow
the load cell to be placed in a specific orientation relative to elements of
interest such as
a specific cutter, a specific leg of a tri-cone bit, or an index mark on the
drill bit. In this
way, additional information about specific elements of the bit may be obtained
due to
the specific and repeatable orientation of the load cell 281 relative to
features of the
drill bit.
By way of example and not limitation, the load cell 281 may be rotated within
the tube 289 to a specific orientation aligning with a specific cutter on the
drill bit 200.
As a result of this orientation, additional stress and strain information
about the area of
the drill bit near a specific cutter may be available. Furthermore, placement
of the tube
289 at an angle relative to the central axis of the drill bit 200, or at
different distances
relative to the central axis of the drill bit 200, may enable more information
about
bending stresses relative to axial stresses placed on the drill bit, or
specific areas of the
drill bit.
This ability to place a sensor with a desired orientation relative to an
arbitrary
but repeatable feature of the drill bit is useful for other types of sensors,
such as, for
example, accelerometers, magnetometers, temperature sensors, and other
environmental
sensors.
The strain gauges may be connected in any suitable configuration, as are known
by those of ordinary skill in the art, for detecting strain along different
axis of the load
CA 02676459 2009-07-20
WO 2008/106022 PCT/US2008/002078
cell. Such suitable configurations may include for example, Chevron bridge
circuits, or
Wheatstone bridge circuits. Analysis of the strain gauge measurements can be
used to
develop bit parameters, such as, for example, stress on the bit, weight on
bit,
longitudinal stress, longitudinal strain, torsional stress, and torsional
strain.
5 Returning to FIG. 6, the memory 330 may be used for storing sensor data,
signal
processing results, long-term data storage, and computer instructions for
execution by
the processor 320. Portions of the memory 330 maybe located external to the
processor 320 and portions may be located within the processor 320. The memory
330
may be Dynamic Random Access Memory (DRAM), Static Random Access Memory
10 (SRAM), Read Only Memory (ROM), Nonvolatile Random Access Memory
(NVRAM), such as Flash memory, Electrically Erasable Programmable ROM
(EEPROM), or combinations thereof. In the FIG. 6 embodiment, the memory 330 is
a
combination of SRAM in the processor (not shown), Flash memory 330 in the
processor 320, and external Flash memory 330. Flash memory may be desirable
for
15 low power operation and ability to retain information when no power is
applied to the
memory 330.
A communication port 350 maybe included in the data analysis module 300 for
communication to external devices such as the MWD communication system 146 and
a
remote processing system 390. The communication port 350 may be configured for
a
20 direct communication link 352 to the remote processing system 390 using a
direct wire
connection or a wireless communication protocol, such as, by way of example
only,
infrared, Bluetooth, and 802.11a/b/g protocols. Using the direct
communication, the
data analysis module 300 may be configured to communicate with a remote
processing
system 390 such as, for example, a computer, a portable computer, and a
personal
digital assistant (PDA) when the drill bit 200 is not downhole. Thus, the
direct
communication link 352 may be used for a variety of functions, such as, for
example, to
download software and software upgrades, to enable setup of the data analysis
module
300 by downloading configuration data, and to upload sample data and analysis
data.
The communication port 350 may also be used to query the data analysis module
300
for information related to the drill bit, such as, for example, bit serial
number, data
analysis module serial number, software version, total elapsed time of bit
operation, and
other long term drill bit data which may be stored in the NVRAM.
CA 02676459 2009-07-20
WO 2008/106022 PCT[US2008/002078
21
The communication port 350 may also be configured for communication with
the MWD communication system 146 in a bottom hole assembly via a wired or
wireless communication link 354 and protocol configured to enable remote
communication across limited distances in a drilling environment as are known
by
those of ordinary skill in the art. One available technique for communicating
data
signals to an adjoining subassembly in the drill string 140 (FIG. 1) is
depicted,
described, and claimed in U.S. Patent No. 4,884,071 entitled "Wellbore Too]
With Hall
Effect Coupling," which issued on November 28, 1989 to Howard.
The MWD communication system 146 may, in turn, communicate data from the
data analysis module 300 to a remote processing system 390 using mud pulse
telemetry
356 or other suitable communication means suitable for communication across
the
relatively large distances encountered in a drilling operation.
The processor 320 in the embodiment of FIG. 6 is configured for processing,
analyzing, and storing collected sensor data. For sampling of the analog
signals from
the various sensors 340, the processor 320 of this embodiment includes a
digital-to-analog converter (DAC). However, those of ordinary skill in the art
will
recognize that the present invention may be practiced with one or more
external DACs
in communication between the sensors 340 and the processor 320. In addition,
the
processor 320 in the embodiment includes internal SRAM and NVRAM. However,
those of ordinary skill in the art will recognize that the present invention
may be
practiced with memory 330 that is only external to the processor 320 as well
as in a
configuration using no external memory 330 and only memory 330 internal to the
processor 320.
The embodiment of FIG. 6 uses battery power as the operational power
supply 310. Battery power enables operation without consideration of
connection to
another power source while in a drilling environment. However, with battery
power,
power conservation may become a significant consideration in the present
invention. As
a result, a low power processor 320 and low power memory 330 may enable longer
battery life. Similarly, other power conservation techniques may be
significant in the
present invention.
The embodiment of FIG. 6, illustrates power controllers 316 for gating the
application of power to the memory . 330, the accelerometers 340A, and the
magnetometers 340M. Using these power controllers 316, software running on the
CA 02676459 2009-07-20
WO 2008/106022 PCT/US2008/002078
22
processor 320 may manage a power control bus 326 including control signals for
individually enabling a voltage signal 314 to each component connected to the
power
control bus 326. While the voltage signal 314 is shown in FIG. 6 as a single
signal, it
will be understood by those of ordinary skill in the art that different
components may
require different voltages. Thus, the voltage signal 314 may be a bus
including the
voltages necessary for powering the different components.
In addition, software running on the processor 320 may be used to manage
battery life intelligence and adaptive usage of power consuming resources to
conserve
power. The battery life intelligence can track the remaining battery life
(i.e., charge
remaining on the battery) and use this tracking to manage other processes
within the
system. By way of example, the battery life estimate maybe determined by
sampling a
voltage from the battery, sampling a current from the battery, tracking a
history of
sampled voltage, tracking a history of sampled current, and combinations
thereof.
The battery life estimate-may be used in a number of ways. For example, near
the end of battery life, the software may reduce sampling frequency of
sensors, or may
be used to cause the power control bus to begin shutting down voltage signals
to
various components.
This power management can create a graceful, gradual shutdown. For example,
perhaps power to the magnetometers is shut down at a certain point of
remaining
battery life. At another point of battery life, perhaps the accelerometers are
shut down.
Near the end of battery life, the battery life intelligence can ensure data
integrity by
making sure improper data is not gathered or stored due to inadequate voltage
at the
sensors, the processor, or the memory.
As is explained more fully below with reference to specific types of data
gathering, software modules may be devoted to memory management with respect
to
data storage. The amount of data stored may be modified with adaptive sampling
and
data compression techniques. For example, data may be originally stored in an
uncompressed form. Later, when memory space becomes limited, the data may be
compressed to free up additional memory space. In addition, data may be
assigned
priorities such that when memory space becomes limited high priority data is
preserved
and low priority data may be overwritten.
Software modules may also be included to track the long term history of the
drill bit. Thus, based on drilling performance data gathered over the life
time of the
CA 02676459 2009-07-20
WO 2008/106022 PCT/US2008/002078
23
drill bit, a life estimate of the drill bit may be formed. Failure of a drill
bit can be a very
expensive problem. With life estimates based on actual drilling performance
data, the
software module may be configured to determine when a drill bit is nearing the
end of
its useful life and use the communication port to signal to external devices
the expected
life remaining on the drill bit.
FIGS. 7A and 7B illustrate some examples of data sampling modes occurring
along an increasing time axis 590 that the data analysis module 300 (FIG. 6)
may
perform. The data sampling modes may include a background mode 510, a logging
mode 530, and a burst mode 550. The different modes may be characterized by
what
type of sensor data is sampled and analyzed as well as at what sampling
frequency the
sensor data is sampled.
The background mode 510 may be used for sampling data at a relatively low
background sampling frequency and generating background data from a subset of
all
the available sensors 340. The logging mode 530 may be used for sampling
logging
data at a relatively mid-level logging sampling frequency and with a larger
subset, or
all, of the available sensors. The burst mode 550 may be used for sampling
burst data
at a relatively high burst sampling frequency and with a large subset, or all,
of the
available sensors 340.
Each of the different data modes may collect, process, and analyze data from a
subset of sensors, at predefined sampling frequency and for a predefined block
size. By
way of example, and not limitations, examples of sampling frequencies, and
block
collection sizes may be: 2 or 5 samples/sec, and 200 seconds worth of samples
per
block for background mode, 100 samples/sec, and ten seconds worth of samples
per
block for logging mode, and 200 samples/sec, and five seconds worth of samples
per
block for burst mode. Some embodiments of the invention may be constrained by
the
amount of memory available, the amount of power available or combination
thereof.
More memory, more power, or combination thereof may be required for more
detailed modes, therefore, the adaptive threshold triggering enables a method
of
optimizing memory usage, power usage, or combination thereof, relative to
collecting
and processing the most useful and detailed information. For example, the
adaptive
threshold triggering may be adapted for detection of specific types of known
events,
such as, for example, bit whirl, bit bounce, bit wobble, bit walking, lateral
vibration,
and torsional oscillation.
CA 02676459 2009-07-20
WO 2008/106022 PCT/US2008/002078
24
Generally, the data analysis module 300 (FIG. 6) may be configured to
transition
from one mode to another mode based on some type of event trigger. FIG. 7A
illustrates a timing triggered mode wherein the transition from one mode to
another is
based on a timing event, such as, for example, collecting a predefined number
of
samples, or expiration of a timing counter. Timing point 513 illustrates a
transition
from the background mode 510 to the logging mode 530 due to a timing event.
Timing
point 531 illustrates a transition from the logging mode 530 to the background
mode
510 due to a timing event. Timing point 515 illustrates a transition from the
background mode 510 to the burst mode 550 due to a timing event. Timing point
551
illustrates a transition from the burst mode 550 to the background mode 510
due to a
timing event. Timing point 535 illustrates a transition from the logging mode
530 to
the burst mode 550 due to a timing event. Finally, timing point 553
illustrates a
transition from the burst mode 550 to the logging mode 530 due to a timing
event.
FIG. 7B illustrates an adaptive sampling trigger mode wherein the transition
from one mode to another is based on analysis of the collected data to create
a severity
index and whether the severity index is greater than or less than an adaptive
threshold.
The adaptive threshold may be a predetermined value, or it may be modified
based on
signal processing analysis of the past history of collected data. Timing point
513'
illustrates a transition from the background mode 510 to the logging mode 530
due to
an adaptive threshold event. Timing point 531' illustrates a transition from
the logging
mode 530 to the background mode 510 due to a timing event. Timing point 515'
illustrates a transition from the background mode 510 to the burst mode 550
due to an
adaptive threshold event. Timing point 551' illustrates a transition from the
burst mode
550 to the background mode 510 due to an adaptive threshold event. Timing
point 535'
illustrates a transition from the logging mode 530 to the burst mode 550 due
to an
adaptive threshold event. Finally, timing point 553' illustrates a transition
from the
burst mode 550 to the logging mode 530 due to an adaptive threshold event. In
addition, the data analysis module 300 may remain in any given data sampling
mode
from one sampling block to the next sampling block, if no adaptive threshold
event is
detected, as illustrated by timing point 555'.
The software, which may also be referred to as firmware, for the data analysis
module 300 comprises computer instructions for execution by the processor 320.
The
software may reside in an external memory 330, or memory within the processor
320.
CA 02676459 2009-07-20
WO 2008/106022 PCT/US2008/002078
FIGS. 8A-8H illustrate major functions of embodiments of the software
according to
the present invention.
Before describing the main routine in detail, a basic function to collect and
queue data, which may be performed by the processor and Analog to Digital
Converter
5 (ADC) is described. The ADC routine 780, illustrated in FIG. 8A, may operate
from a
timer in the processor, which may be set to generate an interrupt at a
predefined
sampling interval. The interval may be repeated to create a sampling interval
clock on
which to perform data sampling in the ADC routine 780. The ADC routine 780 may
collect data form the accelerometers, the magnetometers, the temperature
sensors, and
10 any other optional sensors by performing an analog to digital conversion on
any sensors
that may present measurements as an analog source. Block 802 shows
measurements
and calculations that may be performed for the various sensors while in the
background
mode. Block 804 shows measurements and calculations that may be performed for
the
various sensors while in the log mode. Block 806 shows measurements and
15 calculations that may be performed for the various sensors while in the
burst mode.
The ADC routine 780 is entered when the timer interrupt occurs. A decision
block 782
determines under which data mode the data analysis module is currently
operating.
If in a burst mode, samples are collected (794 and 796) for all the
accelerometers and all the magnetometers. The sampled data from each
accelerometer
20 and each magnetometer is stored in a burst data record. The ADC routine 780
then sets
798 a data ready flag indicating to the main routine that data is ready to
process.
If in the background mode 510 (FIGS. 7A and 7B, samples are collected 784
from all the accelerometers. As the ADC routine 780 collects data from each
accelerometer it adds the sampled value to a stored value containing a sum of
previous
25 accelerometer measurements to create a running sum of accelerometer
measurements
for each accelerometer. The ADC routine 780 also adds the square of the
sampled
value to a stored value containing a sum of previous squared values to create
a running
sum of squares value for the accelerometer measurements. The ADC routine 780
also
increments the background data sample counter to indicate that another
background
sample has been collected Optionally, temperature and sum of temperatures may
also
be collected and calculated.
If in a logging mode, samples are collected (786, 788, and 790) for all the
accelerometers, all the magnetometers, and the temperature sensor. The ADC
routine
CA 02676459 2009-07-20
WO 2008/106022 PCT/US2008/002078
26
780 collects a sampled value from each accelerometer and each magnetometer and
adds
the sampled value to a stored value containing a sum of previous accelerometer
and
magnetometer measurements to create a running sum of accelerometer
measurements
and a running sum of magnetometer measurements. In addition, the ADC routine
780
compares the current sample for each accelerometer and magnetometer
measurement to
a stored minimum value for each accelerometer and magnetometer. If the current
sample is smaller than the stored minimum, the current sample is saved as the
new
stored minimum. Thus, the ADC routine 780 keeps the minimum value sampled for
all
samples collected in the current data block. Similarly, to keep the maximum
value
sampled for all samples collected in the current data block, the ADC routine
780
compares the current sample for each accelerometer and magnetometer
measurement to
a stored maximum value for each accelerometer and magnetometer. If the current
sample is larger than the stored maximum, the current sample is saved as the
new stored
maximum. The ADC routine 780 also creates a running sum of temperature values
by
adding the current sample for the temperature sensor to a stored value of a
sum of
previous temperature measurements. The ADC routine 780 then sets 792 a data
ready
flag indicating to the main routine that data is ready to process.
FIG. 8B illustrates major functions of the main routine 600. After power
on 602, the main software routine initializes 604 the system by setting up
memory,
enabling communication ports, enabling the ADC, and generally setting up
parameters
required to control the data analysis module. The main routine 600 then enters
a loop
to begin processing collected data. The main routine 600 primarily makes
decisions
about whether data collected by the ADC routine 780 (FIG. 8A) is available for
processing, which data mode is currently active, and whether an entire block
of data for
the given data mode has been collected. As a result of these decisions, the
main routine
600 may perform mode processing for any of the given modes if data is
available, but
an entire block of data has not yet been processed. On the other hand, if an
entire block
of data is available, the main routine 600 may perform block processing for
any of the
given modes.
As illustrated in FIG. 8B, to begin the decision process, a test 606 is
performed
to see if the operating mode is currently set to background mode. If so,
background
mode processing 640 begins. If test 606 fails or after background mode
processing 640,
a test 608 is performed to see if the operating mode is set to logging mode
and the data
CA 02676459 2009-07-20
WO 2008/106022 PCT/US2008/002078
27
ready flag from the ADC routine 780 is set. If so, logging operations 610 are
performed. These operations will be described more fully below. If test 608
fails or
after the logging operations 610, a test 612 is performed to see if the
operating mode is
set to burst mode and the data ready flag from the ADC routine 780 is set. If
so, burst
operations 614 are performed. These operations will be described more fully
below. If
test 612 fails or after the burst operations 614, a test 616 is performed to
see if the
operating mode is set to background mode and an entire block of background
data has
been collected. If so, background block processing 617 is performed. If test
616 fails
or after background block processing 617, a test 618 is performed to see if
the operating
mode is set to logging mode and an entire block of logging data has been
collected. If
so, log block processing 700 is performed. If test 618 fails or after log
block processing
700, a test 620 is performed to see if the operating mode is set to burst mode
and an
entire block of burst data has been collected. If so, burst block processing
760 is
performed. If test 620 fails or after burst block processing 760, a test 622
is performed
to see if the there are any host messages to be processed from the
communication port.
If so, the host messages are processed 624. If test 622 fails or after host
messages are
processed 624, the main routine 600 loops back to test 606 to begin another
loop of
tests to see if any data, and what type of data, may be available for
processing. This
loop continues indefinitely while the data analysis module is set to a data
collection
mode.
Details of logging operations 610 are illustrated in FIG. 8B. In this example
of
a logging mode, data is analyzed for magnetometers in at least the X and Y
directions to
determine how fast the drill bit is rotating. In performing this analysis the
software
maintains variables for a time stamp at the beginning of the logging block
(RPMinitial),
a time stamp of the current data sample time (RPMfinal), a variable containing
the
maximum number of time ticks per bit revolution (RPMmax), a variable
containing the
minimum number of time ticks per bit revolution (RPMmin), and a variable
containing
the current number of bit revolutions (RPMcnt) since the beginning of the log
block.
The resulting log data calculated during the ADC routine 780 and during
logging
operations 610 may be written to nonvolatile RAM.
Magnetometers may be used to determine bit revolutions because the
magnetometers are rotating in the earth's magnetic field. If the bit is
positioned
vertically, the determination is a relatively simple operation of comparing
the history of
CA 02676459 2009-07-20
WO 2008/106022 PCT/US2008/002078
28
samples from the X magnetometer and the Y magnetometers. For bits positioned
at an
angle, perhaps due to directional drilling, the calculations may be more
involved and
require samples from all three magnetometers.
Details of burst operations 614 are also illustrated in FIG. 8B. Burst
operations
614 are relatively simple in this embodiment. The burst data collected by the
ADC
routine 780 is stored in NVRAM and the data ready flag is cleared to prepare
for the
next burst sample.
Details of background block processing 617 are also illustrated in FIG. 8B. At
the end of a background block, clean up operations are performed to prepare
for a new
background block. To prepare for a new background block, a completion time is
set for
the next background block, the variables tracked relating to accelerometers
are set to
initial values, the variables tracked relating to temperature are set to
initial values, the
variables tracked relating to magnetometers are set to initial values, and the
variables
tracked relating to RPM calculations are set to initial values. The resulting
background
data calculated during the ADC routine 780 and during background block
processing
617 may be written to nonvolatile RAM.
In performing adaptive sampling, decisions may be made by the software as to
what type of data mode is currently operating and whether to switch to a
different data
mode based on timing event triggers or adaptive threshold triggers. The
adaptive
threshold triggers may generally be viewed as a test between a severity index
and an
adaptive threshold. At least three possible outcomes are possible from this
test. As a
result of this test, a transition may occur to a more detailed mode of data
collection, to a
less detailed mode of data collection, or no transition may occur.
These data modes are defined as the background mode 510 being the least
detailed, the logging mode 530 being more detailed than the background mode
510, and
the burst mode 550 being more detailed than the logging mode 530.
A different severity index may be defined for each data mode. Any given
severity index may comprise a sampled value from a sensor, a mathematical
combination of a variety of sensors samples, or a signal processing result
including
historical samples from a variety of sensors. Generally, the severity index
gives a
measure of particular phenomena of interest. For example, a seventy index may
be a
combination of mean square error calculations for the values sensed by the X
accelerometer and the Y accelerometer.
CA 02676459 2009-07-20
WO 2008/106022 PCT/US2008/002078
29
In its simplest form, an adaptive threshold may be defined as a specific
threshold (possibly stored as a constant) for which, if the severity index is
greater than
or less than the adaptive threshold the data analysis module may switch (i.e.,
adapt
sampling) to a new data mode. In more complex forms, an adaptive threshold may
change its value (i.e., adapt the threshold value) to a new value based on
historical data
samples or signal processing analysis of historical data samples.
In general, two adaptive thresholds may be defined for each data mode: A lower
adaptive threshold (also referred to as a first threshold) and an upper
adaptive threshold
(also referred to as a second threshold). Tests of the severity index against
the adaptive
thresholds may be used to decide if a data mode switch is desirable.
In the computer instructions illustrated in FIGS. 8C-8E, and defining a
flexible
embodiment relative to the main routine 600 (FIG. 8B), adaptive threshold
decisions
are fully illustrated, but details of data processing and data gathering may
not be
illustrated.
FIG. 8C illustrates general adaptive threshold testing relative to background
mode processing 640. First, test 662 is performed to see if a time trigger
mode is
active. If so, operation block 664 causes the data mode to possibly switch to
a different
mode. Based on a predetermined algorithm, the data mode may switch to logging
mode, burst mode, or may stay in background mode for a predetermined time
longer.
After switching data modes, the software exits background mode processing.
If test 662 fails, adaptive threshold triggering is active, and operation
block 668
calculates a background severity index (Sbk), a first background threshold
(Tlbk), and
a second background threshold (T2bk). Then, Test 670 is performed to see if
the
background severity index is between the first background threshold and the
second
background threshold. If so, operation block 672 switches the data mode to
logging
mode and the software exits background mode processing.
If test 670 fails, test 674 is performed to see if the background severity
index is
greater than the second background threshold. If so, operation block 676
switches the
data mode to burst mode and the software exits background mode processing. If
test
674 fails, the data mode remains in background mode and the software exits
background mode processing.
FIG. 8D illustrates general adaptive threshold testing relative to log block
processing 700. First, test 702 is performed to see if time trigger mode is
active. If so,
CA 02676459 2009-07-20
WO 2008/106022 PCT/US2008/002078
operation block 704 causes the data mode to possibly switch to a different
mode. Based
on a predetermined algorithm, the data mode may switch to background mode,
burst
mode, or may stay in logging mode for a predetermined time longer. After
switching
data modes, the software exits log block processing.
5 If test 702 fails, adaptive threshold triggering is active, and operation
block 708
calculates a logging severity index (Sig), a first logging threshold (TI lg),
and a second
logging threshold (T21g). Then, test 710 is performed to see if the logging
severity
index is less than the first logging threshold. If so, operation block 712
switches the
data mode to background mode and the software exits log block processing.
10 If test 710 fails, test 714 is performed to see if the logging severity
index is
greater than the second logging threshold. If so, operation block 716 switches
the data
mode to burst mode and the software exits log block processing. If test 714
fails, the
data mode remains in logging mode and the software exits log block processing.
FIG. 8E illustrates general adaptive threshold testing relative to burst block
15 processing 760. First, test 782 is performed to see if time trigger mode is
active. If so,
operation block 784 causes the data mode to possibly switch to a different
mode. Based
on a predetermined algorithm, the data mode may switch to background mode,
logging
mode, or may stay in burst mode for a predetermined time longer. After
switching data
modes, the software exits burst block processing.
20 If test 782 fails, adaptive threshold triggering is active, and operation
block 788
calculates a burst severity index (Sbu), a first burst threshold (Tlbu), and a
second burst
threshold (T2bu). Then, test 790 is performed to see if the burst severity
index is less
than the first burst threshold. If so, operation block 792 switches the data
mode to
background mode and the software exits burst block processing.
25 If test 790 fails, test 794 is performed to see if the burst severity index
is less
than the second burst threshold. If so, operation block 796 switches the data
mode to
logging mode and the software exits burst block processing. If test 794 fails,
the data
mode remains in burst mode and the software exits burst block processing.
In the computer instructions illustrated in FIGS. 8F-8H, and defining another
30 embodiment of processing relative to the main routine 600 (FIG. 8B), more
details of
data gathering and data processing are illustrated, but not all decisions are
explained
and illustrated. Rather, a variety of decisions are shown to further
illustrate the general
concept of adaptive threshold triggering.
CA 02676459 2009-07-20
WO 2008/106022 PCT/US2008/002078
31
Details of another embodiment of background mode processing 640 are
illustrated in FIG. 8F. In this background mode embodiment, data is collected
for
accelerometers in the X, Y, and Z directions. The ADC routine 780 (FIG. 8A)
stored
data as a running sum of all background samples and a running sum of squares
of all
background data for each of the X, Y, and Z accelerometers. In the background
mode
processing, the parameters of an average, a variance, a maximum variance, and
a
minimum variance for each of the accelerometers are calculated and stored in a
background data record. First, the software saves 642 the current time stamp
in the
background data record. Then the parameters are calculated as illustrated in
operation
blocks 644 and 646. The average may be calculated as the running sum divided
by the
number of samples currently collected for operation block 644. The variance
may be
set as a mean square value using the equations as shown in operation block
646. The
minimum variance is determined by setting the current variance as the minimum
if it is
less than any previous value for the minimum variance. Similarly, the maximum
variance is determined by setting the current variance as the maximum variance
if it is
greater than any previous value for the maximum variance. Next, a trigger flag
is set
648 if the variance (also referred to as the background severity index) is
greater than a
background threshold, which in this case is a predetermined value set prior to
starting
the software. The trigger flag is tested as shown in operation block 650. If
the trigger
flag is not set, the software jumps down to operation block 656. If the
trigger flag is
set, the software transitions 652 to logging mode. After the switch to logging
mode, or
if the trigger flag is not set, the software may optionally write 656 the
contents of
background data record to the NVRAM. In some embodiments, it may not be
desirable
to use NVRAM space for background data. While in other embodiments, it may be
valuable to maintain at least a partial history of data collected while in
background
mode.
Referring to FIG. 9, magnetometer samples histories are shown for X
magnetometer samples 610X and Y magnetometer samples 610Y. Looking at sample
point 902, it can be seen that the Y magnetometer samples are near a minimum
and the
X magnetometer samples are at a phase of about 90 degrees. By tracking the
history of
these samples, the software can detect when a complete revolution has
occurred. For
example, the software can detect when the X magnetometer samples 610X have
become positive (i.e., greater than a selected value) as a starting point of a
revolution.
CA 02676459 2009-07-20
WO 2008/106022 PCTIUS2008/002078
32
The software can then detect when the Y magnetometer samples 61 OY have become
positive (i.e., greater than a selected value) as an indication that
revolutions are
occurring. Then, the software can detect the next time the X magnetometer
samples
61 OX become positive, indicating a complete revolution. Each time a
revolution
occurs, the logging operation updates the logging variables described above.
Details of another embodiment of log block processing 700 are illustrated in
FIG. 8G. In this log block processing embodiment, the software assumes that
the data
mode will be reset to the background mode. Thus, power to the magnetometers is
shut
off and the background mode is set 722. This data mode may be changed later in
the
log block processing 700 if the background mode is not appropriate. In the log
block
processing 700, the parameters of an average, a deviation, and a severity for
each of the
accelerometers are calculated and stored in a log data record. The parameters
are
calculated as illustrated in operation block 724. The average may be
calculated as the
running sum prepared by the ADC routine 780 (FIG. 8A) divided by the number of
samples currently collected for this block. The deviation is set as one-half
of the
quantity of the maximum value set by the ADC routine 780 less the minimum
value set
by the ADC routine 780. The severity is set as the deviation multiplied by a
constant
(Ksa), which may be set as a configuration parameter prior to software
operation. For
each magnetometer, the parameters of an average and a span are calculated and
stored
726 in the log data record. For the temperature, an average is calculated and
stored 728
in the log data record. For the RPM data generated during the log mode
processing 610
(in FIG. 8B), the parameters of an average RPM, a minimum RPM, a maximum RPM,
and a RPM severity are calculated and stored 730 in the log data record. The
severity is
set as the maximum RPM minus the minimum RPM multiplied by a constant (Ksr),
which may be set as a configuration parameter prior to software operation.
After all
parameters are calculated, the log data record is stored 732 in NVRAM. For
each
accelerometer in the system, a threshold value is calculated 734 for use in
determining
whether an adaptive trigger flag should be set. The threshold value, as
defined in block
734, is compared to an initial trigger value. If the threshold value is less
than the initial
trigger value, the threshold value is set to the initial trigger value.
Once all parameters for storage and adaptive triggering are calculated, a test
is
performed 736 to determine whether the mode is currently set to adaptive
triggering or
time based triggering. If the test fails (i.e., time based triggering is
active), the trigger
CA 02676459 2009-07-20
WO 2008/106022 PCT/US2008/002078
33
flag is cleared 738. A test 740 is performed to verify that data collection is
at the end of
a logging data block. If not, the software exits the log block processing. If
data
collection is at the end of a logging data block, burst mode is set 742, and
the time for
completion of the burst block is set. In addition, the burst block to be
captured is
defined as time triggered 744.
If the test 736 for adaptive triggering passes, a test 746 is performed to
verify
that a trigger flag is set, indicating that, based on the adaptive trigger
calculations, burst
mode should be entered to collect more detailed information. If test 746
passes, burst
mode is set 748, and the time for completion of the burst block is set. In
addition, the
burst block to be captured is defined as adaptive triggered 750. If test 746
fails or after
defining the burst block as adaptive triggered, the trigger flag is cleared
752 and log
block processing is complete.
Details of another embodiment of burst block processing 760 are illustrated in
FIG. 8H. In this embodiment, a burst severity index is not implemented.
Instead, the
software always returns to the background mode after completion of a burst
block.
First, power may be turned off to the magnetometers to conserve power and the
software transitions 762 to the background mode.
After many burst blocks have been processed, the amount of memory allocated
to storing burst samples may be completely consumed. If this is the case, a
previously
stored burst block may need to be set to be overwritten by samples from the
next burst
block. The software checks 764 to see if any unused NVRAM is available for
burst
block data. If not all burst blocks are used, the software exits the burst
block
processing. If all burst blocks are used 766, the software uses an algorithm
to find 768
a good candidate for overwriting.
It will be recognized and appreciated by those of ordinary skill in the art,
that
the main routine 600, illustrated in FIG. 8B, switches to adaptive threshold
testing after
each sample in background mode, but only after a block is collected in logging
mode
and burst mode. Of course, the adaptive threshold testing may be adapted to be
performed after every sample in each mode, or after a full block is collected
in each
mode. Furthermore, the ADC routine 780, illustrated in FIG. 8A, illustrates a
non-limiting example of an implementation of data collection and analysis.
Many other
data collection and analysis operations are contemplated as within the scope
of the
present invention.
CA 02676459 2009-07-20
WO 2008/106022 PCT/US2008/002078
34
More memory, more power, or combination thereof, may be required for more
detailed modes, therefore, the adaptive threshold triggering enables a method
of
optimizing memory usage, power usage, or combination thereof, relative to
collecting
and processing the most useful and detailed information. For example, the
adaptive
threshold triggering may be adapted for detection of specific types of known
events,
such as, for example, bit whirl, bit bounce, bit wobble, bit walking, lateral
vibration,
and torsional oscillation.
FIGS. 10, 11, and 12 illustrate examples of types of data that may be
collected
by the data analysis module. FIG. 10 illustrates torsional oscillation.
Initially, the
magnetometer measurements 610Y and 610 X illustrate a rotational speed of
about 20
revolutions per minute (RPM) 611X, which may be indicative of the drill bit
binding on
some type of subterranean formation. The magnetometers then illustrate a large
increase in rotational speed, to about 120 RPM 611Y, when the drill bit is
freed from
the binding force. This increase in rotation is also illustrated by the
accelerometer
measurements 620X, 620Y, and 620Z.
FIG. 11 illustrates waveforms (620X, 620Y, and 620Z) for data collected by the
accelerometers. Waveform 630Y illustrates the variance calculated by the
software for
the Y accelerometer. Waveform 640Y illustrates the threshold value calculated
by the
software for the Y accelerometer. This Y threshold value may be used, alone or
in
combination with other threshold values, to determine if a data mode change
should
occur.
FIG. 12 illustrates waveforms (620X, 620Y, and 620Z) for the same data
collected by the accelerometers as is shown in FIG. 11. FIG. 12 also shows
waveform
630X, which illustrates the variance calculated by the software for the X
accelerometer.
Waveform 640X illustrates the threshold value calculated by the software for
the X
accelerometer. This X threshold value may be used, alone or in combination
with other
threshold values, to determine if a data mode change should occur.
As stated earlier, time varying data such as that illustrated above with
respect to
FIGS. 9-12 may be analyzed for detection of specific events. These events may
be used
within the data analysis module to modify the behavior of the data analysis
module. By
way of example and not limitation, the events may cause changes such as,
modifying
power delivery to various elements within the data analysis module, modifying
communications modes, and modifying data collection scenarios. Data collection
CA 02676459 2009-07-20
WO 2008/106022 PCTIUS2008/002078
scenarios may be modified, for example by modifying which sensors to activate
or
deactivate, the sampling frequency for those sensors, compression algorithms
for
collected data, modifications to the amount of data that is stored in memory
on the data
analysis module, changes to data deletion protocols, modification to
additional
5 triggering event analysis, and other suitable changes.
Trigger event analysis may be as straightforward as the threshold analysis
described above. However, other more detailed analysis may be performed to
develop
triggers based on bit behavior such as bit dynamics analysis, formation
analysis, and the
like.
10 Many algorithms are available for data compression and pattern recognition.
However, most of these algorithms are frequency based and require complex,
powerful
digital signal processing techniques. In a downhole drill bit environment
battery power,
and the resulting processing power may be limited. Therefore, lower power data
compression and pattern recognition analysis may be useful. Other encoding
15 algorithms may be utilized on time varying data that are time based, rather
than
frequency based. These encoding algorithms may be used for data compression,
wherein only the resultant codes representing the time varying waveform are
stored,
rather than the original samples. In addition, pattern recognition may be
utilized on the
resultant codes to recognize specific events. These specific events may be
used, for
20 example, for adaptive threshold triggering. Adaptive threshold triggering
may be
adapted for detection of specific types of known behaviors, such as, for
example, bit
whirl, bit bounce, bit wobble, bit walking, lateral vibration, and torsional
oscillation.
Adaptive threshold triggering may be also adapted for various levels of
severity for
these bit behaviors.
25 As an example, one such analysis technique includes time encoded signal
processing and recognition (TESPAR), which has been conventionally used in
speech
recognition algorithms. Embodiments of the present invention have extended
TESPAR
analysis to recognize bit behaviors that may be of interest to record
compressed data or
to use as triggering events.
30 TESPAR analysis may be considered to be performed in three general
processes. First, TESPAR parameters are extracted from a time varying
waveform.
Next, the TESPAR parameters are encoded into alphabet symbols. Finally, the
resultant encodings may be classified, or "recognized."
CA 02676459 2009-07-20
WO 2008/106022 PCT/US2008/002078
36
TESPAR analysis is based on the location of real and complex zeros in a time
varying waveform. Real zeros are represented by zero crossings of the
waveform,
whereas complex zeros may be approximated by the shape of the waveform between
zero crossings.
FIG. 13 illustrates a waveform and TESPAR encoding of the waveform. The
signal between each zero crossing of the waveform is termed an epoch. Seven
epochs
are shown in the waveform of FIG. 13. Another TESPAR parameter is the duration
of
an epoch. The duration is defined as the number of samples, based on the
sample
frequency collected for each epoch. To illustrate the duration, sample points
are
included in the first epoch showing eight samples for a duration of eight. An
example
sampling frequency that may be useful for accelerometer data and derivatives
thereof, is
about 100 Hz.
Another parameter defined for TESPAR analysis is the shape of the waveform
in the epoch. The shape is defined as the number of positive minimas or the
number of
negative maximas in an epoch. Thus, the shape for the third epoch is defined
as one
because it has one minima for a waveform in the positive region. Similarly,
the shape
for the fourth epoch is defined as two because it has two maximas for the
waveform in
the negative region. A final parameter that may be defined for TESPAR analysis
is the
amplitude, which is defined as the amplitude of the largest peak within the
epoch. For
example, the seventh epoch has an amplitude of 13. FIG. 13 illustrates the
parameters
for each of the epochs of the waveform, wherein E=epoch, D=duration, S=shape,
and
A=amplitude.
With the waveform now extracted into TESPAR parameters, rather than storing
samples of the waveform at every point, the waveform maybe stored as
sequential
epochs and the parameters for each epoch. This represents a type of lossy data
compression wherein significantly less data needs to be stored to adequately
represent
the waveform, but the waveform cannot be recreated with as much accuracy as
when it
was originally sampled.
The waveform may be further analyzed, and further compressed, by converting
the TESPAR parameters to a symbol alphabet. FIG. 14 illustrates a possible
TESPAR
alphabet for use in encoding possible sampled data. The matrix of FIG. 14
shows the
shape parameter as columns and the duration parameter as rows. In the TESPAR
alphabet of FIG. 14, there are 28 unique symbols that may be used to represent
the
CA 02676459 2009-07-20
WO 2008/106022 PCT/US2008/002078
37
various matrix elements. Thus, an epoch with a duration of four and a shape of
one
would be represented by the alphabet symbol "4." Similarly, an epoch with a
duration
of 37 and a shape of three would be represented by the alphabet symbol "26."
While the alphabet illustrated in FIG. 14 may be used for a wide variety of
time
varying waveforms, different alphabets may be defined and tailored for
specific types of
data collection, such as accelerometer and magnetometer readings useful for
determining bit dynamics. Those of ordinary skill in the art will also
recognize that the
alphabet of FIG. 14 only goes up to a duration of 37 and a shape of 5. Thus,
with this
alphabet, it is assumed that for accurate TESPAR representation, the duration
from one
zero crossing to the next will be less than 37 samples and there will be no
more than 5
minima or maxima within any given epoch.
Coding the epochs into alphabet symbols creates additional lossy compression
as each epoch may be represented by its alphabet symbol and its amplitude. In
some
applications, the amplitude may not be needed and simply the alphabet symbol
may be
stored. Encoding the waveform of FIG. 13 yields a TESPAR symbol stream of
7-13-12-16-8-10-22 for the epochs I through 7.
For any given waveform, the waveform may be represented as a histogram
indicating the number of occurrences of each TESPAR symbol across the duration
of
the TESPAR symbol stream. An example histogram is illustrated in FIG. 15. A
histogram such as the one illustrated in FIG. 15 is often referred to as an S-
matrix.
One of the strengths of TESPAR encoding is that it is easily adaptable to
pattern
recognition and has been conventionally applied to speech recognition to
recognize
speakers and specific words that are spoken by a variety of speakers.
Embodiments of
the present invention use pattern recognition to recognize specific behaviors
of drill bit
dynamics that may then be used as an adaptive threshold trigger. Some
behaviors that
may be recognized are whirl and stick/slip behaviors, as well as variations on
these
based on the severity of the behavior. Other example behaviors are the change
in
behavior of a drill bit based on how dull the cutters are or the type of
formation that is
being drilled, as well as specific energy determination defined as the energy
exerted in
drilling versus the volume of formation removed, or efficiency defined as the
actual
amount of work performed versus the minimum possible work performed.
Artificial neural networks may be trained to recognize specific patterns of
S-matrices derived from TESPAR symbol streams. The neural networks are trained
by
CA 02676459 2009-07-20
WO 2008/106022 PCT/US2008/002078
38
processing existing waveforms that exhibit the pattern to be recognized. In
other
words, to recognize whirl, existing accelerometer data from a number of
different bits
or a number of different occurrences of whirl are encoded into a TESPAR symbol
stream and used to train the neural network.
A single neural network configuration is shown in FIG. 16. The input layer of
the network includes a value for each of the TESPAR symbols indicating how
many
times each symbol occurs in the waveform. The network of FIG. 16 includes five
nodes in the hidden layer of the network and six nodes in the output layer of
the
network indicating that six different patterns may be recognized. Of course,
many
configurations of hidden nodes and output nodes may be defined in the network
and
tailored to the types of behaviors to be recognized. As is understood by those
of
ordinary skill in the art of neural network analysis, the network uses the
sample data
sets as training information based on knowledge that the training set
represents a
desired behavior. The network is taught that a specific pattern on the input
nodes
should produce a specific pattern on the output nodes based on this prior
knowledge.
The more training data that is applied to the network, the more accurately the
network
is trained to recognize the specific behaviors and nuances of those behaviors.
Training
occurs offline (i.e., before use of the network as implemented in the data
analysis
module downhole) and the resultant trained network may then be loaded into the
data
analysis module in the drill bit.
At this trained stage, the trained network may be used for pattern
recognition.
FIG. 17 is a flow diagram illustrating a possible software flow using TESPAR
analysis
for encoding, data compression, and pattern recognition of sampled data. The
TESPAR
process 800 begins by acquiring samples of data from sensor(s) of interest at
process
block 802. This data may include waveforms from sensors such as, for example,
accelerometers, magnetometers, and the like. Decision block 804 tests to see
if
additional processing is needed on the data prior to encoding. If no
additional
processing is needed, flow continues at process block 808. If additional
processing is
needed, that processing is performed as indicated by process block 806. This
additional
processing may take on a variety of forms. For example, accelerometer data may
be
combined and converted from one coordinate system to another and data may be
filtered. As another example, accelerometer data may be integrated to form
velocity
profiles or bit trajectories.
CA 02676459 2012-04-03
39
At process block 808, the desired time varying waveform data is converted to
TESPAR parameters as described above. If this level of data compression is
desired, the
TESPAR parameters may be stored for each epoch, creating a TESPAR parameter
stream.
At process block 810, the TESPAR parameters are converted to TESPAR symbols
using the appropriate alphabet as described above. If this level of data
compression is
desired, the TESPAR symbols may be stored for each epoch creating a TESPAR
symbol
stream.
At process block 812, the TESPAR symbol stream is converted to an S-matrix
by determining the number of occurrences of each symbol within the stream, as
is
explained above. If this level of data compression is desired, the S-matrix
may be
stored.
Decision block 814 determines whether pattern recognition is desired. If not,
the TESPAR analysis was used for data compression only, and the process exits.
If
pattern recognition is desired, the S-matrix is applied to the trained neural
network to
determine if any trained bit behavior is a match to the S-matrix, as is shown
in process
block 816.
At process block 818, if there is a match to a trained bit behavior, and that
matched behavior is to be used as a triggering event, the triggering event may
be used to
modify behavior of the data analysis module.
The scope of the claims should not be limited by the preferred embodiments set
forth in the examples, but should be given the broadest interpretation
consistent with the
description as a whole.