Note: Descriptions are shown in the official language in which they were submitted.
CA 02689430 2009-12-01
WO 2009/023713 PCT/US2008/073019
-1-
ASSESSMENT OF PRELOAD DEPENDENCE
AND FLUID RESPONSIVENESS
CLAIM OF PRIORITY UNDER 35 U.S.C. 119
The present Application for Patent claims priority to Provisional
Application No. 60/955,588 filed August 13, 2007, and assigned to the assignee
hereof and hereby expressly incorporated by reference herein.
BACKGROUND
Indicators such as stroke volume (SV), cardiac output (CO), end-
diastolic volume, ejection fraction, stroke volume variation (SVV), pulse
pressure variation (PPV), and systolic pressure variations (SPV), among
others,
are important not only for diagnosis of disease, but also for "real-tune"
monitoring of preload dependence, fluid responsiveness, or volume
responsiveness condition of both human and animal subjects. Few hospitals are
therefore without some form of equipment to monitor one or more of these
cardiac parameters. Many techniques, including invasive techniques, non-
invasive techniques, and combinations thereof, are in use and even more have
been proposed in the literature.
Many of the techniques used to measure SV can be adapted to provide
an estimate of CO as well, because CO is generally defined as SV times the
heart rate (Z-IR), which is usually available to monitoring equipment.
Conversely, most devices that estimate CO also estimate SV in their
calculations. One way to estimate SVV is simply to collect multiple SV values
and calculate the differences from measurement interval to measurement
interval.
One way to measure SV or CO is to mount a flow-measuring device on
a catheter, and position the device in or near the subject's heart. Some such
devices inject either a bolus of material or energy (usually heat) at an
upstream
position, such as in the right atrium, and determine flow based on the
characteristics of the injected material or energy at a downstream position,
such
as in the pulmonary artery. Patents that disclose implementations of such
9244 I.DOC FCC-5949 PCT
CA 02689430 2009-12-01
WO 2009/023713 PCT/US2008/073019
-2-
invasive techniques (in particular, thermodilution) include: U.S. Pat. No.
4,236,527 (Newbower et al., 2 Dec. 1980); U.S. Pat. No. 4,507,974 (Yelderman,
2 Apr. 1985); U.S. Pat. No. 5,146,414 (McKown, et al., 8 Sep. 1992); and U.S.
Pat. No. 5,687,733 (MeKown, et al., 1.8 Nov. 1997). Other invasive devices are
based on the known Fick technique, according to which CO is calculated as a
function of oxygenation of arterial and mixed venous blood.
Invasive techniques have obvious disadvantages, especially when the
subjects in need of such monitoring are already in the hospital due to a
serious
condition. Invasive methods also have less obvious disadvantages, for example,
some techniques such as thermodilution rely on assumptions, such as uniform
dispersion of the injected heat, that affect the accuracy of the measurements.
Moreover, the introduction of an instrument into the blood flow may affect the
value that the instrument measures.
Doppler techniques, using invasive as well as non-invasive transducers,
have also been used to obtain flow rate data that can then be used to
calculate
SV and CO. However, these systems are typically expensive, and their
accuracy depends on precise knowledge of the diameter and general geometry
of the flow channel. Such precise knowledge is, however, seldom possible,
especially under conditions where real-time monitoring is desired..
One blood characteristic that can be obtained with minimal or no
invasion is blood pressure. In addition to causing minimal patient trauma,
blood
pressure measurement technology has the added benefit of being accurate.
Many blood pressure measurement systems rely on the pulse contour
method (PCM), which calculates an estimate of one or more cardiac parameters
of interest, such as CO, from characteristics of a blood pressure waveform. In
the PCM, "Windkessel" parameters, such as characteristic impedance of the
aorta, compliance, and total peripheral resistance, are often used to
construct a
linear or non-linear, hemodynamic model of the aorta. In essence, blood flow
is
analogized to a flow of electrical current in a circuit in which an impedance
is in
series with a parallel-connected resistance and capacitance (compliance). The
three required parameters of the model are usually determined either
9244 I.DOC BCC-5949 PCT
CA 02689430 2009-12-01
WO 2009/023713 PCT/US2008/073019
-3-
empirically, through a complex calibration process, or from compiled
"anthropometric" data, i.e., data about the age, sex, height, weight, and/or
other
parameters of other patients or test subjects. U.S. Pat. No. 5,400,793
(Wesseling, 28 Mar. 1995) and U.S. Pat. No. 5,535,753 (Petrucelli,.et al., 16
Jul.
1996) disclose systems that rely on a Windkessel circuit model to determine
Co.
PCM-based systems can monitor SV-derived cardiac parameters using
blood pressure measurements taken using a variety of measurement apparatus,
such as a finger cuff, and can do so more or less continuously. This ease of
use
comes at the potential cost of accuracy, however, as the PCM can be no more
accurate than the rather simple, three-parameter model from which it was
derived. A model of a much higher order would be needed to faithfully account
for other phenomena. Many improvements, with varying degrees of
complexity, have been proposed for improving the accuracy of the basic PCM
model.
Recently, several studies have confirmed the clinical significance of
monitoring the variations observed in left ventricular stroke volume that
result
from the interaction of the cardiovascular system and the lungs under
mechanical ventilation. These stroke volume variations (SVV) are caused by
the cyclic increases and decreases in the intrathoracic pressure due to the
mechanical ventilation, which lead to variations in the cardiac preload and
afterload. SVV has recently been extensively investigated and several studies
have shown the usefulness of using SVV as a predictor of preload dependence
and fluid responsiveness in various clinical situations. Several other
parameters
based on SVV have been found to be useful as well. In particular, systolic
pressure variation (SPV) with its delta-Up (SUp) and delta-Down (ADown)
components has been found to be a very useful predictor of preload dependence
and fluid responsiveness. SPV is based on the changes in the arterial pulse
pressure due to respiration-induced variations in stroke volume. Yet another
parameter that has recently been investigated and shown to be a valid
indicator
9244 1.D C ECC-5949 PCT
CA 02689430 2009-12-01
WO 2009/023713 PCT/US2008/073019
-4-
of preload dependence and fluid responsiveness is the pulse pressure variation
(PPV).
These recent developments in arterial pulse contour analysis methods
have opened unique opportunities for less-invasive, continuous and real-time
estimation of SVV. This allows clinicians to use SVV routinely along with SV
and CO in their assessment of the hemodynamic state of critical care patients.
Existing systems for measuring preload dependence and fluid
responsiveness based on respiration-induced changes in the arterial pulse
pressure are almost all based on one of only a few methods. Some of the
methods described in the literature include the measurements of Pulse Pressure
Variation (PPV), Systolic Pressure Variation (SPV) and Stroke Volume Variation
(SVV).
PPV estimation is based on Equation 1:
(Equation 1) PPV =100 x (PP, - Ppf,R )
tDD
l2V "ni +Pp i.)J
where PP is the measured pulse pressure, and PPmax and PPm's^ are,
respectively, the maximum and the minimum peak-to-peak values of the pulse
pressure during one respiratory (inspiration-expiration) cycle.
SPV estimation is based on Equation 2:
(Equation 2) SPV =100 x ~(SPmM - SP;2,) .
/2(SP,,,ax +SP,nÃn)
where SP is the measured systolic pressure, and SPmax and SPmjn are,
respectively, the maximum and minimum values of the systolic pressure during
one respiratory cycle.
Similarly, SVV estimation is based on Equation 3:
(Equation 3) S W =100 x- S)
_(s
(SV,-- + SV--i,,
9244] .DOC ECC-5949 PCT
CA 02689430 2009-12-01
WO 2009/023713 PCT/US2008/073019
-5-
where SV is the stroke volume, and SVmax and SV,,,iõ are, respectively,
the maximum and minimum values of the stroke volume during one respiratory
cycle.
In Equations 1, 2, and 3, the denominators are the averages of the
maximum and minimum values of PP, SP and SV, respectively. In other words,
the denominators are mean values, albeit of only two measurement points. This
simple averaging of extreme values has been most common merely to simplify
the calculations, which have typically been performed by hand. More reliable
values may be obtained, however, by using the mean of all the measurement
values over the measurement interval, that is, the first statistical moment of
PP,
SP, and SV.
Thus, for each of PPV, SPV and SVV, the respective variation value
formula expresses the magnitude of the range of the value (maximum minus
minimum) relative to the mean of the extreme (maximum and minimum)
values.
The specific monitoring of SVV has both specific difficulties and
advantages. Physiologically, SVV is based on several complex mechanisms of
cardio-respiratory interaction. In brief. mechanical ventilation causes
changes
in left ventricular preload, which leads to distinct variations in left
ventricular
stroke volume and systolic arterial pressure. Monitoring of SVV enables
prediction of left ventricular response to volume administration and helps
with
correct assessment of hypovolemia and the subsequent decision to undertake
volume resuscitation in many critical situations.
SUMMARY
Methods for determining a cardiovascular parameter reflecting preload
dependence fluid responsiveness or volume responsiveness are disclosed.
These methods involve receiving a waveform dataset corresponding to an
arterial blood pressure signal, or any signal proportional to, or derived from
the
arterial blood pressure signal, such as pulse oximetry (pulseox), Doppler
ultrasound, or bioimpedance signal, and analyzing the signal to detect
premature
ventricular and/or atrial contractions. If any premature ventricular and/or
atrial
9244 1.DOC BCC-5949 PCT
CA 02689430 2009-12-01
WO 2009/023713 PCT/US2008/073019
-6-
contractions are present, they are removed from the waveform dataset. Once
the premature ventricular and/or atrial contractions are removed, a
cardiovascular parameter reflecting preload dependence and fluid
responsiveness or volume responsiveness using the modified waveform dataset
can be calculated. Removal of the premature ventricular and/or atrial
contraction data from the dataset increases the accuracy and sensitivity of
calculations performed on the dataset waveform.
The methods for detecting a premature ventricular and/or atrial
contraction disclosed herein include identifying an individual cardiac cycle
in
the waveform/signal dataset and comparing one or more parameters of the
individual cardiac cycle to one or more parameters of a control cardiac cycle.
As used herein, the term waveform dataset refers to a set of data
corresponding
to a signal, e.g., an arterial blood pressure signal, or any signal
proportional to,
or derived from the arterial blood pressure signal, such as pulse oximetry
(pulseox), Doppler ultrasound, or bioimpedance signal. The individual cardiac
cycle is identified as a premature ventricular or atrial contraction if the
one or
more parameters of the individual cardiac cycle differs from the one or more
parameters of the control cardiac cycle by a predetermined amount. Individual
or multiple parameters of the cardiac cycle can be used for comparison.
Methods for detecting arrhythmia are also disclosed. These methods
involve receiving a waveform dataset corresponding to an arterial blood
pressure signal, or any signal proportional to or derived frome the arterial
blood
pressure signal, such as pulseox, Doppler ultrasound or bioimpedance signal
and analyzing the waveform to detect premature ventricular or atrial
contractions. If the number of premature ventricular or atrial contractions
exceeds a predetermined arrhythmia threshold, a user, such as a medical
professional, is notified. Also, if the variability of one or more parameters
of the
individual cardiac cycles, exceeds a preditermined threshold, the respective
interval is considered an arrhythmia intervas and, a user, such as a medical
professional, is notified. The methods for detecting premature ventricular or
atrial contractions are the same as those described above.
9244 I.130C ECC-5949 PCT
CA 02689430 2009-12-01
WO 2009/023713 PCT/US2008/073019
-7-
DESCRIPTION OF DRAWINGS
Fig. 1 is an atrial pressure versus time (1/100`x' second increments)
waveform displaying several cardiac cycles.
Fig. 2 is an atrial pressure versus time (1/100th second increments)
waveform that contains two premature ventrical contractions.
Fig. 3 is an atrial pressure versus time (1/100th second increments)
waveform showing three cardiac cycles.
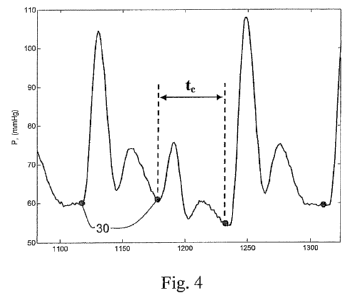
Fig. 4 is an atrial pressure versus time (1/100th second increments)
waveform annotated to indicate the duration of a cardiac cycle (Q.
Fig. 5 is an atrial pressure versus time (11100th second increments)
waveform annotated to indicate the duration of a systole (ts) and the duration
of
a diastole (td).
Fig. 6 is an atrial pressure versus time (1/100th second increments)
waveform annotated to indicate the duration of a systolic rise (tr) and the
duration of a systolic decay (tdec).
Fig. 7 is an atrial pressure versus time (1/100th second increments)
waveform annotated to indicate the duration of the overall decay (tov dec).
Like reference numerals and symbols in the various drawings indicate
like elements.
DETAILED DESCRIPTION
Disclosed herein are methods for determining a cardiovascular
parameter reflecting fluid or volume responsiveness by using a waveform
dataset corresponding to a signal, for example, from an arterial blood
pressure,
or any signal proportional to, or derived from the arterial pressure signal
such as
pulseox signal, Doppler ultrasound or bioimpedanee measurement device.
These methods involve detecting premature ventricular or atrial contractions
and. removing these contractions from the waveform dataset prior to
calculating
the cardiovascular parameter. The premature ventricular or atrial contractions
are detected by a variety of methods.
Also disclosed herein are methods of detecting arrhythmia by using a
waveform dataset corresponding to a signal, for example, from an arterial
blood
9244 1.DOC ECC-5949 PCT
CA 02689430 2009-12-01
WO 2009/023713 PCT/US2008/073019
-8-
pressure or any signal proportional to, or derived from the arterial pressure
signal such as, pulseox, Doppler ultrasound or bioimpedance measurement
device. These methods involve detecting premature ventricular or atrial
contractions. In these methods, a user such as a medical professional is
notified
if the number of premature ventricular or atrial contractions exceeds a
predetermined arrhythmia threshold. The premature ventrical or atrial
contractions are detected by a variety of methods.
Determining a cardiovascular parameter reflecting preload dependence,
fluid responsiveness, or volume responsiveness according to the methods
described herein involves receiving a waveform or a signal dataset. As used
herein, the term waveform dataset refers to a set of data corresponding to a
signal, e.g., an arterial blood pressure signal, or any signal proportional
to, or
derived from the arterial blood pressure signal, such as pulse oximetry
(pulseox), Doppler ultrasound, or bioimpedance signal. This dataset is then
analyzed to detect any premature ventricular or atrial contractions. If any
premature ventricular or atrial contractions are detected, these premature
ventrical or atrial contractions are removed from the waveform dataset. The
resulting waveform dataset is referred to herein as a modified waveform
dataset.
Finally, a cardiovascular parameter reflecting preload dependence, fluid
responsiveness, or volume responsiveness is calculated using the modified
waveform dataset.
Detecting premature ventricular or atrial contractions can be
accomplished by identifying an individual cardiac cycle in a waveform dataset
and comparing one or more parameters of the individual cardiac cycle to one or
more parameters of a control cardiac cycle. Premature ventricular or atrial
contractions are identified by comparing the one or more parameters of an
individual cardiac cycle with the same one or more parameters from a control
cardiac cycle. If the one or more parameters of the individual cardiac cycle
differ by a predetermined threshold amount from the same one or more
parameters from the control cardiac cycle, the individual cardiac cycle is
identified as a premature ventricular or atrial contraction.
9244 1.DOC ECC-5949 PCT
CA 02689430 2009-12-01
WO 2009/023713 PCT/US2008/073019
-9-
The parameters used for comparison are statistical and other
measurements based on portions or phases of a cardiac cycle. The portions of a
cardiac cycle used herein by way of example are shown in Figs. 1-7. In each of
Figs. 1-7, the x-axis units are I00ths of a second (e.g., 100 x-axis units
corresponds to 1 second and 200 x-axis units corresponds to 2 seconds). Fig. 1
shows an atrial pressure waveform 10 with several cardiac cycles 20. The dots
along the atrial pressure waveform 10 indicate the end-diastolic pressure 30
of
one cardiac cycle and the start of the next cardiac cycle. Fig. 2 shows an
atrial
pressure waveform 50 with two premature ventrical contractions 60. The
premature ventrical contractions 60 in Fig. 2 generated cardiac cycles with
less
pressure when compared to the other cardiac cycles 20. Fig. 3 shows an atrial
pressure waveform 80 with three cardiac cycles (90, 100, and 110). The middle
cardiac cycle 100 represents a premature ventricular contraction. The
inflection
point of an arterial pressure waveform of a cardiac cycle that defines the end
of
the systolic phase and the beginning of the diastolic phase is called a
dichrotie
notch 120.
The ending/starting point of a cardiac cycle 30 and the dichrotic notch
120 provide starting and ending points for defining various parameters used
with the methods described herein. The parameters used herein include the
entire cardiac cycle, the systole, the diastole, the systolic rise, the
systolic decay,
and the overall decay of an arterial pressure signal. The time components of
each of these parameters are also used, i.e., useful parameters include
duration
of the entire cardiac cycle (ta), duration of the systole (ts), duration of
the
diastole (td), duration of the systolic rise (tt), duration of the systolic
decay (tdec),
and duration of the overall decay
The duration of a cardiac cycle, t, is shown in Fig. 4. As shown, t, is
the time between the start point 30 of the cardiac cycle and the end point of
the
cardiac cycle.
The duration of a systole, t,, is shown in Fig. 5. As shown, is is the time
between the start point 30 of the cardiac cycle and the dichrotic notch 120 of
the
cardiac cycle.
92441 -DOC FCC-5949 PCT
CA 02689430 2009-12-01
WO 2009/023713 PCT/US2008/073019
-10-
The duration of the diastole, td, is also shown in Fig. 5. As shown, td is
the time between the dichrotic notch 120 of the cardiac cycle and the end
point
of the cardiac cycle.
The duration of a systolic rise, tr, is shown in Fig. 6. As shown, t,- is the
time from the start point 30 of the cardiac cycle to the maximum point 130 of
the initial increase in arterial pressure after the onset of the systole.
The duration of the systolic decay, td,,, is also shown in Fig. 6. As
shown, tote,, is the time from the maximum point 130 of the initial increase
in
arterial pressure after the onset of the systole to the dichrotic notch 120.
The duration of the overall decay, toi,-dec, is shown in Fig. 7. As shown,
toy, dcc is the time from the maximum point 130 of the initial increase in
arterial
pressure after the onset of the systole to the end point of the cardiac cycle.
One method to detect a premature ventricular or atrial contraction is to
analyze the durations of the different phases of the cardiac cycle, i.e., time
intervals of the different phases, of an arterial waveform/signal as just
described
are compared. The methods described herein, for example, compare the
durarion of the entire cardiac cycle (i.e. the beat heart rate), the duration
of the
systole, the duaration of the diastole, the duration of the systolic rise, the
duration of the systolic decay, and/or the duration of the entire decay.
Another method to detect a premature ventricular or atrial contraction is
to analyze the location of the dichrotic notches of an arterial
waveform/signal.
For example, the location of a dichrotic notch versus the maximum systolic
pressure and the location of a dichrotic notch versus the diastolic pressure
(the
minimum pressure of the cardiac cycle before the maximum systolic pressure)
are analyzed.
To detect a premature ventrical or atrial contraction, the statistical
characteristics, i.e., statistical moments, of the different portions of an
arterial
waveform as just described are compared. In the methods described herein the
first four statistical moments, i.e., mean, variance, skewness, and kurtosis,
are
used. The following equations can be used to calculate the first four
statistical
moments (where N is the total number of samples during systole):
9244 1.D C ECC-5949 PCT
CA 02689430 2009-12-01
WO 2009/023713 PCT/US2008/073019
-11-
Mean:
N-1
(Equation 4) 11Ip = 1 P(k)
N -I k=O
Variance:
(Equation 5) Y 2 = ~-2 = 1 (P(k)- Pavg I
P Up
Skewness:
I N-Ir P(k)_ Pavg
(Equation 6) P3 p N _ Y, p
Kurtosis:
4
(Equation 7) ,u_ N~~ P`~~-Pp N-1~ 6 avg
P
Additional characteristics that can be used to compare cardiac cycles
include the power of the phases of the cardiac cycles as discussed above as
well
as frequency characteristics and time-frequency characteristics of the phases.
The power of a phase of the cardiac cycle is measured as the integral of the
cardiac signal under each phase. The power can be calculated by integrating
the
signal within each phase. Thus, for example, the power of the systole phase,
Esys, can be calculated using the following equation (where N is the total
number of samples during systole):
k=N-1
(Equation 8) Sys -- I P(k)
k=0
9244_I .DOC ECC-5949 PCT
CA 02689430 2009-12-01
WO 2009/023713 PCT/US2008/073019
-12-
The frequency characteristics of each phase of a cardiac cycle can be
derived by performing a Fourier transform analysis. Various known Fourier
transforms including fast Fourier transforms can be used.
The time-frequency characteristics of each phase of a cardiac cycle can
be derived using wavelet transform analysis. Wavelet analysis is well suited
for
analyzing signals which have transients or other non-stationary
characteristics
in the time domain. In contrast to Fourier transforms, wavelet analysis
retains
information in the time domain, i.e., when the event occurred.
In comparing statistical or other characteristics or parameters of one or
more portions of a cardiac cycle to a control cardiac cycle, different
approaches
can be used. For example, one or more characteristics of a cardiac cycle can
be
compared to the same characteristic(s) of the cardiac cycle immediately
preceding the cardiac cycle being examined, i.e., the control cardiac cycle is
the
cardiac cycle immediately preceding the cardiac cycle being examined.
Another comparison can involve comparing one or more characteristics of a
cardiac cycle with the same characteristic(s) of the cardiac cycle immediately
following the cardiac cycle being examined, i.e., the control cardiac cycle is
the
cardiac cycle immediately following the cardiac cycle being examined. A
further comparison can involve comparing one or more characteristics of a
cardiac cycle with both the cardiac cycle immediately preceding the cardiac
cycle being examined and the cardiac cycle immediately following the cardiac
cycle being examined, i.e., the control cardiac cycles are the cardiac cycle
immediately preceding the cardiac cycle being examined and the cardiac cycle
immediately following the cardiac cycle being examined. An additional
comparison can involve comparing one or more characteristics of a cardiac
cycle with the same characteristic(s) in a median cardiac cycle from a
sequence
containing at least three cardiac cycles, i.e., the control cardiac cycle is a
median cardiac cycle from a sequence containing at least three cardiac cycles.
Another comparison can involve comparing one or more characteristics of a
cardiac cycle with the same characteristic(s) in a statistical measurement of
a
phase of a cardiac cycle, i.e., the control cardiac cycle is a statistical
9244 1.D C ECC-5949 PCT
CA 02689430 2009-12-01
WO 2009/023713 PCT/US2008/073019
-13-
representation of the measurement being compared. These comparison
examples have been presented as comparisons of one or more characteristics,
however, as will be apparent to one of skill in the art, multiple parameters
for
individual or multiple portions of the cardiac cycle can be used. Further, as
will
also be apparent to one of skill in the art, as these methods are likely to be
performed using computer devices, a large number of these comparisons can be
performed in real time.
In making such comparisons, predetermined thresholds can be used. As
used herein, a predetermined threshold is a value assigned prior to a
comparison
being made. Generally, the predetermined threshold for a parameter will
indicate a value related to a control cardiac cycle as measured, for example,
from the subject being monitored, from averaged, or from anthropomorphic
data. Depending on the parameter measured, the predetermined threshold can
ba a very small value or difference, or could be a larger value. Such
predetermined thresholds will be easily provided by a medical professional or
instrument operator. The predetermined threshold amount selected for a
particular parameter will depend on the accuracy of the particular parameter
used.
For example, if a single parameter is used, a predetermined threshold
amount can be a difference of 30 percent or more as compared to the same
parameter of the control cardiac cycle, a difference of 25 percent or more as
compared to the same parameter of the control cardiac cycle, a difference of
20
percent or more as compared to the same parameter of the control cardiac
cycle,
a difference of 15 percent or more as compared to the same parameter of the
control cardiac cycle, a difference of 10 percent or more as compared to the
same parameter of the control cardiac cycle, a difference of 5 percent or more
as
compared to the same parameter of the control cardiac cycle, a difference of 4
percent or more as compared to the same parameter of the control cardiac
cycle,
a difference of 3 percent or more as compared to the same parameter of the
control cardiac cycle, a difference of 2 percent or more as compared to the
same
parameter of the control cardiac cycle, a difference of 1 percent or more as
9244 I .DOC ECC-5949 PCT
CA 02689430 2009-12-01
WO 2009/023713 PCT/US2008/073019
-14-
compared to the same parameter of the control cardiac cycle, a difference of
0.5
percent or more as compared to the same parameter of the control cardiac
cycle,
a difference of 0.4 percent or more as compared to the same parameter of the
control cardiac cycle, a difference of 0.3 percent or more as compared to the
same parameter of the control cardiac cycle, a difference of 0.2 percent or
more
as compared to the same parameter of the control cardiac cycle, or a
difference
of 0.1 percent or more as compared to the same parameter of the control
cardiac
cycle.
Further, if more than one parameter is used, the predetermined threshold
amount will depend on the particular combination of parameters used in
combination with the accuracy of the parameter measurements. For example, if
more than one parameter is used, a predetermined threshold amount can be a
difference of 30 percent or more as compared to the same one or more
parameters of the control cardiac cycle, a difference of 25 percent or more as
compared to the same one or more parameters of the control cardiac cycle, a
difference of 20 percent or more as compared to the same one or more
parameters of the control cardiac cycle, a difference of 15 percent or more as
compared to the same one or more parameters of the control cardiac cycle, a
difference of 10 percent or more as compared to the same one or more
parameters of the control cardiac cycle, a difference of 5 percent or more as
compared to the same one or more parameters r of the control cardiac cycle, a
difference of 4 percent or more as compared to the same one or more
parameters of the control cardiac cycle, a difference of 3 percent or more as
compared to the same one or more parameters of the control cardiac cycle, a
difference of 2 percent or more as compared to the same one or more
parameters of the control cardiac cycle, a difference of 1 percent or more as
compared to the same one or more parameters of the control cardiac cycle, a
difference of 0.5 percent or more as compared to the same one or more
parameters of the control cardiac cycle, a difference of 0.4 percent or more
as
compared to the same parameter of the control cardiac cycle, a difference of
0.3
percent or more as compared to the same parameter of the control cardiac
cycle,
9244 I .DOC FCC-5949 PCT
CA 02689430 2009-12-01
WO 2009/023713 PCT/US2008/073019
- 15-
a difference of 0.2 percent or more as compared to the same parameter of the
control cardiac cycle, or a difference of 0.1 percent or more as compared to
the
same parameter of the control cardiac cycle. Typically, the greater the number
of parameters used, the lower the predetermined threshold amounts are for each
parameter.
In addition to the preditermined thresholds, all the parameters used for
an analysis can be assembled in a single parameters data set. In a dataset,
the
accuracy of a particular parameter defines the weight of the parameter in the
parameters data set. Based on the weight of a respective parameter in the
parameters dataset a threshold is assigned to each parameter and the number of
parameters from the parameters dataset exceeding the preditermined thresholds
are counted. When multiple parameters are used, each parameter can have its
own predetermined threshold amount. For example, a predetermined threshold
amount can be a difference of 30 percent or more as compared to the same
parameter of the control cardiac cycle, a difference of 25 percent or more as
compared to the same parameter of the control cardiac cycle, a difference of
20
percent or more as compared to the same parameter of the control cardiac
cycle,
a difference of 15 percent or more as compared to the same parameter of the
control cardiac cycle, a difference of 10 percent or more as compared to the
same parameter of the control cardiac cycle, a difference of 5 percent or more
as
compared to the same parameter of the control cardiac cycle, a difference of 4
percent or more as compared to the same parameter of the control cardiac
cycle,
a difference of 3 percent or more as compared to the same parameter of the
control cardiac cycle, a difference of 2 percent or more as compared to the
same
parameter of the control cardiac cycle, a difference of 1 percent or more as
compared to the same parameter of the control cardiac cycle, or a difference
of
0.5 percent or more as compared to the same parameter of the control cardiac
cycle. As a specific example, a first parameter could have a predetermined
threshold amount of a difference of 15 percent or more as compared to the same
parameter of the control cardiac cycle and a second parameter could have a
predetermined threshold amount of a difference of 4 percent or more as
9244 1.DOC ECC-5949 PCT
CA 02689430 2009-12-01
WO 2009/023713 PCT/US2008/073019
-16-
compared to the same parameter of the control cardiac cycle. The number of
predetermined threshold amounts can be equal to or less than the number of
parameters evaluated.
Once a premature ventricular or atrial contraction is detected the signal
is removed from the waveform dataset, For example, in the waveform dataset
provided in Figure 3, cardiac cycle 100 representing a premature ventricular
contraction would be removed from the waveform dataset and the calculations
would be based just on the preceding and following cardiac cycles 90 and 110.
Removal of the premature ventricular or atrial contraction data from the
waveform dataset increases the accuracy and sensitivity of calculations
performed on the dataset. Therefore, calculations such as left ventricular
stroke
volume variation, pulse pressure variation, or systolic pressure variation
achieve
increased accuracy and sensitivity when premature ventricular or atrial
contraction data is removed. An example of a ventricular stroke volume
variation calculation is provided in U.S. Patent Application Publication No.
US
2005/0187481, which is incorporated by reference herein in its entirety.
To achieve even greater sensitivity and accuracy, the methods described
above can include the additional step of removing the signal for the cardiac
cycle immediately following the premature ventricular or atrial contraction
from
the waveform dataset (e.g. cardiac cycle 110 from Figure 3). This additional
subtraction can be performed as a precaution because the cardiac cycle that
follows a premature ventricular or atrial contraction can generate higher
pressure than the rest of the normal cardiac cycles and could, therefore,
affect
the calculation of a cardiovascular parameter reflecting fluid or volume
changes.
In addition to the removal of premature ventricular or atrial contractions,
other operations can be performed on the dataset to increase the accuracy and
sensitivity of calculations performed on the waveform dataset. For example,
the
signal can be filtered to reduce the effect of noise, interference, and
artifacts that
may occur in the signal. Such filtering can be accomplished through the use of
a low-pass filter for example, Following filtering, large motion artifacts can
be
9244 1.UOC ECC-5949 PCT
CA 02689430 2009-12-01
WO 2009/023713 PCT/US2008/073019
- 17-
detected and removed from the waveform dataset. Such artifacts are common
as they often result from patient movement or from flushing of an arterial
line.
Additionally, bad cardiac cycles can be removed after beat detection before
detecting premature ventrical or atrial contractions.
Once identified, a premature ventricular or atrial contraction can be
indicated on a graphical user interface. When the waveform dataset
corresponding to an arterial blood pressure, or any signal proportional to or
derived from the arterial pressure signal, such as pulseox, Doppler
ultrasound,
or bioimpedance signal is displayed on a graphical user interface
simultaneously
with the detection step of the methods described herein, indications that
premature ventricular or atrial contractions are present generally or a
specific
indication that a particular cardiac cycle is a premature ventricular or
atrial
contraction can be provided. The same information can be provided for data not
shown in real time.
The time period for the waveform dataset can be a set value, for
example, the time period can be about ten minutes or more, about five minutes
of more, about four minutes or more, about three minutes or more, about two
minutes or more, about one minute or more, about 50 seconds or more, about
40 seconds or more, about 30 seconds or more, about 20 seconds or more, or
about 10 seconds or more. For example, the time period can be about ten, about
nine, about eight, about seven, about six, about five, about four, about
three,
about two, or about one minutes. Further, for example, the time period can be
about 55, about 50, about 45, about 40, about 35, about 30, about 25, about
20,
about 15, about 10, or about 5 seconds. This time period can be constant or
can
be increased. Further, if premature ventricular or atrial contractions are
detected, the time period for the waveform dataset can be increased. Such an
increase in sample time may improve detection ability and the consistency of
the data.
Also disclosed herein is a method of detecting arrhythmia. This method
of detecting arrhythmia involves receiving a waveform dataset. The waveform
dataset can correspond to a signal, for example, from an arterial blood
pressure,
9244 1.DOC ECC-5949 PCT
CA 02689430 2009-12-01
WO 2009/023713 PCT/US2008/073019
-18-
or any signal proportional to or derived from the arterial pressure signal,
such as
pulseox, Doppler ultrasound or bioimpedance measurement device. This
dataset is then analyzed to detect any premature ventricular or atrial
contractions. If the premature ventricular or atrial contractions exceed a
predetermined arrhythmia threshold, a user such as a medical professional is
notified. If the predetermined arrhythmia threshold is met, the data indicates
that the patient being monitored has arrhythmic cardiac cycles in excess of
the
arrhythmia threshold.
The arrhythmia threshold can be based on a percentage of premature
ventricular or atrial contractions as calculated based on the total number of
cardiac cycles measured. For example, the predetermined arrhythmia threshold
can be about 30% of the total number of cardiac cycles measured, about 25% of
the total number of cardiac cycles measured, about 20% of the total number of
cardiac cycles measured, about 1.5% of the total number of cardiac cycles
measured, or about 10% of the total number of cardiac cycles measured. The
predetermined arrhythmia threshold can be established by one of skill in the
art
based on the percentage of premature ventricular or atrial contractions that
will
aid in monitoring a patient. The total number of cardiac cycles measured can
also be established by one of skill in the art.
Detecting premature ventricular or atrial contractions in this method of
detecting arrhythmia can be accomplished using the same methods,
characteristics, and parameters described above. Additionally, arrhythmia
detection can be accomplished by detecting variability in the time,
statistical or
energy/power parameter of the arterial pressure signal, or any signal
proportional to or derived from the arterial pressure signal. If the
variability of
a selected parameter or parameters exceeds a predetermined variability as
compared to a control cardiac cycle, the cycle to which the parameter is
related
is identified as a premature ventricular or atrial contraction. The waveform
dataset can be processed in the same way as discussed above.
If a single parameter is used, for example, a predetermined variability
can be 30 percent or more as compared to the same parameter of the control
9244 1.DOC ECC-5949 PCT
CA 02689430 2009-12-01
WO 2009/023713 PCT/US2008/073019
-19-
cardiac cycle, a variability of 25 percent or more as compared to the same
parameter of the control cardiac cycle, a variability of 20 percent or more as
compared to the same parameter of the control cardiac cycle, a variability of
15
percent or more as compared to the same parameter of the control cardiac
cycle,
a variability of 1.0 percent or more as compared to the same parameter of the
control cardiac cycle, a variability of 5 percent or more as compared to the
same
parameter of the control cardiac cycle, a variability of 4 percent or more as
compared to the same parameter of the control cardiac cycle, a variability of
3
percent or more as compared to the same parameter of the control cardiac
cycle,
a variability of 2 percent or more as compared to the same parameter of the
control cardiac cycle, a variability of 1 percent or more as compared to the
same
parameter of the control cardiac cycle, a difference of 0.5 percent or more as
compared to the same parameter of the control cardiac cycle, a difference of
0.4
percent or more as compared to the same parameter of the control cardiac
cycle,
a difference of 0.3 percent or more as compared to the same parameter of the
control cardiac cycle, a difference of 0.2 percent or more as compared to the
same parameter of the control cardiac cycle, or a difference of 0.1 percent or
more as compared to the same parameter of the control cardiac cycle.
Further, if more than one parameter is used, the predetermined
variability will depend on the particular combination of parameters used in
combination with the accuracy of the parameter measurements. For example, if
more than one parameter is used, a predetermined variability can be 30 percent
or more as compared to the same one or more parameters of the control cardiac
cycle, a variability of 25 percent or more as compared to the same one or more
parameters of the control cardiac cycle, a variability of 20 percent or more
as
compared to the same one or more parameters of the control cardiac cycle, a
variability of 15 percent or more as compared to the same one or more
parameters of the control cardiac cycle, a variability of 10 percent or more
as
compared to the same one or more parameters of the control cardiac cycle, a
variability of 5 percent or more as compared to the same one or more
parameters of the control cardiac cycle, a variability of 4 percent or more as
9244 1.DOC FCC-5949 PCT
CA 02689430 2009-12-01
WO 2009/023713 PCT/US2008/073019
-20-
compared to the same one or more parameters of the control cardiac cycle, a
variability of 3 percent or more as compared to the same one or more
parameters of the control cardiac cycle, a variability of 2 percent or more as
compared to the same one or more parameters of the control cardiac cycle, a
variability of 1 percent or more as compared to the same one or more
parameters of the control cardiac cycle, a difference of 0.5 percent or more
as
compared to the same parameter of the control cardiac cycle, a difference of
0.4
percent or more as compared to the same parameter of the control cardiac
cycle,
a difference of 0.3 percent or more as compared to the same parameter of the
control cardiac cycle, a difference of 0.2 percent or more as compared to the
same parameter of the control cardiac cycle, or a difference of 0.1 percent or
more as compared to the same parameter of the control cardiac cycle.
Typically,
the greater the number of parameters used, the lower the predetermined
variability amounts are for each parameter.
When multiple parameters are used, each parameter can have its own
predetermined variability. For example, a predetermined variability can be 30
percent or more as compared to the same parameter of the control cardiac
cycle,
a variability of 25 percent or more as compared to the same parameter of the
control cardiac cycle, a variability of 20 percent or more as compared to the
same parameter of the control cardiac cycle, a variability of 15 percent or
more
as compared to the same parameter of the control cardiac cycle, a variability
of
10 percent or more as compared to the same parameter of the control cardiac
cycle, a variability of 5 percent or more as compared to the same parameter of
the control cardiac cycle, a variability of 4 percent or more as compared to
the
same parameter of the control cardiac cycle, a variability of 3 percent or
more
as compared to the same parameter of the control cardiac cycle, a variability
of
2 percent or more as compared to the same parameter of the control cardiac
cycle, a variability of 1 percent or more as compared to the same parameter of
the control cardiac cycle, a difference of 0.5 percent or more as compared to
the
same parameter of the control cardiac cycle, a difference of 0.4 percent or
more
as compared to the same parameter of the control cardiac cycle, a difference
of
9244 1.DOC ECC-5949 PCT
CA 02689430 2009-12-01
WO 2009/023713 PCT/US2008/073019
-21-
0.3 percent or more as compared to the same parameter of the control cardiac
cycle, a difference of 0.2 percent or more as compared to the same parameter
of
the control cardiac cycle, or a difference of 0.1 percent or more as compared
to
the same parameter of the control cardiac cycle. As a specific example, a
first
parameter could have a predetermined variability of 15 percent or more as
compared to the same parameter of the control cardiac cycle and a second
parameter could have a predetermined variability of 4 percent or more as
compared to the same parameter of the control cardiac cycle. The number of
predetermined variabilities can be equal to or less than the number of
parameters evaluated.
Once arrhythmia has been identified using this method, a user such as
medical professional can be notified that arrhythmia has been detected by
conventional methods, such as by a sound or an indication on a graphical user
interface. For example, when patient data is displayed on a graphical user
interface, the graphical user interface can also indicate that arrhythmia has
been
detected.
As used herein the term "arterial blood pressure" refers to the force
exerted by circulating blood on the walls of blood vessels and an "arterial
blood
pressure signal" is a signal from a blood pressure monitoring instrument such
as
a sphygmomanometer or other pressure transducer. As used herein the term
"pulseox" refers to a signal from a pulse oximeter, which is an instrument
that
indirectly measures the amount of oxygen in a subject's blood using using
various characteristics of light absorption. As used herein the term
"bioimpedance signal" refers to a signal from a bioimpedance plethysmography
device, i.e., a device that measures blood parameters such as pulsatile blood
volume changes in the aorta. As used herein, the term "Doppler ultrasound"
refers to a signal from a Doppler ultrasound device, a device that makes
Doppler enhanced ultrasound measurements.
The methods described herein can be implemented by a computer
program loadable onto a computer unit or a processing system in order to
execute the described methods. Moreover, the methods can be stored as
9244 I.DOC ECC-5949 PCT
CA 02689430 2009-12-01
WO 2009/023713 PCT/US2008/073019
-22-
computer-executable instructions on a computer readable medium to allow the
methods to be loaded into and executed by different operating systems.
The methods disclosed herein are equally applicable to any subject for
which an arterial blood pressure, pulseox, Doppler ultrasound, or bioimpedance
signal can be detected. For example, the subject can be, but is not limited to
a
mammal such as a human.
The present invention is not limited in scope by the embodiments
disclosed herein which are intended as illustrations of a few aspects of the
invention and any embodiments which are functionally equivalent are within the
scope of this invention. Various modifications of the methods in addition to
those shown and described herein will become apparent to those skilled in the
art and are intended to fall within the scope of the appended claims. Further,
while only certain representative combinations of the method steps disclosed
herein are specifically discussed in the embodiments above, other combinations
of the method steps will become apparent to those skilled in the art and also
are
intended to fall within the scope of the appended claims. Thus a combination
of
steps may be explicitly mentioned herein; however, other combinations of steps
are included, even though not explicitly stated. The term "comprising" and
variations thereof as used herein is used synonymously with the term
"including" and variations thereof and are open, non-limiting terms.
9244 i.DOC ECC-5949 PCT