Note: Descriptions are shown in the official language in which they were submitted.
CA 02692795 2016-08-05
CA2692795
CARDIAC MONITORING SYSTEM
BACKGROUND
[0001] The present specification relates to methods and apparatuses for
monitoring
biological parameters, and in particular to a method and apparatus for
measuring cardiac
function in a subject using bioelectric impedance or components of bioelectric
impedance.
[0002] The reference to any prior art in this specification is not, and
should not be taken
as, an acknowledgment or any form of suggestion that the prior art forms part
of the common
general knowledge.
[0003] It is estimated that coronary heart disease will become the single
biggest public
health problem in the world by 2020. The treatment of coronary heart disease
and other
cardiovascular diseases therefore represents and increasingly large health and
economic burden
throughout the world in the coming years.
[0004] Cardiac output (CO), which can be defined as the amount of blood
ejected by
the ventricles of the heart per minute (measured in litres per minute), is
governed by the
metabolic demands of the body, and therefore reflect the status of the entire
circulatory system.
For this reason measurement of cardiac output is an essential aspect of
haemodynamic
monitoring of patients with heart disease or who are recovering from various
forms of
cardiovascular disease or other medical treatments.
[0005] One existing technique for determining cardiac function which has
been
developed is known as impedance cardiography (IC). Impedance cardiography
involves
measuring the electrical impedance of a subject's body using a series of
electrodes placed on
the skin surface. Changes in electrical impedance at the body's surface are
used to determine
changes in tissue volume that are associated with the cardiac cycle, and
accordingly,
measurements of cardiac output and other cardiac function.
[0006] A complication in impedance cardiography is that the baseline
impedance of the
thorax varies considerably between individuals, the quoted range for an adult
is 20 SI - 48 f2 at
a frequency between 50 kHz - 100 kHz. The changes in impedance due to the
cardiac cycle are
a relatively small (0.5%) fraction of the baseline impedance, which leads to a
very fragile signal
with a low signal to noise ratio.
1
CA 02692795 2016-08-05
=
CA2692795
[0007] Accordingly, complex signal processing is required to ensure
measurements can
be interpreted.
[0008] An example of this is described in international patent
publication no.
W02004/032738. In this example, the responsiveness of a patient to an applied
current is
modelled using the equivalent circuit shown in FIG. 1. The equivalent circuit
assumes that:
= direct current is conducted through the extracellular fluid only since
the reactance of
the cell membrane will be infinite;
= an applied alternating current is conducted through the extracellular and
intracellular
pathways in a ratio dependent on the frequency of the applied signal.
[0009] Accordingly, the equivalent circuit includes an intracellular
branch formed from
a capacitance C representing the capacitance of the cell membranes in the
intracellular pathway
and the resistance RI representing the resistance of the intracellular fluid.
The circuit also
includes an extracellular branch formed from resistance RE which represents
the conductive
pathway through the tissue.
[00010] W02004/032738 operates based on the assumption that the cardiac
cycle will
only have an impact on the volume of extracellular fluid in the patient's
thorax, and therefore
that cardiac function can be derived by considering changes in the
extracellular component of
the impedance. This is achieved by applying an alternating current at a number
of different
frequencies. The impedance is measured at each of these frequencies and then
extrapolated to
determine the impedance at zero applied frequency, which therefore corresponds
to the
resistance RE. This is then determined to be solely due to the extracellular
fluid component and
hence can be used to determine attributes of cardiac function, such as stroke
volume.
[00011] However, in practice the impedance at zero frequency would not be
due solely
to extracellular fluids but would be influenced by a number of other factors.
In particular, cells
do not act as a perfect capacitor and accordingly, the intracellular fluid
will contribute to the
impedance at a zero applied frequency.
[00012] A further issue in W02004/032738 is that the process determines
the impedance
at zero applied frequency using the "Cole model". However, again this assumes
idealised
behaviour of the system, and consequently does not accurately model a
subject's bioimpedance
2
CA 02692795 2016-08-05
. = =
CA2692795
=
response. Consequently cardiac parameters determined using these techniques
tend to be of
only limited accuracy.
SUMMARY
[00013] Described herein are methods and systems for determining
one or more
measures of cardiac function. In general, these methods may involve
determining an actual
characteristic frequency, measuring the instantaneous impedance or components
of the
impedance at that characteristic frequency, and using the instantaneous
impedance (or a
component of the impedance) values(s) to determine a measure of cardiac
function. A
characteristic frequency may be determined by analyzing the bioelectric
response of the
subject's body or tissue at various frequencies, as described in greater
detail herein. An
impedance (or a component of the impedance such as reactance, phase shift,
magnitude,
resistance) may be measured either directly or derived. A characteristic
frequency may be
determined for a particular subject either once, or periodically. For example,
each
measurement of instantaneous impedance may be made at a new characteristic
frequency. This
is described in greater detail below.
[00014] One variation of a method of determining a measure of
cardiac function in a
subject may include the steps of determining a characteristic frequency for
the subject,
determining the impedance or a component of the impedance at the
characteristic frequency,
and determining a measure of cardiac function using the impedance or a
component of the
impedance determined at the characteristic frequency.
[00015] In some variations, the characteristic frequency of the
subject is determined by
applying an electrical signal having a plurality of frequencies to the
subject, determining an
instantaneous impedance value at each of the plurality of frequencies, fitting
the instantaneous
impedance values to a frequency dependent function, and determining the
characteristic
frequency using the function. The characteristic frequency may be determined
from an
approximate maximum of the function. For example, the frequency dependent
function may be
a function based on a Wessel plot or a Cole plot, or a polynomial curve fit.
The characteristic
frequency may be determined over any appropriate frequency range. For example,
the
characteristic frequency may be determined by applying an electrical signal
having a plurality
of frequencies within the range of 2-10,000 kHz to the subject.
3
CA 02692795 2016-08-05
CA2692795
=
[00016] In some variations, the impedance (or a component of the
impedance) at the
characteristic frequency is determined by comparing an electrical signal
applied to the subject
(having a frequency at approximately the characteristic frequency) with an
electrical signal
received from the subject in response to the applied electrical signal. The
component of
impedance determined may be the reactance, the phase (e.g., phase shift) or
the magnitude. For
example, the reactance or the phase shift values measured at the
characteristic frequency may
be used to measure (or estimate) a characteristic cardiac function. In
general, multiple
("instantaneous") values for the impedance or a component of the impedance may
be
determined during the course of a cardiac cycle.
[00017] Any appropriate measure of cardiac function may be
determined using the
characteristic frequency, including stroke volume and cardiac output. For
example, stroke
volume may be determined by multiplying the maximum change in impedance during
a cardiac
cycle by one or more constants including constants based on the subject's
physical
characteristics. As mentioned, the measure of cardiac function may be
determined using the
impedance (or a component of the impedance) at the characteristic frequency
for a number of
sequential time points. For example, instantaneous reactance values may be
taken during an
entire (or a portion of a) cardiac cycle. The same characteristic frequency
may be used to
determine the instantaneous impedance values used to determine the measure of
cardiac
function, or the characteristic frequency may be repeatedly determined for
each time point or a
subset of time points. For example, the measure of cardiac function may be
determined by
determining the characteristic frequency and the instantaneous reactance at
the characteristic
frequency for a number of sequential time points.
[00018] Also described herein are methods of determining a measure
of cardiac output in
a subject including the steps of applying an electrical signal having a
plurality of frequencies to
the subject, receiving an electrical signal from the subject in response to
the applied signal,
determining a characteristic frequency for the subject by comparing the
applied and received
electrical signals, determining at least one component of the impedance at the
characteristic
frequency, and determining a measure of cardiac function using the at least
one component of
the impedance determined at the characteristic frequency. As mentioned, the
characteristic
frequency may be determined by comparing the applied and received electrical
signals to
determine an instantaneous impedance value and fitting the instantaneous
impedance values to
4
CA 02692795 2016-08-05
=
CA2692795
=
a frequency dependent function. The at least one component of the impedance
determined at
the characteristic frequency may be the reactance, the phase (e.g., phase
shift), the magnitude,
or the resistance.
[00019] Any appropriate measure of cardiac function may be
determined, including
stroke volume and/or cardiac output. For example, indicia of cardiac function
may be
determined by first identifying the characteristic frequency, and then
determining the
instantaneous reactance values at the characteristic frequency for a number of
sequential time
points (e.g., during a full cardiac cycle). A measure of cardiac function may
be determined by
determining the instantaneous phase shift values at the characteristic
frequency for a number of
sequential time points during a cardiac cycle. As mentioned above, the measure
of cardiac
function may be determined by determining the characteristic frequency and at
least one
component of the impedance at the characteristic frequency for a number of
sequential time
points during a cardiac cycle.
[00020] Also described herein are systems for analyzing cardiac
function in a subject.
These systems may include a plurality of electrodes configured to be attached
to a subject, and
a processor connected to the plurality of electrodes. The processor may be
configured to
control the application of an electrical signal having a plurality of
frequencies to the subject,
receive an electrical signal from the subject in response to the applied
signal, determine a
characteristic frequency by comparing the applied and received electrical
signals, determine at
least one component of the impedance at the characteristic frequency, and
determine a measure
of cardiac function using the at least one component of the impedance
determined at the
characteristic frequency. In some variations, the system also includes a
signal generator
coupled to processor for generating the electrical signals applied to the
subject. The systems
may also include one or more sensors for detecting the electrical signals from
the subject in
response to the applied electrical signals.
[00021] In some variations, the system may also include processing
logic for
determining the measure of cardiac output by multiplying the at least one
component of the
impedance (e.g., reactance, phase shift) by one or more constants including
constants based on
the subject's physical characteristics. The processing logic may be
implemented by software,
hardware, or any combination of these. Thus, the processor may be a
microprocessor
CA 02692795 2016-08-05
CA2692795
=
configured to execute the processing logic.
[00022] Any of the systems described herein may also include one
or more input devices
in communication with the processor for entering at least some of the
subject's physical
characteristics. For example, the systems may include a keypad, mouse, memory,
wireless
connection or the like for receiving input. Physical characteristics may
include height, gender,
weight, pulse rate, age, ethnicity, etc.
[00023] The claimed invention pertains to a method of monitoring a
subject using a
cardiac monitoring system including a processor, the method comprising: (a)
determining, in
the processor, a characteristic frequency for the subject, wherein the
characteristic frequency is
the most negative reactance within an applied frequency range; (b)
determining, in the
processor, the impedance phase angle at the characteristic frequency; (c)
determining, in the
processor, a measure of cardiac function using the impedance phase angle
determined at the
characteristic frequency; and (d) reporting the measure of cardiac function.
The characteristic
frequency may be determined by comparing applied and received electrical
signals to
determine an instantaneous impedance value and the fitting the instantaneous
impedance value
to a frequency dependent function. Instantaneous impedance values may be
determined at each
of a plurality of frequencies within an implied frequency range. In some
embodiments, the
measure of cardiac function is cardiac output. In some embodiments, the
measure of cardiac
function is stroke volume. Stroke volume may be determined by multiplying
maximum change
in impedance phase angle during a cardiac cycle by one or more constants based
on the
subject's physical characteristics.
[00024] The claimed invention also pertains to a system for
monitoring a subject, the
system comprising: a plurality of electrodes configured for attachment to the
subject; and a
processor connected to the plurality of electrodes, the processor configured
to (a) control
application of an applied electrical signal having a plurality of frequencies
to the subject; (b)
receive an electrical signal from the subject in response to the applied
signal; (c) determine a
characteristic frequency by comparing the applied and received electrical
signals, wherein the
characteristic frequency is the most negative reactance within an applied
frequency range; (d)
determine the impedance phase angle at the characteristic frequency; and (e)
determine a
measure of cardiac function using the impedance phase angle determined at the
characteristic
6
CA 02692795 2016-08-05
. .
CA2692795
=
frequency. The system may further comprise at least one of a signal generator,
one or more
sensors, and an input device, as described herein. The processor may be
configured to
determine the measure of cardiac function by multiplying the impedance phase
angle by one or
more constants based on the subject's physical characteristics.
BRIEF DESCRIPTION OF THE DRAWINGS
[00025] FIG. 1 is a schematic of an example of an equivalent
circuit used to model the
conduction characteristics of biological tissue.
[00026] FIG. 2 is a flowchart of an example of a process for
determining cardiac
function.
[00027] FIGS. 3A and 3B are schematics of an example of the
effects of blood flow on
blood cell orientation.
[00028] FIG. 4 is a schematic of a second example of an
equivalent circuit used to model
the conduction characteristics of biological tissue.
[00029] FIG. 5 is a schematic of an example of apparatus for
determining cardiac
function.
[00030] FIGS. 6A to 6C are a flowchart of a second example of a
process for
determining cardiac function.
[00031] FIG. 7 is an example of a graph of impedance plotted
against frequency for an
impedance measurement.
[00032] FIG. 8 is an example of a Wessel diagram of susceptance
plotted against
conductance.
[00033] FIG. 9 is an example of three plots depicting the time
varying impedance of the
thorax, the level of impedance change due to cardiac function and an ECG.
[00034] FIG. 10 is an exemplary flowchart of an example of a
process for determining
cardiac function.
7
CA 02692795 2016-08-05
,
= CA2692795
[00035] FIG. 11 is another exemplary flowchart of an example of a
process for
determining cardiac function.
DETAILED DESCRIPTION
[00036] An example of a process for determining parameters of
cardiac function relating
to a subject is described with reference to FIG. 2.
[00037] In particular at step 100, alternating electrical signals
are applied to the subject
at a number of different frequencies fõ with electrical signals across the
subject being detected
at each of the respective f, at step 110. The nature of the signals applied
and detected will
depend on the implementation as will be described below.
[00038] At step 120, at a first time instance tn the impedance Z,
at each frequency f, is
determined. At step 130, the impedance is used to determine an intracellular
impedance
parameter at the time tn. In one example, this is achieved utilising an
appropriate model, such
as a CPE (constant phase element) model, which will be described in more
detail below.
[00039] This is performed for a number of sequential time instance
tn, tn+1, tn+2 until it is
determined that a complete cardiac cycle has been analysed at step 140. This
may be achieved
by monitoring appropriate ECG signals, or alternatively simply by processing
sufficient time
instances to ensure that a cardiac cycle has been detected.
[00040] At step 150, the intracellular impedance parameter, and in
one example, changes
in the intracellular impedance parameter, is used to determine cardiac
parameters.
[00041] This technique takes into account that the impedance
fluctuation of the thorax
during the cardiac cycle is dependent on both changes in blood volume and
changes in the
impedance in the blood itself.
[00042] Blood is a suspension of erythrocytes, with a high
resistivity, and other cells in a
conducting fluid called plasma. The erythrocytes of stationary blood are
randomly orientated as
shown in FIG. 3A, and hence the resistivity of stationary blood is isotropic.
Due to their
biconcave shape erythrocytes tend to align themselves in flowing blood with
their axes parallel
to the direction of flow as shown in FIG. 3B. Accordingly, the resistivity of
flowing blood is
anisotropic.
8
CA 02692795 2016-08-05
CA2692795
[00043] The anisotropy of the resistivity is due to the longer effective
path length for the
current travelling normal to the axis of the vessel compared with the current
flowing parallel to
the vessel. As a result, the resistance of the intracellular fluid alters
depending on the
orientation of the erythrocytes, and hence depends on the flow of blood.
[00044] Furthermore, the extent of the anisotropy is shear-rate dependent
since the
orientation of the erythrocytes is influenced by the viscous forces in flowing
blood. As a result,
the resistivity is in turn also dependent on the flow rate.
[00045] It is therefore possible to take this into account by determining
cardiac function
on the basis of intracellular parameters, as opposed to using extracellular
impedance parameters
as in the prior art. This can therefore be achieved using the equivalent
circuit shown in FIG. 1,
and by using the impedance measurements to determine the impedance parameters
based on the
capacitance C and the resistance RI of the intracellular branch.
[00046] Thus, in this instance, the impedance measurements can be used to
determine
values for the intracellular resistance RI and the capacitance C, for example,
by determining
values of Ro and Rco, and then using these to solve the Cole equation using
appropriate
mathematical techniques.
[00047] In this instance however, modelling the resistivity as a constant
value does not
accurately reflect the impedance response of a subject, and in particular does
not accurately
model the change in orientation of the erythrocytes, or other relaxation
effects.
[00048] To more successfully model the electrical conductivity of blood,
an improved
CPE based model can be used as will now be described with respect to FIG. 4.
[00049] In this example, to accurately determine the characteristic
impedance, and
interpret the contribution of cardiac effects to the impedance, an equivalent
circuit based on a
free conductance parallel model is used, as shown in FIG. 4. Such a model can
also be created
in a series form and the parallel model is shown here for illustration.
[00050] In this example, the circuit includes an extracellular conductance
Go that
represents the conductance of electrical current through the extracellular
fluid. The
intracellular conduction path includes a constant phase element (CPE)
represented as the series
connection of a frequency dependent conductance, and a frequency dependent
capacitance.
9
CA 02692795 2016-08-05
. .
CA2692795
[00051] The two equations below define a general CPE:
Y CPE = (an- )m (G tor =1 (1)
arctan B
Ca cpe = (2)
where:
YcpE is the admittance of the CPE and
cOcpe is the phase of the CPE.
[00052] In this equation r represents a frequency scale factor and, cor
is dimensionless.
[00053] The parameter m defines the extent of the frequency dependence
of the
admittance of the CPE YcpE and the frequency scale factor with r. It is known
that for
biological tissue m is in the range of 0 < m < 1.
[00054] In one example, the CPE is in accordance with Fricke's law
(CPEF) although
other forms of CPE could be used. It is usual practice to use the exponent
symbol a (m = a) for
Fricke CPE's.
[00055] In order to make the model compatible with relaxation theory,
the series ideal
resistor is changed to a free resistor parameter Rvar so that the
characteristic time constant r,
will be a dependent parameter.
[00056] The result is that the conductance of the circuit can be
expressed as follows:
1
Y = GO + _______________________________________________________________ (3)
Rvar + RI (j wr
1 ( R =Tx
-r Ym = = Y (4)
D
Avar
Ym
[00057] Here Tym is a new characteristic time constant. The subscript m
is used to
identify the new variable from the previous variables and is consistent with
the nomenclature
know to those skilled in the art.
CA 02692795 2016-08-05
= CA2692795
[00058] By putting a nominal fixed value to the time constant ry
it is possible to follow
the CPE by calculating the R1 using the equation.
R1 var =
(5)
(Ty c)ymia
[00059] In this instance, the variable resistance parameter Rvar
is dependent on the
orientation of the erythrocytes and as a result, changes in Rvar can be used
to determine the rate
of flow of blood within a subject. Consequently, it is possible to determine
information
regarding cardiac output, or the like.
[00060] An example of apparatus suitable for performing an
analysis of a subject's
bioelectric impedance to determine cardiac function will now be described with
reference to
FIG. 5.
[00061] As shown the apparatus includes a processing system 10
having a processor 20,
a memory 21, an input/output (I/O) device 22 and an interface 23 coupled
together via a bus 24.
The processing system is coupled to a signal generator 11 and a sensor 12 as
shown. In use the
signal generator 11 and the sensor 12 are coupled to respective electrodes 13,
14, 15, 16, as
shown.
[00062] In use, the processing system 10 is adapted to generate
control signals, which
causes the signal generator 11 to generate an alternating signal which is
applied to a subject 17,
via the electrodes 13, 14. The sensor 12 then determines the voltage or
current across the
subject 17 and transfers appropriate signals to the processing system 10.
[00063] Accordingly, it will be appreciated that the processing
system 10 may be any
form of processing system which is suitable for generating appropriate control
signals and
interpreting voltage data to thereby determine the subject's bioelectrical
impedance, and
optionally determine the cardiac parameters.
[00064] The processing system 10 may therefore be a suitably
programmed computer
system, such as a laptop, desktop, PDA, smart phone or the like. Alternatively
the processing
system 10 may be formed from specialised hardware. Similarly, the I/O device
may be of any
suitable form such as a touch screen, a keypad and display, or the like.
11
CA 02692795 2016-08-05
. .
CA2692795
[00065] It will be appreciated that the processing system 10, the
signal generator 11 and
the sensor 12 may be integrated into a common housing and therefore form an
integrated
device. Alternatively, the processing system 10 may be connected to the signal
generator 11
and the sensor 12 via wired or wireless connections. This allows the
processing system 10 to
be provided remotely to the signal generator 11 and the sensor 12. Thus, the
signal generator
11 and the sensor 12 may be provided in a unit near, or worn by the subject
17, whilst the
processing system is situated remotely to the subject 17.
[00066] In practice, the outer pair of electrodes 13, 14 are placed on
the thoracic and
neck region of the subject and an alternating signal is applied at a plurality
of frequencies either
simultaneously or in sequence, (two are sufficient but at least three are
preferred with five or
more being particularly advantageous) in the range 2-10,000 kHz. However the
applied
waveform may contain more frequency components outside of this range.
[00067] In the preferred implementation the applied signal is a
frequency rich voltage
from a voltage source clamped so it does not exceed the maximum allowable
patient auxiliary
current. The signal can either be constant current, impulse function or a
constant voltage signal
where the current is measured so it does not exceed the maximum allowable
patient auxiliary
current.
[00068] A potential difference and/or current are measured between an
inner pair of
electrodes 16, 17. The acquired signal and the measured signal will be the
superposition of
signals at each of the applied frequencies and the potentials generated by the
human body, such
as the ECG.
[00069] Optionally the distance between the inner pair of electrodes
may be measured
and recorded. Similarly, other parameters relating to the subject may be
recorded, such as the
height, weight, age, sex, health status, and other information, such as
current medication, may
also be recorded.
[00070] The acquired signal is demodulated to obtain the impedance of
the system at the
applied frequencies. One suitable method for demodulation is to use a Fast
Fourier Transform
(FFT) algorithm to transform the time domain data to the frequency domain.
Another technique
not requiring windowing of the measured signal is a sliding window FFT. Other
suitable digital
and analog demodulation techniques will be known to persons skilled in the
field.
12
CA 02692795 2016-08-05
. .
CA2692795
[00071] Impedance or admittance measurements are determined from the
signals at each
frequency by comparing the recorded voltage and current signal. The
demodulation algorithm
will produce an amplitude and phase signal at each frequency.
[00072] An example of the process of measuring a subject's bioelectric
impedance and
then interpreting this will be described in more detail with reference to
FIGS. 6A to 6C.
[00073] At step 200 the processing system 10 generates predetermined
control signals
causing the signal generator 11 to apply current signals to the subject 17 at
a number of
frequencies f, over a time period T. The current signals applied to the
subject 17 may be
provided at the frequencies f, sequentially, or simultaneously, by superposing
a number of
signals at each corresponding frequency f,.
[00074] It will be appreciated that the control signals are typically
generated in
accordance with data stored in the memory 21 and this can allow a number of
different current
sequences to be used, with selection being made via the I/O device 22, or via
another
appropriate mechanism.
[00075] At step 210 the sensor 12 measures the voltage across the
subject 17. In this
regard, the voltage signals will typically be analogue signals and the sensor
12 will operate to
digitise these, using an analogue to digital converter (not shown).
[00076] At step 220 the processing system 10 samples the signals from
the signal
generator 11 and the sensor 12, to thereby determine the current and voltage
across the subject
17.
[00077] At step 230, a filter is optionally applied to the voltage
signals at step 230 to
remove respiratory effects, which typically have a very low frequency
component in line with
the patient's rate of breathing. It will be appreciated that filtering may be
achieved by the
sensor 12 or the processing system 10, depending on the implementation.
[00078] At step 240 ECG vectors are optionally extracted from the
voltage signals. This
can be achieved as the ECG signals typically have a frequency in the region
0Hz to 100Hz,
whereas the impedance signals are in the region of 5kHz to 1MHz. Accordingly,
the ECG
signals may be extracted by any suitable technique, such as demodulation,
filtering or the like.
13
CA 02692795 2016-08-05
= CA2692795
[00079] At step 250 the signals may also undergo additional
processing. This can be
performed, for example, by further filtering the signals to ensure that only
signals at the applied
frequencies f, are used in impedance determination. This helps reduce the
effects of noise, as
well as reducing the amount of processing required.
[00080] At step 260, the current and voltage signals sampled at
time tn to determine the
impedance Zi at each frequency
[00081] At step 270 a function is fitted to the impedance values.
[00082] An example of this is shown in FIG. 7, which shows an
example of the
appearance of the impedance data and function when plotted against frequency.
It will be
appreciated that the plot is for the purpose of example only, and in practice
the processing
system 10 will not necessarily generate a plot. In the case of the frequency
verses the
impedance plot shown in FIG. 7, the function is typically a polynomial and in
particular in this
example is a sixth order polynomial.
[00083] Alternatively a Wessel plot may be used as shown in FIG.
8, as will be
described in more detail below.
[00084] In practice noise elimination may be necessary to
accurately fit a function to the
data. In one example, elimination of noise at certain frequencies can be
performed by initially
fitting a function to the measured data and then systematically removing
outlier points from the
data set and re-fitting the function to the reduced data set.
[00085] Accordingly, at step 280 the processing system 10
operates to determine if there
are outlier points, which are considered to be points that are greater than a
predetermined
distance from the determined function.
[00086] It will be appreciated that the function used, and the
determination of outlier
points may be achieved utilising standard mathematical techniques.
[00087] If it is determined that there are outlier points, these
are removed from the data
set and a new function fitted to the remaining values at step 290. At step 290
the processing
system 10 determines if the fit is improved and if so the outlier point is
excluded from the data
set permanently with the new function being assessed at step 310. This is
repeated until all
outliers that affect the data are removed.
14
CA 02692795 2016-08-05
CA2692795
=
[00088] If it is determined that the fit is not improved at step
300 the outlier is retained
and the previous function used at step 320.
[00089] If there are no outliers, or once outliers have been
excluded from the data set, the
plot is then used to determine values from Ro and Roo using the determined
function.
[00090] In one example, the function is used to calculate Ro and
R. Alternatively, this
can be used to determine the impedance at the characteristic frequency. As is
apparent to one
of skill in the art, the characteristic frequency is apparent from this
procedure (e.g., the
maximum reactance in the frequency range).
[00091] For example, in the case of the function shown in FIG. 7,
Roo can be determined
by finding the impedance at the start of the pseudo-plateau, i.e. a relatively
flat portion, on the
curve of FIG. 7. In the illustrative embodiment the pseudo plateau is
identified using a rule-
based approach.
[00092] In this approach the function is analysed to find the
frequency where impedance
(Z) changes (AZ) by less than 1% with a frequency increase of 25kHz. The
resistance or
impedance Z measured at this frequency is identified as Roo and represents
resistance of the
circuit if an infinitely high frequency was applied. Other methods of
determining this pseudo-
plateau region may be known to those skilled in the art.
[00093] Similarly, the impedance at zero applied frequency Ro can
be determined as the
value at which the function would intercept the y-axis.
[00094] If a "Wessel" plot type function is used, as shown in
FIG. 8, this approach uses
an arc, which allows the characteristic impedance to be determined. In this
example, the apex
of the arc in the complex Wessel plane no longer corresponds to the nominal
value of Ty, but to
Ty in as given by the above equation. In some variations, the characteristic
frequency (the
frequency at the characteristic impedance) may be determined by solving a Cole-
Cole model
for the peak. Thus, the characteristic frequency may be determined directly
(e.g., by
extrapolating from a curve fitting), or it may be numerically determined. J.
Xiang et al., ("On
the Adequacy of Identified Cole-Cole Models," Computers & Geosciences 29
(2003): 647-654)
describes methods of numerically determining a Cole-Cole model that may be
used to
determine the characteristic frequency.
CA 02692795 2016-08-05
. .
CA2692795
=
[00095] Additionally a can be determined from the angle subtended
by the arcuate locus
from Ro to R. By comparing this to m determined from susceptance data, this
allows whether
the Fricke criteria for relaxation phenomena of biological materials is met.
In the event that
they are equal or within a predetermined range of each other, then the Wessel
diagram method
may be applied with reasonable accuracy. In the event that m and a are not
sufficiently close in
value then the function fitting approach described above is a more appropriate
method for
determining the quantities of interest for the free conductance model.
[00096] At step 340 the processing system 10 uses the values of
either Ro to Rco, or the
characteristic impedance, together with equation (5) to determine the
intracellular impedance
parameter, which in this example is the intracellular variable resistance
parameter Rvar=
[00097] As an alternative to determining values of Ro, Rco, or
the characteristic
impedance Ze, the equation (5) can alternatively be solved mathematically, for
example by
using a number of different impedance values at different frequencies f, to
solve a number of
simultaneous equations. These values can be based on directly measured values,
although
preferably these are values determined from the fitted function, to thereby
take into account the
impedance response across the range of applied frequencies fi.
[00098] At step 350 it is determined if a full cardiac cycle has
been completed and if not
the process returns to step 240 to analyse the next time instance t+1.
[00099] At step 360, once a full cardiac cycle has been
completed, the processing system
operates to determine the change in the intracellular resistance parameter
Rva,- over the
cardiac cycle before using this to determine cardiac parameters at step 370.
[000100] A typical plot of the time varying impedance obtained by
the present method is
shown in FIG. 9.
[000101] In FIG. 9 the raw impedance data is plotted against time
(measured by sample
number) in the top graph. This graph includes the impedance from all time
varying impedance
components in the thoracic cavity including variation in blood volume, blood
cell orientation
and changes due to respiration.
[000102] The centre graph of FIG. 9 depicts the rate of change of
impedance attributable
to cardiac function of a patient. The graph was generated by removing the low
frequency
16
CA 02692795 2016-08-05
. .
= CA2692795
components from the top graph and obtaining the rate of change of impedance
from the
remaining data.
[000103] As will be appreciated by those skilled in the art
additional measurements can
also be incorporated into the present method or conducted simultaneously. For
example, the
inner electrodes can also be used to record ECG vectors. In order to generate
more ECG vectors
more inner electrode combinations are required. The outer electrodes can also
be used to record
the ECG vectors. The processing unit, or the operator, can automatically or
manually select the
most appropriate ECG vector. An external ECG monitor can also be connected or
alternatively
a separate module can be incorporated into the invention with additional
electrodes to calculate
the ECG vectors.
[000104] The ECG can advantageously be used to aid in the
determination of cardiac
events. An example ECG output is depicted in the lower graph of FIG. 9.
[000105] To calculate certain cardiac parameters from the impedance
waveform, fiducial
points must also be suitably identified. The ECG data and/or other suitable
physiological
measurement techniques may be employed to aid this process.
[000106] Other physiological parameters that could be used to
assist in identifying
fiducial points in the cardiac cycle include invasive/non-invasive blood
pressure, pulse
oximetry, peripheral bioimpedance measurements, ultrasound techniques and
infrared/radio
frequency spectroscopy. Such techniques can be used singularly or in a
plurality to optimally
determine cardiac event timing.
[000107] In one example an artificial neural network or weighted
averages to determine
the cardiac events as identified by conductance measurements combined with
other methods of
physiological measures offer an improved method of identifying these points.
In the present
example the start and end of left ventricular ejection are indicated by the
vertical lines on the
graphs of FIG. 9. The time between these points is the left ventricle ejection
time (LVET).
[000108] These fiducial points can be used to obtain impedance
values of interest. For
example, the maximum rate of change in the intracellular resistance value Rvar
over left
ventricle ejection which is indicated on the central graph of FIG. 9 as:
17
CA 02692795 2016-08-05
. .
.
CA2692795
( dR var (t)
dt j mAx
[000109] Measures of cardiac function can then be determined from
this data. For
example, the following method can be used to calculate blood velocity and
stroke volume. The
present example uses impedance measures to calculate cardiac output. However
the same
functions can be described using admittance or a combination of the two. The
following
formula can be used to calculate cardiac output:
i I dRvar(t) n
I vn
dt ) mAx 1
CO = klc1 ______________________________________ * ¨ x T
LVE
Z0 T
RR /
\ /
[000110] Where:
= CO denotes cardiac output (litres/min),
7dRvar (t)\
= is as indicated on FIG. 9;
\ dt j .
= k1 is an optional population specific correction factor based on one or
more subject
parameters, such as at least the height and weight, but can also include
distance
between the electrodes and age;
= et is an optional calibration coefficient used to convert the units from
Ohmic units to
litres (which may be uniquely defined at manufacture for each monitoring
device
used to implement the method),
= Zo is an optional baseline Impedance measured at the characteristic
frequency
(between 10 Ohms and 150 Ohms),
= TRR is the interval between two R waves obtained from the ECG (found from
the
ECG or impedance or conductance data),
= TINE is left ventricular ejection time (measured from either the
conductance or
impedance curve or preferably a combination of other physiological measurement
techniques) and
= n (range ¨4>n<4) and m (range ¨4>m<4) are optional constants.
18
CA 02692795 2016-08-05
CA2692795
[000111] The person skilled in the art will be able to determine
appropriate values for
these constants dependent upon the patient and situation in which the method
is applied.
[000112] Whilst the example described above has been described in the
context of
providing determining cardiac output of the heart, embodiments of the present
invention can be
applied to determine other measures of cardiac performance, including but not
limited to, stroke
volume, cardiac index, stroke index, systemic vascular resistance/index,
acceleration,
acceleration index, velocity, velocity index, thoracic fluid content, left
ventricular ejection time,
Pre-ejection period, systolic time ratio, left cardiac work/index, heart rate
and mean arterial
pressure.
[000113] As described briefly above, measures of cardiac performance and
function may
also be determined using the characteristic frequency. Thus, the
characteristic frequency may
be determined during a cardiac cycle by applying an electrical signal having a
plurality of
frequencies (or multiple electrical signals at different frequencies),
detecting electrical signals
in response to the applied signals, processing the detected signals (e.g., to
remove unwanted
components such as ECGs and other signals), comparing the applied electrical
signals at each
frequency with the response signals at each frequency, and fitting the signals
to a function from
which the characteristic frequency may be determined. As previously described,
FIGS. 6A and
6B illustrate this. In this example, instantaneous impedance values are
determined for each
frequency f, at time to 260, and are fit to a function 270 (such as the Wessel
plot shown in FIG.
8). The characteristic frequency may be identified from the function. For
example, the
characteristic frequency from the Wessel plot is the frequency at the top of
the arch (e.g., the
frequency with the largest reactance). In practice, the characteristic
frequency may be
determined by approximating the maximum reactance over the applied frequency
range.
[000114] The signal(s) applied to the subject may be a signal (or signals)
having a
plurality of frequency components, or a series of signals at different
frequencies. The response
signal that is measured from the subject after the application of one or more
electrical signals
arises because of the electrical properties of the body. This response is
usually referred to as a
response signal. The response signal may also be referred to as an evoked
response or evoked
signal, and is typically a passive response. For example, the response does
not usually include
a regenerative evoked (e.g., active) response from electrically active tissue.
19
CA 02692795 2016-08-05
=
CA2692795
[000115] Once the characteristic frequency has been determined, this
characteristic
frequency may provide a relatively accurate means of determining cardiac
function by then
applying an electrical signal at the characteristic frequency and receiving
the response electrical
signal at that frequency. This electrical stimulation and sampling may be
repeated during a
complete or partial cardiac cycle. For each time point, the stimulated and
response signals may
be compared (e.g., after filtering or other signal processing) to determine an
instantaneous
impedance or any components of the instantaneous impedance, such as
resistance, reactance,
phase and magnitude. As is known in the art, the resistance and reactance, and
the impedance
and phase are all mathematically related, and with any two you can calculate
the other two.
Further, as is known in the art, any of these components can be determined
from the applied
and response signals.
[000116] For example, in FIG. 6C, Rvar is determined iteratively by
calculating
instantaneous impedance values at a plurality of frequencies at each time
point. FIGS. 10 and
11 describe an alternative method of determining a measure of cardiac
function, by instead
determining the characteristic frequency (stimulating at multiple frequencies)
and using this
characteristic frequency to determine the instantaneous impedance (or
components of the
instantaneous impedance). The step of determining a characteristic frequency
may be
performed only once during a cardiac cycle, or only periodically during a
cardiac cycle, rather
than at each time point t,.
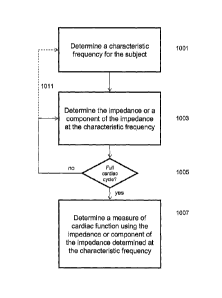
[000117] FIG. 10 is a schematic flowchart further illustrating one method
of determining a
measure of cardiac function in a subject. First, a characteristic frequency
for the subject 1001
is determined. As previously described, the characteristic frequency may be
determined by
applying an electrical signal (or signals) having a plurality of frequencies
to the subject,
receiving the response signal(s) from the subject, and determining an
instantaneous impedance
value (or a component of the impedance) at each of the plurality of
frequencies, fitting the
values to a function (e.g., a frequency dependent function), and determining
the characteristic
frequency using the function. Any appropriate range of frequencies may be
used, including
frequencies between 2 and 10,000 kHz (e.g., 2-200 kHz, etc.), and any
appropriate number of
frequencies may be used (e.g., 2, 8, 16, 50, 100, etc.). Although the
instantaneous impedance
CA 02692795 2016-08-05
CA2692795
values may be determined at each time point, in some variations components of
the
instantaneous impedance values (e.g., reactance and/or resistance) are
determined at each time
point, rather than the combined impedance value. In some variations, phase is
used.
[000118] Next, the impedance, or a component of the impedance, can be
determined at
different time points during all or part of a cardiac cycle 1003. As described
above, the intra-
cellular resistance may be calculated from the impedance. In some variations
the reactance
component of the impedance is determined at different time points of a cardiac
cycle by
applying electrical signals at the characteristic frequency. Thus, at least
one reactance time
point may be determined at that characteristic frequency. This reactance time
point may be
referred to as an instantaneous reactance at that time point. In some
variations the component
of impedance determined at each time point using the characteristic frequency
is phase,
magnitude (or both). In some variations the instantaneous impedance is
determined using the
characteristic frequency at each time point.
[000119] In FIG. 10, the impedance (or a component of the impedance) at the
characteristic frequency is determined at discrete time points during a
complete cardiac cycle
1005. Any number of time points within the cardiac cycle may be taken (e.g.,
the number of
sample points within the cardiac cycle). Although most of the methods
described herein take
measurements over a full cardiac cycle, a portion of a cardiac cycle or
multiple cardiac cycles
may also be used. As briefly mentioned above, these instantaneous values
determined during
the cardiac cycle using the characteristic frequency may be stored for use in
determining a
cardiac function such as stroke volume or cardiac output.
[000120] As mentioned above, a new characteristic frequency may be
determined during
the cardiac cycle, as indicated by the dashed line 1011 in FIG. 10. For
example, a new
characteristic frequency may be determined for each time point, or for some
subset of time
points.
[000121] Finally, a measure of cardiac function may be determined using the
instantaneous impedance (or a component of impedance) value(s) determined at
the
characteristic frequency 1007 in the previous steps. For example, the
instantaneous impedance
values measured at the characteristic frequency may be used to determine a
stroke volume
and/or cardiac output. The maximum change in impedance, (dz/dt),,, is
proportional to the
21
CA 02692795 2016-08-05
CA2692795
stroke volume and also to the cardiac output. For example, stroke volume may
be represented
as:
S V = ____________________
zB
where: SV=stroke volume, (dz/dOmax=maximum rate of change in measured
impedance at the
beginning of systolic cycle, VET=left ventricular ejection time, and
II¨thoracic length
estimated from the subject's height and weight using a nomogram. L' also
accounts for blood
resistivity. ZB is a baseline impedance value. Thus, the constants may be
combined,
expressing the stroke volume in terms of elements (e.g., (dz/dOmax ) that may
be determined for
each cardiac cycle. Cardiac output is related to stroke volume (e.g., cardiac
output = SV*heart
rate).
[000122] In one example, the instantaneous reactance at the characteristic
frequency may
be used to determine a measure of cardiac function. For example, the
instantaneous reactance
at the characteristic frequency can be measured at each sample point during a
cardiac cycle by
stimulating the subject at the characteristic frequency. The change in the
reactance (dX/dt)max
is also proportional to the stroke volume and the cardiac output, and may
therefore be used (in
conjunction with appropriate nomograms) to determine these measures of cardiac
function.
FIG. 11 illustrates this exemplary method.
[000123] A system for analyzing cardiac function in a subject may include
any of the
elements described above, and may also include one or more processors for
executing the
procedures described herein. For example, a system may include a processor
(e.g.,
microprocessor) for controlling the application of an electrical signal having
a plurality of
frequencies to the subject 1101. Thus, the processor may be connected to a
signal generator
and electrodes to be connected to the subject for stimulation. The controller
may also be
connected to electrodes for receiving an electrical signal from the subject in
response to the
applied signal 1103. The input signal may also be sent to the controller, and
both the input and
output signals may be digitized, filtered, or otherwise conditioned. The
processor may further
determine a characteristic frequency by comparing the applied and received
electrical signals
1105, as described above.
22
CA 02692795 2016-08-05
CA2692795
[000124] The characteristic frequency may then be used to determine an
instantaneous
reactance, or any other appropriate characteristic of impedance, including
phase 1107. For
example, the system may detect the relative phase shift (d9/dt) between the
injected signal and
the response signal at discrete times during a full cardiac cycle or a portion
of a cardiac cycle
by applying an electrical signal at the determined characteristic frequency
and comparing the
phase of the response signal to the applied signal. As mentioned above, in
some variations, the
characteristic frequency may be determined once during the cardiac cycle
(e.g., at the start of
the measurement), or a new characteristic frequency may be determined before
determining the
component of the impedance (e.g., reactance or phase shift) at each time
point, as indicated by
the dashed line 1117 in FIG. 11. In some variations, a new characteristic
frequency may be
recalculated after some number of data point (or a fraction of the cardiac
cycle).
[000125] These instantaneous impedance values determined at the
characteristic
frequency (e.g., the instantaneous impedance, instantaneous reactance,
instantaneous phase
shift, etc.) may be stored by the system. For example, the processor may
include a memory to
store these values. In some variations all of the values are not stored, but
only a running value
(e.g., the maximum value, a sum of the values, a product of the values, etc.)
is stored. These
stored values may be used to determine a measure of cardiac function 1111. For
example, the
phase shift (thp/dt) values may be used to determine stroke volume and/or
cardiac output. For
example, the phase shift may be proportional to the changes in blood flow in
the aorta, as
previously described. Thus, the stroke volume may be expressed as:
SV= C' *(4/dOniax*VET
where VET is ventricular ejection time, and C' is a constant that may be based
on individual
patient characteristics (including height, weight, gender, age, etc.). As
previously described,
the VET may be determined for each cardiac cycle. For example, the ECG may be
used to
determine the length of each heart beat, as well as the start of ejection and
the end of ejection,
from which VET can be estimated. Heart rate (and therefore cardiac output) may
also be
determined from the phase information.
[000126] The measure of cardiac function determined may be displayed,
stored or
transmitted. Thus, any of the systems for analyzing cardiac function described
herein may
include a display (e.g., screen, printer, etc.) or telemetry (wireless, LAN,
etc.), or the like. The
23
CA 02692795 2016-08-05
, .
CA2692795
systems described herein may also include one or more inputs such as
keyboards, mouse, touch
screen, etc. for inputting subject information.
[0001271 Persons skilled in the art will appreciate that numerous
variations and
modifications will become apparent. All such variations and modifications
which become
apparent to persons skilled in the art, should be considered to fall within
the scope that the
invention broadly appearing before described.
24