Note: Descriptions are shown in the official language in which they were submitted.
CA 02698277 2010-03-02
WO 2009/033089 PCT/US2008/075483
DIFFERENTIATION OF LEAD IN SURFACE LAYERS AND IN BULK=SAMPLES BY X-RAY
FLUORESENCE
[0001] The present application claims the priority of US Provisional Patent
Application
Serial No. 60/967,722, filed September 6, 2007, which is incorporated herein
by reference in its
entirety.
TECHNICAL FIELD
[0002] The present invention relates to methods for determining the
concentration of a
specified elemental substance employing x-ray fluorescence techniques, and,
more particularly,
to methods for determining elemental concentrations based on identifying
whether the specified
substance is a paint-like outer layer or is admixed with the bulk sample or is
buried under a layer
of non-leaded material.
BACKGROUND ART
[0003] Lead has been known to be a toxic element for more than a century. It
is
especially harmful to children, producing severe adverse effects to their
mental and behavioral
abilities in direct proportion to the concentration level of lead in their
bodies. Governments have
limited the concentration of lead in paint and in bulk materials in order to
protect the safety of
the public, prevent the build up of toxic elements in waste disposals and
prevent its reuse in
recycling.
[0004] Prior teachings of techniques for measuring concentrations of lead in
surface-
covering layers, such as paint, even when subsequently covered by layers of
non-lead paint of
unknown thickness and composition, may be found with reference to the
following patents: US
Patent Nos. 5,274,688, 5,390,229, and 5,396,529 (all, to Grodzins, and
collectively, "Grodzins"),
all entitled "Lead Paint Detector," teach measurement of the concentration of
lead in paint on the
basis of inducing and detecting fluorescence of the L x-rays of lead. US
Patent No. 5,461,654 (to
Grodzins and Parsons, and referred to, hereinafter, as "Grodzins/Parsons"),
entitled "X-ray
Fluorescence Detector," teaches a method that provides a measure of the depth
of a layer of lead
paint beneath one or more layers of paint from which lead is absent. The
disclosures of all of the
foregoing Grodzins and Grodzins/Parsons patents are incorporated herein by
reference. Layer
depth, in the prior art, is measured in attenuation units of gm/cm2 and gives
no measure of either
the density or the elemental composition of the overlayers of paint.
-1-
CA 02698277 2010-03-02
WO 2009/033089 PCT/US2008/075483
[0005] There is an urgent need, unmet by prior techniques, to distinguish,
automatically
and non-destructively, between toxic elements in a surface layer on an object,
possibly buried
beneath other material, and similar elements that form one or more
constituents of the object's
bulk. The distinction must be made if quantitative results are to be obtained.
SUMMARY OF THE INVENTION
[0006] In accordance with embodiments of the present invention, methods are
provided
for determining a concentration of elements in a sample by techniques of x-ray
fluorescence
(XRF). A method is described for automatically distinguishing whether toxic
elements are on
the surface of the sample, in the form, for example, of paint or veneer, or
whether such elements
are distributed throughout the bulk of the sample, or whether the lead is
buried beneath unleaded
material. The distinction is then used to automatically select the appropriate
algorithm for
quantitative measurement by a thin film mode of analysis or a bulk sample mode
of analysis, or
a buried layer mode. If the element is part of the surface layer, or in a
buried layer, the
concentration is presented in units of grams per square centimeter. If the
element is part of the
bulk, the XRF spectrum is used to automatically obtain a quantitative measure
of the density of
the bulk material so that the concentration can be presented in units of grams
of analyte per gram
of the bulk. In accordance with certain embodiments of the methods described,
the presence of
lead in toys may be determined.
[0007] In accordance with preferred embodiments of the present invention, a
method is
provided for characterizing a sample with respect to the presence of a
specified element. The
method has steps of:
a. illuminating a surface of the sample with x-ray excitation radiation;
b. measuring a first intensity of a characteristic emission line of the
specified
element at a first energy;
c. measuring a second intensity of a characteristic emission line of the
specified
element at a second energy;
d. comparing the first intensity to the second intensity to establish whether
the
specified element is disposed above the bulk of the sample;
e. in the case where the specified element is disposed above the bulk of the
sample, determining an areal density of the specified element; and
f. in the case where the specified element is within the bulk of the sample,
determining a volumetric concentration of the specified element within the
sample;
-2-
CA 02698277 2010-03-02
WO 2009/033089 PCT/US2008/075483
and
g. outputting at least one of the areal density and volumetric concentration
of the
specified element.
[0008] In accordance with other embodiments of the invention, in the case
where the
specified element is disposed above the bulk of the sample, the method may
have a further step
of comparing the first intensity to the second intensity to establish whether
the specified element
is contained within a buried layer. The first and second characteristic
emission lines of the
specified element may be La, and LR emission lines of the specified element,
and the specified
element may be lead, in particular. The specified element may also be selected
from the group of
light elements including barium, cadmium and arsenic, and the first and second
characteristic
emission lines of the specified element may be Ka, and Ka emission lines of
the specified
element. Alternatively, the specified element may be selected from the group
of heavy elements
including mercury, lead, and uranium, and the first and second characteristic
emission lines of
the specified element are Ka, and Kp emission lines of the specified element.
A ratio of first and
second emission line intensities equal to an empirically determined minimum
may signify
presence of the specified element outside the bulk of the sample.
[0009] The method may also include measuring Compton scattering of
fluorescence
lines in the bulk of the sample for determining absorption in the sample as a
function of x-ray
energy.
[0010] In accordance with another aspect of the present invention, an x-ray
fluorescence
spectrometer is provided for determining a concentration of a specified
element. The
spectrometer has a source of x-ray excitation for illuminating a surface of a
sample and a
detector for measuring a first intensity of a first characteristic emission
line of the specified
element at a first energy and a second intensity of a second characteristic
emission line of the
specified element at a second energy, and for outputting a detector signal
corresponding to each
of the first and second intensities. The spectrometer also has a signal
processor for comparing
the first intensity to the second intensity to establish whether the specified
element is disposed
solely on the surface of the sample. Finally, the spectrometer has an output
for providing an
areal density of the specified element in the case where the specified element
is disposed solely
on the surface of the sample, and for outputting a volumetric concentration of
the specified
element within the sample in the case where the specified element is not
disposed solely on the
surface of the sample.
-3-
CA 02698277 2010-03-02
WO 2009/033089 PCT/US2008/075483
[0011] In accordance with yet another aspect of the invention, a computer
program
product is provided for use on a computer system for characterizing a sample
with respect to the
presence of a specified element. The computer program product has a computer
usable medium
having computer readable program code thereon, the computer readable program
code
including:
a. a module for receiving a first intensity of a characteristic emission line
of the
specified element at a first energy;
b. a module for receiving a second intensity of a characteristic emission line
of the
specified element at a second energy;
c. a module for comparing the first intensity to the second intensity to
establish
whether the specified element is disposed above the bulk of the sample;
d. a module for
in the case where the specified element is disposed above the bulk of the
sample, determining an areal density of the specified element, and
in the case where the specified element is not disposed above the bulk of the
sample, determining a volumetric concentration of the specified element within
the
sample; and
e. a module for outputting at least one of the areal density and volumetric
concentration of the specified element.
[0012] The computer program product may also have a module for determining
absorption in the sample as a function of x-ray energy.
BRIEF DESCRIPTION OF THE DRAWINGS
[0013] The foregoing features of the invention will be more readily understood
by
reference to the following detailed description, taken with reference to the
accompanying
drawings, in which:
[0014] The invention will be more fully understood by referring to the
following
Detailed Description of Specific Embodiments in conjunction with the Drawings,
of which:
[0015] Fig. 1A depicts an object that is free of lead in its bulk, but that is
painted with a
surface layer of paint containing lead.
[0016] Fig.1B depicts an object, the painted surface of which is free of lead,
but which
itself contains lead as a constituent.
-4-
CA 02698277 2010-03-02
WO 2009/033089 PCT/US2008/075483
[0017] Fig. 1C depicts an object in which a layer containing lead lies beneath
material
that is free of lead, for example, a layer of lead-containing paint sandwiched
beneath paint or
veneer that does not contain lead. The bulk material is also lead-free.
[0018] Fig. 2A shows XRF spectra of 330 g/cm2 of Pb in lead paint on the
surface of
lead-free wood, and 100 g/g of lead in thick gypsum. The strength of the lead
peaks at 10.5
keV and 12.6 keV are 50 and 30 times, respectively, smaller in the case of the
lead within the
volume of gypsum than in the case of the painted wood.
[0019] Fig. 2B shows the same spectra as in Figure 2A, but the intensity scale
is
logarithmic rather than linear in order to show the background spectra in the
two cases and to
emphasize the dramatic difference in the Lp/La, ratio.
[0020] Fig. 3 is a theoretical plot of the ratio of the Lp to La intensities
of lead as a
function of the thickness or areal density of the material that contains the
lead; geometrical
effects on the ratio have been ignored
[0021] Fig. 4 is an empirical plot of the ratio of LR to La, intensities for
805 ppm of lead
in polyethylene, as a function of the thickness of the polyethylene.
[0022] Fig. 5 is a schematic view of an instrument that may be used in
practice of
methods that are within the scope of the present invention.
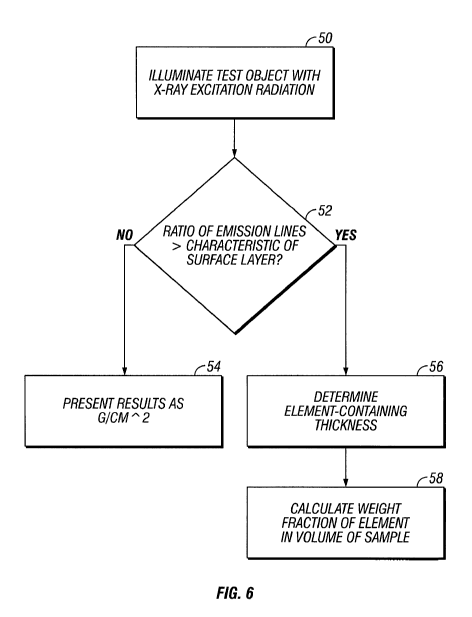
[0023] Fig. 6 is a flowchart depicting steps of a method in accordance with an
embodiment of the present invention.
DETAILED DESCRIPTION OF SPECIFIC EMBODIMENTS
[0024] In accordance with preferred embodiments of the present invention,
rapid and
effective ways are provided to use an x-ray fluorescence (XRF) spectrum in
order to distinguish
automatically between surface and bulk concentrations and to use the
fluorescence spectrum
obtained to determine the essential parameters for a quantitative value for
the concentration in
bulk samples.
[0025] As used herein and in any appended claims, the term "areal density"
refers to the
volume density of an element integrated along a line of sight to a depth to
which the
measurement is effectively made; for material of uniform density and
thickness, the areal density
is simply the density multiplied by the sample thickness. Areal density is
typically expressed in
units of mass per unit area, such as g/cm2.
-5-
CA 02698277 2010-03-02
WO 2009/033089 PCT/US2008/075483
[0026] The methods of the present invention are described, without limitation,
with
reference to data obtained using the hand-held Niton XL3, sold by ThermoFisher
Scientific. This
XRF spectrometer, discussed by way of example, uses a controllable x-ray tube
to produce an
appropriate x-ray excitation beam, a sensitive SiPIN diode to measure the
intensity of fluoresced
x-rays as a function of the x-ray energy and an appropriate pulse processor
and computer to
analyze the detected pulses of fluoresced x-rays and determine the
concentration of the detected
elements.
[0027] The method of the present invention is described herein in terms of the
measurement of lead in toys, although it is to be understood that such
application of the method
is provided solely by way of example, and that the method is applicable in
many other
circumstances. It will be readily apparent to persons of ordinary skill in the
art that the methods
taught herein may be applied to a wide variety of elements in a wide variety
of products. The
measurement of lead in toys, however, is a ubiquitous problem of international
concern. The toy
industry has special responsibilities since children put the toys in their
mouths, chew on them,
and occasionally swallow parts.
[0028] Painted toys do not have more than a few coats of paint, each typically
no thicker
than 0.05 mm, and the paint is put on during production of the toy. Toys are
generally made of
light materials such as plastics or elastomers whose major elements are
hydrogen, carbon,
nitrogen and oxygen. The specific density of the materials employed is
typically close to unity
(i.e., one), the main exception being metal parts.
[0029] The concentration of lead in a surface layer, such as a paint or a
veneer, is
typically measured in units of mass per unit surface area, for example, in
grams of lead per
square cm of surface area. Regulations are generally given in units of
milligrams per square cm;
i.e. mg/cm2. The concentration of lead in bulk material, on the other hand, is
typically measured
in grams of lead per gram of the bulk material. Regulations are generally
given in micrograms
of lead per gram of material; i.e. g/g, which is often written as ppm (parts
per million).
[0030] While the description below posits current United States regulations
that limit
lead concentration in any toy material to less than 600 g/g, that regulation
is in flux. In
particular, a separate regulation will be provided for the paint on toys in
terms of g/cm2. It is
not possible to determine by visible inspection whether the lead detected by
the XRF instrument
is present in surface paint or in the bulk material, or is buried in a layer
underlying the surface
paint and overlying the bulk material. Moreover, each of these situations,
shown in Figs. 1 A, 1B,
and 1 C, requires a different analytic algorithm. If the wrong algorithm is
used, a toy may be
-6-
CA 02698277 2010-03-02
WO 2009/033089 PCT/US2008/075483
found to be out of compliance with regulations when in fact it is in
compliance and vice versa.
Figures 2A and 2B illustrate this essential point.
[0031] Fig. 2A shows the spectra in the lead L x-ray region for two samples:
The large
double-peak spectrum, one peak centered at 10.5 keV and the other at 12.6 keV,
is the spectrum
of a paint layer of 330 g/cm2 on wood. The lower double-peak spectrum (less
intense by more
a factor almost 50) is of a polyethylene sample containing 100 g/g of lead.
Fig. 2B shows the
intensities of the same two spectra in log form, together with background
spectra obtained from
samples of the same materials but free of lead. The polyethylene sample, with
a bulk
concentration of 100 g/g, was 1 cm thick so its areal density of lead was 100
g/cm2.
[0032] The measured count rates in the two spectra differ by a factor of about
50. In
terms of areal densities, the two spectra only differed by a factor of 3.3;
that is, 330 g/cm2
tol00 g/cm2. If, on the other hand, the two spectra are compared in terms of
parts per million,
the difference is just as striking. The 330 g/cm2 paint layer was thin, its
mass per square
centimeter was 10 mg/cm2. The paint layer, therefore, had a lead concentration
of 33,000 g/g.
The paint layer is in compliance in terms of ug/cm2 and completely out of
compliance if
measured in terms of g/g.
[0033] Embodiments of the current invention automatically distinguish surface
lead
from both bulk lead and buried lead. As further discussed below, surface lead
or a buried layer
of leaded material, is measured directly in terms of g/cm2, without needing
any further
information about the sample. A quantitative measurement of lead in bulk,
however, requires
some knowledge of the thickness of the bulk material.
[0034] The invented method described herein accomplishes several important new
functions and does so automatically without the need for any input by the
operator of the
inspection instrument, otherwise referred to herein as the inspector. In the
detailed description
that follows, steps of the method are presented using the non-limiting example
of the detection
of lead in toys.
[0035] Methods in accordance with the present invention are described with
reference to
the three, lead-containing objects of Figs. lA-C. In Fig. 1A, the lead is in
the paint on the
surface. In Fig. 1 B, the lead is distributed throughout the bulk. In Fig. 1
C, the lead is in a buried
layer sandwiched between a non-leaded outer layer and a non-leaded bulk.
-7-
CA 02698277 2010-03-02
WO 2009/033089 PCT/US2008/075483
[0036] The objectives of distinguishing surface lead (also referred to herein,
as "above
the bulk") versus bulk lead, and of further determining thicknesses and
densities are best
illustrated with an example. Assume the paint in Fig. 1A contains 300 g of
lead in each square
centimeter. This lead paint is in compliance with U.S. EPA regulations
requiring that the lead
concentration for lead in painted walls be less than 1000 g/cm2. If, however,
the 300 g of lead
is distributed unifortnly in the bulk, as in Fig. 1B, then the concentration
of lead in each square
centimeter measured in g/g will depend on both the thickness and density of
the bulk material
that is measured.
[0037] For example:
[0038] If the density of the bulk is 1 gm/cm3, and the thickness is one
centimeter, then
the lead concentration is 300 g/g. This concentration is only half of the 600
g/g regulatory
limit based on the regulation that has long been in place for toys but that
will be reduced over the
course of the next few years. The material is, thus, in compliance.
[0039] If the same material is only 2.5 mm thick, the concentration rises to
1,200 g/g;
that is 300 g divided by a volume of 0.25 cm3. The material is no longer in
compliance.
[0040] If the bulk material is aluminum, with a density of 2.7, then a 1 cm
thick sample
has a lead concentration of 111 g/g of lead, and is in compliance even if it
is only 2.5 mm
thick.
[0041] Thus, a determination as to whether an article is in regulatory
compliance
requires knowledge of the lead distribution and the effective thickness of the
lead containing
material.
[0042] In accordance with preferred embodiments of the present invention, the
ratio of
the intensity of two characteristic lines of a specified element is used to
distinguish the three
situations depicted in Figs. lA, 1B and 1C so that the proper algorithms can
be used to give
correct concentration values.
a. The La, line at 10.5 keV and the Lp line at 12.6 keV are the appropriate
signature
lines to measure the concentration of lead.
b. In general the L lines of an element are appropriate signature lines for
the application
of the method to the measurement of the concentration of all heavy elements,
including mercury and uranium.
-8-
CA 02698277 2010-03-02
WO 2009/033089 PCT/US2008/075483
c. For lighter elements, such as barium, cadmium, and arsenic, the Ka and Kb
lines may
be used if their intensities can be measured.
[0043] After identifying that the lead is present in the bulk material, the
ratio of the
intensities of the L lines is used to determine the areal density of bulk
material that is
contributing to the intensity of the L lines.
[0044] The XRF spectrum, in particular the intensity of the fluoresced
spectrum due to
the Compton effect and the presence of significant amounts of heavier
elements, gives a good
measure of the absorption coefficient of the bulk material as a function of
the energy of the x-
rays.
[0045] The intensities of the L lines of lead together with the absorption
coefficients for
the relevant x-rays, allows the concentration of lead to be given in
micrograms of lead per gram
of material.
[0046] In principle, the ratio of quantitative values for obtaining either
surface lead or
bulk lead can be obtained by analytic methods alone but this requires a
detailed knowledge of
geometrical factors, detector efficiencies, fluorescing spectra, etc. In
practice, the relevant
values that depend on these factors are determined at the factory using
standards with know
concentrations of lead at the surface and in the bulk.
[0047] Distinguishing Surface Lead fr~ om Bulk Lead
[0048] Methods of distinguishing surface lead from bulk lead are described
with
reference to Figs. 2 and 3.
[0049] Fig. 2A shows the x-ray spectra, from 8 keV to 16 keV, from surface
lead and
bulk lead. The prominent spectrum, and the only one fully visible at the
intensity scale of the
figure, is that of a TIIST IV lead-paint calibration card containing 300 g of
lead per cm2. The
card is backed with 2 cm of wood. The two strong peaks are the La line at
10.55 keV and the Lp
line at 12.61 keV. The La, line is 18% stronger than the LR line. Both
intensities are about 100
times the intensity of the background under the respective lines. These two
peaks are the
signature lines that identify the presence of lead.
[0050] If the 300 g of lead per square centimeter were extended uniformly
through the
bulk of a thick material, then the concentration of lead in 300 g/g will
depend on the density of
the material and the depth of measurement. In any case, the XRF spectrum would
change. This
-9-
CA 02698277 2010-03-02
WO 2009/033089 PCT/US2008/075483
fact is illustrated in Fig. 2B, which shows Fig. 2B in log form to expose four
spectra. Those
spectra are the following:
1. The intense spectrum 20 from the surface lead.
2. The background spectrum 22 for the surface lead obtained by substituting a
NIST null
calibration for the NIST IV lead calibrator.
3. The spectrum 24 obtained from a lead-in-bone calibration standard made from
gypsum, with 100 g/g of lead.
4. The background spectrum 26 obtained from a null gypsum standard is the
lowest
spectrum in the figure.
[0051] The density of the gypsum is 2.3 g/cm3 so there is 233 g of lead per
cubic
centimeter of sample; i.e. 100 g/g x 2.3 g/cm3. If the lead were on the
surface of a 1 cm thick
gypsum sample, its concentration would be 230 g/cm2, 70% of the lead value in
the NIST IV
sample.
[0052] Attention is directed to three striking differences between the spectra
of the
surface lead 20 and the bulk lead 24, both taken with the same Niton XL3
analyzer.
1. The count rates of the L lines from the surface lead are 50 times greater
than those from
bulk lead. If the bulk lead spectrum were analyzed as surface lead, the
concentration
would be grossly in error.
2. The intensity of the L lines from surface lead is more than 50 times the
background
under the peaks. For the denser bulk material, with the same order of
magnitude of lead,
the L lines are, at most, a few times the background.
3. The Lp/La, ratio for surface lead is 0.8; i.e., less than unity. The ratio
for bulk lead is
1.26. This change in the LR/La ratio is the differentiator of surface and bulk
lead.
4. Strength of the L lines for lead in bulk depends strongly on the presence
of heavy
elements, such as calcium in the case of gypsum. The Lp/La ratio is almost
independent
of composition of the bulk materal.
5. The reversal in the Lp/La ratio with thickness is almost independent of the
composition
of the materials.
-10-
CA 02698277 2010-03-02
WO 2009/033089 PCT/US2008/075483
[0053] Analytic Steps to Measuring the Concentration of a Specified Element,
such as
Lead
[0054] An instrument which may be applied to perform methods of the present
invention is depicted in Fig. 5. A source 3 emits initiating photons 6 that,
with the safety cover
11 off, impinge on test object 12 that consists of a surface layer 1 of
material such as coats of
paint, that is on a substratum 2 of material such as wood. The detector 5
detects a spectrum of
photons 7 that consist of fluorescent x-rays, and photons from the initiating
source that are
scattered by the sample 12. A shield 4 isolates the detector 5 from the direct
radiations from the
source 3. The signals from the detector 5 are amplified by amplifier 8,
processed by an
appropriate signal processor 9 and the results presented in the appropriate
output 10.
[0055] Referring to the flowchart of Fig. 5, x-ray photons emitted by source 3
are used,
in step 50, to illuminate sample 12 and to initiate fluorescent emission. The
ratio of intensities
measured in the two fluorescence emission lines, such as the Lp/La, ratio, is
used, in step 52, to
determine whether the lead is on the surface of the obj ect or is a
constituent of the obj ect. If the
ratio is that expected for surface lead, the data are analyzed 54 on that
assumption and present
the results in g/cm2.
[0056] If the ratio is greater than the ratio expected for surface lead, the
measured ratio
is used 56 to determine the thickness of material that contains the lead and
analyze 58 the data in
the bulk mode.
[0057] Eq. 1 a gives the relationship between the intensity of the La peak,
the mass
absorption coefficients, (Effi), (La,), (p.e), for, respectively, the
fluorescing radiation, the La
line, and the photoelectric mass absorption coefficient resulting in the
emission of an La, x-ray.
D is the areal density, in g/cm2, of the sample in which the lead is uniformly
distributed and f is
the weight fraction of the lead in the material. The quantity C contains
factors such as
geometrical and detection efficiencies. The geometrical efficiencies are
assumed here to be
constant, which, for a thick sample, is only a good approximation if the
sample is far from the x-
ray source and detector.
pLa (p.e.) .f
I (La ) = C I jn p(Ein ) + p(L.) (1- egP [-(f~(Etn ) + f~(La ))D]) 1 a)
[0058] Eq. lb shows the similar relationship for the LR peak.
-11-
CA 02698277 2010-03-02
WO 2009/033089 PCT/US2008/075483
L (p.e.) f
I(LR)=CI;r (E~)+ (L )(1-exp[-( (E~)+ (LR))D~) lb~
R
[0059] Eqs. 2a and 2b describe the situation shown in Fig. 1 C in which the
fluorescing
radiation and the fluoresced radiation are absorbed by an outer layer (OL) of
areal density Douter.
Geometrical factors have been omitted.
I (L Cl,n pza (p.e.)f (eXp[Poz (E +p oL (L )Douter )(1- exp[-(p(E + 2a
,~(L )DPb J)
p (Etn + fu(Ez~ )
I(L~)=CI;,, PLa(pe)f (ex +poz(L )(1-exp[-(,a(Etn) +~(L 2b
fu (E~, ) + fu(Ez, ) p[,aoL (E,n) ~)Dovter ,~)DPb J)
Eq. 3 is the ratio of Eq. 2b to Eq. 2a.
I (L'8) fzz,', (P.e.) [p(E;,, ) + fu(L )] (1- exp [-(,u(E,,,) + Ai(L,6))D])
I (L ) luz.(p.e.)[p(Ein ) + p(L,9)J (1- exp[-(/u(Etõ ) + ,u(L ))D])
[0060] In the limit in which the exponents in Eq. 3 are large, which in
practice means
that the areal density D of the matrix containing the sought-after element is
large, Eqn. 3
simplifies to,
I (L,6 ) ~z~ ( p.e.) [f~(E~n ) + f~(L )]
I (La ) uza ( p.e.) [p(E,õ ) + fi(L,8)]
4)
[0061] Eq. 4 has a maximum value for lead of about 1.3. The actual value will
depend
on geometrical factors that are specific to the XRF instrument used.
[0062] Fig. 4 shows a calculated plot of the LR/La vs. D obtained from Eq. 3
for a
polyethylene object, a common toy material. The values used in the calculation
are similar to
those for other common plastics, including ABS, methacrylates and
polypropylenes, as well as
rubber compounds.
[0063] It should be noted that the calculations take into account the
absorption of the
exciting and de-exciting radiations but do not take into account the decrease
in solid angle for
-12-
CA 02698277 2010-03-02
WO 2009/033089 PCT/US2008/075483
elements at further distances from the front surface. Such efficiencies depend
on specific design
of the XRF instrument used The point is emphasized by Fig. 5, which shows an
empirical
determination of Lp/La, for samples of polyethylene doped with 805 g/g of Pb.
The XRF
instrnment was the ThermoFisher Niton model XL3. The ratio saturates at a
value of unity,
rather than 1.2 because the detector is insensitive to radiations from deeper
than a centimeter
from the surface.
[0064] Three characteristics are worthy of particular note:
1. The ratio of Lp/La, is a direct measure of the maximum thickness of the
polyethylene from
which the fluoresced L x-rays are observed.
2. When the exponents in Equation 3 are large, the ratio reaches the
saturation value given in
Equation 4. The saturation value is nearly independent of material. For
example, LR/La, _
1.2, 1.3, and 1.25 for polyethylene, PVC, and copper, respectively.
3. In the limit when the exponents in Eq. 3 are very small, which is the case
for paint, the ratio
simplifies further and becomes independent of the thickness D, ,
[I(Lp)1 _ PLfl (P.e.) 5)
I (La ) n-)-0 pLa (p.e.)
[0065] which is the ratio of the probabilities for generating the Lp and La
line by the
fluorescing radiation. For lead, this ratio is close to 0.8.
[0066] In summary: If the lead is on the surface, the ratio R is a constant
whose value is
given to first approximation by Eq. 5 for a single monoenergetic fluorescing
radiation. Since
the experimental value of Rs,l,face depends on the relative efficiencies for
detecting the L lines and
may depend on the spectrum of input fluorescing radiation, the exact value,
which should be
determined empirically, will not be much different from 0.8.
[0067] On the other hand, if the lead is in the bulk material, the value of R
will be
greater than RS,,,~e, (it is never less). The measured value of R determines
the thickness D, in
g/cm2, from which the fluoresced L lines originate. The relationship between R
and D, given in
Equation 3 and shown in Fig. 4, is a guide since geometrical effects have not
been included.
Empirical calibrations, carried out at the factory, are necessary for each
distinct XRF instrument
model. Fig. 5 shows an empirical calibration for the ThermoFisher, NITON XL3
analyzer,
-13-
CA 02698277 2010-03-02
WO 2009/033089 PCT/US2008/075483
whose detector is insensitive to radiations coming from more than a centimeter
from the front
face of the instrument. The ratio Lp/La, saturates at a value close to unity
for polyethylene.
[0068] The ratio, LR/La,, thus determines whether the lead is on the surface
or the bulk
and allows the XRF instrument to automatically choose the proper algorithm for
analysis.
Specifically:
[0069] If the ratio is in the range expected for surface lead, i.e. near the
value of 0.8,
then the so-called semi-empirical method, well known in the art, gives an
accurate measure of
the lead concentration in g/cm2.
[0070] If the ratio is in the range expected for bulk lead, i.e. in the range
from 0.9 to 1.4,
then the well-known methods of fundamental parameters, or Compton
normalization, can give
an accurate measure of the lead concentration in g/g.
[0071] The situation shown in Fig. 1 C is distinct from either of the
situations shown in
Figs 1A and lB, and its analysis method is also distinct. The lead in Fig 1C
is buried by some
thickness of non-leaded material. There is no material containing lead at the
surface. To
fluoresce the buried lead, both the incoming excitation and the outgoing lead
x-rays must pass
through the outer layer and suffer absorption. The consequence is that the
Eqs. 3, 4 and 5, which
describe the Lp/La, ratio for the situations in Figs la and lb, become
modified by the
multiplication factor exp[( oL(La) - oL(Lp)) DoL=
[0072] The value of this multiplier can be very large. The ratio, Lp/La can
easily exceed
the maximum value of about 1.4 for bulk lead. For example, a 10 mil thick PVC
outer layer will
increase the value of R by a factor of 1.4; a 20 mil coating will result in a
ratio of LR/La, that
exceeds 2. The sensitivity of the ratio Lp/La, to the thickness of an outer
layer, is the basis for
automatically determining that observed lead is buried beneath material that
does not contain
lead.
[0073] The analytic method for determining the lead concentration when the
lead is
buried has been extensively discussed in the aforementioned Grodzins and
Grodzins/Parsons
patents. When the sample is made of unknown materials of unknown thickness,
the Grodzins
patents show that a quantitative measure of the lead concentration can be
determined if the
intensities of both the La and Lp x-rays are measured. The method is based on
measuring the
ratio of the two intensities and using calibration standards, together with
the absolute value of
the intensity of one of the L lines, to determine the concentration in g/cm2.
-14-
CA 02698277 2010-03-02
WO 2009/033089 PCT/US2008/075483
[0074] The automatic selection of the appropriate analytic algorithm is
summarized as
follows.
1. If R = LR/La, is at the minimum value then the lead is in a thin layer on
the surface and its
concentration, in g/cm2 can be determined by standard semi-empirical methods.
a. R (lead) is -0.8. The value depends slightly on the specific design of the
XRF
instrument.
2. If Rma~, > R> R,,;,, , then the lead is in the bulk and its concentration,
in g/g can be
determined by standard methods such as Fundamental Parameters or Compton
Normalization.
a. The range between Rm;,, and Rma~, needs to be determined empirically since
it
depends on the geometrical design of the XRF instrument. For the
ThermoFisher Niton XL3, the values are R,,,;n = 0.9 and Rmax =1.4.
3. If R> Rm,~x then the lead is buried and its concentration in g/g needs to
be determined
by the methods described in Grodzins and Grodzins/Parsons.
[0075] The specific values given for the automated decision are preferably
determined
by calibration measurements in the laboratory using known concentrations of
lead in plastics of
different thicknesses. These measurements will modify the constants in Eqs. 1
and 2 to correct
for such effects as the reduction in the signal strengths as a function of the
distance of the lead
from the fluorescing source and the detector of the fluoresced radiation.
[0076] In alternative embodiments, the disclosed methods for determining the
content of
a specified elemental substance within a sample may be implemented as a
computer program
product for use with a computer system. Such implementations may include a
series of
computer instructions fixed either on a tangible medium, such as a computer
readable medium
(e.g., a diskette, CD-ROM, ROM, or fixed disk) or transmittable to a computer
system, via a
modem or other interface device, such as a communications adapter connected to
a network over
a medium. The medium may be either a tangible medium (e.g., optical or analog
communications lines) or a medium implemented with wireless techniques (e.g.,
microwave,
infrared or other transmission techniques). The series of computer
instructions embodies all or
part of the functionality previously described herein with respect to the
system. Those skilled in
the art should appreciate that such computer instructions can be written in a
number of
programming languages for use with many computer architectures or operating
systems.
-15-
CA 02698277 2010-03-02
WO 2009/033089 PCT/US2008/075483
Furthermore, such instructions may be stored in any memory device, such as
semiconductor,
magnetic, optical or other memory devices, and may be transmitted using any
communications
technology, such as optical, infrared, microwave, or other transmission
technologies. It is
expected that such a computer program product may be distributed as a
removable medium with
accompanying printed or electronic documentation (e.g., shrink wrapped
software), preloaded
with a computer system (e.g., on system ROM or fixed disk), or distributed
from a server or
electronic bulletin board over the network (e.g., the Internet or World Wide
Web). Of course,
some embodiments of the invention may be implemented as a combination of both
software
(e.g., a computer program product) and hardware. Still other embodiments of
the invention are
implemented as entirely hardware, or entirely software (e.g., a computer
program product).
[0077] The described embodiments of the invention are intended to be merely
exemplary and numerous variations and modifications will be apparent to those
skilled in the art.
All such variations and modifications are intended to be within the scope of
the present
invention as defined in the appended claims.
-16-