Note: Descriptions are shown in the official language in which they were submitted.
CA 02711643 2010-07-07
WO 2009/089344 PCT/US2009/030435
SYSTEMS AND METHODS FOR TISSUE EXAMINATION, DIAGNOSTIC,
TREATMENT, AND/OR MONITORING
Field of the Disclosure
[0001] The disclosure is related to diagnosing and monitoring tissue using
optical
biopsy, and treating tissue in vivo, without extracting the tissue for biopsy.
Related Applications
[0002] This patent application claims priority to U.S. Provisional Patent
Application
Serial No. 61/019,662, filed on January 8, 2008 and entitled "Systems and
Methods for
Tissue Diagnostic, Monitoring, and/or Therapy," which is incorporated herein
by
reference in its entirety.
[0003] This patent application is related to U.S. Patent No. 7,102,758, filed
on May 6,
2003 and entitled "Fourier Domain Low-Coherence Interferometry for Light
Scattering
Spectroscopy Apparatus and Method," which is incorporated herein by reference
in its
entirety.
[0004] This patent application is also related to U.S. Patent Application No.
11/548,468, filed on October 11, 2006 and entitled "Systems and Methods for
Endoscopic Angle-Resolved Low Coherence Interferometry," which is incorporated
herein by reference in its entirety.
[0005] This patent application is also related to U.S. Patent Application No.
12/210,620, filed on September 15, 2008 and entitled "Apparatuses, Systems,
and
Methods for Low-Coherence Interferometry (LCI)," which is incorporated herein
by
reference in its entirety.
[0006] This patent application is also related to U.S. Patent Application No.
11/780,879, filed on July 20, 2007 and entitled "Protective Probe Tip,
Particularly for
Use on a Fiber-Optic Probe Used in an Endoscopic Application," which is
incorporated
herein by reference in its entirety.
1
CA 02711643 2010-07-07
WO 2009/089344 PCT/US2009/030435
Background
[0007] Up to eight-five percent of all human cancers start in the epithelial
tissue. As
shown in Table 1 below, some of these cancers, such as melanoma of the skin
for
example, are easier to detect and to treat, resulting in better five-year
survival rates,
although there is still need for improved detection and treatments. Others,
particularly in
the esophagus, colon, and lung are difficult to find at an early stage, have
low survival
rates if found early, and have extremely low survival rates if found at later
stages.
Furthermore, some patient populations have a higher risk of cancer occurrence
based on
other factors.
Melanoma of
Esophagus Colon Lung Cervix Bladder the Skin
Diagnoses, Deaths and
Survival Rate
New Diagnoses 2006 14,550 148,610 174,470 9,710 61,420 62,190
Deaths 2006 13,770 55,170 162,460 3,700 13,060 7,910
Year Survival Rate 15.6% 64.1% 15.0% 71.6% 80.8% 91.5%
Stage of Cancer When
Diagnosed
Confined 24% 39% 16% 52% 74% 80%
Regional 29% 37% 37% 34% 19% 12%
Metastasized 30% 19% 39% 9% 4% 4%
Unknown 17% 5% 8% 5% 3% 4%
5 Year Survival Rate Based
on Stage at Diagnosis
5 Year Survival - Confined 33.6% 90.4% 49.3% 92.0% 93.7% 99.0%
5 Year Survival - Regional 16.8% 68.1% 15.5% 55.5% 46.0% 64.9%
5 Year Survival - Metastasized 2.6% 9.8% 2.1% 14.6% 6.2% 15.3%
5 Year Survival - Unknown 10.8% 34.6% 7.9% 59.1% 60.4% 76.8%
Table 1: Cancer Diagnoses, Death, and Survival Rates
[0008] In general, the course of care for most cancers involves a procedure to
acquire
data (typically tissue). The acquired tissue is typically sent off to a
laboratory outside of
the context of the tissue acquisition procedure. Depending on the
circumstances, this
analysis may take several hours, days, or weeks. After the analysis is
returned, the
physician may make a diagnosis, and if treatment is necessary, a treatment
procedure
may be employed. Because of the time required for analysis of the acquired
tissue, the
treatment procedure is performed during a separate patient procedure or
examination, and
typically during a patient visit days to weeks later. Treatment may then he
reneated at
2
CA 02711643 2010-07-07
WO 2009/089344 PCT/US2009/030435
various time points subsequent during separate patient procedures to verify
that the
cancer has been eliminated and has not returned. As one example, a
dermatologist may
visually inspect the skin. If a suspicious mole is found, a piece of tissue
may be cut out
and sent to a pathology lab for analysis. Based on the pathology information,
the patient
may undergo a Moh's surgery on the mole where successive layers of tissue are
sliced off
and sent for immediate pathology analysis until a layer with no cancer cells
is obtained.
The patient will probably undergo follow-up visits to visually inspect that
spot and verify
that the cancer has not returned. Similar procedures will be followed for
other cancers,
but with the disadvantage that is it difficult to accurately track the tissue
location when
inside the body in places such as the colon, esophagus, bladder, cervix, oral
cavity, and
others.
[0009] As another example, patients with Gastroesophageal Reflux Disease
(GERD)
may progress to Barrett's Esophagus (BE), at which point they have a 30 to 150
times
greater chance of getting esophageal cancer than the general population. As a
result, the
current standard of care is for these patients to undergo a random biopsy
surveillance
procedure on a periodic basis. The biopsy procedure consists of a four-
quadrant biopsy
taken every centimeter through the affected portion of the esophagus (the
Seattle
Protocol). These biopsies are sent to a pathology lab and, based on the
results, the patient
comes back for the next round of surveillance or further treatment occurs such
as an oral
drug, or in cases of high grade dysplasia or cancer, an esophagectomy.
[0010] There are significant issues with this current approach to detection
and
treatment of numerous cancer types including lack of coverage of tissue, lack
of
sufficient detection at early stages of the disease, time lag between sample
acquisition
and treatment procedures due to the inability to acquire and diagnose tissue
quickly
during the same procedure or patient examination, and need for multiple
procedures.
Because the diagnosis occurs later in time after the tissue acquisition, it is
also difficult to
return to the exact location of the biopsy for further monitoring and
treatment.
Misdiagnosis by the pathologist, and lack of effective treatment options can
occur as a
result.
[0011] Advances by the applicant in low coherence interferometry (LCI),
including
angle-resolved LCI (a/LCI) and Fourier domain LCI (f/LCI) (referred to
collectively as
3
CA 02711643 2010-07-07
WO 2009/089344 PCT/US2009/030435
"f/a/LCI") enable in vivo diagnosis of epithelial tissue health, specifically
if tissue is
normal, pre-cancerous, cancerous, diseased, or abnormal. This opens up new
opportunities, the most significant described of which in the invention to
follow is the
potential to diagnosis, treat, and monitor tissue in vivo, employing methods,
processes,
techniques, and systems that use real-time optical biopsy systems, including
f/a/LCI
systems, for examining and monitoring tissue during the course of the same or
concomitant medical procedure to determine if a therapeutic should be applied
to the
tissue.
Summary of the Detailed Description
[0012] Embodiments in the detailed description cover methods, processes,
techniques, and systems that use real-time optical biopsy systems for
examining and
monitoring tissue during the course of the same or concomitant medical
procedure to
determine if a therapeutic should be applied to the tissue. The real-time
optical biopsy
systems disclosed herein are systems based on low coherence interferometer
(LCI)
detection of light scattered from a sample that can obtain structural and/or
depth-resolved
information regarding in vivo tissue in a single data collection event and
which permits
diagnosis in connection with the data collection. New therapeutic procedures
and
techniques can be implemented as a result. Specifically, tissue can be
diagnosed and
treated during the same or concomitant medical procedure or examination. This
is an
improvement over traditional biopsy techniques where diagnosis of the tissue
cannot be
performed until the biopsy procedure is completed and the biopsy results are
received
after the procedure thereby delaying treatment. Further, the location of the
analyzed
tissue is known thereby allowing localized treatment of the tissue, or the
location may be
returned to for follow up monitoring.
[0013] These methods, processes, techniques, and systems disclosed herein
offer an
opportunity to significantly improve the standard of care for patients and
decrease overall
health care costs by diagnosing and treating tissue conditions, including pre-
cancerous
and cancerous conditions, in vivo. The methods, processes, and techniques
disclosed
herein effectively reduce the treatment time to the time of a first medical
procedure on
the patient, thus providing earlier treatment and potentially better and more
timely results
4
CA 02711643 2010-07-07
WO 2009/089344 PCT/US2009/030435
at a lower cost. This also provides more accurate diagnosis and determination
of
treatment effectiveness since the monitoring is performed on a localized level
with the
ability to diagnose, treatment, and monitor the affected tissue during the
same or
concomitant medical procedure or examination. The above-described methods,
processes, techniques, and systems also enable more efficient diagnosis,
treatment, and
monitoring, or throughput of patients. This may be particularly important
where health
facilities and appointments are a limited resource.
[0014] In disclosed embodiments, real-time optical biopsy systems include
Fourier
domain and/or angle-resolved low coherence interferometry (LCI) optical biopsy
technologies (hereinafter referred to collectively and generically as
"f/a/LCI"). During
the same or concomitant medical procedure or examination, a physician or other
health
care professional will be able to scan tissue in vivo on a localized level
using a real-time
f/a/LCI system, monitor the scan, diagnose tissue status as normal, pre-
cancerous,
cancerous, abnormal, diseased or the like, and administer a therapeutic based
on the
tissue status, if desired or needed. Because the scan of the tissue can be
performed in
real-time using the real-time f/a/LCI system, which collects depth-resolved
and/or
structural information in a single data collection event, monitoring of the
treated tissue
can also be performed in real-time and during the same or concomitant medical
procedure or tissue examination. In the same regard, diagnosis of the tissue
can also be
performed during the same or concomitant medical procedure or tissue
examination. A
therapeutic can also be administered during the same or concomitant procedure
or tissue
examination. If desired, multiple medical procedures at different time points
can then be
used to monitor the status of tissue in vivo over time to determine tissue
status, health or
response to treatment. This allows physicians or other clinicians to fully
maximize the
information opportunity provided by the real-time f/a/LCI system and vastly
improve the
quality of care for the patient.
[0015] In one embodiment, a method for examining and monitoring tissue to
determine if a therapeutic should be applied to the tissue during a same or
concomitant
medical procedure is provided. The method includes optically examining using a
real
time f/a/LCI system a tissue to detect tissues that are cancerous, abnormal,
diseased or the
like which conditions are generally not perceptible to the human eye. Real-
time
CA 02711643 2010-07-07
WO 2009/089344 PCT/US2009/030435
feedback information is monitored regarding the examination of the tissue from
the real-
time f/a/LCI system. Based on the real-time feedback information, a diagnosis
is made as
to whether a treatment should be applied to the tissue. If a treatment is to
be applied, a
selected therapy or combination of therapies is applied during the same or
concomitant
medical procedure.
[0016] The new methods, processes, techniques, and systems address the
shortcoming of the current approaches. For example, since real-time optical
biopsy
systems can acquire data points in short periods of time (e.g., in a few
seconds or
minutes), it is possible to scan much larger areas of the tissue during a same
or
concomitant medical procedure. Furthermore, real-time f/a/LLCI systems can
detect
tissue changes at an earlier stage in the disease. A therapeutic can be
delivered
immediately to a localized area where the real-time f/a/LCI system detected
pre-
cancerous, cancerous, abnormal, diseased tissue, or to a general area during
the same or
concomitant medical procedure. Subsequent scans can be taken to verify the
treatment
outcome and monitor tissue health over time. Information from the real-time
optical
biopsy systems described herein can be used to determine dosing levels or
which choice
of multiple treatment options to use. A standardized database in the computer
can be
employed to allow consistent analysis of tissue based on a database of tissue
characteristics versus tissue health by detecting anomalies in tissue which
may be pre-
cancerous, cancerous, abnormal, diseased or the like.
[0017] Some implementations include the integration of a real-time optical
biopsy
system with an endoscope and/or therapeutic system. This integration results
in a system
with the capability to both diagnose and treat tissue in vivo. Several
architectures are
described including the use of an endoscopic probe, where a real-time optical
biopsy
system probe and the endoscopic light probe share or occupy one or more
channels.
Several architectures are also described including the use of multi-channel
endoscopes
where the real-time optical biopsy system probe occupies one channel and a
therapeutic
applicator can occupy another channel. The therapeutic system may be manually
controlled or computer-controlled. There are a wide range of possible
therapeutics
including, but not limited to, elements, compounds, drugs, liquids, heat,
cold, radio-
frequency (RF) ablation, photodynamic therapy, and radiation. Another
architecture
6
CA 02711643 2010-07-07
WO 2009/089344 PCT/US2009/030435
example uses a single channel endoscope where the real-time optical biopsy
system probe
and the therapeutic system occupy the same fiber or fiber bundle channel. Yet
another
implementation uses a scanning real-time optical biopsy system where multiple
points are
scanned in an automated or semi-automated fashion.
[0018] In addition to clinical activities, a real time optical biopsy such as
f/a/LCI can
be used in research activities, particularly those that track tissue health
over time, such as
in the study of chemo-preventatives. Real time f/a/LCI could be used to scan a
tissue
sample or cell culture at various points in time to assess changes in the
status of the tissue
or cells. For example a cell culture of cancer cells could be scanned and then
treated with
a chemo-preventative and then scanned at subsequent time points to see if the
cancer cells
were killed (such as by apoptosis) or not.
Brief Description of the Drawings
[0019] Figure 1 is a flowchart of an exemplary diagnosis, treatment, and
monitoring
process according to an embodiment;
[0020] Figure 2 is a diagram of an exemplary endoscope;
[0021] Figure 3 is a diagram of an exemplary real-time f/a/LCI system employed
in
an instrument channel of an endoscope for determining tissue status in vivo;
[0022] Figure 4A is a schematic of one exemplary embodiment of the real-time
f/a/LCI system employing a Mach-Zehnder interferometer;
[0023] Figure 4B is an illustration showing the relationship of the detected
scattering
angle to a slit of spectrograph in the interferometer arrangement of Figure
4A;
[0024] . Figure 5 is a flowchart illustrating exemplary steps performed by an
interferometer apparatus to recover depth-resolved spatial cross-correlated
information
about the sample for analysis;
[0025] Figures 6A-D illustrate examples of f/a/LCI data recovered in the
spectral
domain for an exemplary sample of polystyrene beads, comprising the total
acquired
signal (Figure 6A), the reference field intensity (Figure 6B), the signal
field intensity
(Figure 6C), and the extracted, cross-correlated signal between the reference
and signal
field intensities (Figure 6D);
7
CA 02711643 2010-07-07
WO 2009/089344 PCT/US2009/030435
[0026] Figure 7A is an illustration of an axial spatial cross-correlated
function
performed on the cross-correlated f/a/LCI data illustrated in Figure 6D as a
function of
depth and angle;
[0027] Figure 7B is an illustration of an angular distribution plot of raw and
filtered
data regarding scattered sample signal intensity as a function of angle in
order to recover
size information about the sample;
[0028] Figure 8A is an illustration of the filtered angular distribution of
the scattered
sample signal intensity compared to the best fit Mie theory to determine size
information
about the sample;
[0029] Figure 8B is a Chi-squared minimization of size information about the
sample
to estimate the diameter of cells in the sample;
[0030] Figure 9 is a schematic of an exemplary embodiment of a real-time
f/a/LCI
system employing an optical fiber probe;
[0031] Figure I OA is a cutaway view of an f/a/LCI fiber-optic probe tip that
may be
employed by the real-time f/a/LCI system of Figure 9;
[0032] Figure l OB illustrates the location of the fiber probe in the real-
time f/a/LCI
system of Figure I OA;
[0033] Figure 1 IA is an illustration of an alternative fiber-optic real-time
f/a/LCI
system;
[0034] Figure 11B is an illustration of sample illumination and scattered
light
collection with the distal end of probe in the real-time f/a/LCI system of
Figure 1 IA;
[0035] Figure 11 C is an illustration of an image of the illuminated distal
end of the
probe of the real-time fla/LCI system illustrated in Figure 1 IA;
[0036] Figures 12A and 12B are diagrams of an exemplary real-time f/a/LCI
system
and endoscope, wherein the real-time f/a/LCI system is employed in an
instrument
channel of an endoscope, and a therapeutic delivery system is employed in a
second
endoscope channel;
[0037] Figure 13 is a diagram of an exemplary real-time f/a/LCI system and
endoscope, wherein the real-time f/a/LCI system is employed in an instrument
channel of
an endoscope, and a radio-frequency (RF) ablation therapy system is employed
in a
second channel of the endoscope;
8
CA 02711643 2010-07-07
WO 2009/089344 PCT/US2009/030435
[0038] Figure 14 is a diagram of an exemplary real-time f/a/LCI system and
endoscope, wherein the real-time f/a/LCI system is employed in an instrument
channel of
an endoscope, and a photodynamic therapy system is employed in a second
channel of
the endoscope;
[0039] Figures 15A and 15B are diagrams of an exemplary real-time f/a/LCI
system
and endoscope, wherein the real-time f/a/LCI system is employed in an
instrument
channel of an endoscope, and a substance dispenser is employed in a second
channel of
the endoscope;
[0040] Figures 16A and 16B are diagrams of an exemplary real-time f/a/LCI
system
and endoscope, wherein the real-time f/a/LCI system is employed in an
instrument
channel of an endoscope, and a hot/cold therapeutic system is employed in a
second
channel of the endoscope;
[0041] Figure 17 is a diagram of an exemplary real-time f/a/LCI system and
endoscope, wherein the real-time f/a/LCI system is employed in an instrument
channel of
an endoscope, and a surgical instrument(s) for tissue removal is employed in a
second
channel of the endoscope;
[0042] Figures 18A and 18B are diagrams of an exemplary fiber optic real-time
f/a/LCI system integrated into a single channel endoscope, wherein the fiber
optic real-
time f/a/LCI system and a light therapy system share an optical channel in the
endoscope;
[0043] Figure 19 is a diagram of an exemplary real-time f/a/LCI system
employed in
an instrument channel of an endoscope with a separate therapeutic system;
[0044] Figure 20 is a diagram of an exemplary scanning real-time f/a/LCI
system
employed in an instrument channel of an endoscope with a therapeutic system
employed
in a second channel of the endoscope;
[0045] Figure 21 is a diagram of an exemplary real-time f/a/LCI system with
scanner
control and an integrated computer employed in an instrument channel of an
endoscope
with a disposable probe tip;
[0046] Figure 22 is a table that summarizes possible combinations of LCI
systems
and endoscopes for monitoring tissue and types of therapeutics for treating
monitored
tissue;
9
CA 02711643 2010-07-07
WO 2009/089344 PCT/US2009/030435
[0047] Figure 23 is an illustration of a cutaway view of an exemplary probe
tip
employing a fixed sheath;
[0048] Figure 24 is an illustration of a solid view the probe tip illustrated
in Figure
23;
[0049] Figure 25A is an illustration of a cutaway view of an exemplary probe
tip
employing a removable sheath;
[0050] Figure 25B is an illustration of the probe tip illustrated in Figure
25A, and
employing an angled optical window;
[0051] Figure 26 is an alternative illustration of a solid view of the probe
tip
illustrated in Figure 25A;
[0052] Figure 27 is an illustration of the probe tip illustrated in Figures
25A and 26,
employing an optional sterile skirt;
[0053] Figure 28 is an illustration of the probe tip illustrated in Figure 27,
with the
sterile skirt deployed;
[0054] Figure 29 is an illustration of the probe tip illustrated in Figure 27,
further
employing a vacuum-assisted suction device to facilitate application of the
probe tip to a
tissue surface;
[0055] Figure 30A is a diagram of an exemplary embodiment of an f/LCI system;
[0056] Figure 31 is a diagram of another exemplary embodiment of an f/LCI
system
using fiber optic coupling;
[0057] Figures 32A and 32B are diagrams illustrating exemplary properties of a
white light source;
[0058] Figures 33A and 33B are diagrams of an exemplary axial spatial cross-
correlation function for a coverslip sample;
[0059] Figures 34A and 34B are diagrams of exemplary spectra obtained for
front
and back surfaces of a coverglass sample when no microspheres are present;
[0060] Figures 35A and 35B are diagrams of exemplary spectra obtained for
front
and back surfaces of a coverglass sample when microspheres are present;
[0061] Figures 36Aand 36B are diagrams of exemplary ratios of spectra in
Figures
33A and 33B, and Figures 34A and 34B illustrating scattering efficiency of
spheres for
front and back surface reflections;
CA 02711643 2010-07-07
WO 2009/089344 PCT/US2009/030435
[0062] Figures 37 is a diagram of a generalized version of the system shown in
Figures 30 and 31;
[0063] Figure 38 is a block diagram of an exemplary embodiment of a tissue
monitoring method using an f/LCI system;
[0064] Figure 39 is a block diagram of another exemplary embodiment of a
tissue
monitoring method using an f/LCI system;
[0065] Figure 40 is a schematic diagram of an exemplary swept-source (SS)
angle-
resolved low-coherence interferometry (LCI) (SS a/LCI) apparatus and system
that is
used to detect information about a sample of interest;
[0066] Figure 41 is a schematic diagram illustrating the angular light
directed to the
sample and detection of the angular scattered light returned from the sample
using the SS
a/LCI system illustrated in Figure 40;
[0067] Figure 42 is a flowchart illustrating an exemplary process for
detecting
spatially and depth-resolved information about the sample using the exemplary
SS a/LCI
apparatus and system of Figures 40 and 41;
[0068] Figure 43A is a schematic diagram of an exemplary fiber optic-based
swept-
source (SS) angle-resolved low-coherence interferometry (LCI) (SS a/LCI)
apparatus and
system that is used to detect information about a sample of interest;
[0069] Figure 43B is another schematic diagram of the exemplary fiber optic-
based
swept-source (SS) angle-resolved low-coherence interferometry (LCI) (SS a/LCI)
apparatus and system of Figure 43A;
[0070] Figure 44 is a schematic diagram of an exemplary swept-source multiple
angle SS a/LCI (MA SS a/LCI) apparatus and system that is used to detect
information
about a sample of interest;
[0071] Figure 45 is a schematic diagram illustrating the angular light
directed to the
sample and detection of the angularly distributed scattered light returned
from the sample
in two dimensions using the MA SS a/LCI system illustrated in Figure 44;
[0072] Figure 46 is an exemplary model of a two-dimensional image of a
diffraction
pattern from a sample acquired using the MA SS a/LCI system of Figure 44;
[0073] Figure 47 is a schematic diagram of an exemplary optic fiber breakout
from a
fiber optic cable employed in the MA SS a/LCI apparatus and system of Figure
44;
11
CA 02711643 2010-07-07
WO 2009/089344 PCT/US2009/030435
[0074] Figure 48 is a schematic diagram of relative fiber positions of an
endoscopic
fiber optic detection device that can be employed in the MA SS a/LCI apparatus
and
system of Figure 44;
[0075] Figure 49 is a schematic diagram of a multiple channel time domain
a/LCI
apparatus and system that is used to detect information about a sample of
interest;
[0076] Figure 50 is a schematic diagram of an alternative multiple channel
time
domain a/LCI apparatus and system that is used to detect information about a
sample of
interest;
[0077] Figure 51 is a schematic diagram of an alternative time domain a/LCI
apparatus and system that collects angular information about the sample in
serial fashion,
but collects depth information using Fourier domain techniques;
[0078] Figure 52 is a schematic diagram of a fiber optic-based time domain
a/LCI
apparatus and system that collects angular information about the sample in
serial fashion,
but collects depth information using Fourier domain techniques;
[0079] Figure 53 is a schematic diagram of a multi-spectral a/LCI apparatus
and
system; and
[0080] Figure 54 is a schematic diagram of a fiber optic-based multi-spectral
a/LCI
apparatus and system.
Detailed Description
[0081] The embodiments set forth below represent the necessary information to
enable those skilled in the art to practice the invention and illustrate the
best mode of
.practicing the invention. Upon reading the following description in light of
the
accompanying drawing figures, those skilled in the art will understand the
concepts of the
invention and will recognize applications of these concepts not particularly
addressed
herein. It should be understood that these concepts and applications fall
within the scope
of the disclosure and the accompanying claims.
[0082] Embodiments in the detailed description cover methods, processes,
techniques, and systems that use real-time optical biopsy systems for
examining and
monitoring tissue during the course of the same or concomitant medical
procedure to
determine if a therapeutic should be applied to the tissue. The real-time
optical biopsy
12
CA 02711643 2010-07-07
WO 2009/089344 PCT/US2009/030435
systems disclosed herein are systems based on low coherence interferometer
(LCI)
detection of light scattered from a sample that can obtain structural and/or
depth-resolved
information regarding in vivo tissue in a single data collection event and
which permits
diagnosis in connection with the data collection. New therapeutic procedures
and
techniques can be implemented as a result. Specifically, tissue can be
diagnosed and
treated during the same or concomitant medical procedure or examination. This
is an
improvement over traditional biopsy techniques where diagnosis of the tissue
cannot be
performed until the biopsy procedure is completed and the biopsy results are
received
after the procedure thereby delaying treatment. Further, the location of the
analyzed
tissue is known thereby allowing localized treatment of the tissue, or the
location may be
returned to for follow up monitoring.
[0083] These methods, processes, techniques, and systems disclosed herein
offer an
opportunity to significantly improve the standard of care for patients and
decrease overall
health care costs by diagnosing and treating tissue conditions, including pre-
cancerous
and cancerous conditions, in vivo. The methods, processes, and techniques
disclosed
herein effectively reduce the treatment time to the time of a first medical
procedure on
the patient, thus providing earlier treatment and potentially better and more
timely results
at a lower cost. This also provides more accurate diagnosis and determination
of
treatment effectiveness since the monitoring is performed on a localized level
with the
ability to diagnose, treatment, and monitor the affected tissue during the
same or
concomitant medical procedure or examination. The above-described methods,
processes, techniques, and systems also enable more efficient diagnosis,
treatment, and
monitoring, or throughput of patients. This may be particularly important
where health
facilities and appointments are a limited resource.
[0084] In disclosed embodiments, real-time optical biopsy systems include
Fourier
domain and/or angle-resolved low coherence interferometry (LCI) optical biopsy
technologies (hereinafter referred to collectively and generically as
"f/a/LCI"). During
the same or concomitant medical procedure or examination, a physician or other
health
care professional will be able to scan tissue in vivo on a localized level
using a real-time
f/a/L,CI system, monitor the scan, diagnose tissue status as normal, pre-
cancerous,
cancerous, abnormal, diseased or the like, and administer a therapeutic based
on the
13
CA 02711643 2010-07-07
WO 2009/089344 PCT/US2009/030435
tissue status, if desired or needed. Because the scan of the tissue can be
performed in
real-time using the real-time f/a/LCI system, which collects depth-resolved
and/or
structural information in a single data collection event, monitoring of the
treated tissue
can also be performed in real-time and during the same or concomitant medical
procedure or tissue examination. In the same regard, diagnosis of the tissue
can also be
performed during the same or concomitant medical procedure or tissue
examination. A
therapeutic can also be administered during the same or concomitant procedure
or tissue
examination. If desired, multiple medical procedures at different time points
can then be
used to monitor the status of tissue in vivo over time to determine tissue
status, health or
response to treatment. This allows physicians or other clinicians to fully
maximize the
information opportunity provided by the real-time f/a/LCI system and vastly
improve the
quality of care for the patient.
[0085] The new methods, processes, techniques, and systems address the
shortcoming of the current approaches. For example, since real-time optical
biopsy
systems can acquire data points in short periods of time (e.g., in a few
seconds or
minutes), it is possible to scan much larger areas of the tissue during a same
or
concomitant medical procedure. Furthermore, real-time f/a//LCI systems can
detect
tissue changes at an earlier stage in the disease. A therapeutic can be
delivered
immediately to a localized area where the real-time f/a/LCI system detected
pre-
cancerous, cancerous, abnormal, diseased tissue, or to a general area during
the same or
concomitant medical procedure. Subsequent scans can be taken to verify the
treatment
outcome and monitor tissue health over time. Information from the real-time
optical
biopsy systems described herein can be used to determine dosing levels or
which choice
of multiple treatment options to use. A standardized database in the computer
can be
employed to allow consistent analysis of tissue based on a database of tissue
characteristics versus tissue health by detecting anomalies in tissue which
may be pre-
cancerous, cancerous, abnormal, diseased or the like.
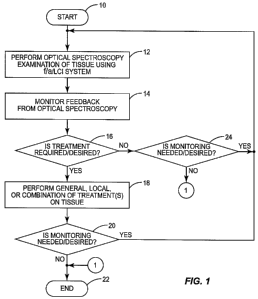
[0086] Figure 1 illustrates an overall exemplary flowchart of new methods,
processes
and techniques that are made possible by this disclosure, especially because
of the ability
of real-time optical biopsy systems to detect abnormal tissues quickly on a
localized
level. Any or all of these steps can be provided or performed. As illustrated
in Figure 1,
14
CA 02711643 2010-07-07
WO 2009/089344 PCT/US2009/030435
an exemplary process starts (block 10) and an in vivo examination of tissue
using a real-
time optical biopsy system is performed (block 12). Real-time optical biopsy
systems are
optical biopsy systems that can examine and monitor tissue during the course
of the same
or concomitant medical procedure to determine if a therapeutic should be
applied to the
tissue. In this example, an Va/LCI real-time optical biopsy, examples of which
are
described in more detail in this application, is employed to perform an in
vivo
examination of tissue (block 12). As will be discussed in more detail below, a
real-time
Va/LCI system allows obtaining of information about tissue of interest
quickly, typically
on the order of seconds or minutes. For example, the real-time f/a/LCI system
may allow
obtaining of information about tissue of interest in one second or less.
[0087] Because of timely acquisition of tissue information, real-time feedback
information regarding the tissue is provided by the real-time Va/LCI system
and can be
monitored by a physician or clinician in real-time and during the same or
concomitant
medical procedure or examination, thereby minimizing time, inconvenience,
and/or
discomfort to the patient (block 14). Further, a timely diagnosis of the
results can be
performed. A diagnosis of the tissue information from the real-time Va/LCI
system can
be performed to determine if treatment of the examined tissue is necessary or
desired. If
necessary or desired, the treatment can be undertaken during the same or
concomitant
medical procedure or examination, and without having to wait for biopsy
results or only
after lengthy scans are performed (block 16). If treatment is required, a
general, local, or
combination of general and local treatment can be performed on the tissue in
the same
localized area of examined by the real-time Va/LCI system with accuracy and
during the
same or concomitant medical procedure or examination of the patient (block
18).
[0088] Thereafter, it can be determined if further monitoring of the affected
tissue is
desired or needed (block 20). This further monitoring can be performed during
the same
or concomitant medical procedure or examination of the patient or during a
subsequent
medical procedure or examination of the patient. If further monitoring is
needed, the
overall process can be performed again (block 10) wherein an optical biopsy of
the
treated tissue can be performed (block 12). If further monitoring is not
required, or it is
not required or possible to see results during the same or concomitant medical
procedure
or examination of the patient, the process ends (block 22). Likewise, if no
treatment is
CA 02711643 2010-07-07
WO 2009/089344 PCT/US2009/030435
desired or needed (block 16), and further monitoring is not required or
desired (block 24),
the process ends (block 22). If further monitoring is required even though
treatment is
not required or desired after an optical biopsy (block 24), the process can be
repeated
(block 10) and another optical biopsy performed (block 12).
[0089] In this regard, the above-described methods and processes can reduce
the
number of medical procedures required to achieve a therapeutic result. If a
traditional
biopsy is performed, a diagnosis of the tissue cannot be performed until the
biopsy results
are received. Therapy, if needed or desired, can only be performed during a
subsequent
medical procedure or examination of the patient. The above-described methods
and
processes also allow monitoring of the effectiveness of the therapy during the
same or
concomitant medical procedure if desired, because the information regarding
the tissue
can be obtained and analyzed during the same or concomitant medical procedure
and
after therapy has been administered. This effectively reduces the application
of treatment
to the time of a first medical procedure on the patient, thus providing
earlier treatment
and potentially better and more timely results at a lower cost. This also
provides more
accurate diagnosis and determination of treatment effectiveness since the
monitoring is
performed on a localized level with the ability to diagnose, monitor, and
treat the affected
tissue during the same or concomitant medical procedure or examination. The
above-
described methods and processes also enable more efficient diagnosis,
treatment, and
monitoring, or throughput of patients. This may be particularly important
where health
facilities and appointments are a limited resource.
[0090] As an example, a tissue examination procedure may be an esophageal
endoscopy performed on patients with risk of esophageal cancer (such as those
with
Barrett's Esophagus). In the prior method, a physical biopsy of the esophagus
is taken
and sent to a pathological laboratory for analysis. It may take one week or so
for a
laboratory technician to analyze the extracted tissue sample and provide the
information
regarding the results to the attending physician. If, for example, it is
determined that
dysplasia is present, the patient is then scheduled for another medical
procedure or
examination in the future. An esophageal endoscopy is then performed again
where a
radio frequency (RF) ablation or other treatment may be performed. The
monitoring of
the treatment cannot be determined during the second medical procedure either.
A
16
CA 02711643 2010-07-07
WO 2009/089344 PCT/US2009/030435
biopsy must be performed in yet a subsequent medical procedure or examination,
and the
process repeated, thus adding substantial delay between the patient's first
procedure of a
biopsy and analysis of the effectiveness of the treatment.
[0091] With the methods, processes, techniques, and systems disclosed herein,
the
physician uses real-time f/a/LCI to scan tissue. Because the information
regarding the
scan is provided on a localized level and in real-time, the physician can
treat any
precancerous, cancerous, diseased, or abnormal areas concomitantly with the
scanning.
Alternately, the physician might first scan the tissue and then go back and
ablate any
areas of concern during the same or concomitant medical procedure. With the
embodiments disclosed herein, there is the possibility of scanning, diagnosis
and
treatment in the same or concomitant medical procedure. Follow up might then
consist
of repeating this procedure at certain time intervals with additional
treatment as
necessary.
[0092] The remainder of this section focuses on system designs that allow
these new
methods, processes and techniques to be carried out in the process of
examining and
treating patients. Additional embodiments of the methods, processes and
techniques
disclosed include medical procedures using real-time f/a/LCI, examples of
which are
described in more detail below. Various systems may be implemented and used to
carry
out the methods, processes and techniques. Examples of these new systems and
methods,
processes, and techniques are described below in more detail in this
application. These
systems are not an exhaustive list, but illustrate examples enabled by the
present
invention to diagnose, monitor, and treat cancer using f/LCI, a/LCI, or
f/a/LCI.
[0093] In one embodiment, the system that can be employed to carry out the
medical
procedure or examination can consist of. (1) a real-time f/a/LCI optical
biopsy tissue
diagnosis system, (2) an endoscope, and (3) a therapeutic that can be
delivered via the
endoscope. This integrated system will then allow the operator to assess the
tissue health
and apply the appropriate. therapeutic to tissue meeting certain criteria. A
typical biopsy
endoscope 26 is illustrated in Figure 2. The endoscope 26 may have a camera,
aperture,
or other imaging device 28 on the end of a shaft 30, which may be rigid or
flexible, for
visual inspection of tissue. An eyepiece 31 is used to review the images of
the tissue
captured by the aperture or imaging device 28. The endoscope 26 may have one
or more
17
CA 02711643 2010-07-07
WO 2009/089344 PCT/US2009/030435
channels 32 for introducing light and zero, and one or more instrument or
accessory
channels 34. As an example, a biopsy endoscope may have three channels, an
integrated
channel for visual inspection, an instrument channel through which biopsy
forceps may
be passed, and an instrument channel through which an f/a/LCI probe may be
passed.
There may also be channels for air and water, and endoscopes may have visual
illumination sources at the distal end.
[0094] Figure 3 illustrates an example of a real-time f/a/LCI system 40
employed in
an instrument channel 41 of an endoscope 42 to perform optical biopsy of
tissue during a
patient procedure or examination, and which may be employed in the above-
described
methods, processes and techniques. This configuration may be useful in that an
endoscope enables guided biopsy where the integrated real-time f/aJLCI system
allows
the operator to determine tissue status in vivo and use that information to
collect biopsies
from the areas of higher concern. As illustrated in Figure 3, the real-time
f/a/LCI system
40 is provided and interfaces with a computer 43 to control the operation of
and receive
data from the f/a/LCI system 40 regarding the tissue examined. In this regard,
the
computer 43 is interfaced with the real-time f/a/LCI system 40 via a
communication
line(s) 44. A fiber bundle or fiber probe 45 from a fiber port 49 on the real-
time f/a/LCI
system 40 is passed down the instrument channel 41 of the endoscope 42 to
direct light to
the tissue of interest and to collect depth-resolved angular distributions of
scattered light
from the tissue for diagnosis, as well be discussed in more detail below. A
second
instrument channel 46 can be provided on the endoscope 42 for receiving light,
air, water,
or other substance via a shaft 47 to assist in the examination of tissue 48.
The physician
can examine or monitor the tissue using the eyepiece 39 of the endoscope 42 as
the real-
time f/a/LCI system 40 scans the tissue 48 of interest. A shaft 51 of the
endoscope 42
can be moved within the patient to examine the tissue 48 of interest.
[0095] Before discussing various embodiments of real-time f/a/LCI systems and
endoscope systems that may be used to examine, diagnose, and administer
treatment to a
patient's tissue, more information regarding real-time f/a/LCI systems is
provided.
Figures 4A-11C illustrate one possible real-time f/a/LCI system that may be
employed to
obtain, diagnose, and treat a patient's tissue during the same or concomitant
medical
procedure, and may also be employed to monitor the effectiveness of treatment
during the
18
CA 02711643 2010-07-07
WO 2009/089344 PCT/US2009/030435
same or subsequent procedures. In summary, the real-time f/a/LCI system
illustrated in
Figures 4A-11 in particular is called Fourier domain a/LCI (faLCI), which
enables data
acquisition at rapid rates using a single scan, sufficient to make in vivo
applications
feasible. The faLCI system can obtain angle-resolved and depth-resolved
spectra
information about a sample, in which depth and size information about the
sample can be
obtained with a single scan, and wherein the reference arm can remain fixed
with respect
to the sample due to only one scan required. A reference signal and a
reflected sample
signal are cross-correlated and dispersed at a multitude of reflected angles
off of the
sample, thereby representing reflections from a multitude of points on the
sample at the
same time in parallel. Other real-time Fourier domain and non Fourier domain
LCI
systems are described herein, which are collectively referred to as "f/a/LCI."
[0096] Since this angle-resolved, cross-correlated signal is spectrally
dispersed, the
new data acquisition scheme is significant as it permits data to be obtained
in seconds or
minutes, a threshold determined to be necessary for acquiring data from in
vivo tissues.
Information about all depths of the sample at each of the multitude of
different scattering
angles on the sample can be obtained with one scan on the order of
approximately 40
milliseconds. From the spatial, cross-correlated reference signal, structural
(size)
information can also be obtained using techniques that allow size information
of
scatterers to be obtained from angle-resolved data.
[0097] The faLCI technique in Figures 4A-11 uses the Fourier domain concept to
acquire depth-resolved information. Signal-to-noise and commensurate
reductions in
data acquisition time are possible by recording the depth scan in the Fourier
(or spectral)
domain. The faLCI system combines the Fourier domain concept with the use of
an
imaging spectrograph to spectrally record the angular distribution in
parallel. Thereafter,
the depth-resolution of the present invention is achieved by Fourier
transforming the
spectrum of two mixed fields with the angle-resolved measurements obtained by
locating
the entrance slit of the imaging spectrograph in a Fourier transform plane to
the sample.
This converts the spectral information into depth-resolved information and the
angular
information into a transverse spatial distribution. The capabilities of faLCI
have been
initially demonstrated by extracting the size of polystyrene beads in a depth-
resolved
measurement.
19
CA 02711643 2010-07-07
WO 2009/089344 PCT/US2009/030435
[0098] The key advances of the present invention can be broken down into three
components: (1) new rapid data acquisition methods, (2) fiber probe designs,
and (3) data
analysis schemes. Thus, the present invention is described in this matter for
convenience
in its understanding.
[0099] An exemplary apparatus, as well as the steps involved in the process of
obtaining angle and depth-resolved distribution data scattered from a sample,
are also set
forth in Figure 5. The faLCI scheme in accordance with one embodiment of the
present
invention is based on a modified Mach-Zehnder interferometer as illustrated in
Figure
4A. Broadband light 50 from a superluminescent diode (SLD) 52 is directed by a
mirror
53 (step 100 in Figure 5) and split into a reference beam 54 and an input beam
56 to a
sample 58 by beamsplitter BS1 (60) (step 102 in Figure 5). The output power of
the SLD
52 may be 3 milliWatts, having a specification of Xo=850 nm, A?,=20 nm FWBM as
an
example, providing sufficiently low coherence length to isolate scattering
from a cell
layer within tissue. The path length of the reference beam 54 is set by
adjusting
retroreflector RR (62), but remains fixed during measurement. The reference
beam 54 is
expanded using lenses L1 (64) and L2 (66) to create illumination (step 104 in
Figure 5),
which is uniform and collimated upon reaching a spectrograph slit 88 (Figure
4B) in an
imaging spectrograph 69. For example, L l (64) may have a focal length of 1.5
centimeters, and L2 (66) may have focal length of 15 centimeters.
[00100] Lenses L3 (71) and L4 (78) are arranged to produce a collimated pencil
beam
70 incident on the sample 48 (step 106 in Figure 5). By displacing lens L4
(78) vertically
relative to lens L3 (71), the collimated input beam 70 is made to strike the
sample 58 at
an angle of 0.10 radians relative to the optical axis in this example. This
arrangement
allows the full angular aperture of lens L4 (78) to be used to. collect
scattered light 80
from the sample 58. Lens L4 (78) may have a focal length of 3.5 centimeters as
an
example.
[00101] The light 80 scattered by the sample 58 is collected by lens L4 (78)
and
relayed by a 4f imaging system comprised of lenses L5 (83) and L6 (84) such
that the
Fourier plane of lens L4 (78) is reproduced in phase and amplitude at the
spectrograph
slit 88 (block 108 in Figure 5). The scattered light 80 is mixed with the
reference beam
54 at a second beamsplitter BS2 (82) (block 108 in Figure 5) with the combined
fields 86
CA 02711643 2010-07-07
WO 2009/089344 PCT/US2009/030435
falling upon the entrance slit 88 to the imaging spectrograph 69 (block 110 in
Figure 5).
The imaging spectrograph 69 may be the model SP2150i, manufactured by Acton
Research for example. Figure 4B illustrates the distribution of scattering
angle across the
dimension of the spectrograph slit 88. The mixed scattered light 86 is
dispersed with a
high resolution grating (e.g., 1200 1/mm) and detected using a cooled charge-
coupled
device (CCD) 90 (e.g., 1340 x 400, 20 m x 20 pm pixels, Spec 10:400,
manufactured by
Princeton Instruments) (block 112 in Figure 5).
[00102] The mixed scattered light signal 86 is a function of vertical position
on the
spectrograph slit 88, y, and wavelength ? once the light is dispersed by the
spectrograph
69. The detected signal at pixel (m, n) can be related to the scattered light
80 and
reference input beam 56 (Es, Er) as:
I(2m,Yn)=(IEr(Am,Yj2) +\IEs(2m,Yn~2) +2Re(Es(Am,Yn)Er(Am,Yn)) cos0 (1)
where 0 is the phase difference between the two beams 70, 56 and denotes an
ensemble average in time. The interference term is extracted by measuring the
intensity
of the signal 70 and reference beams 56 independently and subtracting them
from the
total intensity.
[00103] In order to obtain depth-resolved information, the wavelength spectrum
at
each scattering angle is interpolated into a wavenumber (k = 2 it / A,)
spectrum and
Fourier transformed to give a spatial cross correlation, rSR (z) for each
vertical pixel y,,:
rSR (z, y,,)= f dk e "z (Es (k, yn )Er (k, Yn )) cos 0 (2)
The reference beam 54 takes the form:
Er(k)=Eoexp[-((k-ko)/Ak)2]exp[ ((Y-Yo)/Ay)2]exp[ikAl] (3)
21
CA 02711643 2010-07-07
WO 2009/089344 PCT/US2009/030435
where ko (yo and Ak (Ay) represent the center and width of the Gaussian wave
vector
(spatial) distribution and Al is the selected path length difference. The
scattered light 80
takes the form
E,(k,0)=JjEoexp[ ((k-ko)/Ak)2]exp[iklj]Sj (k,0) (4)
where S1 represents the amplitude distribution of the scattering originating
from thejth
interface, located at depth l;. The angular distribution of the scattered
light 80 is
converted into a position distribution in the Fourier image plane of lens L4
through the
relationship y =f4 0. For the pixel size of the CCD 90 (e.g., 20 m), this
yields an
angular resolution (e.g., 0.57 mrad) and an expected angular range (e.g., 228
mrad).
[00104] Inserting Equations (3) and (4) into Equation (2) and noting the
uniformity of
the reference field 54 (Ay >> slit height) yields the spatial cross
correlation at the nth
vertical position on the imaging spectrograph 69:
r (z,yõ)=l $dklEol2 exp[ 2((k-ka)/Ak)2]exp[ik(z-Al+lj)] xSi (k,0õ =Yõ /
f4)cos0
(5)
Evaluating this equation for a single interface yields:
r (z, y,)=1E0I2eXp{ ((z-Al+lj)Ak)2/8]Sj (k0,0 =Yõ/.f4)cos0 (6)
[00105] Here, it is assumed that the scattering amplitude S does not vary
appreciably
over the bandwidth of the source light 52. This expression shows that we
obtain a depth
resolved profile of the scattering distribution 80 is obtained with each
vertical pixel
corresponding to a scattering angle.
[00106] Figure 6A shows typical data representing the total detected intensity
(Equation (1), above) of the sum of the input beam 56 and the scattered light
80 by a
sample of polystyrene beads, in the frequency domain given as a function of
wavelength
and angle, given with respect to the backwards scattering direction. In an
exemplary
22
CA 02711643 2010-07-07
WO 2009/089344 PCT/US2009/030435
embodiment, this data was acquired in 40 milliseconds and records data over
186 mrad,
approximately 85% of the expected range, with some loss of signal at higher
angles.
[00107] Figures 6B and 6C illustrate the intensity of the reference and signal
fields 54,
70 respectively. Upon subtraction of the signal and reference fields 54, 70
from the total
detected intensity, the mixed scattered light or interference data 86 between
the two fields
is realized as illustrated in Figure 6D. At each angle, interference data 86
are interpolated
into k-space and Fourier transformed to give the angular depth resolved
profiles of the
sample 58 as illustrated in Figure 7A. The Fourier transform of the angle-
resolved, cross
correlated signal 86, which is the result of signal 80 scattered at a
multitude of reflected
angles off the sample 58 and obtained in the Fourier plane of lens L4 (78),
produces
depth-resolved information about the sample 58 as a function of angle and
depth. This
provides depth-resolved information about the sample 58. Because the angle-
resolved,
cross-correlated signal 86 is spectrally dispersed, the data acquisition
permits data to be
obtained in seconds or minutes. Information about all depths of the sample 58
at each of
the multitude of different points (i.e., angles) on the sample 58 can be
obtained with one
scan on the order of approximately 40 milliseconds. Time domain-based scanning
is
required to obtain information about all depths of a sample at a multitude of
different
points, thus requiring more time and movement of the reference arm with
respect to the
sample. Time-domain based angle-resolved LCI (a/LCI) systems can still be
provided
that have the capability of examining and monitor tissue during the course of
the same or
concomitant medical procedure to determine if a therapeutic should be applied
to the
tissue. Examples of time-domain a/LCI scanning systems that can be employed in
this
regard will be described later below .in this application.
[00108] In the experiments that produced the depth-resolved profile of the
sample 58
illustrated in Figure 7A, the sample 58 consists of polystyrene microspheres
(e.g.,
n=1.59, 10.1 m mean diameter, 8.9% variance, NIST certified, Duke Scientific)
suspended in a mixture of 80% water and 20% glycerol (n=1.36) to provide
neutral
buoyancy. The solution was prepared to obtain a scattering length 1= 200 pm.
The
sample is contained in a round well (8mm diameter, 1mm deep) behind a glass
coverslip
(thickness, d- 170 pm) (not shown). The sample beam 70 is incident on the
sample 58
through the coverslip. The round trip thickness through the coverslip (2 n d =
2 (1.5)
23
CA 02711643 2010-07-07
WO 2009/089344 PCT/US2009/030435
(170 m) = 0.53 mm - see Figure 7A) shows the depth-resolved capability of the
approach. The data is ensemble averaged by integrating over one mean free path
(IMP).
The spatial average can enable a reduction of speckle when using low-coherence
light to
probe a scattering sample. To simplify the fitting process, the scattering
distribution is
low pass filtered to produce a smoother curve, with the cutoff frequency
chosen to
suppress spatial correlations on length scales above 16 m.
[00109] In addition to obtaining depth-resolved information about the sample
58, the
scattering distribution data (i.e., a/LCI data) obtained from the sample 58
using the
disclosed data acquisition scheme can also be used to make a size
determination of the
nucleus using the Mie theory. A scattering distribution 114 of the sample 58
is illustrated
in Figure 7B as a contour plot. The raw scattered data 112 about the sample 58
is shown
as a function of the signal field and angle. A filtered curve is determined
using the
scattered data 114. Comparison of the filtered scattering distribution curve
116 (i.e., a
representation of the scattered data 114) to the prediction of Mie theory
(curve 118 in
Figure 8A) enables a size determination to be made.
[00110] In order to fit the scattered data 114 to Mie theory, the a/LCI
signals are
processed to extract the oscillatory component which is characteristic of the
nucleus size.
The smoothed a/LCI data 114 is fit to a low-order polynomial (4th order was
used for
example herein, but later studies use a lower 2nd order), which is then
subtracted from the
distribution 116 to remove the background trend. The resulting oscillatory
component is
then compared to a database of theoretical predictions obtained using Mie
theory 118
from which the slowly varying features were similarly removed for analysis.
[00111] A direct comparison between the filtered a/LCI data 116 and Mie theory
data
118 may not possible, as the chi-squared fitting algorithm tends to match the
background
slope rather than the characteristic oscillations. The calculated theoretical
predictions
include a Gaussian distribution of sizes characterized by a mean diameter (d)
and
standard deviation (8D) as well as a distribution of wavelengths, to
accurately model the
broad bandwidth source.
[00112] The best fit (Figure 8A) is determined by minimizing the Chi-squared
between the scattered data 116 and Mie theory (Figure 8B), yielding a size of
10.2 +/- 1.7
m, in excellent agreement with the true size. The measurement error is larger
than the
24
CA 02711643 2010-07-07
WO 2009/089344 PCT/US2009/030435
variance of the bead size, most likely due to the limited range of angles
recorded in the
measurement.
[00113] As an alternative to processing the a/LCI data and comparing to Mie
theory,
there are several other approaches which could yield diagnostic information.
These
include analyzing the angular data using a Fourier transform to identify
periodic
oscillations characteristic of cell nuclei. The periodic oscillations can be
correlated with
nuclear size and thus will possess diagnostic value. Another approach to
analyzing a/LCI
data is to compare the data to a database of angular scattering distributions
generated with
finite element method (FEM) or T-Matrix calculations. Such calculations may
offer
superior analysis as they are not subject to the same limitations as Mie
theory. For
example, FEM or T-Matrix calculations can model non-spherical scatterers and
scatterers
with inclusions while Mie theory can only model homogenous spheres.
[00114] As an alternative embodiment, the present invention can also employ
optical
fibers to deliver and collect light from the sample of interest to use in the
a/LCI system
for endoscopic applications, such as that illustrated in Figure 3 and those
illustrated later
in this application. This alternative embodiment is illustrated in Figure 9.
[00115] The fiber optic a/LCI scheme for this alternative embodiment makes use
of
the Fourier transform properties of a lens. This property states that when an
object is
placed in the front focal plane of a lens, the image at the conjugate image
plane is the
Fourier transform of that object. The Fourier transform of a spatial
distribution (object or
image) is given by the distribution of spatial frequencies, which is the
representation of
the image's information content in terms of cycles per mm. In an optical image
of
elastically scattered light, the wavelength retains its fixed, original value
and the. spatial
frequency representation is simply a scaled version of the angular
distribution of scattered
light.
[00116] In the fiber optic a/LCI scheme, the angular distribution is captured
by
locating the distal end of the fiber bundle in a conjugate Fourier transform
plane of the
sample using a collecting lens. This angular distribution is then conveyed to
the distal
end of the fiber bundle where it is imaged using a 4f system onto the entrance
slit of an
imaging spectrograph. A beamsplitter is used to overlap the scattered field
with a
CA 02711643 2010-07-07
WO 2009/089344 PCT/US2009/030435
reference field prior to entering the slit so that low coherence
interferometry can also be
used to obtain depth- resolved measurements.
[00117] Turning now to Figure 9, the fiber optic faLCI scheme is shown.
Broadbank
light 50' from a broadband light source 52' is split into a reference field
54' and a signal
input field 56' using a fiber splitter (FS) 120. A splitter ratio of 20:1 is
chosen in one
embodiment to direct more power to a sample 58' via a signal arm 122 as the
light
returned by the tissue is typically only a small fraction of the incident
power.
[00118] Light in the reference field 54' emerges from fiber F1 and is
collimated by
lens L1 1(124) which is mounted on a translation stage 126 to allow gross
alignment of
the reference arm path length. This path length is not scanned during
operation but may
be varied during alignment. A collimated beam 128 is arranged to be equal in
dimension
to the end 131 of fiber bundle F3 (130) so that the collimated beam 128
illuminates all
fibers in F3 (130) with equal intensity. The reference field 54' emerging from
the distal
tip of F3 (130) is collimated with lens L3 (132) in order to overlap with the
scattered field
conveyed by fiber F4 (134). In an alternative embodiment, light 54' emerging
from fiber
F1 is collimated then expanded using a lens system to produce a broad beam.
[00119] The scattered field is detected using a coherent fiber bundle. The
scattered
field is generated using light in the signal arm 122, which is directed toward
the sample
58' of interest using lens L2 (138). As with the free space system, lens L2
(138) is
displaced laterally from the center of single-mode fiber F2 such that a
collimated beam is
produced which is traveling at an angle relative to the optical axis. The fact
that the
incident beam strikes the sample 58' at an oblique angle is essential in
separating the
elastic scattering information from specular reflections. The light scattered
by the sample
58' is collected by a fiber bundle consisting of an array of coherent single
mode or multi-
mode fibers. The distal tip of the fiber is maintained one focal length away
from lens L2
(138) to image the angular distribution of scattered light. In the embodiment
shown in
Figure 10, the sample 58' is located in the front focal plane of lens L2 (138)
using a
mechanical mount 136. In the endoscope-compatible probe shown in Figure 9, the
sample is located in the front focal plane of lens L2 (138) using a
transparent sheath 142
(Figure 10A).
26
CA 02711643 2010-07-07
WO 2009/089344 PCT/US2009/030435
[00120] As illustrated in Figure 9 and also Figure 10B, scattered light 144
emerging
from a proximal end 145 of the fiber probe F4 (134) is recollimated by lens L4
(146) and
overlapped with the reference field 54' using beamsplitter BS (148). The two
combined
fields 150 are re-imaged onto the spectrograph slit 88' of the imaging
spectrograph 69'
using lens L5 (152). The focal length of lens L5 (152) may be varied to
optimally fill the
spectrograph slit 88'. The resulting optical signal contains information on
each scattering
angle across the vertical dimension of the slit 88' as described above for the
apparatus of
Figures 4A and 4B.
[00121] It is expected that the above-described a/LCI fiber-optic probe will
collect the
angular distribution over a 0.45 radian range (approx. 30 degrees) and will
acquire the
complete depth resolved scattering distribution 114 in a fraction of a second.
[00122] There are several possible schemes for creating the fiber probe which
are the
same from an optical engineering point of view. One possible implementation
would be
a linear array of single mode fibers in both the signal and reference arms.
Alternatively,
the reference arm 136 could be composed of an individual single mode fiber
with the
signal arm 122 consisting of either a coherent fiber bundle or linear fiber
array.
[00123] The fiber probe tip can also have several implementations which are
substantially equivalent. These would include the use of a drum or ball lens
in place of
lens L2 (138). A side-viewing probe could be created using a combination of a
lens and a
mirror or prism or through the use of a convex mirror to replace the lens-
mirror
combination. Finally, the entire probe can be made to rotate radially in order
to provide a
circumferential scan of the probed area.
[00124] Yet another data acquisition embodiment of the present invention could
be a
faLCI system is based on a modified Mach-Zehnder interferometer as illustrated
in
Figure 1 1A. The broadband light 50" from a fiber-coupled superluminescent
diode
(SLD) source 52" (e.g., Superlum, Po = 15 mW, 2.o = 841.5 nm, A = 49.5 nm,
coherence length = 6.3 pm) is split into sample arm delivery fiber 56" and a
reference
arm delivery fiber 54" by a 90/10 fiber splitter FS (120') (e.g., manufactured
by AC
Photonics). The sample arm delivery fiber 56" can consist of either of the
following for
example: (1) a single mode fiber with polarization control integrated at the
tip; or (2) a
polarization maintaining fiber. A sample probe 153 is assembled by affixing
the delivery
27
CA 02711643 2010-07-07
WO 2009/089344 PCT/US2009/030435
fiber 56"(NA = 0.12) along a ferrule 154 at the distal end of a fiber bundle
156 such that
the end face of the delivery fiber 56" is parallel to and flush with the face
of the fiber
bundle 156. Ball lens L1 (155) (e.g., fj = 2.2 mm) is positioned one focal
length from the
face of the probe 153 and centered on the fiber bundle 156, offsetting the
delivery fiber
56" from the optical axis of lens L1 (155). This configuration, which is also
depicted in
Figure 11B, produces a collimated beam 160 (e.g., P = 9 mW) with a diameter
(e.g.,
2 f,NA) of 0.5 mm incident on the sample 58" at an angle of 0.25 radians, for
example.
[00125] Scattered light 162 from the sample is collected by lens L1 (155) and,
via the
Fourier transform property of the lens L 1 (155, the angular distribution of
the scattered
field 162 is converted into a spatial distribution at the distal face of the
multimode
coherent fiber bundle 156 (e.g., Schott North America, Inc., length = 840 mm,
pixel size
= 8.2 m, pixel count = 13.5K) which is located at the Fourier image plane of
lens L1
(155). The relationship between vertical position on the fiber bundle, y', and
scattering
angle, 0 is given by y'= f,0. As an illustration, the optical path of light
scattered 162 at
three selected scattering angles is shown in Figure I IB. Overall, the angular
distribution
is sampled by approximately 170 individual fibers for example, across a
vertical strip of
the fiber bundle 156", as depicted by the highlighted area in Figure 11C. The
0.2 mm,
for example, thick ferrule (d1) separating the delivery fiber 56" and fiber
bundle 156
limits the minimum theoretical collection angle (mirth = d, If, ) to 0.09
radians in this
example. The maximum theoretical collection angle is determined by d1 and d2,
the
diameter of the fiber bundle, by Bmax.th = (d, +d2 )l.f, to be 0.50 radians
Experiments using
a standard scattering sample 162 indicate the usable angular range to be Bnun
= 0.12
radians to 0mnx = 0.45 radians d1, , for example, can be minimized by
fabricating a channel
in a distal ferrule 163 (Figure 1 IA) and positioning the delivery fiber 56"
in the channel.
The fiber bundle 156 is spatially coherent, resulting in a reproduction of the
collected
angular scattering distribution at the proximal face. Additionally, as all
fibers in the fiber
bundle 156 are path length matched to within the coherence length, the optical
path
length traveled by scattered light 162 at each angle is identical. The system
disclosed in
"Fiber-optic-bundle-based optical coherence tomography," by T. Q. Xie, D.
Mukai, S. G.
Guo, M. Brenner, and Z. P. Chen in Optics Letters 30(14), 1803-1805 (2005)
(hereinafter
28
CA 02711643 2010-07-07
WO 2009/089344 PCT/US2009/030435
"Xie"), incorporated by reference herein in its entirety, discloses a
multimode coherent
fiber bundle into a time-domain optical coherence tomography system and
demonstrates
that the modes of light coupled into an individual fiber will travel different
path lengths.
In the example herein of the present invention, it was experimentally
determined that the
higher order modes are offset from the fundamental mode by 3.75 mm, well
beyond the
depth (-100 m) required for gathering clinically relevant data. Additionally,
the power
in the higher order modes had a minimal affect on dynamic range as the sample
arm
power is significantly less than the reference arm power. Finally, it should
be noted that
while the system disclosed in Xie collected data serially through individual
fibers, the
example of the present invention herein uses 170 fibers to simultaneously
collect
scattered light across a range of angles in parallel, resulting in rapid data
collection.
[001261 The angular distribution exiting a proximal end 164 of the fiber
bundle 156 is
relayed by the 4f imaging system of L2 (138) and L3 (132) (fz = 3.0 cm, f3 =
20.0 cm) to
the input slit 88" of the imaging spectrograph 69" (e.g., Acton Research,
InSpectrum
150). The theoretical magnification of the 4f imaging system is (f3/f2) 6.67
in this
example. Experimentally, the magnification was measured to be M = 7.0 in this
example
with the discrepancy most likely due to the position of the proximal end 164
of the fiber
bundle 156 with relation to lens L2 (166) . The resulting relationship between
vertical
position on the spectrograph slit 88", y, and 0 is y = Mf, (B - Bm;n) . The
optical path length
of the reference arm is matched to that of the fundamental mode of the sample
arm.
Light 167 exiting the reference fiber 54" is collimated by lens L4 (168)
(e.g., f = 3.5 cm,
spot size = 8.4 mm) to match the phase front curvature of the sample light and
to produce
even illumination across the slit 88" of the imaging spectrograph 69". A
reference field
170 may be attenuated by a neutral density filter 172 and mixed with the
angular
scattering distribution at beamsplitter BS (174). Mixed fields 176 are
dispersed with a
high resolution grating (e.g., 1200 lines/mm) and detected using an
integrated, cooled
CCD (not shown) (e.g., 1024 x 252, 24 m x 24 m pixels, 0.1 nm resolution)
covering a
spectral range of 99 nm centered at 840 nm, for example.
[00127] The mixed fields 176, a function of wavelength, 2, and 0, can be
related to the
signal and reference fields (Es, Er) as:
29
CA 02711643 2010-07-07
WO 2009/089344 PCT/US2009/030435
I(A,B)-(IE,(A ,B 2)+(JE,(aõõB JZl +2Re`E,(,InõB,)E,(,t ,B)cos(¾)), (7)
where 0 is the phase difference between the two fields, (m, n) denotes a pixel
on the
CCD, and ( ...) denotes a temporal average. I(2,,,, B,,) is uploaded to a
personal computer
(PC) using LabVIEW software manufactured by National Instruments and processed
in
320 ms to produce a depth and angle-resolved contour plot of scattered
intensity. The
processing of the angle-resolved scattered field to obtain depth and size
information
described above, and in particular reference to the data acquisition apparatus
of Figures
4A and 4B, can then used to obtain angle-resolved, depth-resolved information
about the
sample 58" using the scattered mixed fields 176 generated by the apparatus in
Figure
11A.
[00128] This disclosure expands the capability of one or more therapeutics to
the
system. The system may or may not be used to collect biopsy samples. Figures
12A and
12B provides a general example of a real-time f/a/LCI system 40, which may be
the
faLCI system previously described above. The faLCI system 40 is integrated
with a
multi-channel endoscopic probe 180 with an integrated therapeutic, which in
this
example is a liquid that is controlled by a manual syringe 182. In this
manner, a
therapeutic can easily be delivered to the same tissue that is analyzed using
the real-time
f/aILCI system 140 while the endoscope is used by a physician to monitor the
actual
tissue 58 being examined. In this regard, the endoscopic probe 180 consists of
a flexible
shaft 184 connected to a body 186 that contains an eyepiece 188 for viewing
through the
visual channel of the endoscopic probe 180. Integrated into the endoscopic
probe 180 is
a channel 190 for light, air, and water to pass down through a shaft 47 into
the
endoscopic probe 180 and for a visual image of the tissue 48 to pass back up
to the
eyepiece 188. As illustrated in Figure 12B, the real-time f/a/LCI system 40 is
integrated
via a separate channel 194 and interfaces with the f/a/LCI control box 196
(Figure 12A),
which may or may not interface to a separate computer 43. A therapeutic that
can be
administered passes down yet another integrated channel 198 and is manually
administered by the operator.
[00129] In this example, the endoscopic probe 180 interfaces with an endoscope
control box 192, which is the source of anything passing into the endoscopic
probe 180
CA 02711643 2010-07-07
WO 2009/089344 PCT/US2009/030435
and the receiver for visual information returning from the endoscopic probe
180. In
many cases, the visual image of the tissue 48 is displayed on a screen
allowing the
operator to see inside the patient without using the eyepiece 188. In this
regard, the
endoscope control box 192 may be under the control of the computer 43 via a
communications line(s) 193 to provide control and for receiving images of the
patient's
tissue if the endoscopic probe 180 employs a camera.
[00130] Note that the endoscopic probe 180, the real-time f/a/LCI system 40,
and
therapeutic functions are shown as independent connections and control boxes
in Figures
12A and 12B, but this is for illustrative purposes only and is not a
requirement. The
computer 43 is shown as independent and connected to the real-time f/a/LCI
system 40
and the endoscopic probe 180; this is also not a requirement. The computer 43
may be
completely integrated or independent and may or may not be connected to
portions of the
system in lieu of the real-time f/a/LCI system 40. A computer 43 as used
herein means
any computing device. Note that this configuration of the real-time f/a/LCI
system 40 in
Figures 12A and 12B will work with numerous therapeutics. The first one
described is a
current experimental technique: radio frequency (RF) ablation. RF ablation
consists of
dosing the tissue with sufficient radio frequency energy to kill a layer of
cells at the
surface of the tissue without harming deeper tissue. This may vary for tissue
type, but for
esophageal tissue is from one (1) Joule/cm2 to 50 Joule/cm2 with a duration of
less than
one (1) second and preferably less than 0.25 seconds, as described, for
example, in U.S.
Patent Application Publication No. US2004/0215296, incorporated herein by
reference in
its entirety.
[00131] Another class of therapeutics is applied substances. The therapeutic
substance
could take the form of a liquid, gel, aerosol, or gas, as examples. This could
include, but
is not limited to, drugs, compounds, and/or elements that cause a chemical
reaction at the
tissue site and/or substances that affect the tissue in a physical manner such
as hot or cold
liquids or acids or bases. Collectively, these administered therapeutics will
be referred to
as "substances." Figures 12A and 12B, previously described above, provided one
exemplary implementation where the therapeutic substance is delivered via a
tube 183
and the flow is controlled via a manual plunger 185 in the syringe 182.
Another
exemplary implementation is shown in Figures 15A and 15B, whereby an automatic
31
CA 02711643 2010-07-07
WO 2009/089344 PCT/US2009/030435
dispenser 210 controls the substance flow and is in turn controlled either via
input 212 on
the dispenser 210, or via electronic control from the same computer 43 via
communication line 213 that collects and analyzes the data from the real-time
f/a/LCI
system 40. As discussed in greater detail below, this control can be manual
via the
operator, fully automatic via the software on the computer, or somewhere in
between.
This system will enable localized controlled delivery of substances to tissue
diagnosed as
abnormal. Tissue extracted from the body and identified as pre-cancerous can
be treated
but there is no way to verify that the same effect will occur in vivo. The
ideal scenario
would be the ability to scan the tissue, dose the tissue with an experimental
compound
and then re-scan the tissue on a periodic basis to observe the effect of the
compound over
time. The system in general and this implementation specifically will offer
this
capability.
[00132] Figure 13 illustrates another implementation, consisting of the
endoscope 192,
the real-time f/a/LCI system 40, and an RF ablation system 200 as the
therapeutic system
of choice. These systems are shown as fully integrated into the endoscope
control box
192 with independent control boxes with full system control managed view to a
user
interface on the computer 43. One possible method of operation is as the
operator scans
the tissue using the real-time f/a/LCI system 40 and the endoscopic probe 180,
anytime
abnormal tissue is detected, the operator triggers the RF ablation system 200
to deliver a
dose of RF energy to the tissue 48. The RF ablation system 200 may be under
the control
of the computer 43 via a communication line(s) 201. Examples of RF ablation
systems
are disclosed in U.S. Patent Nos. 6,551,310 and 6,551,310, and in U.S.
Published Patent
Application No. US2004/0215296A1, each of which is incorporated herein by
reference
in its entirety.
[00133] Another therapeutic that can be used is photodynamic therapy. Here,
the
patient is given a drug called a photosensitizer and then exposed to a
particular type
(wavelength) of light, for example, the light from a Nd:YAG laser at a
wavelength of 630
micrometers. Numerous photosensitizers are known in the art, including but not
limited
to porfimer sodium, chlorins, bacteriochlorins, purpurins, benzoporphyrins,
texaphyrins,
etiopurpurins, naphthalocyanines and phthalocyanines. The drug interacts with
the light
and produces a form of oxygen that kills nearby cells. The photosensitizer is
typically
32
CA 02711643 2010-07-07
WO 2009/089344 PCT/US2009/030435
injected into the blood, and between 24 and 72 hours later, the tumor is
exposed to light.
This time window is set by the fact that the photosensitizer remains in the
cancer cells
longer than in other cells in the body. The photodynamic therapy has several
side affects
including damage to tissue near the tumor and sensitizing the skin and eyes to
light for up
to six weeks after the treatment. A photodynamic therapy system can be
integrated with
the real-time f/a/LCI system 40 and the endoscopic probe 180. One possible
implementation of an integrated photodymamic therapy system with a real-time
f/a/LCI
system is illustrated in Figure 14.
[00134] As illustrated in Figure 14, light from a photodynamic therapy system
202 is
controlled through a shaft 204 into an instrument channel of the endoscopic
probe 180,
which may be an auxillary instrument channel 198 like illustrated in Figure
12B. Further
examples of photodymamic therapy and photosensitizers are disclosed in U.S.
Patent
Nos. 5,330,741; 5,506,255; and 5,591,847 which are incorporated herein by
reference in
its entirety.
[00135] The photodynamic therapy system 202 may be controlled by the computer
43
via a communications line(s) 203. The real-time f/a/LCI system 40 can provide
guidance
information that will help pinpoint where to use the photodynamic therapy on
tissue 48.
An advantage of guiding the photodynamic therapy should be reduced damage to
nearby,
non-cancerous tissue. Care would need to be taken to ensure that the light
used for the
real-time f/a/LCI system 40 does not activate the photodynamic therapy system
202 in a
harmful manner. Some possible solutions include using low enough power levels
for the
real-time f/a/LCI system 40 as not to activate the photodynamic therapy system
202 to a
harmful level or use a wavelength for the real-time f/a/LCI system 40 that is
out of the
range of the activation wavelength(s) for the photodynamic therapy system 202.
[00136] The endoscopic probe 180 may employ single or multi-instrument
channels.
A dual instrument channel variation is illustrated in Figure 15B. As
illustrated therein,
the f/a/LCI probe 45 passes down one instrument channel 215 to access the
tissue 48. A
therapeutic substance can be administered by a therapeutic applicator or probe
214 via a
second instrument channel 217 of the endoscopic probe 180. Operation is
conceptually
similar to the case where the probes 45, 214 are integrated, as provided in
Figure 15A.
Variations include the case where the f/a/LCI probe 45 is integrated and the
therapeutic
33
CA 02711643 2010-07-07
WO 2009/089344 PCT/US2009/030435
probe 214 is administered via an instrument channel and vice versa. Another is
the case
where a single instrument channel endoscope is used, and the f/a/LCI probe 45
and the
therapeutic probe 214 are administered sequentially via the single instrument
channel. In
other words, the f/a/LCI probe 45 is passed down an instrument channel,
measurements
or scanning occurs and when an area requiring treatment is detected, the
f/a/LCI probe 45
is pulled out of the instrument channel, and the therapeutic probe 214 is
passed down the
instrument channel and delivered. Another variation is that more than one
therapeutic
can be used in a same or concomitant medical procedure.
[00137] Another variation on this integrated system is the use of a hot or
cold
therapeutic to ablate or kill the abnormal tissue. The tissue can be locally
heated or
burned to destroy the cells. Alternately, the tissue could be chilled or
frozen to achieve
the same effect. There are numerous system implementations that will achieve
this
effect. A partial list includes placing a small heating coil at or near the
end of the
endoscopic probe 180 that is controlled by heater control unit 220 that in
turn is
controlled by the computer 43, as illustrated in Figure 16A. The heater
control unit 220
may also be integrated into the f/a/LCI control box 196. A conductor 222, such
as a
copper wire for example, is heated in the heater control unit 220 and conducts
heat down
the conductor 222 to the tissue 48 in the body. Using an instrument channel
223 in the
endoscopic probe 180, heated or chilled air or liquid is passed down and
administered to
the tissue 48. Alternatively, using a thermoelectric cooler (TEC) that is
either in the
heater control unit 220 where the cold is conducted down to the tissue 48 via
the
conductor 222 or is physically located at or near the tip end 224 of
endoscopic probe 180
and controlled via an electronic connection 226 to the heater control unit 220
can be used.
In another embodiment, cryoablation may be used to treat the abnormal tissue.
An
example of a device to perform cryoablation is disclosed in U.S. Patent No.
7,255,693,
which is incorporated herein by reference in its entirety.
[00138] Another class of therapeutics involves removal of the non-normal (pre-
cancerous or cancerous) tissue. This could be done via a variety of methods
including
cutting, scraping, using a punch biopsy, using an alligator clip biopsy and
many others.
One possible implementation is shown in Figure 17 where a manual external
control is
used to surgically cut out tissue of concern. In this regard, a surgical
instrument 230 can
34
CA 02711643 2010-07-07
WO 2009/089344 PCT/US2009/030435
be provided and inserted into an instrument channel 232 of the endoscopic
probe 180.
The surgical instrument 230 allows removal of tissue 48 while the real-time
f/a/LCI
system 40 and the endoscope 192 are used to monitor and diagnose the tissue
48. There
are multiple procedures that could be used to surgically remove tissue. One
might be to
scan the full area of concern, map out diseased tissue, go back and surgically
remove
tissue and then re-scan the area of concern to verify that the diseased tissue
has been
removed. Another might be to scrape out tissue as the real-time f/a/LCI system
40 scan
occurs. Another would be to use standard biopsy tools to remove tissue that
has been
identified as of concern with a possible additional re-scan to verify that all
tissue of
concern has been removed.
[00139] Another implementation is illustrated in Figures 18A and 18B and
employs a
single channel endoscopic probe 180 where the real-time f/a/LCI system 40 and
a
therapeutic system 240 are delivered via the same optical fiber or fiber
bundle over a
single channel 242. The therapeutic could be light ablation of the tissue 48
where the
high power light travels down the same fiber or fiber bundle 45 used by the
real-time
f/a/LCI system 40 to diagnosis the tissue 48 since both light ablation and the
real-time
f/a/LCI system 40 employ light as their means of performance. A single fiber
or fiber
bundle 244 comes out of the endoscopic probe 180 on the patient side at the
tissue 48.
The single fiber or bundle 244 is then connected to an optical switching
device 246 that
connects the fiber 244 to either the real-time f/a/LCI system 40 or a high
power source
therapeutic system 240. The high power source therapeutic system 240 may be
under
control of the computer 43 via communication line 241. This optical switching
device
246 may be controlled by the computer 43 in conjunction with the real-time
f/a/LCI
system 40 and the high power source therapeutic system 240. Typical operation
might
include scanning the tissue 48 with the single channel endoscopic probe 180
and
triggering the high power source therapeutic system 240 to ablate the tissue
48 when an
abnormal condition is detected. This embodiment may be useful for reaching
tissue 48
that may not be accessible with the larger multi-channel endoscopes used, for
example, in
the esophagus or colon. Examples include endoscopes for reaching the bladder
or the
pancreas where access paths are a few millimeters or less in size. By
employing the same
CA 02711643 2010-07-07
WO 2009/089344 PCT/US2009/030435
fiber or fiber bundle 244 for the diagnosis and therapeutic will enable the
operator to
survey and treat tissue that might otherwise be inaccessible.
[00140] Note that the high power source therapeutic system 240 can either be
continuous wave (CW) in operation or pulsed. Any wavelength can be used
conceptually, selection will be driven by availability of sources and which
wavelength(s)
provide the best interaction with tissue to ablate abnormal tissue while
minimizing effects
on adjacent healthy tissue. Also, the multiple boxes shown for the computer
43, real-time
f/a/LCI system 40, high power light source 240, and optical switching device
246 may be
consolidated into fewer packages or devices.
[00141] The real-time f/a/LCI system 40 may also be used in conjunction with
nanoparticles to modify the signal generated by the interaction with the
sample and/or
treat a condition within the sample. As an example, nanoparticles might be
used to
increase the optical contrast between the cell and the cell nuclei to increase
the signal
strength generated by the real-time f/a/LCI system 40. This may enable deeper
penetration in the sample, which would be advantageous in many applications
including
the detection of skin cancer. Skin cancer is not normally detectable by
f/a/LCI because
the precancers or cancers start about one (1.0) millimeter below the surface
and
insufficient light reaches that depth and is scattered back. Increasing
contrast may reduce
the amount of light required to generate an f/a/LCI signal enabling deeper
penetration in
the tissue. Another application of f/a/LCI with nanoparticles is in the
treatment of
precancers or cancers. Nanoparticles can be used in a variety of treatment
options for
cancers, including using the nanoparticles which are toxic or carry toxic
substances to kill
precancerous or cancerous cells or tissue or using nanoparticles for
photodynamic
therapy where the nanoparticles absorb a light (perhaps from a specific
wavelength or
wavelength range) and heat up, thereby killing cells. For example, a real-time
alf/LCI
system can be used to identify and diagnose the presence of pre-cancerous or
cancerous
tissue, and then during the same or concomitant medical procedure the
physician can treat
the tissue with the nanoparticles. Several such uses or therapies utilizing
nanoparticles
are knownin the art as shown by the following references each of which is
incorporated
herein: O'Neal et al. Photo-thermal tumor ablation in mice using near infrared-
absorbing nanoparticles, Cancer Letters 209:171-176 (2004); Gu et al.,
Targeted
36
CA 02711643 2010-07-07
WO 2009/089344 PCT/US2009/030435
Nanoparticles for Cancer Therapy, NanoToday 2:14-21 (2007); Loo et al.,
Nanoshell-
Enabled Phtotonics-Based Imaging and Therapy of Cancer, Technology in Cancer
Research & Treatment, 3: 33-40 (2004).
[00142] Another embodiment is to use a standalone real-time f/a/LCI system 40
to
provide monitoring of an area of tissue 48 with a therapeutic provided
separately. This is
illustrated by example in Figure 19. The common components in the system have
been
previously described and will not be repeated herein. After the real-time
f/a/LCI system
40 is used to monitor the tissue, it is removed and then, either immediately
or at a later
time, a therapeutic can be administered to the tissue 48, if needed or
desired, based at
least in part on the information obtained from the real-time f/a/LCI system 40
monitoring.
The real-time f/a/LCI system 40 could access the tissue via an endoscope of
any of the
forms previously described or may be a standalone real-time f/a/LCI system 40
capable
of accessing tissue on its own. The therapeutic used might be any of the ones
discussed
in this disclosure or another therapeutic.
[00143] Another implementation of the real-time f/a/LCI system 40 can be used
in
conjunction with an endoscope and scanning mechanism that permits the real-
time
f/a/LCI system 40 to scan more than one spot on the tissue 48. Figure 20 shows
one
possible implementation where a balloon 266 (or other device) is used to fix
the location
of the tissue 48 relative to an f/a/LCI scanner 262. In this example, the
scanner 262 is
fixed to a scanner head 265 and rotating mechanism 260 to be controlled to
rotate in a
spiral pattern to cover the tissue 48 section from bottom to top. This
implementation may
be faster than point by point coverage and may give a more uniform sampling of
the
tissue. An integrated therapeutic applicator 264 can be employed to deliver a
therapeutic
to the tissue 48, as previously discussed. There are also multiple options for
use of this
system in Figure 20. One is the case where the tissue 48 is treated as the
scan occurs.
This may either be automatic or manual and may require a therapeutic that can
pass
through the balloon 266, such as light, heat, cold, etc. Another case is where
a scan is
taken of the tissue 48 and then the operator goes back and treats the tissue
48 based on
data from the scan. There may be another scan to verify that the tissue is
treated. Again,
this may be manual or automatic.
37
CA 02711643 2010-07-07
WO 2009/089344 PCT/US2009/030435
[00144] The exemplary systems illustrated thus far have shown an independent
computer 43 as part of the system. This is not a requirement. However, the
processing of
the f/a/LCI information regarding the tissue could be done by any type of
computer, such
as a laptop, desktop, remote computer (including one connected by a wireless
network),
or other. There maybe varying levels of physical integration. Figure 21 shows
a system
with the computer 43 fully integrated into the real-time f/a/LCI system 40 in
a chassis or
box 269. This could be accomplished by a computer on a printed circuit board
(PCB)
board along with an liquid crystal display (LCD) display screen 272 and
control panel
270, or some other configuration. The processing of the information regarding
the tissue
could also be performed in a separate system. The processing could be
performed in one
or more computers, one or more microprocessor, one or more digital signal
processors
(DSPs), one or more field programmable gate arrays (FPGAs), or some
combination of
these or other processing devices. Likewise, the external processing may occur
in system
with some combination of computers, microprocessors, DSPs, and/or FPGAs. It
may
also be the case that the external processing does not occur in the same
location but may
be in a different location and connected by the some communications system
including,
but not limited to, wireless, WiFi, Ethernet, serial or other. Also note that
the
communication between the chassis 269 and the external processing may occur
via any
number of communication methods including universal serial bus (USB),
Firewire,
Ethernet, WiFi, other serial (RS-232, etc) or other method.
[00145] There is a range of automation that can be achieved with this system
and all
levels are intended to be covered by the present invention. As examples, low
automation
might be the case where the real-time f/a/LCI system generates information and
displays
it to the screen. Using this information, the operator delivers some dosage of
some
therapeutic to the tissue. In this case, there may be no electronic connection
between the
computer and the endoscope or the therapeutic control. A middle level of
automation
might be the case where there is a connection between the computer and the
therapeutic
delivery system and the computer determines the dosage level based on
information from
the real-time f/a/LCI system and internal algorithms. The operator would
control when
the therapeutic is delivered, but the dosage is determined via software. A
very high level
of automation might be the case where the therapeutic is delivered independent
of
38
CA 02711643 2010-07-07
WO 2009/089344 PCT/US2009/030435
operator control. As the tissue is being scanning (either manually or
automatically), the
computer can control the delivery of the therapeutic based on information
received from
the real-time f/a/LCI system and internal algorithms.
[00146] There are numerous possible configurations of the real-time f/a/LCI
system 40
and therapeutic delivery techniques described above. Figure 22 summarizes some
of
these possibilities. The real-time f/a/LCI system 40 may be a faLCI system, an
aLCI
system, or an fLCI system, some of which have been previously described and
some of
which will be described below in this application. The endoscopic probe 180
employed
may be an integrated, single-channel, or multi-channel endoscope. The channels
may be
"integrated" in that they are physically part of the endoscope or the channels
may be open
passageways through the scope that any number of instruments or accessories
may pass
through. Typically the more channels an endoscope has, the larger the radial
size, thus
potentially limiting where the endoscope may go in the body. Endoscopes come
in a
variety of configurations; the endoscopy portion that goes into the patient
may either be a
rigid or flexible tube. Typically rigid tubes are limited to 20 to 30
centimeters in length,
while flexible tubes may be several meters long. Finally, for this system,
there are
numerous types of possible therapeutics, which may influence the design of a
particular
version of the integrated system. The therapeutic can be an applied substance,
heat/cold
application, radiation, tissue removal, or other therapeutic.
[00147] Some of the therapies discussed have been localized or regional in
nature.
f/a/LCI offers an advantage here by pinpointing the location(s) to apply one
or more of
these therapies. f/a/LCI and the information generated by real-time f/a/LCI
systems may
also be used to guide or determine the use of other therapies which may
involve the
whole body or areas outside the location where the pre-cancer or cancer may be
found.
This included many of the therapies used today including radiation,
stereotactic
radiosurgery or therapy (which uses multiple radiation beams to irradiate
small targets
with minimum impact to adjacent tissue, also know as gamma knife), surgery
(including,
but not limited to general, Mob's surgery, laparoscopic or minimally invasive
surgery
(1MIIS) and robotically assisted MIS), andchemotherapies (including both oral
and
injected chemotherapies). The real-time f/a/LCI may be used as part of a
procedure for
gating the use of these therapies.
39
CA 02711643 2010-07-07
WO 2009/089344 PCT/US2009/030435
[00148] In addition, the f/a/LCI systems disclosed herein can be used to
detect in
tissue the margin or boundary between pre-cancerous, cancerous or diseased
cells and
normal cells. Repeated application of real-time f/a/LCI is then used to direct
the serial
surgical removal of all or nearly all the pre-cancerous or cancerous cells in
the same or
concomitant medical procedure. Such combination of real-time f/a/LCI optical
biopsy
and surgical removal of pre-cancerous, cancerous or diseased issue can be
applied to any
organ of tissue of the body using the methods, processes, techniques and
systems of the
present inventions. As another option, these therapies (in particular, the
chemotherapies)
may be used in conjunction with one or more of the localized treatment
options. As an
example, a location in the esophagus may be identified as pre-cancerous by an
f/a/LCI
system leading to an RF ablation treatment for that area of the esophagus and
a course of
chemotherapy.
[00149] Early detection by the f/a/LCI may enable not only the use of
chemotherapies, but also chemopreventatives that have been developed or are
under
development. These chemopreventatives have not been widely deployed because
there
may be no good way to identify pre-cancerous conditions at an early enough
stage, and
because of the difficulty in identifying and testing potential
chemopreventatives because
of the issues in identifying pre-cancerous conditions at an early enough stage
and
conducting longitudinal testing to validate the effectiveness of these
chemopreventatives.
One possible example of this would be the identification of a pre-cancerous
lesion in an
esophagus where the patient then undergoes a course of injected (or oral)
chemopreventative followed by f/a/LCI monitoring exams at one or more time
points to
verify the reduction or elimination of the pre-cancerous lesion.
[00150] With the above backdrop, more detail regarding possible aspects of the
systems are now described. In certain systems illustrated and previously
described
above, an endoscope probe tip 250 is shown in certain embodiments as a
protective
cover. The probe tip 250 may be disposable as a convenient means to keep the
tip end
224 of the endoscope shaft 184 sterile so it can be used for multiple
patients. In this
regard, Figures 23-29 illustrate various examples of probe tips 250 that may
be employed
if the f/a/LCI probe 45 is employed in an instrument channel in the endoscope
shaft 184.
In general, the probe tip 250 can include a protective sheath over the optical
fiber or
CA 02711643 2010-07-07
WO 2009/089344 PCT/US2009/030435
bundle of the f/a/LCI probe 45. The probe tip 250 provides a sterile interface
between
the optical fiber probe 45 and the tissue surface 58 under examination during
endoscopic
applications. Because the probe tip 250 may be employed in optical
spectroscopic
techniques, the probe tip 250 includes an imaging element (e.g., lens) to
capture reflected
light from the tissue 48. The probe tip 250 is adapted to maintain the
positioning of the
imaging element relative to the optical fiber to properly pass reflected light
from the
tissue 48 to the optical fiber within the f/a/LCI probe 45.
[00151] As illustrated in Figure 23, a probe tip 250 is provided in accordance
with one
embodiment. The probe tip 250 may be employed in any embodiment previously
described, but may be particularly useful for a combined f/a/LCI probe 45 and
therapeutic
probe 214. Figure 24 illustrates the probe tip 250, but in solid view. The
probe tip 250 is
adapted to cover the distal end of an optical fiber probe 45 used in an
endoscopic imaging
system, including those described above. If applied, the distal ends of the
delivery fiber
and fiber bundle 48 will be contained within the probe tip 250, as illustrated
in Figure 23.
[00152] One function of the probe tip 250 can be to create a fixed geometry
between
an optical fiber probe 45, an imaging element, and the tissue 48 under
examination.
Thus, a first component that can comprise the probe tip 250 is a means to
locate an
imaging element, such as a lens 282, relative to the fiber optic or bundle
probe 45. Figure
23 shows a cutaway schematic of the use of a fixed sheath 284 comprised of a
cylindrically-shaped outer wall having a hollow portion 285 placed over and
surrounding
the distal end of the fiber probe 45 to position the lens 282. In this
embodiment, the fixed
sheath 284, having a fixed length, is placed over the fiber bundle 45 with a
retaining ring
286 used to maintain the fixed distance between the fiber bundle 45 and the
lens 282.
The fixed sheath 284, by being fixed, possesses a rigid construction to
maintain the
required positioning of the lens 282 relative to the fiber probe 45. The lens
282 is located
on a distal end of the fixed sheath 284. The fixed sheath 284 can be affixed
to the fiber
probe 45 with an adhesive, or can be attached to the retaining ring 286 using
a flange or
other locking mechanism. This configuration can be modified to include other
types of
optical elements or multiple optical elements (lenses, etc.).
[00153] If the probe tip 250 is employed in a real-time f/a/LCI system 40, the
lens 282
can be placed approximately one focal length away from the fiber probe 45.
This may be
41
CA 02711643 2010-07-07
WO 2009/089344 PCT/US2009/030435
required for the lens 282 to properly capture the reflected angular
distribution of light
from the tissue for analysis. In alternate embodiments, the lens 282 can be
positioned
such that an individual single or multimode fiber or an array of such fibers
is maintained
at the focus of the lens 282. In other embodiments, the imaging lens 282 can
be
positioned at other distances from the fiber optic probe 45, which are
different than the
focal length of the lens 282.
[00154] Figures 25A-26 illustrate an alternative embodiment of the probe tip
250
incorporating a removable sheath member 288. The removable sheath member 288
is a
structure that is adapted to receive the fixed sheath 284 of the probe tip 250
to prevent the
lens 282 and the fiber probe 45 from being contaminated during an endoscopic
application. The removable sheath member 288 is comprised of a cylindrical-
shaped
wall 290 containing a hollow portion 292 that receives and surrounds the fixed
sheath
284 as part of the probe tip 250. The distal end of the removable sheath
member 288
contains an optical window 294. The optical window 294 provides a path for
reflected
light from the tissue sample to pass back to the lens 282 in the fiber probe
tip 250 to
capture information about the tissue. The optical window 294 also flattens the
tissue to
provide for an even scan and to provide greater depth resolution accuracy. The
optical
window 294 can be made out of any material including glass, plastic, or may
comprise
any other type of transparent material, including, but not limited to a
membrane or other
transparent material placed or stretched over the distal end of the disposable
member 288.
Anything that will transmit light can be used as the optical window 294.
[00155] The function of the optical window 294 is also to position the tissue
relative to
the lens 282 a proper distance from the tissue due to the rigid form of the
cylindrical-
shaped removable sheath member 288. The abutment of the optical window 294 to
the
tissue surface provides a fixed distance between the tissue surface and the
lens 282 in the
fixed sheath 284. This may be necessary to properly capture reflected light
from the
tissue on the lens 282. Maintaining the relationships between the tissue (via
the optical
window 294) and the lens 282, and between the lens 282 and the fiber probe 45
can be
important in properly capturing reflected light from a tissue to analyze
characteristics
about its surface and/or underlying cell structures.
42
CA 02711643 2010-07-07
WO 2009/089344 PCT/US2009/030435
[00156] The optical window 294 may be perpendicular with respect to the
longitudinal
axis of the probe tip 250, as illustrated in Figure 25A, or may be slanted at
an angle to
allow better abutment of the optical window 294 to the tissue, as illustrated
in Figure
25B. Providing an angular configuration may help avoid reflection, which can
obscure
reflected scattered light captured at the optical window 294. But if the angle
of the
optical window 294 is slight, for example, 0 to 20 degrees, and in a preferred
embodiment, eight degrees, the lens 282 may still be able to properly capture
the light
and its angular distributions if the probe system is an angle-resolved system.
If the angle
of the optical window 294 will not allow the lens 282 to properly capture the
angular
distribution of the reflected, scattered light, the lens 282 can also be
angled in the same or
similar orientation to the optical window 294.
[00157] In an application of the probe tip 250 designed for a real-time
fla/LCI system,
the optical window 294 is designed on the disposable removable sheath member
288 to
be located approximately at the focal length of the lens 282. Providing the
optical
window 294 approximately one focal length away from the lens 282 allows the
proper
capture of the angular distributions of reflected light in the Fourier domain.
[00158] In alternative embodiments, the lens 282 may be integrated into the
removable sheath member 288 as opposed to being integrated into the fixed
sheath 284.
Other alternative embodiments allow for different positioning of the optical
window 294
relative to the lens 282.
[00159] In order to allow the removable sheath member 288 to be placed onto
the
probe tip 250 and removed after endoscopic application, a locking mechanism
may also
be included. This prevents having to wash the fixed sheath 284 after each
endoscopic
application since the fixed sheath 284 and the lens 282 are not exposed when
protected
by the removable sheath member 288. In this regard, the removable sheath
member 288
is first placed onto the fixed sheath 284 prior to application. Thereafter, it
may be locked
into place to prevent the removable sheath member 288 from coming loose during
application. After the probe tip 250 is removed from the endoscopic
application, the
removable sheath member 288 can be unlocked and removed for disposal. In this
manner, the fixed sheath 284 and exposed lens 282, which may be one of the
more
43
CA 02711643 2010-07-07
WO 2009/089344 PCT/US2009/030435
expensive components of the probe tip 250, are never exposed to the tissue and
do not
have to be washed.
[00160] In the embodiments shown in Figures 25A-26, the removable sheath 288
is
attached to the fiber probe 45 by sliding a locking pin 296 into a locking pin
channel 298
in the removable sheath member 288. Then, the removable sheath member 288 is
rotated
with respect to the fixed sheath 284 to lock the removable sheath ember 288 in
place.
When it is desired to remove the removable sheath member 288, such as after
endoscopic
application, the removable sheath member 288 is rotated in the opposite
direction from
the locking rotation direction to allow the locking pin 296 to be removed from
the
locking pin channel 298. Figures 25A-25B illustrate the locking pin 296
engaged with
the locking pin channel 298 in a cutaway view. Figure 26 illustrates the
locking pin
channel 298 as it appears on the outside view of the removable sheath member
288. The
locking pin channel 298 contains an angled channel portion 300 to allow the
locking pin
296 to lock in place and provide resistance if the removable sheath member 288
has a
force applied to it opposite from the fiber probe 45. The angled channel
portion 300 is t
substantially a right angle with respect to the locking pin channel 298 in the
illustrated
embodiment. Note, however, that the locking pin channel 298 may provide the
angled
channel portion 300 at other angles other than a right angle. Alternative
embodiments
may also provide alternative means for locking the removable sheath member 288
in
place, including but not limited to a locking flange or ring mechanism.
[00161] While the removable sheath member 288 described above will prevent
direct
contamination of the distal face of the fiber probe 45, it is possible that
fluids could
penetrate through the locking pin channel 298 or come in contact with the
portion of the
fiber probe 45, which is not covered by the removable sheath member 288. For
this
reason, the probe tip 250 can be designed to additionally incorporate a
deployable sterile
skirt 302 which can prevent such contamination. Figures 27 and 28 illustrate
schematics
views of the skirt 302 in an initial retracted or coiled and deployed or
uncoiled position,
respectively.
[00162] In the illustrated embodiment, the skirt 302 is attached to the
removable
sheath member 288 at a point distal to the locking pin 296 and locking pin
channel 298.
The skirt 302 can be composed of a plastic or latex material, suitable for
preventing fluid
44
CA 02711643 2010-07-07
WO 2009/089344 PCT/US2009/030435
from reaching the channel or bundle. The skirt 302 may be lubricated with any
type of
lubricant desired before being attached to the removable sheath member 298
and/or prior
to endoscopic application. Prior to deployment, the skirt 302 may be coiled or
otherwise
collapsed to allow for facile manipulation of the locking pin 296 within the
locking pin
channel 298, as illustrated in Figure 27. Upon attachment of the removable
sheath
member 288 to the probe tip 250, the sterile skirt 302 can be deployed by
rolling it down
the removable sheath member 288 toward the proximal end. Figure 28 shows the
deployment of the sterile skirt 302, wherein the skirt provides a protective
outer covering
304 of the probe tip 250 and/or the fiber probe 45. The skirt 302 may also
contains a rib
306 to maintain its deployment such that the rib 306 extends beyond the
diameter of the
fiber probe 45. In this manner, the skirt 302 can fill any accessory channel
of an
endoscope to prevent contaminants from reaching the fiber probe 45.
[00163] Figure 29 illustrates an alternative embodiment of the probe tip 250
of Figures
27 and 28, but with additional components to assist in the abutment of the
optical window
294 to the tissue to maintain the distance between the tissue and the lens
282, and the
stability between the optical window 294 and the tissue. As previously
discussed, it may
be important to ensure the abutment of the optical window 294 to the tissue to
properly
receive reflected light for analysis. In this regard, a suction device 308,
such as a suction
cup, may also be provided on the distal end of the removable sheath member 288
to
provide suction between the tissue and the optical window 294 to assist in
abutment. The
suction device 308 may be useful in maintaining sufficient and stable contact
between the
optical window 294 and the tissue. The suction device 308 may comprise a
circumference-shaped material 310 that is attached to the distal end of the
removable
sheath member 288 and surrounds the optical window 294 so that reflected light
is not
obstructed. This material 310 may be any flexible material that can create a
suction when
pressed against a tissue surface. To provide further suction assistance, an
external
vacuum generator 312 may be employed and coupled to a vacuum or suction
channel 314
located inside probe tip 250. The vacuum generated by the vacuum generator 312
may
partially or fully assist in suction. A vacuum sensor or pressure transducer
316 may also
be located within or coupled to the channel 314 to allow the detection of the
pressure or
vacuum at the optical window 294 to determine if proper suction is being
obtained
CA 02711643 2010-07-07
WO 2009/089344 PCT/US2009/030435
between the tissue and the optical window 294 for proper endoscope
examination. The
vacuum or suction channel 314 may also be used as a tissue wash if coupled to
an
external wash. Grasping forceps 318 may also be provided that are controllable
by the
person applying the probe tip 250 endoscopically to grasp the tissue to be
examined to
assist in the abutment of the tissue against the optical window 294.
[00164] The remainder of the present application provides additional
embodiments of
real-time f/a/LCI systems that may be employed in the same or concomitant
procedures
described above. A Fourier domain optical biopsy system is possible that is
not angle-
resolved. These systems are referred to as fLCI systems. One exemplary
embodiment
of a fLCI system 320 is shown in Figure 30. In this regard, white light from a
Tungsten
light source 400 (e.g., 6.5 W, Ocean OpticsTM) is coupled into a multimode
fiber 401
(e.g., 200 gm core diameter). The output of the fiber 401 is collimated by an
achromatic
lens 402 to produce a beam 404 (e.g., a pencil beam 5 mm in diameter). The
beam 404 is
then forwarded to the fLCI system 320.
[00165] This illumination scheme achieves Kohler illumination in that the
fiber acts as
a field stop, resulting in the proper alignment of incident or illuminating
light and thereby
achieving critical illumination of the sample. In the fLCI system 320, the
white light
beam is split by the beamsplitter 406 (BS) into a reference beam 405 and an
input beam
407 to the sample 408. The light scattered by the sample 408 is recombined at
the BS
406 with light reflected by the reference mirror 414 (1V1).
[00166] The reference beam 405 in conjunction with the reference mirror 414
forms a
portion of a reference arm that receives a first reference light and outputs a
second
reference light. The input.beam 407 and the sample 408 form a portion of a
sample arm
that receives a first sample light and outputs a second sample light.
[00167] Those skilled in the art will appreciate that the light beam can be
split into a
plurality of reference beams and input beams (e.g., N reference beams and N
input
beams) without departing from the spirit and scope of the present invention.
Further, the
splitting of the beams may be accomplished with a beamsplitter or a fiber
splitter in the
case of an optical fiber implementation of and exemplary embodiment of the
present
invention.
46
CA 02711643 2010-07-07
WO 2009/089344 PCT/US2009/030435
[00168] In the exemplary embodiment of the present invention shown in Figure
30, the
combined beam is coupled into a multimode fiber 413 by an aspheric lens 410.
Again,
other coupling mechanisms or lens types and configurations may be used without
departing from the spirit and scope of the present invention. The output of
the fiber
coincides with the input slit of a miniature spectrograph 412 (e.g., USB2000,
Ocean
OpticsTM), where the light is spectrally dispersed and detected.
[00169] The detected signal is linearly related to the intensity as a function
of
wavelength I(?), which can be related to the signal and reference fields (E,s,
E,.) as:
(,(A)) = (IES (2)I2) + (IEr (2)12) + 2 Re(E5 (2)E*r (A)) cos 0 (8)
where 0 is the phase difference between the two fields and <...> denotes an
ensemble
average.
[00170] The interference term is extracted by measuring the intensity of the
signal and
reference beams independently and subtracting them from the total intensity.
[00171] The axial spatial cross-correlation function, I'sR(z) between the
sample and
reference fields is obtained by resealing the wavelength spectrum into a
wavenumber
(1--2rr/?) spectrum then Fourier transforming:
1 SR (z) = f dke'kz (ES (k)E*r (k)) cos 0 (9)
This term is labeled as an axial spatial cross-correlation as it is related to
the temporal or
longitudinal coherence of the two fields.
[00172] Another exemplary embodiment of an ILCI scheme is shown in Figure 31.-
In
this exemplary embodiment, fiber optic cable is used to connect the various
components.
Those skilled in the art will appreciate that other optical coupling
mechanisms, or
combinations thereof, may be used to connect the components without departing
from the
spirit and scope of the present invention.
[00173] In Figure 31, white light from a Tungsten light source 420 is coupled
into a
multimode fiber 422 and the white light beam in the multimode fiber is split
by the fiber
splitter (FS) 424 into a reference fiber 425 and a sample fiber 427 to the
sample 430. The
fiber splitter 424 is used to split light from one optical fiber source into
multiple sources.
47
CA 02711643 2010-07-07
WO 2009/089344 PCT/US2009/030435
[00174] The reference light in reference fiber 425, in conjunction with a lens
426
(preferably an aspheric lens) and the reference mirror 428, forms a portion of
a reference
arm that receives a first reference light and outputs a second reference
light. Specifically,
reference light in reference fiber 425 is directed to the reference mirror 428
by lens 426,
and the reference light reflected by the reference mirror 428 (second
reference light) is
coupled back into the reference fiber 425 with lens 426. The sample light in
sample fiber
427 and the sample 430 form a portion of a sample arm that receives a first
sample light
and outputs a second sample light. Specifically, sample light in sample fiber
427 is
directed to the sample 430 by lens 434 (preferably as aspheric lens), and at
least a portion
of the sample light scattered by the sample 430 is coupled into the sample
fiber 427 by
lens 431. In the exemplary embodiment shown in Figure 31, the sample 430 is
preferably
spaced from lens 431 by a distance approximately equal to the focal length of
lens 431.
[00175] At least a portion of the reflected reference light in reference fiber
425 and at
least a portion of the scattered sample light on sample fiber 427 are coupled
into a
detector fiber 433 by the FS 424. The output of detector fiber 433 coincides
with the
input of a miniature spectrograph 432, where the light is spectrally dispersed
and
detected.
[00176] Figures 32A and 32B illustrate some of the properties of a white light
source.
Figure 32A illustrates an autocorrelation function showing a coherence length
(1c=1.2
m). Figure 32A shows the cross-correlation between the signal and reference
fields
when the sample is a mirror, and this mirror is identical to the reference
mirror (M). In
this exemplary scenario, the fields are identical and the autocorrelation is
given by the
transform of the incident field spectrum, modeled as a Gaussian spectrum with
center
wavenumber ko=10.3 m 1 and 1/e width Okl1e 2.04 pm -1 (Figure 32B).
[00177] Figure 32B shows an exemplary spectrum of light source that can be
used in
accordance with the present invention.
[00178] From this autocorrelation, the coherence length of the field, lc=1.21
m is
determined. This is slightly larger than the calculated width of l
2/OkliC=0.98 m, with
any discrepancy most likely attributed to uncompensated dispersion effects.
Note that
rescaling the field into wavenumber space is a nonlinear process which can
skew the
spectrum if not properly executed.
48
CA 02711643 2010-07-07
WO 2009/089344 PCT/US2009/030435
[00179] In data processing, a fitting algorithm is applied (e.g., a cubic
spline fit) to the
rescaled wavenumber spectrum and then resampled (e.g., resample with even
spacing).
The resampled spectrum is then Fourier transformed to yield the spatial
correlation of the
sample. Those skilled in the art will appreciate that other frequency-based
algorithms or
combinations of algorithms can be used in place of the Fourier transform to
yield spatial
correlation. One example of a software tool that can be used to accomplish
this
processing in real time or near real time is to use LabViewTM software.
[00180] In one exemplary embodiment of the present invention, the sample
consists of
a glass coverslip (e.g., thickness, d-200 m) with polystyrene beads which
have been
dried from suspension onto the back surface (1.55 pm mean diameter, 3%
variance).
Thus, the field scattered by the sample can be expressed as:
E3 (k) = Efranl (k)(e kaz + Eback (k)(eik"z+nd) (10)
[00181] In Equation 10, Efront and Eback denote the field scattered by the
front and back
surfaces of the coverslip, and Sz is the difference between the path length of
the reference
beam and that of the light reflected from the front surface and n the index of
refraction of
the glass. The effect of the microspheres will appear in the Eback term as the
beads are
small and attached closely to the back surface. Upon substituting Equation 10
into
Equation 9, a two peak distribution with the width of the peaks given by the
coherence
length of the source is obtained.
[00182] In order to obtain spectroscopic information, a Gaussian window is
applied to
the interference term before performing the Fourier transform operation. Those
skilled in
the art will appreciate that other probabilistic windowing methodologies may
be applied
without departing from the spirit and scope of the invention. This makes it
possible to
recover spectral information about light scattered at a particular depth.
[00183] The windowed interference term takes the form:
(Es(k)E`r(k))exp[ ((k_k,v)IOk,v)2]. (11)
49
CA 02711643 2010-07-07
WO 2009/089344 PCT/US2009/030435
[00184] The proper sizing of a windowed interference term can facilitate the
processing operation. For example, by selecting a relatively narrow window
(Akw small)
compared to the features of E, and Ek, we effectively obtain <Es(kw)E*r(kw)>.
In
processing the data below, we use Akw 0.12 m"1 which degrades the coherence
length
by a factor of 16.7. This exemplary window setting enables the scattering at
50 different
wavenumbers over the 6 m"1 span of usable spectrum.
[00185] In Figures 33A and 33B, an axial spatial cross-correlation function
for a
coverslip sample is shown according to one embodiment of the invention.
Figures 33A
and 33B show the depth-resolved cross-correlation reflection profiles of the
coverslip
sample before and after the processing operations. In Figure 33A, a high
resolution scan
with arrows indicating a peak corresponding to each glass surface is shown. In
Figure
33B, a low resolution scan obtained from the scan in Figure 33A is shown by
using a
Gaussian window.
[00186] Note that the correlation function is symmetric about z=0, resulting
in a
superposed mirror image of the scan. Since these are represented as cross-
correlation
functions, the plots are symmetric about z=0. Thus, the front surface
reflection for z>0 is
paired with the back surface reflection for z<0, and vice versa.
[00187] In Figure 33A, the reflection from the coverslip introduces dispersion
relative
to the reflection from the reference arm, generating multiple peaks in the
reflection
profile. When the spectroscopic window is applied, only a single peak is seen
for each
surface, however several dropouts appear due to aliasing of the signal.
[00188] To obtain the spectrum of the scattered light, we repeatedly apply the
Gaussian window and increase the center wavenumber by 0.12 PM -1 between
successive
applications. As mentioned above, Akw 0.12 pin-' is used to degrade the
coherence
length by a factor of 16.7. This results in the generation of a spectroscopic
depth-
resolved reflection profile.
[00189] Figures 34A and 34B show the spectrum obtained for light scattered
from the
front (a) and back (b) surfaces of a coverglass sample respectively, when no
microspheres
are present. The reflection from the front surface appears as a slightly
modulated version
of the source spectrum. The spectrum of the reflection from the rear surface
however has
CA 02711643 2010-07-07
WO 2009/089344 PCT/US2009/030435
been significantly modified. Thus in Equation 10, we now take Efror,t(k)=E5(k)
and
Eback(k)=T(k)Es(k), where T(k) represents the transmission through the
coverslip.
[00190] In Figures 35A and 35B, illustrate the spectra for light scattering
obtained for
front (a) and back (b) surfaces of a coverglass sample when microspheres are
present on
the back surface of the coverslip. It can be seen that the reflected spectrum
from the
front surface has not changed significantly, as expected. However, the
spectrum for the
back surface is now modulated. The scattering properties S(k) of the
microspheres can
be examined by writing the scattered field as Espheres(k)=S(k)T(k)Es(k) and
taking the
ratio Espheres(k)/Eback(k)=S(k), which is shown as a solid line in Figure 36A.
It can be seen
from this ratio that the microspheres induce a periodic modulation of the
spectrum.
[00191] In Figure 36A, a ratio of the spectra found in Figures 34A-35B is
shown. This
illustrates the scattering efficiency of spheres for front (represented by the
dashed line)
and back (represented by the solid line) surface reflections. In Figure 36B, a
correlation
function obtained from ratio of back surface reflections is shown. The peak
occurs at the
round trip optical path through individual microspheres, permitting the size
of the spheres
to be determined with sub-wavelength accuracy.
[00192] For comparison, the same ratio for the front surface reflections
(dashed line in
Figure 35A) shows only a small linear variation. Taking the Fourier transform
of S(k)
yields a clear correlation peak (Figure 36B), at a physical distance of z=5.24
gm. This
can be related to the optical path length through the sphere by z=2 nl with
the index of the
microspheres n=1.59. The diameter of the microspheres to be 1=1.65 m+/-0.33
m, with
the uncertainty given by the correlation pixel size. Thus with fLCI, we are
able to
determine the size of the microspheres with sub-wavelength accuracy, even
exceeding the
resolution achievable with this white light source and related art LCI
imaging.
[00193] There are many applications of the various exemplary embodiments of
the
present invention. One exemplary application of fLCI is in determining the
size of cell
organelles, in particular the cell nucleus, in epithelial tissues. In
biological media, for
example, the relative refractive indices are lower for organelles compared to
microspheres and thus, smaller scattering signals are expected. The use of a
higher
power light source will permit the smaller signals to be detected. Other
examples include
detection of sub-surface defects in manufactured parts, including fabricated
integrated
51
CA 02711643 2010-07-07
WO 2009/089344 PCT/US2009/030435
circuits, detection of airborne aerosols, such as nerve agents or biotoxins,
and detection of
exposure to such aerosols by examining epithelial tissues within the
respiratory tract.
[00194] Additionally, the larger the size of the nucleus (compared to the
microspheres
in this experiment), the higher the frequency modulation of the spectrum.
Those skilled
in the art will appreciate that higher frequency oscillations are detected at
a lower
efficiency in Fourier transform biopsy techniques. Therefore, in order to
detect these
higher frequency oscillations, a higher resolution spectrograph is used.
[00195] Figure 37 illustrates a generalized embodiment of the fLCI system
shown in
Figure 30 and discussed in greater detail above. In Figure 37, a light source
500 (e.g., a
multi-wavelength light) is coupled into an fLCI system 502. Within the fLCI
system 502,
a sample portion 504 and a reference portion 506 are located. The sample
portion 504
includes a light beam and light scattered from a sample. For example, the
sample portion
504 may include a sample holder, a free space optical arm, or an optical
fiber. The
reference portion 506 includes a light beam and light that is reflected from a
reference.
For example, the reference portion 506 may include an optical mirror. A cross-
correlator
508 receives and cross-correlates light from the sample with light from the
reference.
[00196] Figure 38 illustrates another exemplary embodiment of the present
invention.
In Figure 38, a method is disclosed where a first reference light is received
(block 600)
and a second reference light is output 502. A first sample light is received
(block 604)
and a second sample light is output (block 606). The second sample light
contains light
scattered from a sample when at least a portion of the first sample light is
scattered from
a sample. The second reference light with the second sample light are received
and
cross-correlated (block 608).
[00197] Figure 39 illustrates another exemplary embodiment of the present
invention.
In Figure 39, a method is disclosed where light is received (block 700 from a
sample that
has been illuminated. At least a portion of the light is split into reference
light and
sample light (block 702). At least aportion of said reference light is
reflected from a
reference surface to yield reflected reference light (block 704). At least a
portion of the
sample light is scattered from a sample to yield scattered sample light (block
706). The
scattered sample light and the reflected reference light are mixed (block
708). Spectral
information is recovered about the scattered sample light (block 710).
52
CA 02711643 2010-07-07
WO 2009/089344 PCT/US2009/030435
[00198] Embodiments disclosed herein also involve new low-coherence
interferometry
(LCI) techniques which enable acquisition of structural and depth information
regarding
a sample of interest at rapid rates. A sample can be tissue or any other
cellular-based
structure. The acquisition rate is sufficiently rapid to make in vivo
applications feasible.
Measuring cellular morphology in tissues and in vivo as well as diagnosing
intraepithelial
neoplasia and assessing the efficacy of chemopreventive and chemotherapeutic
agents are
possible applications. Prospectively grading tissue samples without tissue
processing is
also possible, demonstrating the potential of the technique as a biomedical
diagnostic.
[00199] In one embodiment, a "swept-source" (SS) light source is used in LCI
to
obtain structural and depth information about a sample. The swept-source light
source is
used to generate a reference signal and a signal directed towards a sample.
Light
scattered from the sample is returned as a result and mixed with the reference
signal to
achieve interference and thus provide structural and depth-resolved
information regarding
the sample. With a "swept-source" light source, the light source is controlled
or varied to
sweep the center wavelength of a narrow band of emitted light over a given
range of
wavelengths, thus synthesizing a broad band source. Because the light is
emitted in
particular wavelengths or narrower ranges of wavelengths during emission,
scattered
light returned from the sample is known to be in response to a particular
wavelength or
range of wavelengths. Thus, the returned scattered light is spectrally-
resolved and depth-
resolved, because the returned light is in response to the light source
emitted light over a
narrow spectral range. This is opposed to a wider or light source that
generates all
wavelengths of light in one light emission in time, wherein the returned
scattered light
from the sample contains scattered light at a broad range of wavelengths. In
this
instance, a spectrometer is used to spectrally-resolve the returned scattered
light.
However, when using a swept-source light source, the series of returned
scattered lights
from the sample at each wavelength are already in the spectral domain to
provide
spectrally-resolved information about the sample. The spectrally-resolved
information
about the sample can be detected.
[00200] Another embodiment involves using a swept-source light source in angle-
resolved low-coherence interferometry (a/LCI), referred to herein as "swept-
source
Fourier domain a/LCI," or "SS a/LCI." The data acquisition time for SS a/LCI
can be
53
CA 02711643 2010-07-07
WO 2009/089344 PCT/US2009/030435
less than one second, a threshold which is desirable for acquiring data from
in vivo
tissues. The swept-source light source is employed to generate a reference
signal and a
signal directed towards a sample over the swept range of wavelengths or ranges
of
wavelengths. The light is either directed to strike the sample at an angle, or
the light
source or another component in the system (e.g., a lens) is moved to direct
light onto the
sample at an angle or plurality of angles (i.e., two or more angles), which
may include a
multitude of angles (i.e., more than two angles). This causes a set of
scattered light to be
returned from the sample at a plurality of angles, thereby representing
spectrally-resolved
and angle-resolved (also referred to herein as "spectral and angle-resolved")
scattered
information about the sample from a plurality of points on the sample. The
spectral and
angle-resolved scattered information about the sample can be detected. This SS
a/LCI
embodiment can also use the Fourier domain concept to acquire depth-resolved
information. It has recently been shown that improvements in signal-to-noise
ratio, and
commensurate reductions in data acquisition time are possible by recording the
depth
scan in the Fourier (or spectral) domain. In this embodiment, the SS a/LCI
system can
combine the Fourier domain concept with the use of a swept-source light
source, such as
a swept-source laser, and a detector, such as a line scan array or camera, to
record the
angular distribution of returned scattered light from the sample in parallel
and the
frequency distribution in time.
[00201] Figures 40 and 41 illustrate an example of an SS a/LCI system 1010
according
to one embodiment of the invention. The SS a/LCI apparatus and system in
Figure 40
may be based on a modified Mach-Zehnder interferometer. The discussion of the
SS
a/LCI system 1010 in Figures 40 and 41 will be discussed in conjunction with
the steps
performed in the system 1010 provided in the flowchart of Figure 42. As
illustrated in
Figure 40, light 1011 from a swept-source light source 1012 in the form of a
swept-
source laser 1012 is generated. The light from the swept-source light source
1012 is
received (block 60, Figure 42) split into a reference beam 1014 and an input
beam 1016
to a sample 1017 by beam splitter (BS1) 1018 (block 62, Figure 42). The path
length of
the reference beam 1014 is set by adjusting retroreflector (RR) 1020, but
remains fixed
during measurement. The reference beam 1014 is expanded using lenses (L1) 1022
and
(L2) 1024 (block 64, Figure 42) to create illumination which is uniform and
collimated
54
CA 02711643 2010-07-07
WO 2009/089344 PCT/US2009/030435
upon reaching a detector device 1026, which may be a line scan array or camera
as
examples.
[00202] Lenses (L3) 1028 and (L4) 1030 are arranged to produce a collimated
pencil
beam 1032 incident on the sample 1017 (block 66, Figure 42). By displacing
lens (L4)
1030 vertically relative to lens (L3) 1028, the input beam 1032 is made to
strike the
sample 1017 at an angle relative to the optical axis. In this embodiment, the
input beam
1032 strikes the sample 1017 at an angle of approximately 0.10 radians;
however, the
invention is not limited to any particular angle. This arrangement allows the
full angular
aperture of lens (L4) 1030 to be used to collect returned scattered light 1034
from the
sample 1017.
[00203] The light scattered by the sample 1017 is collected by lens (L4) 1030
(block
1068, Figure 42) and relayed by a 4f imaging system, via lenses (L5) 1036 and
(L6)
1038, such that the Fourier plane of lens (L4) 1030 is reproduced in phase and
amplitude
at a slit 1040, as illustrated in Figure 41 (block 1070, Figure 42). The
scattered light
1034 is mixed with the reference beam 1014 at beam splitter (BS2) 1042 with
combined
beams 1044 falling upon the detector device 1026. The combined beams 1044 are
processed to recover depth-resolved spatial cross-correlated information about
the sample
1017 (block 1072, Figure 42).
[00204] In this embodiment, the detector device 1026 is a one-dimensional
detection
device in the form of a line scan array, which is comprised of a plurality of
detectors.
This allows the detector device 1026 to receive light at the plurality of
scatterer angles
from the sample 1017 and mixed with the reference beam 1014 at the same time
or
essentially the same time to receive spectral information about the sample
1017.
Providing the line scan array 1026 allows detection of the angular
distribution of the
combined beams 1044, or said another way, at multiple scatter angles. Each
detector in
the detector device 1026 receives scattered light from the sample 1017 at a
given angle at
the same time or essentially the same time.
[00205] Because the emitted light from the swept-source light source 1012 is
broken
up into particular wavelengths or narrower ranges of wavelengths during
emission,
returned scattered light 1034 from the sample 1017 is known to be in response
to a
particular wavelength or range of wavelengths. Thus, the returned scattered
light 1034 is
CA 02711643 2010-07-07
WO 2009/089344 PCT/US2009/030435
spectrally-resolved, because the returned scattered light 1034 is in response
to the light
source emitted light over a spectral domain. This is opposed to a wider or
broadband
light source that generates all wavelengths of light in one light emission at
the same time,
wherein the returned scattered light from the sample contains scattered light
at all
wavelengths. In this instance, a spectrometer is used to spectrally-resolve
the returned
scattered light. However, when using the swept-source light source 1012, the
series of
returned scattered light 1034 from the sample 1017 at each wavelength is
already in the
spectral domain to provide spectrally-resolved information about the sample.
[00206] Figure 41 illustrates an example of the distribution of scattering
angles across
the dimension of the front of a line scan array 1026. The combined beams or
detected
signal 1044 detected by the detector device 1026 is a function of vertical
position on the
line scan array, y, and wavelength, X, which is a function of time as the
swept-source light
source 1012 is swept across its wavelength range. The detected signal 1044 at
pixel in
and time t can be related to the scattered light 1034 and reference beam 1014
(E,s, E,) as:
I(2m,Yn)=(IEr(A.,Yn~2)+(IES(A.,Yn12) +2Re(Es(A.,Yn)Er(Am,Yn)) cos0 (12)
where (D is the phase difference between the two fields and ( "') denotes an
ensemble
average in time. The interference term is extracted by measuring the intensity
of the
scattered light 1034 and reference beam 1014 independently and subtracting
them from
the total intensity. In one method of obtaining depth-resolved information
about the
sample 1017, the wavelength spectrum at each scattering angle is interpolated
into a
wavenumber (k = 2 it / ?) spectrum and Fourier transformed to give a spatial
cross
correlation, rSR (Z) for each vertical pixel y,,:
rsn (Z, Yf )= f dk eta (E, (k, yn )Er (k, Yn )> cos Q (13)
The reference field takes the form:
Er(k)=E0exp[ ((k-ko)/Ak)2]exp[-((y-yo)/Ay)2]exp[ik01] (14)
56
CA 02711643 2010-07-07
WO 2009/089344 PCT/US2009/030435
where k, (yo and Ak (Ay) represent the center and width of the Gaussian
wavevector
(spatial) distribution and Al is the selected path length difference. The
scattered sample
field takes the form:
ES(k,8)_ JjEa exp[ ((k-k0)/4k)2]exp[ikl1]Sj (k, B)
(15)
where SS represents the amplitude distribution of the scattering originating
from the jth
interface, located at depth li. The angular distribution of the scattered
sample field is
converted into a position distribution in the Fourier image plane of lens (L4)
1030
through the relationship y =f4 B. For the exemplary pixel size of the line
scan array 1026
of eight (8) to twelve (12) micrometers ( m), this yields an angular
resolution of 0.00028
to 0.00034 mradians and an expected angular range of 286 to 430 mradians for a
1024
element array. Inserting Equations (14) and (15) into Equation (13) and noting
the
uniformity of the reference field (Ay >> camera height) yields the spatial
cross
correlation at the nth vertical position on the detector:
rsn(z,Yf)=I fd1CEol2exp[- 2((k-ko)/Ak)2]exp{ik(z-Al+ll)]xSj(k,Bõ =y/f4)coso
(16)
i
Evaluating this equation for a single interface yields:
r1(z,Yõ)=IEo12exp[ ((z-Al+1j)Ak)2/8]Sj(ko,0. =yn/.f4)cos0 (17)
Here, it is assumed that the scattering amplitude S does not vary appreciably
over the
bandwidth of the source. This expression shows obtaining a depth-resolved
profile of the
scattering distribution with each vertical pixel corresponding to a scattering
angle. The
techniques described in U.S. Patent Application Serial No. 11/548,468 entitled
"Systems
and Methods for Endoscopic Angle-Resolved Low Coherence Interferometry," which
is
incorporated herein by reference in its entirety, may be used for obtaining
structural and
depth-resolved information regarding scattered light from a sample.
57
CA 02711643 2010-07-07
WO 2009/089344 PCT/US2009/030435
[00207] To obtain the same or similar data set as is obtained from a single
frame
capture from an imaging spectrometer using a broadband light source, the SS
a/LCI
apparatus and system 1010 can capture a series of data acquisitions from the
line scan
array 1026 at each wavelength and combine them. In this embodiment, the data
acquisition rate of the line scan arrays 1026 is less than the sweep rate of
the swept-
source light source 1012. If one were to assume that 1000 wavelength
(frequency) points
are needed (and thus points in time for the swept-source), ten (10) to twenty
(20) data
acquisitions of scattered information from the sample 1017 may be recovered
per second
using a line scan array. For example, this scenario could yield a time per
acquisition of
50 to 100 milliseconds, which is satisfactory for clinical and commercial
viability.
[00208] Line scan arrays and camera detector devices are widely available for
both the
visible and the near infrared wavelengths. Visible line scan arrays can
operate from
approximately -400 nm to - 900 nm, for example, and may be based on silicon
technology. Near infrared line scan arrays may operate from approximately -
900 nm to
1700 nm or further. Table 2 below gives some typical specifications from
several
manufacturers as examples.
Table 2: Examples of Line Scan Arrays
Manufacturer a, range (nm) Pixel number Pixel size ( m) Readout rate
(1000 lines/second
Atmel 400 - 950 512-4096 7-14 14 to 100
Hamamatsu 400 - 950 128 - 1024 25 - 50 2 to 20
Fairchild 400 - 850 2048 7 38
Imaging
Hamamatsu 900 - 1550 256 - 512 25 - 50 1 to 10
Sensors Unlimited 900 - 1700 128 - 1024 25 - 50 4 to 20
[00209] As previously discussed above, a swept-source laser may be employed as
the
swept-source light source 1012. Some examples are provided in Table 3 below.
Table 3: Examples of Swept-source Light Sources (Swept-source Lasers)
Manufacturer Center X nm 0X nm Sweep rate Power (mW)
(1000 sweeps/seennd)
58
CA 02711643 2010-07-07
WO 2009/089344 PCT/US2009/030435
Thorlabs 1325 150 17 12
Micron Optics 1060,1310,1550 50, 110, 150 8 5,20,20
Santec 1310 110 20 3
[00210] Faster acquisition times are possible. Swept-source light sources at
shorter
wavelengths will allow use of a high speed detector 1026, such as silicon
detectors for
example. For example, some Atmel silicon-based cameras can achieve 100,000
lines
per second, potentially allowing 100 data point acquisitions per second or 10
milliseconds per acquisition. Alternately, as another example, the line scan
array 1026
may be based on InGaAs technology and may be faster, reaching readout rates of
50,000
to 100,000 lines per second and thus reducing the acquisition time to 10
milliseconds. It
is expected that the sweep rate, power, wavelength range, and other
performance
characteristics of the swept-source light sources can enable high performance
versions of
the a/LCI apparatuses and systems, including the SS a/LCI apparatus and system
1010 of
Figures 40 and 41.
[00211] In addition to obtaining depth-resolved information about the sample
1017,
the scattering distribution data (i.e., a/LCI data) obtained from the sample
1017 using the
disclosed data acquisition scheme can also be used to make a size
determination of the
nucleus using the Mie theory, as previously discussed. A filtered curve is
determined
using the scattered data. Comparison of the filtered scattering distribution
curve (i.e., a
representation of the scattered data) to the prediction of Mie theory enables
a size
determination to be made.
[00212] In order to fit the scattered data to Mie theory, the a/LCI signals
are processed
to extract the oscillatory component which is characteristic of the nucleus
size. The
smoothed data is fit to a low-order polynomial (2nd order is typically used
but higher
order polynomials, such as 4a' order, may also be used), which is then
subtracted from the
distribution to remove the background trend. The resulting oscillatory
component can
then be compared to a database of theoretical predictions obtained using Mie
theory from
which the slowly varying features were similarly removed for analysis.
[00213] A direct comparison between the filtered a/LCI data and Mie theory
data may
not be possible, as the Chi-squared fitting algorithm tends to match the
background slope
rather than the characteristic oscillations. The calculated theoretical
predictions include a
59
CA 02711643 2010-07-07
WO 2009/089344 PCT/US2009/030435
Gaussian distribution of sizes characterized by a mean diameter (d) and
standard
deviation as well as a distribution of wavelengths to accurately model the
broad
bandwidth source.
[00214] The best fit can be determined by minimizing the Chi-squared between
the
data and Mie theory, yielding a size of 10.2.+/-.1.7 m, in excellent
agreement with the
true size. The measurement error is larger than the variance of the bead size,
most likely
due to the limited range of angles recorded in the measurement.
[00215] As an alternative to processing the a/LCI data and comparing to Mie
theory,
there are several other approaches which could yield diagnostic information.
These
include analyzing the angular data using a Fourier transform to identify
periodic
oscillations characteristic of cell nuclei. The periodic oscillations can be
correlated with
nuclear size and thus will possess diagnostic value. Another approach to
analyzing a/LCI
data is to compare the data to a database of angular scattering distributions
generated with
finite element method (FEM) or T-Matrix calculations. Such calculations offer
superior
analysis as they are not subject to the same limitations as Mie theory. For
example, FEM
or T-Matrix calculations can model non-spherical scatterers and scatterers
with inclusions
while Mie theory can only model homogenous spheres. Other techniques are
described
in U.S. Patent No. 7,102,758 entitled "Fourier Domain Low-Coherence
Interferometry
for Light Scattering Spectroscopy Apparatus and Method," which is incorporated
herein
by reference in its entirety.
[00216] In another embodiment of the invention, an SS a/LCI apparatus and
system
can be provided, including for endoscopic applications, by using optical
fibers to deliver
and collect light from the sample of interest. These alternative embodiments
are
illustrated in Figures 43A and 43B. The fiber optic portion of the system is
nearly
identical, and the system changes consist of a swept-source light source 1012'
in place of
the superluminescent diode, a line scan array (or camera) in place of the
imaging
spectrometer, and modification to the data processing to aggregate multiple
acquisitions
from the line scan array. The angular distribution of the returned scattered
light from the
sample is captured by locating the distal end of a fiber bundle in a conjugate
Fourier
transform plane of the sample using a collecting lens. This angular
distribution is then
conveyed to the distal end of the fiber bundle where it is imaged using a 4f
system onto
CA 02711643 2010-07-07
WO 2009/089344 PCT/US2009/030435
theline scan array. A beam splitter is used to overlap the scattered sample
field with a
reference field prior to the line scan array so that low-coherence
interferometry can also
be used to obtain depth-resolved measurements.
[00217] Turning now to Figure 43A, a fiber optic SS a/LCI system 1010' is
illustrated.
A similar fiber optic SS a/LCI system 1010' is also illustrated in Figure 43B.
The fiber
optic SS a/LCI system 1010' can make use of the Fourier transform properties
of a lens.
This property states that when an object is placed in the front focal plane of
a lens, the
image at the conjugate image plane is the Fourier transform of that object.
The Fourier
transform of a spatial distribution (object or image) is given by the
distribution of spatial
frequencies, which is the representation of the image's information content in
terms of
cycles per mm. In an optical image of elastically scattered light, the
wavelength retains
its fixed, original value and the spatial frequency representation is simply a
scaled version
of the angular distribution of scattered light. In the fiber optic SS a/LCI
system 1010', the
angular distribution of scattered light from the sample is captured by
locating the distal
end of the fiber bundle in a conjugate Fourier transform plane of the sample
using a
collecting lens.
[00218] Turning to Figure 43A, light 1011' from a swept-source light source
1012' is
split into a reference beam 1014' and an input beam 1016' using a fiber
splitter (FS) 1080.
A splitter ratio of 20:1 may be chosen in one embodiment to direct more power
to a
sample (not shown) via a signal arm 1082 as the returned scattered light 1034'
from the
sample is typically only a small fraction of the incident power. Light in the
reference
beam 1014' emerges from fiber (F1) and is collimated by lens (L1) 1084 which
is
mounted on a translation stage 1086 to allow gross alignment of the reference
arm path
length. This path length is not scanned during operation but may be varied
during
alignment. A collimated beam 1088 is arranged to be equal in dimension to the
end 1091
of fiber bundle (F3) 1090 so that the collimated beam 88 illuminates all
fibers in the fiber
bundle (F3) 1090 with equal intensity. The reference beam 1014' emerging from
the
distal tip of the fiber bundle (173) 1090 is collimated with lens (L3) 1092 in
order to
overlap with the scattered sample field conveyed by fiber bundle (F4) 1094
having a fiber
breakout 1095 to capture the returned scattered light form the sample 1017 at
a plurality
61
CA 02711643 2010-07-07
WO 2009/089344 PCT/US2009/030435
of angles at the same time. In an alternative embodiment, light emerging from
fiber (F1)
is collimated then expanded using a lens system to produce a broad beam.
[00219] The scattered sample field is detected using a coherent fiber bundle.
The
scattered sample field is generated using light in the signal arm 1082 which
is directed
toward the sample of interest using lens (L2) 1098. As with the free space
system, lens
(L2) 1098 is displaced laterally from the center of single-mode fiber (172)
such that a
collimated beam is produced which is traveling at an angle relative to the
optical axis.
The fact that the incident beam strikes the sample at an oblique angle is
essential in
separating the elastic scattering information from specular reflections. The
scattered light
1034' is collected by a fiber bundle consisting of an array of coherent single
mode or
multi-mode fibers. The distal tip of the fiber is maintained one focal length
away from
lens (L2) 1098 to image the angular distribution of scattered light. In the
embodiment
shown in Figure 43B, the sample is located in the front focal plane of lens
(L2) 1098
using a mechanical mount 1100. In the endoscope compatible probe 1093 shown in
Figure 43A, the sample is located in the front focal plane of lens (L2) 1098
using a
transparent sheath 1102.
[00220] As illustrated in Figure 43A, scattered light 1104 emerging from a
proximal
end 1105 of the fiber bundle (F4) 1094 is recollimated by lens (L4) 1107 and
overlapped
with the reference beam 1014' using beam splitter (BS) 1108. The two combined
beams
1110 are re-imaged onto the line scan array 1026' using lens (L5) 1112. The
focal length
of lens (L5) 1112 may be varied to optimally fill the line scan array 1026'.
The line scan
array 1026' passes the detected signal to a processing system, such as a
computer 1111,
to process the returned scattered signal to determine. structural and depth-
resolved
information about the sample. The resulting optical signal contains
information on each
scattering angle across the vertical dimension of the slit 1040' as described
above for the
apparatus of Figures 40 and 41. It is expected that the above-described SS
a/LCI system
1012', as an example, the fiber optic probe can collect the angular
distribution over a 0.45
radian range (approximately 30 degrees) and can acquire the complete depth-
resolved
scattering distribution or combined beams 1110 in a fraction of a second.
[00221] There are several possible schemes for creating the fiber probe which
are the
same from an optical engineering point of view. One possible implementation
would be
62
CA 02711643 2010-07-07
WO 2009/089344 PCT/US2009/030435
a linear array of single mode fibers in both the signal and reference arms.
Alternatively, a
reference arm 1096 could be composed of an individual single mode fiber with
the signal
arm 1082 consisting of either a coherent fiber bundle or linear fiber array.
[00222] The probe 1093 can also have several implementations which are
substantially
equivalent. These would include the use of a drum or ball lens in place of
lens (L2) 1098.
A side-viewing probe could be created using a combination of a lens and a
mirror or
prism or through the use of a convex mirror to replace the lens-mirror
combination.
Finally, the entire probe can be made to rotate radially in order to provide a
circumferential scan of the probed area.
[00223] Another exemplary embodiment of a fiber optic SS a/LCI system is the
illustrated a/LCI system 1010" in Figure 43B. In this system 1010", a swept-
source
light source 1012" is used just as in the fiber-optic a/LCI system 1010' of
Figure 43A.
Other components provided in the system 1010" of Figure 43B are also included
in the
system 1010' of Figure 43A, which are indicated with common element
designations. In
the fiber optic SS a/LCI system 1010", the angular distribution of scattered
light from the
sample is captured by locating the distal end of the fiber bundle in a
conjugate Fourier
transform plane of the sample using a collecting lens. This angular
distribution is then
conveyed to the distal end of the fiber bundle where it is imaged using a 4f
system onto
the line scan array. A beam splitter is used to overlap the scattered sample
field with a
reference field prior to the line scan array so that low-coherence
interferometry can also
be used to obtain depth resolved measurements.
[00224] As illustrated in Figure 43B, light 1011" is generated by a swept-
source light
source 1012". An optical isolator. 1113 protects the light source 1012" from
back
reflections. The fiber splitter 1080 generates a reference beam 1014" and a
sample beam
1016". The reference beam 1014" passes through an optional polarization
controller
1114, a length of fiber 1117 (to path optical path lengths), and then to the
lens (L4) 1107
to the beam splitter 1108. The sample beam 1016" travels through a
polarization
controller 1115 and a fiber polarizer 1116 to improve polarization of source
light and
align polarization with the axis of the fiber polarizer 1116. The delivery or
illumination
fiber 1090 is provided to the fiber probe 1093. The lens 1084 captures
returned scattered
light from the sample 1017, which is collected at a particular angle (or a
small range of
63
CA 02711643 2010-07-07
WO 2009/089344 PCT/US2009/030435
angles) by the collection fiber bundle 1094. Captured light is carried through
the
collection fiber bundle 1094 comprised of a plurality of collection fibers
1095. The
captured light travels back up the fiber probe 1093 through optical lens (L2)
1098 and
lens (L3) 1092. The reference beam 1014" and returned scattered light from the
sample
1017 are mixed at the beam splitter 1108 with the resulting interfering signal
1110 being
passed to a line scan array detector 1026' as previously described. The line
scan array
1026' passes the detected signal to a processing system, such as the computer
1111 ", to
process the return scattered signal to determine structural and depth-resolved
information
about the sample. The resulting optical signal contains information on each
scattering
angle across the vertical dimension of the slit 1040' as described above for
the apparatus
of Figures 40 and 41. It is expected that for one embodiment of the above-
described SS
a/LCI system 1010", as an example, the fiber optic probe 1093 can collect the
angular
distribution over a 0.45 radian range (approximately 30 degrees) and can
acquire the
complete depth-resolved scattering distribution or combined beams 1110 in a
fraction of
a second.
[00225] The use of a swept-source light source also opens up the possibility
of another
system architecture that has the capability to acquire scattering information
from more
than one scattering plane from a sample. This implementation is referred to as
a
"Multiple Angle Swept-source a/LCI" system or MA SS a/LCI. An example of an MA
SS a/LCI system 1010"' is illustrated in Figures 44 and 45, which has a
similar
arrangement to the SS a/LCI system 1010 of Figures 40 and 41, except that a
two-
dimensional detection device 1026" is provided in the form of a CCD camera.
This
allows acquiring returned scatter information from a sample at multiple angles
or range
of angles at the same time or essentially at the same time. This arrangement
allows one
to obtain a larger amount of information with a single measurement compared to
one-
dimensional approaches. In a one-dimensional scheme, the scattering
distribution is
acquired across a single line of angles and requires sample manipulation to
obtain
information in another scattering plane. By acquiring information about the
sample from
multiple angles or a range of angles, it is possible to achieve better signal-
to-noise in the
resulting measurements and/or acquire more information about the sample such
as the
major and minor axis for non-spheriodal scatterers.
64
CA 02711643 2010-07-07
WO 2009/089344 PCT/US2009/030435
[00226] The MA SS a/LCI system 1010"' is exemplified in Figures 44 and 45, and
is
similar to the SS a/LCI of Figures 40 and 41, except that the line scan array
1026 is
replaced by a two-dimensional array 1026", such as a CCD camera. The steps set
forth
in the flowchart of Figure 42 are applicable for this embodiment, except that
this
embodiment will involve the mixed returned scattered light being directed to a
two-
dimensional detector 1026" (block 1070) and detecting dispersed light to
recover
spatially and depth-resolved information about the sample using the two-
dimensional
detector 1026" (block 1072). Further, the MA SS a/LCI system 1010"' can be
implemented using a fiber optic probe and bundle detection system like that of
Figure
43B, except that the line scan array 1026' is replaced by a two-dimensional
detector
1026", namely a CCD camera. In either implementation example, the CCD camera
1026"may acquire a frame at each step as the swept-source light source 1012,
such as a
swept-source laser, is swept (or more likely may capture a frame as the light
source
sweeps continuously resulting in a range of wavelengths captured in each
frame). The
swept-source light source 1012 sweeps over frequencies as the CCD camera 1026"
synchronously captures images from the combined beams 1044 from the sample
1017.
With this method, the acquisition time may decrease to a fraction of a second.
The
collection of frames from a sweep of the swept-source light source 1012 will
then be
processed to generate wavelength information for either a range of scattering
angles in
the 0 and 4 direction, a set of discrete angles, or some combination of the
two. Further
processing will provide information about the nature of the scatterers in the
sample 1017.
Figure 46 illustrates an exemplary model of a two-dimensional image of a
diffraction
pattern due to eight micron spheroid distribution using the MA SS a/LCI system
of
Figure 44.
[00227] The MA SS a/LCI system 1010"' may also be implemented using a
broadband light source, such as a superluminescent diode (SLD), and using a
spectrometer detection device. In either case, whether using a broadband light
source or
swept-source light source 1012, in the fiber optic embodiment of a MA SS a/LCI
system
1010"', the fiber bundle 1094 that receives the combined beams 1044 from the
sample
1017 can be captured by a plurality of optical fibers 1119 in the fiber bundle
1094, as
illustrated in Figure 47. Here, the optical fiber breakout is issued to bring
optical fibers
CA 02711643 2010-07-07
WO 2009/089344 PCT/US2009/030435
1119 from the fiber bundle 1094 to one or more horizontal lines 1120, 1122,
1124, but
radial and circular breakouts are also possible, which are different types of
sections of the
optical fibers 1119. The number of optical fibers 1119 shown in a vertical row
is one
optical fiber 1119 wide, but any number is possible. The number of optical
fibers 1119
used horizontally at a given position in the vertical column will determine
the angular
range of the particular reading from a detection device 1026"or spectrometer,
as the case
may be.
[00228] One possible distribution of the scattering angles across the CCD
camera
1026" is shown in Figure 48. In this implementation, angles in 0 are spread
vertically
and angles in 4) are spread horizontally. The angles may or may not be
distributed evenly
in 0 and 4). For example, in the endoscopic implementation described later in
this
application, an illumination fiber 1128 lies on one side of a fiber bundle and
the angles
acquired will be determined by the locations of the fibers in the bundle. This
is shown in
Figure 48, where the system 1010"' will be able to collect some subset of the
angles in 0
and 4), but even here there may be enough additional information acquired that
additional
structural measurements can be generated by the data processing.
[00229] Potential components for the CCD camera 1026" include but are not
limited
to a Cascade:PhotometricsTM 650 CCD camera as the image detector. For the
light
source, the Thorlabs INTUNTM continuously tunable laser is an example of one
of many
suitable sources. This example would be useful because the center wavelength
is 780
nm, which is compatible with standard NIR optical elements, including the
Cascade
camera, and offers a tuning range of 15 nm, which is comparable to the line
width used in
SS a/LCI systems previously described. The tuning speed of 30 nm/s for this
source is
optimal for synchronization with the Cascade CCD camera as better than 0.1 nm
resolution can be achieved based on the 300 Hz frame rate which can be
realized when
using a region of interest with the Cascade CCD. The SS a/LCI scheme will
improve
acquisition time and upgrade the a/LCI system to a state-of-the-art technology
for studies
of cell mechanics at faster time scales.
[00230] The data acquisition may be limited by the frame rate of the CCD
camera
1026" and not by the sweep speed of the swept-source light source 1012. Table
4 below
lists exemplary CCD cameras. The fastest listed is only 1000 frames per
second, so if
66
CA 02711643 2010-07-07
WO 2009/089344 PCT/US2009/030435
1000 wavelength points are required, a full scan will take approximately 1
second. It
may be possible to scan faster if fewer pixels are needed in this example, or
if fewer
points in the wavelength can be used. Several of these cameras will let the
user target
specific regions of interest to acquire images, thus speeding up the frame
rate. For
example, with the Atmel camera, if one uses a region of interest that is 100
x 100 pixels
for a total of 10,000 pixels, then the frame rate might be as high as 15,000
frames per
second allowing a scan time of 70 milliseconds for 1000 wavelength points. It
is
expected that the speed of the CCD cameras will increase over time and the
increased
camera speed will translate into higher performance of the MA SS a/LCI system.
Table 4: Examples of High Speed CCD Cameras
Manufacturer a, range (nm) Pixel number Pixel size ( m) Readout rate
(1000 pixels /second)
Atmel 400 - 900 2000 x 1000 5 150000
Hamamatsu 400 - 950 250 x 1024 25 10000
Fairchild 400 - 850 512 x 512 17 Up to 1000 frame/sec
Imaging
[00231] In addition to the SS a/LCI and MA SS a/LCI implementations described
herein, a time-domain a/LCI implementation is also possible. An example of
this a/LCI
system 1130 implementation is shown by example in Figure 49. This system 1130
physically scans the depth of a sample, but uses an array of detectors to
simultaneously
collect returned scattered light from the sample from multiple angles at the
same time or
essentially the same time. This allows the system 1130 to simultaneously
collect light
from multiple angles increasing throughput by a factor equal to the number of
angle
acquisitions.
[00232] The system 1130 uses photodiode arrays #1 and #2 1132, 1134 to collect
angular scattered light from the sample (not shown). The system 1130 provides
a swept-
67
CA 02711643 2010-07-07
WO 2009/089344 PCT/US2009/030435
source light source 1136 in the form of a Ti: Sapphire laser operating in a
pulsed mode in
this embodiment. The swept-source light source 1136 directs light 1138 to a
beam
splitter (BS1) 1140, which splits the light 1138 into a reference signal 1141
and sample
signal 1142. The reference signal 1141 goes through acousto optic modulator
(AOM)
1144 with w+10MHz, and then through retroreflector (RR) 1154 mounted on a
reference
arm 1153, wherein the retroreflector (RR) 1154 is moved by a distance, 6z to
change the
depth in the sample to perform depth scans. The sample signal 1142 goes
through AOM
1146 with frequency `co' and then through imaging optics 1148. Imaging optics
1148
shine collimated light onto the sample and then collects the angular scattered
light from
the sample. The reference signal 1141 and the angular scattered light are
combined at
beamsplitter (BS2) 1152 and then imaged onto the photodiode arrays #1 and #2
1132,
1134. Signals 1135, 1137 from each photodiode 1132 or 1134 are subtracted from
the
photodiode in the other array 1132 or 1134 which corresponds to the same
angular
location. A multi-channel demodulator 1160 is used on a subtracted signal
1139. All
signals then go to a computer 1162 for processing. Processing of the time-
domain depth
information from the subtracted signal 1139 and received by the multi-channel
demodulator 1160 can be performed just as previously described in above for
this
embodiment, as possible examples or methods.
[00233] Figure 50 illustrates the same system 1130 of Figure 49, except that
lens L1
1156 is changed out for lenslet array 1164. Each lenslet in the lenslet array
1164
provides the reference arm 1153 for one angular position. A lenslet array can
be used for
each angular position in the photodiode arrays 1132, 1134 to properly capture
angular
scattered light from the sample.
[00234] Even though the systems 1130 illustrated in Figures 49 and 50 obtain
depth-
resolved information regarding tissue in the time domain, these systems 1130
are still
capable of examining and monitoring tissue during the course of the same or
concomitant
medical procedure to determine if a therapeutic should be applied to the
tissue. For
example, in a typical setup, data about the sample may be acquired at 20 to 60
angles and
takes approximately 6 minutes for a 60 angle scan. However, the implementation
in
Figure 50 should be able to acquire this same data set in at least six (6)
seconds to
feedback information regarding the tissue. While still possibly slower than
Fourier
68
CA 02711643 2010-07-07
WO 2009/089344 PCT/US2009/030435
domain techniques (due to the higher intrinsic signal-to-noise ratio available
in the
Fourier domain systems), this can be an improvement in speed and be used for
many
applications. This implementation calls for photodiode arrays that can acquire
enough
line scans, such that there are up to 500 in a depth scan. If a scan takes six
(6) seconds,
this is approximately 100 per second, which is much less than the line rates
of any of the
cameras listed in Table 1. Given that cameras can capture frames much faster
than this,
the limit to acquisition speed may be the amount of available light scattered
from the
sample.
[00235] Note that this system uses some means of subtracting the signals 1135,
1137
on the photodiodes arrays 1132, 1134 on a photodiode basis and then
demodulating each
channel. This may be accomplished in a serial or parallel fashion. One
implementation
would be to digitally acquire data from the photodiode arrays (as in the case
of a line scan
camera) and then use a digital signal processor (DSP) chip or similar to
subtract and
demodulate the data. This may require that the offset frequency between the
two AOMs
be less than the line rate of the line scan arrays. Since line scan arrays
that receive signal
data up to 100,000 lines/second exist, an offset of <50 KHz may be acceptable.
[00236] A second implementation would be to use the photodiode arrays 1132,
1134
and perform the subtraction in an analog basis. It may be the case that the
two
photodiode arrays are actually two sections of the same two-dimensional array.
There
also may then be a dedicated demodulator for each photodiode pair or, again, a
digitizer
and appropriate digital signal processor (DSP) chips.
[00237] In another embodiment and approach to collecting information about a
sample
of interest, a step forward from time domain a/LCI systems is taken to still
collect the
angular information in a serial fashion. However, depth information is
collected from a
sample of interest using a Fourier domain approach. The light source that may
be used
can include a broadband light source in combination with a spectrometer to
process
spectrally-resolved information about the sample. Alternatively, a swept-
source light
source with a photodiode or another implementation may be used. Figure 51
shows an
implementation of such a system 1170. The system 1170 illustrated employs a
Ti: Sapphire pulsed laser light source 1172 for a broadband light source with
a single line
spectrometer 1186 in place of a photodiode for signal collection. In Figure
51, the laser
69
CA 02711643 2010-07-07
WO 2009/089344 PCT/US2009/030435
1172 in a pulsed mode generates light 1174. Beam splitter (BS1) 1176 splits
the light
1174 into a reference signal 1177 and a sample signal 1179. The reference
signal 1177
travels through optic(s), lens (L1) 1182, while the sample signal 1179 travels
through
imaging optics 1178, which illuminate a sample (not shown) and capture
scattered light
returned from the sample. Lens (L2) 1180 is moved to set the particular angle
of
scattered light from the sample that is being viewed by the spectrometer 1186.
Beamsplitter (BS2) 1184 combines the reference signal 1177 and the sample
signal 1179
which then travels to spectrometer 1186. The combined signal then passes
through
computer 1188 for processing. The spectrometer 1186 captures at least one line
of
returned scattered light from the sample. The spectrometer 1186 could capture
more than
one line (i.e., it could be an imaging spectrometer) to create a system that
is closer to the
current working implementation. This could be advantageous to either use a
spectrometer with fewer lines, or allow capture of a larger angular range (or
finer
resolution).
[00238] Since this system 1170 does not use a time domain data acquisition
approach,
the AOMs 1144, 1146 and the moving retroreflector (RR) 1154 in the reference
arm
1153, as provided in the systems 1130 in Figures 49 and 50, are not needed.
This system
1170 shows one spectrometer 1186, but it is possible to use a second
spectrometer on the
other port of the beam splitter for additional signal for potential increases
in optical
signal-to-noise ratio (OSNR) or advanced processing or other reasons. This
implementation has a significant OSNR advantage, on the order of the number of
pixels
covered by the broadband light source in the spectrometer 1186. As noted, this
system
1170 can also be implemented with a swept-source light source in-place of the
Ti: Sapphire laser, and a single photodiode in place of the spectrometer 1186.
[00239] Figure 52 illustrates another implementation of the Fourier domain
system
1170 of Figure 51, with serial detection of angles, but using a fiber-optic
approach. The
angular information from the sample is collected serially by moving a fiber
(or more than
one fiber) back and forth in front of lens 1171, which collects the returned
angular
scattered light from the sample 1017. The optical engine is almost entirely
fiber-optic in
this particular implementation with the free space optics provided inside a
line
spectrometer 1186'. This implementation is beneficial in terms of cost and
ease of
CA 02711643 2010-07-07
WO 2009/089344 PCT/US2009/030435
construction, since optical fibers are usually cheaper and easily to deal with
than free
space optical systems.
[00240] As illustrated in Figure 52, light 1174' is generated by SLD broadband
light
source 1172'. An optical isolator 1190 protects the light source 1172' from
back
reflections. A fiber splitter 1191 generates a sample signal 1193 and a
reference signal
1192. The reference signal 1192 passes through an optional polarization
controller 1194,
a length of fiber 1195 (to path optical path lengths), and then to a fiber
coupler 1196 (i.e.,
a fiber splitter used in opposite direction). The sample signal 1193 travels
through a
polarization controller 1197 and a fiber polarizer 1198 to improve
polarization of source
light and align polarization with the axis of the fiber polarizer 1198. An
illumination
fiber 1199 is provided to a fiber probe 1200 and passes through lens 1171 to
illuminate
the illumination fiber 1199. Lens 1171 captures returned scattered light from
the sample
1017, which is collected at a particular angle (or at a small range of angles)
by a
collection fiber 1201. The collection fiber 1201 is moved to capture
information from
different angles from the sample 1017. A motion mechanism shown is based on
electromagnets 1202 in this embodiment. Any method to move the collection
fiber 1201
with respect to the sample 1017 can be used. The collection fiber 1201 can be
moved in
one dimension or in multiple dimensions. Light from the collection fiber 1201
travels
back up the fiber probe 1200 and into an optical engine (not shown) where it
connects to
the fiber coupler 1196. The reference signal 1193 and returned scattered light
from the
sample 1017 are mixed at the fiber coupler 1196 with the resulting light
signal passed to
the line spectrometer 1186'. The combined signal then passes through computer
1188 for
processing. Again, this embodiment is illustrated with one collection fiber,
but it could
be implemented with multiple collection fibers that are moved to either reduce
the needed
size of the spectrometer or increase the angular range.
[00241] Another implementation of a/LCI is a multi-spectral a/LCI system.
Embodiments of multi-spectral a/LCI systems 1210, 1210' are illustrated in
Figures 53,
and 54. In this approach, a/LCI measurements are performed at multiple
wavelengths (or
frequencies) that may be separated, such as by a few up to hundreds of
nanometers. The
system 1210 responds like an f/LCI system, where depth information regarding a
sample
of interest is obtained at multiple wavelengths. Multi-spectral a/LCI can
obtain both
71
CA 02711643 2010-07-07
WO 2009/089344 PCT/US2009/030435
depth and angular information at multiple wavelengths. This system 1210 can
thereafter
generate the structural and depth information using techniques that utilize
a/LCI or f/LCI.
Alternatively, the system 1210 can be used to measure tissue responses at a
few
wavelengths to determine properties of blood, water or other characteristics
of the tissue.
[00242] The system 1210 of Figure 53 uses time domain for obtaining depth
information and involves parallel acquisition of angular information and a
tunable source
for multi-spectral information acquisition. The system 1210 uses photodiode
arrays #1
and #2 1211, 1212 to collect angular scattered light from the sample (not
shown). The
system 1210 provides a super-continuum light source 1213 with a tunable filter
1214 that
provides a 10 to 20 nm spectral bandwidth and that can be tuned over a few up
to
hundreds of nanometers in this example. A commercially available example of
this light
source is the SC450-AOTF from Fianium , which combines a fiber-optic super-
continuum light source with an acousto-optic tunable filter. Other source
examples could
include white light sources, such as Xenon lamps as an example. Other filters
may be
used, including but not limited to liquid crystal (LC) optical filters.
[00243] The super-continuum light source 1213 directs light 1212 to a beam
splitter
(BS1) 1215, which splits the light 1216 into a reference signal 1217 and
sample signal
1218. The reference signal 1217 goes through AOM 1221, and then through
retroreflector (RR) 1219 mounted on a reference arm 1220, wherein the
retroreflector
(RR) 1219 is moved by the reference arm 1220 to change the depth in the sample
to
perform depth scans. The sample signal 1218 goes through AOM 1222 with
frequency
`co' and then through imaging optics 1223. Imaging optics 1223 shine light
from the
super-continuum light source 1213 onto a sample and then collects the angular
scattered
light from the sample. The reference signal 1217 and the angular scattered
light are
combined at beamsplitter (BS2) 1224 and then imaged onto the photodiode arrays
#1 and
#2 1211, 1212. Signals 1225, 1226 from each photodiode array 1211 or 1212 are
subtracted from the photodiode in the other array 1211 or 1212 which
corresponds to the
same angular location. A multi-channel demodulator 1228 is used on the
resulting
subtracted signal 1227. The subtracted signal 1227 travels to a computer 1230
for
processing.
72
CA 02711643 2010-07-07
WO 2009/089344 PCT/US2009/030435
[00244] Another approach to the multi-spectral a/LCI system 1210 in Figure 53
is to
use a broadband light source with multiple spectrometers. An example of one
such
system 1210' is illustrated in Figure 54. The system 1210' uses Fourier domain
for
obtaining depth information about a sample, and parallel acquisition of
angular
information and parallel acquisition of multi-spectral information by use of
broadband
filters and multiple spectrometers. The optical engine is almost entirely
fiber-optic in this
particular implementation with the free space optics provided inside imaging
spectrometers 1266, 1268, 1270. This implementation is beneficial in terms of
cost and
ease of construction, since optical fibers are usually cheaper and easily to
deal with than
free space optical systems.
[00245] As illustrated in Figure 54, light 1232 is generated by a SLD
broadband light
source 1234. An optical isolator 1236 protects the light source 1234 from back
reflections. A fiber splitter 1238 generates a sample signal 1240 and a
reference signal
1242. The reference signal 1242 passes through an optional polarization
controller 1244,
a length of fiber 1246 (to path optical path lengths), and then to a lens (L4)
1248 to a
beamsplitter 1250. The sample signal 1240 travels through a polarization
controller 1252
and a fiber polarizer 1254 to improve polarization of source light and align
polarization
with the axis of the fiber polarizer 1254. An illumination fiber 1256 is
provided to a fiber
probe 1258 and passes through lens 1260 to illuminate the illumination fiber
1256. The
lens 1260 captures returned scattered light from the sample 1017, which is
collected at a
particular angle (or a small range of angles) by a collection fiber 1261.
Captured light
carried through the collection fiber 1261 travels back up the fiber probe 1258
through
optical lens (L2) 1262 and lens (L3) 1264. The reference signal 1242 and
returned
scattered light from the sample 1017 are mixed at beamsplitter 1250. Two free
space
optical filters 1263, 1265 split the scattered light spectrum from the sample
into three
light signals, each being provided to a separate imaging spectrometer 1266,
1268, 1270.
This allows the spectrally-resolved scattered light from the sample 1017 to be
processed
by computer 1230' using Fourier domain techniques to obtain structural and
depth
information about the sample.
[00246] It is possible to provide this system 1210' with one spectrometer,
although the
combination of multiple spectrometers allows for high spectral resolution for
the Fourier
73
CA 02711643 2010-07-07
WO 2009/089344 PCT/US2009/030435
domain depth detection and the broad range of wavelengths needed to acquire
the multi-
spectral information. The system 1210' can be expanded to as many sections of
the
optical spectrum as needed. Fiber implementations based on fiber couplers and
fiber
filters are also possible.
[00247] The system 1210' may also be provided with a broadband swept-source
light
source for the acquisition of depth information and the acquisition of multi-
spectral
information. Another approach is to multiplex together multiple sources at
different
wavelengths to obtain the multi-spectral information. For example, an 830 nm
center
wavelength, 20 nm 3 dB width SLD could be multiplexed together with a 650 nm
center
wavelength, 15 nm 3 dB width SLD to obtain a/LCI information at two
wavelengths.
Further, as the various wavelengths become farther apart, it may be necessary
to put in
compensation components to account for the variation in index of refraction at
the
different wavelengths. For example, if one is using a 400 nm and an 800 nm
wavelength,
it may be the case that when the interferometer arms are path length matching
for the 400
nm wavelength, they are mismatched for the 800 nm wavelength by more than the
imaging depth available with the spectrometer (typically 1 to 2 mm).
[00248] The f/a/LCI systems and methods described herein can be clinically
viable
methods for assessing tissue health without the need for tissue extraction via
biopsy or
subsequent histopathological evaluation. The f/a/LCI systems and methods
described
herein can be applied for a number of purposes: for example, early detection
and
screening for dysplastic tissues, disease staging, monitoring of therapeutic
action, and
guiding the clinician to biopsy or surgery sites. The non-invasive, non-
ionizing nature of
the optical biopsy based on an f/a/LCI probe means that it can be applied
frequently
without adverse affect. The potential of f/a/LCI to provide rapid results will
greatly
enhance its widespread applicability for disease screening.
[00249] Nuclear morphology measurement is also possible using the f/a/LCI
systems
and methods described herein. Nuclear morphology is a necessary junction
between a
cell's topographical environment and its gene expression. One application of
the f/a/LCI
systems and methods is to connect topographical cues to stem cell function by
investigating nuclear morphology. In one embodiment, the f/a/LCI systems and
methods
use a swept-source light source approach described herein and create and
implement light
74
CA 02711643 2010-07-07
WO 2009/089344 PCT/US2009/030435
scattering models. The second is to provide nuclear morphology as a function
of
nanotopography. Finally, by connecting nuclear morphology with gene
expression, the
structure-function relationship of stem cells, e.g., human mesenchymal stem
cells
(hMSC), under the influence of nanotopographic cues can be established.
[00250] The f/a/LCI methods, processes, techniques, and systems described
herein can
also be used for cell biology applications and medical treatment basedo n such
applications. Accurate measurements of nuclear deformation, i.e., structural
changes of
the nucleus in response to environmental stimuli, are important for signal
transduction
studies. Traditionally, these measurements require labeling and imaging, and
then
nuclear measurement using image analysis. This approach is time-consuming,
invasive,
and unavoidably perturbs cellular systems. The f/a/LCI techniques described
herein offer
an alternative for probing physical characteristics of living systems. The
f/a/LCI
techniques disclosed herein can be used to quantify nuclear morphology for
early cancer
detection, diagnosis and treatment, as well as for noninvasively measuring
small changes
in nuclear morphology in response to environmental stimuli. With the f/afLCI
methods,
processes, techniques, and systems provided herein, high-throughput
measurements and
probing aspherical nuclei can be accomplished. This is demonstrated for both
cell and
tissue engineering research. Structural changes in cell nuclei or mitochondria
due to
subtle environmental stimuli, including substrate topography and osmotic
pressure, are
profiled rapidly without disrupting the cells or introducing artifacts
associated with
traditional measurements. Accuracy of better than 3% can be obtained over a
range of
nuclear geometries, with the greatest deviations occurring for the more
complex
geometries.
[00251] In one embodiment disclosed herein, the f/a/LCI systems and methods
described herein are used to assess nuclear deformation due to osmotic
pressure. Cells
are seeded at high density in chambered coverglasses and equilibrated with
500, 400 and
330 mOsm saline solution, in that order. Nuclear diameters are measured in
micrometers
to obtain the mean value +/- the standard error within a 95% confidence
interval.
Changes in nuclear size are detected as a function of osmotic pressure,
indicating that the
f/a/LCI systems and methods disclosed herein can be used to detect cellular
changes in
response to factors which affect cell environment. One skilled in the art
would recognize
CA 02711643 2010-07-07
WO 2009/089344 PCT/US2009/030435
that many biochemical and physiological factors can affect cell environment,
including
disease, exposure to therapeutic agents, and environmental stresses.
[00252] To assess nuclear changes in response to nanotopography, cells are
grown on
nanopatterned substrates which create an elongation of the cells along the
axis of the
finely ruled pattern. The f/a/LCI systems and processes disclosed herein are
applied to
measure the major and minor axes of the oriented spheroidal scatterers in
micrometers
through repeated measurements with varying orientation and polarization. A
full
characterization of the cell nuclei is achieved, and both the major axis and
minor axis of
the nuclei is determined, yielding an aspect ratio (ratio of minor to major
axes).
[00253] The f/a/LCI systems and methods disclosed herein can also be used for
monitoring therapy. In this regard, the f/a/LCI systems and methods are used
to assess
nuclear morphology and subcellular structure within cells (e.g., mitochondria)
at several
time points following treatment with chemotherapeutic agents. The light
scattering signal
reveals a change in the organization of subcellular structures that is
interpreted using a
fractal dimension formalism. The fractal dimension of sub-cellular structures
in cells
treated with paclitaxel and doxorubicin is observed to increase significantly
compared to
that of control cells. The fractal dimension will vary with time upon exposure
to
therapeutic agents, e.g., paclitaxel, doxorubicin and the like, demonstrating
that structural
changes associated with apoptosis are occuring. Using T-matrix theory-based
light
scattering analysis and an inverse light scattering algorithm, the size and
shape of cell
nuclei and mitochondria are determined. Using the f/a/LCI systems and methods
disclosed herein, changes in sub-cellular structure (e.g., mitochondria) and
nuclear
substructure, including changes caused by apoptosis, can be detected.
Accordingly, the
f/a/LCI systems and processes described herein have utility in detecting early
apoptotic
events for both clinical and basic science applications.
[00254] Although embodiments disclosed herein have been illustrated and
described
herein with reference to preferred embodiments and specific examples thereof,,
it will be
readily apparent to those of ordinary skill in the art that other embodiments
and examples
can perform similar functions and/or achieve like results. The previous
description of the
disclosure is provided to enable any person skilled in the art to make or use
the
disclosure. Various modifications to the disclosure will be readily apparent
to those
76
CA 02711643 2010-07-07
WO 2009/089344 PCT/US2009/030435
skilled in the art, and the generic principles defined herein may be applied
to other
variations without departing from the spirit or scope of the disclosure. All
such
equivalent embodiments and examples are within the spirit and scope of the
present
invention and are intended to be covered by the appended claims.
[00255] It will also be apparent to those skilled in the art that various
modifications
and variations can be made to the present invention without departing from the
spirit and
scope of the invention. Thus, the disclosure is not intended to be limited to
the examples
and designs described herein, but is to be accorded the widest scope
consistent with the
principles and novel features disclosed herein. For example, the present
invention is not
limited to a particular Fourier domain or angle-resolved optical biopsy
system, tissue type
examined, therapy or therapeutic, an endoscope or endoscopic probe, control
systems or
interfaces, or methods, processes, techniques disclosed herein and their
order.
[00256] The embodiments set forth above represent the necessary information to
enable those skilled in the art to practice the invention and illustrate the
best mode of
practicing the invention. Upon reading the following description in light if
the
accompanying drawings figures, those skilled in the art will understand the
concepts of
the invention and will recognize applications of these concepts not
particularly addressed
herein. It should be understood that these concepts and applications fall
within the scope
of the disclosure and the claims that follow.
77