Note: Descriptions are shown in the official language in which they were submitted.
CA 02721008 2010-10-07
WO 2009/126951 PCT/US2009/040331
VISULATION OF GEOLOGIC FEATURES USING DATA REPRESENTATIONS THEREOF
RELATED APPLICATION DATA
[0001] This application claims the benefit of and priority under 35 U.S.C.
119(e) to U.S.
Patent Application No. 60/044,150, filed 11 April 2008, entitled "Channel
Segmentation,"
and is related to PCT Application PCT/US2007/071733 (Published as
W02008/005690), U.S.
Provisional Patent Application No. 61/018,958, entitled "Level Set Fault
Segmentation," and
U.S. Provisional Patent Application No. 61/018,961, entitled "Structure Tensor
Analysis For
Seismic Data," all of which are incorporated herein by reference in their
entirety.
BACKGROUND
[0002] In the related application mentioned above, processes are described
that assist
with the identification of potential hydrocarbon deposits that include
performing a structural
interpretation of a three-dimensional seismic volume, transforming the three-
dimensional
seismic volume into a stratal-slice volume, performing a stratigraphic
interpretation of the
stratal-slice volume which includes the extracting of bounding surfaces and
faults and
transforming the stratal-slice volume into the spatial domain. As illustrated,
an exemplary
seismic volume before domain transformation is presented in Fig. 24a of the
related
application, interpreted horizons and faults used in the transformation are
presented in Fig.
24b of the related application and the domain transformed stratal-slice volume
is presented in
Fig. 24c of the related application. The input seismic volume in Fig. 24a of
the related
application has deformations associated with syn- and post-depositional
faulting. The output
domain transformed volume (Fig. 24c of the related application) is
substantially free of
deformations.
SUMMARY
[0003] Three-dimensional seismic data has been used to explore the Earth's
crust for over
1
SUBSTITUTE SHEET (RULE 26)
CA 02721008 2010-10-07
WO 2009/126951 PCT/US2009/040331
30 years, yet the imaging and subsequent identification of geologic features
in the data
remains a time consuming manual task. Most current approaches fail to
realistically model
many 3-D geologic features and offer no integrated segmentation capabilities.
In the image
processing community, image structure analysis techniques have demonstrated
encouraging
results through filters that enhance feature structure using partial
derivative information.
These techniques are only beginning to be applied to the field of seismic
interpretation and
the information they generate remains to be explored for feature segmentation.
Dynamic
implicit surfaces, implemented with level set methods, have shown great
potential in the
computational sciences for applications such as modeling, simulation, and
segmentation.
Level set methods allow implicit handling of complex topologies deformed by
operations
where large changes can occur without destroying the level set representation.
Many real-
world objects can be represented as an implicit surface but further
interpretation of those
surfaces is often severely limited, such as the growth and segmentation of
plane-like and high
positive curvature features. In addition, the complexity of many evolving
surfaces requires
visual monitoring and user control in order to achieve preferred results.
[0004] Despite volatile economic conditions, long-term trends suggest that
worldwide
demand for energy will continue to grow in order to support continued world
industrialization
and improvement of living standards. Because an efficient and cost effective
global
infrastructure for production and distribution of oil and gas already exists,
it is expected to
remain a convenient and economical source of energy for the foreseeable
future. Extracting
oil and gas from the Earth's crust begins with collecting sub-surface data and
analyzing it for
potential reservoirs and geologic features important to drilling and
production. Unfortunately,
most of the easy oil fields in the world have already been discovered and
therefore current
exploration efforts focus on difficult to reach fields or missed plays in
already developed
fields.
2
CA 02721008 2010-10-07
WO 2009/126951 PCT/US2009/040331
[0005] Analyzing the seismic data used to locate reservoirs is a complex task
due to the
data's unique layered structure, the difficulty in identifying features, and
the large size of data
sets. In addition, increased acquisition has created an explosion in the
amount of seismic data
that needs to be analyzed; yet the oil industry is experiencing a drastic
shortage of interpreters
as the current generation nears retirement. This presents a great opportunity
for computer-
aided techniques to be developed in order to aid geoscientists in recognizing
features in
seismic datasets.
[0006] A similar problem exists in the medical imaging community for analyzing
CT and
MRI scans of patients as well as data generated by the visible human project.
Research in
this area has developed many fundamental techniques in the area of image
structure analysis
and surface segmentation for 3-D volumetric data. There are many corollaries
between the
features represented in medical and seismic datasets (e.g. depositional
channel features have a
similar character to vascular systems), and one can apply the techniques
developed herein for
medical imaging when considerations such as noise character, local
orientations, and the
structure of features specific to seismic datasets are taken into account.
[0007] Image structure analysis techniques enhance feature structure using
partial
derivative information. This exemplary approach is powerful because it employs
a
combination of first and second order derivative information to differentiate
between a wide
variety of structures. These techniques are only beginning to be applied to
the field of seismic
interpretation and the information they generate remains to be explored for
feature
segmentation. This presents an opportunity to adapt image structure analysis
in order to
create representations for geologic features that can be used to allow for
easier segmentation.
[0008] Surface segmentation separates features from background data using
either an
implicit or explicit representation of a surface. Up until recently, most
published work in
computer graphics and vision for imaging applications have used explicit
surfaces
3
CA 02721008 2010-10-07
WO 2009/126951 PCT/US2009/040331
constructed from triangles. Triangulated surfaces require extreme care to be
taken when
discontinuous topological changes occur and smoothness is difficult to
guarantee. In addition,
there is no guarantee that the result of an explicit surface will be
physically realizable.
Implicit surfaces are represented volumetrically using level set methods and
have an
advantage over explicit surfaces in how easily dynamic topological changes and
geometric
quantities, such as normals and curvatures, are determined. Also, the results
of level set
simulations are physically realizable implicit surface models, which is
desirable when
attempting to represent geologic features.
[0009] Three-dimensional seismic data interpretation is a challenge in both
imaging and
segmentation where the ultimate goal is to automatically segment features
contained in a data
set. Unfortunately, the science of geology has many unknowns and the seismic
data used to
represent it requires a trained eye and subjective analysis that cannot be
reliably automated.
Similar problems are manifested in other imaging fields such as when an
evolving surface
segmentation requires human knowledge to proceed, possibly due to poor imaging
or a highly
complex feature. In order to account for unknowns in data, visual monitoring
and user control
of the segmentation that employs domain knowledge is necessary; this is a non-
trivial
exercise. Therefore, a need and opportunity exists to incorporate image
structure analysis and
implicit surface modeling into an interactive environment for segmentation.
One exemplary
embodiment presents a unified approach in the form of an Interactive
"Visulation"
(simultaneous visualization and simulation) Environment (IVE) designed to
efficiently
segment geologic features with high accuracy. The IVE unifies image structure
analysis and
implicit surface modeling as a surface-driven solution that assists
geoscientists in the
segmentation and modeling of faults, channels, and other geobodies in 3-D
seismic data.
[0010] An exemplary embodiment of this invention therefore presents a unified
approach
that combines image structure analysis and implicit surface modeling in an
Interactive
4
CA 02721008 2010-10-07
WO 2009/126951 PCT/US2009/040331
"Visulation" Environment designed to segment geologic features. The IVE allows
geoscientists to observe the evolution of surfaces and steer them toward
features of interest
using their domain knowledge. In accordance with one exemplary embodiment, the
process
is implemented on a GPU for increased performance and interaction. The
resulting system is
a surface-driven solution for the interpretation of 3-D seismic data, in
particular for the
segmentation and modeling of faults, channels, salt bodies and other
geobodies.
[0011] It is an aspect of the present invention to provide systems, methods
and techniques
for data processing.
[0012] It is another aspect of this invention to provide systems, methods and
techniques
for seismic data processing.
[0013] It is a further aspect of this invention to provide systems, methods
and techniques
for 3-D seismic data processing.
[0014] Even further aspects of the invention relate to visualizing one or more
faults in a
data volume.
[0015] Even further aspects of the invention relate to visualizing one or more
channels in
a data volume.
[0016] Even further aspects of the invention relate to visualizing one or more
salt bodies
in a data volume.
[0017] Even further aspects of the invention relate to visualizing one or more
geobodies
in a data volume.
[0018] Additional aspects relate to performing structure analysis of an input
volume.
[0019] Aspects also relate to applying a surface velocity procedure.
[0020] Aspects further relate to utilization of a gradient structure tensor to
assist with
determining an orientation of strata.
[0021] Even further aspects relate to using level sets to represent a
deformable structure.
CA 02721008 2010-10-07
WO 2009/126951 PCT/US2009/040331
[0022] Additional aspects relate to usage of velocity of the level set to
describe motion of
a surface in space and time.
[0023] These and other features and advantages of this invention are described
in, or are
apparent from, the following detailed description of the exemplary
embodiments.
BRIEF DESCRIPTION OF THE DRAWINGS
[0024] The patent or application file contains at least one drawing executed
in color.
Copies of this patent or patent application publication with color drawing(s)
will be provided
by the Office upon request and payment of the necessary fee.
[0025] The exemplary embodiments of the invention will be described in detail,
with
reference to the following figures. It should be understood that the drawings
are not
necessarily shown to scale. In certain instances, details which are not
necessary for an
understanding of the invention or which render other details difficult to
perceive may have
been omitted. It should be understood, of course, that the invention is not
necessarily limited
to the particular embodiments illustrated herein.
[0026] Figure 1 illustrates an exemplary high-level overview of the operation
of the
interactive visulation environment according to this invention;
[0027] Figure 2 illustrates an exemplary data processing system according to
this
invention;
[0028] Figure 3 illustrates exemplary seismic strata according to this
invention;
[0029] Figure 4 illustrates mean curvature flow shrinking high-curvature
regions of an
object according to this invention;
[0030] Figure 5 (a-d) illustrates classification of singularities according to
this invention;
[0031] Figure 6 illustrates channelness measure in 3-D according to this
invention;
[0032] Figure 7 illustrates an exemplary method of identifying the inside of a
channel
6
CA 02721008 2010-10-07
WO 2009/126951 PCT/US2009/040331
according to this invention;
[0033] Figure 8 illustrates an exemplary more detailed process for the
operation of an
exemplary embodiment of the invention;
[0034] Figure 8A illustrates an exemplary method of channel detection
according to this
invention;
[0035] Figure 8B illustrates an exemplary method of salt body detection
according to this
invention;
[0036] Figure 8C illustrates an exemplary method of geobody detection
according to this
invention;
[0037] Figure 9 illustrates an exemplary method of structure analysis
according to this
invention;
[0038] Figure 10 illustrates an exemplary graphical user interface of a
screenshot from
the IVE;
[0039] Figure 11 illustrates a segmentation of a fault in a 3-D seismic
volume;
[0040] Figure 12 illustrates a visual representation of the contribution of
level set terms
according to this invention;
[0041] Figure 13 illustrates slices of channelness according to this
invention;
[0042] Figure 14 illustrates slices of channelness overliad by a red outline
of the level set
segmentation according to this invention;
[0043] Figure 15 illustrates a 3-D representation of a segmented channel
according to this
invention;
[0044] Figure 16 illustrates an original seismic image on a z-slice different
from Figure
15 (top left) and a three-dimensional representation of the segmented channel
displayed on
the z-slice (top right), x- and on z-slice (bottom left), x- and z-slice
rotated (bottom right)
according to this invention.
7
CA 02721008 2010-10-07
WO 2009/126951 PCT/US2009/040331
[0045] Figure 17 illustrates two views of the bounding surface of a fault's 2-
D manifold,
colored surfaces represent the actual 2-D fault manifold and silver surfaces
are the bounding
surface of the fault according to this invention;
[0046] Figure 18 illustrates threshold-based fault velocity functions for the
triangle (left)
and the sawtooth (right) form according to this invention;
[0047] Figure 19 an example of high-propagation evolution for (left) initial
and (right)
final time steps, the background grayscale image is the fault-likelihood data
overlaid in red
by the level set fault extraction, black arrows point to initial seeds that
shrunk and yellow
arrow points to a new fault region that the technique discovered according to
this invention;
[0048] Figure 20 illustrates a comparison of propagation only flow (left) to
propagation
flow with curvature flow (right) for the initial seeds (top), blue represents
the level set surface
and red is the boundary of the surface, bright features in the background
image are faults and
dark features are non-faults according to this invention;
[0049] Figure 21 (a-h) illustrates medial-surface extraction and segmentation
results from
two different seismic datasets. The top row shows Seismic-A and bottom row
shows Seismic-
B as (a,e): original level set simulation output, (b,f): level set distance
transform, (c,g):
medial surface slices, and (d,h): segmented components according to this
invention;
[0050] Figure 22 illustrates tri-linear texture filtering on a seismic volume
(top) and a
level set volume (bottom). The left image is non-filtered and right image is
filtered according
to this invention;
[0051] Figure 23 illustrates the determination of the structure tensor on the
seismic data
around a narrow-band of the level set returns propagation and advection terms
on the fly for
use in surface evolution according to this invention;
[0052] Figure 24 illustrates automatically extracted seed lineaments for seed
points to the
level set. Different colored lineaments represent distinct seeds that are
approximated to align
8
CA 02721008 2010-10-07
WO 2009/126951 PCT/US2009/040331
with faults in the data according to this invention;
[0053] Figure 25 illustrates example of semi-automatic refinement by using the
output of
an initial level set simulation (left) as the input to a second level set
process for the purpose of
filling in a gap in the segmentation (right) according to this invention;
[0054] Figure 26 illustrates manual seeding of level sets for planar fault
extraction (where
white blocks represent manual seeds, green surface is the segmented fault)
according to this
invention;
[0055] Figure 27 illustrates a time series computed on the GPU (left to right,
top to
bottom) showing a fault surface evolving from a seed point in a seismic
dataset according to
this invention;
[0056] Figure 28 (a-c) illustrates segmentation of a high-amplitude geobody in
a 3-D
seismic volume showing (a) user defined seed point to start evolution. (b) and
(c) show the
extracted isosurface of the level set while it evolves at 50 and 200
iterations, respectively
according to this invention;
[0057] Figure 29 illustrates a time series computed on the GPU (left to right,
top to
bottom) showing a channel surface evolving from a line of seed points
according to this
invention;
[0058] Figure 30 illustrates computational steering by interactively adding
growth
regions to the surface according to this invention;
[0059] Figure 31 illustrates computational steering by interactively removing
growth
regions of the surface according to this invention;
[0060] Figure 32 illustrates from left to right, adding blue seed points to
the edge of a
surface then evolving it for 30 iterations. The result is an extended version
of the implicit
surface according to this invention;
[0061] Figure 33 illustrates evolution of fault based on a manual seed,
followed by
9
CA 02721008 2010-10-07
WO 2009/126951 PCT/US2009/040331
merging and surface creation according to this invention;
[0062] Figure 33 illustrates an example of how a fault feature can be imaged
in seismic
data according to this invention;
[0063] Figure 34 illustrates the exemplary imaging of a fault according to
this invention;
[0064] Figure 35 illustrates an exemplary geobody having connected voxels
according to
this invention;
[0065] Figure 36 illustrates an exemplary segmentation of a channel according
to this
invention;
[0066] Figure 37 illustrates an example of segmentation of a high-amplitude
geobody
according to this invention;
[0067] Figure 38 illustrates an example of smart merging according to this
invention;
[0068] Figure 39 illustrates an example of hide merging according to this
invention; and
[0069] Figure 40 shows the relationship between smart and hide merging
according to
this invention.
DETAILED DESCRIPTION
[0070] The exemplary embodiments of this invention will be described in
relation to
processing, interpretation, visualization and simulation of data, and in
particular seismic data.
However, it should be appreciated, that in general, the systems and methods of
this invention
will work equally well for any type of data representing any environment,
object, body or
article.
[0071] The exemplary systems and methods of this invention will also be
described in
relation to seismic data interpretation and manipulation. However, to avoid
unnecessarily
obscuring the present invention, the following description omits well-known
structures and
devices that may be shown in block diagram form or otherwise summarized.
[0072] For purposes of explanation, numerous details are set forth in order to
provide a
CA 02721008 2010-10-07
WO 2009/126951 PCT/US2009/040331
thorough understanding of the present invention. However, it should be
appreciated that the
present invention may be practiced in a variety of ways beyond the specific
details set forth
herein.
[0073] Furthermore, while the exemplary embodiments illustrated herein show
the
various components of the system collocated, it is to be appreciated that the
various
components of the system can be located at distant portions of a distributed
network, such as
a communications network and/or the Internet, or within a dedicated secure,
unsecured and/or
encrypted system. Thus, it should be appreciated that the components of the
system can be
combined into one or more devices or collocated on a particular node of a
distributed network,
such as a communications network. As will be appreciated from the following
description,
and for reasons of computational efficiency, the components of the system can
be arranged at
any location within a distributed network without affecting the operation of
the system.
[0074] Furthermore, it should be appreciated that various links can be used to
connect the
elements and can be wired or wireless links, or any combination thereof, or
any other known
or later developed element(s) that is capable of supplying and/or
communicating data to and
from the connected elements. The term module as used herein can refer to any
known or
later developed hardware, software, firmware, or combination thereof that is
capable of
performing the functionality associated with that element. The terms
determine, calculate
and compute, and variations thereof, as used herein are used interchangeably
and include any
type of methodology, process, mathematical operation or technique, including
those
performed by a system, such as a processor, an expert system or neural
network.
[0075] Additionally, all references identified herein are incorporated herein
by reference
in their entirely.
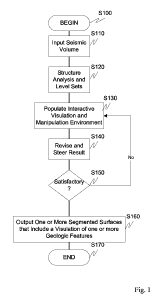
[0076] Fig. 1 outlines a high level overview of an exemplary visulation
according to this
invention. In particular, control begins in step S 100. Next, in step S 1 10,
a seismic volume
11
CA 02721008 2010-10-07
WO 2009/126951 PCT/US2009/040331
(or other data volume such as medical information) is input. Then, in step S
120 structure
analysis and level set analysis is performed. Control then continues to step
5130.
[0077] In step S 130, the interactive visulation and manipulation environment
is populated
and displayed to a user. Next, in step S 140 the "result" is steered and
manipulated until a
satisfactory representation is developed. In step S 140, the level sets
continue to be used to
revise and steer result. The revising and steering of the result uses the
level set technique that
was initialized in step S120. Then, in step S150 control continues to step
S160. Otherwise,
control jumps back to step S 130 for further revising and adjustment of one or
more
parameters.
[0078] In step S 160, one or more segmented surfaces that include a visulation
of one or
more features, such as geologic features, are saved and or output.
[0079] Figure 2 illustrates an exemplary data processing system 100. The data
processing system 100 comprises a fault module 110, a channel module 120, a
salt body
module 130, a geobody module 140, a seed point module 150, a structure
analysis module
160, a level set module 166, a processor 105, storage 115, one or more
computer-readable
storage media (on which software embodying the techniques disclosed herein can
be stored
and executed with the cooperation of a controller, memory 135, I/O interface
145 and storage
155) 125, a GPU 160 (Graphics Processing Unit), memory 135, display driver 165
and an I/O
interface 145, all connected by link(s) (not shown). The system can further be
associated
with an output device, such as computer display(s) 200, on which the outputs
of the various
techniques can be shown to a user and an input device 205, such as a keyboard
and/or mouse.
[0080] The Structure analysis module further includes a gradient structure
tensor module
162 and a Hessian tensor module 164.
[0081] The operation of the above elements will now be discussed in relation
to the
corresponding overall theory behind an exemplary embodiment of this invention.
Structure
12
CA 02721008 2010-10-07
WO 2009/126951 PCT/US2009/040331
analysis of a 3-D dataset (input volume) finds it roots in the field of image
processing where
the structure of a 2-D image is represented as gradients, edges, or similar
types of information.
This translates to 3-D data where gradients, edges, curvature, and other image
elements can
be represented in three-dimensions. This information is gained by calculating
derivatives and
partial derivatives, and then analyzing the vector representation of magnitude
changes of
pixel (or voxel in 3-D) values. In two-dimensions the orientation of maximum
change in an
image corresponds to Equation 1, where IX is the partial derivative of image I
in the x-
direction, and Iy is the partial derivative in the y-direction.
g = ji + ly
B = tan-' Equation 1
I
X
I _ C7
a
C7 Equation 2
The vector resulting from this is directed according to the ordering of pixel
points
(high to low, or low to high values) and points along the orientation of the
angle B, which
varies from [0,t) with a magnitude given by g. Another helpful way to consider
this vector is
to think of it as the normal vector to a gradient contour in the image, which
will make more
sense when working with level sets hereinafter. The calculation of the IX, Iy
partial derivatives
(Equation 2) can be accomplished using standard central differences between
neighboring
pixels (voxels) or more robustly by convolving neighboring voxels with a
Gaussian mask
over a range of voxels and then taking the difference of the Gaussian-smoothed
neighbors.
[0082] The orientation of seismic strata are generally not horizontal
(parallel to the
ground plane), which means filtering techniques used on seismic images must
take into
account local orientations, otherwise undesired blurring across horizons will
inevitably result
13
CA 02721008 2010-10-07
WO 2009/126951 PCT/US2009/040331
as in the case of mean and median filtering. To measure the orientation of
seismic strata, the
gradient structure tensor (GST) is used. For a local neighborhood I(x,y,z) in
a 3-D image the
GST is given by Equation 3.
r II2 Ixly jj
GST = j j j2 j j
-IA I I 2 Equation 3
x z y z
[0083] Since the GST represents an orientation rather than a direction, this
formulation
allows the blurring of tensors in a way that lets vectors pointing in opposite
directions to
support an orientation rather than counteract each other. In addition, the GST
is a 3x3
positive semidefinite matrix, which is invariant to Gaussian convolution.
[0084] Using Gaussian convolution to average the tensors creates a more robust
representation of the orientation field. The eigenanalysis of the GST provides
information
about the local orientation and coherence of the seismic data. Eigenvectors
define a local
coordinate axis while eigenvalues describe the local coherence, which
represents the strength
of the gradient along the respective eigenvectors. The dominant eigenvector
represents the
direction of the gradient orthogonal to the seismic strata, while the smaller
two eigenvectors
form an orthogonal plane parallel to the seismic strata. Near faults or other
discontinuities in
the data, the strength of the dominant eigenvector before Gaussian smoothing
is not sufficient
to confidently define a plane orthogonal to the strata (See Fig. 3 - The
seismic strata (red-to-
blue layering) are rarely perfectly horizontal. Green surface describes the
correct local
coordinate system for small section of the volume). However, after Gaussian
smoothing of
the tensors, a more confident eigenstructure is represented at faults and
discontinuities that
more accurately represent the true orientation. The orientation of the
respective eigenvectors
provides a robust estimate of the local orientation at each point in the
image. This orientation
may be described by two angles, the dip angle 0 and the azimuth angle 0 using
the three
14
CA 02721008 2010-10-07
WO 2009/126951 PCT/US2009/040331
components of the eigenvector (ex, ey, ez) as defined by
ex
cos0
e+ ey
x eY
sin = e2 + e2 Equation 4
x Y
cose= ez
ex + ey + ex
where 0 <0<360 and0 <0<180 .
[0085] The Hessian is determined as the matrix of the second-order partial
derivatives of
the image (or volume). The Hessian tensor is given by
I IY I
H= IxY IYY IY. Equation 5
I I I
~ yz zz
where second partial derivatives of the image I(x,y,z) are represented as I,
Iyy, IzZ7 and so
forth. The eigenvalues of this tensor are ordered as 21>22>23 and their
corresponding
eigenvectors as vl, V2, V3, respectively. Using the eigenvalues, this tensor
can classify local
second-order structures that are plane-like, line-like, and blob-like. The
conditions for which
the different eigenvalues describe these features as:
Blob-like: Xi z Xz z X3
Plane-like: Xi >> Xz z X3
Line-like: Xi z X2 >> X3
By employing second-order information in the dataset, it may not be possible
to calculate
curvature, corners, flatness, and other 2"d order information. This analysis
will be used for
imaging confidence and curvature features described hereinafter and further
applied using
similar analysis for the use of locating critical points for medial surface
extraction.
[0086] Level sets are an implicit representation of a deformable surface. One
advantage
CA 02721008 2010-10-07
WO 2009/126951 PCT/US2009/040331
of level set methods is that instead of manipulating a surface directly, it is
embedded as the
zero level set of a higher dimensional function called the level set function.
The level set
function is then evolved such that at any time the evolving surface can be
implicitly obtained
by extracting the zero level set.
[0087] An implicit representation of a surface consists of all points S = {i
10(i) = 0},
where 0: R3 R. Level sets relate the motion of the surface S to a PDE on the
volume as
170 _ _ V Equation 6
where V describes the motion of the surface in space and time. This framework
allows for a
wide variety of deformations to be implemented by defining an appropriate V.
This velocity
(or speed) term can be combined with several other terms such as geometric
terms (e.g.
mean-curvature) and image-dependent terms. Equation 4 is sometimes referred to
as the level
set equation.
[0088] The initial level set must be represented as a signed distance function
where
each level set is given by its distance from the zero level set. The distance
function is signed
so there is differentiation between the inside and outside of the level set
surface. For this
work all points contained within the level set surface are considered to be
negative distances.
The distance function is computed using a technique that solves the Eikonal
equation, which
is commonly done using the fast marching method or the fast sweeping method.
This equates
to a surface expanding in the normal direction with unit speed and can be
considered a special
case of the level set function.
[0089] The surface integral (surface area) and the volume integral of the
surface S can
be easily defined using the implicit representation of the level set. The
Dirac delta function on
the interface is defined as
8(i) v 01 Equation 7
16
CA 02721008 2010-10-07
WO 2009/126951 PCT/US2009/040331
and the Heaviside function (integral of the Dirac delta function) as
1 if q(i) > 0
H(i) = 0 if i< 0 Equation 8
Using these functions one can derive the surface area integral (in 3-D)
J 8(i) V q5 di Equation 9
S
and the volume integral
f H(-i)di Equation 10
S
Additional intrinsic geometric properties of the implicit surface can be
easily determined
using this formulation. For instance, the normal is computed on the level set
as
n V 01 Equation 11
and the curvature is obtained as the divergence of the normal as
O Equation 12
lc= V Vq5
[0090] The level set equation (Equation 6) contains a velocity term V. The
velocity of the
level set is a representation that describes the motion of the surface in
space and time. This
framework allows for a wide variety of deformations to be implemented by a
combination of
global, geometric, and image-dependent terms, depending on the application
area. Equation
13 gives a basic template of a velocity equation as the combination of two
data-dependent
terms and a surface topology term. The D term is a propagating advection term
scaled
according to a in the direction of the surface normal. The term \=(V~1JV~J) is
the mean-
curvature of the surface defined in Equation 12 and its influence is scaled by
f3. The final
term VA is the dot product of the gradient vector of an advection field with
the surface
normal, which is scaled by y.
17
CA 02721008 2010-10-07
WO 2009/126951 PCT/US2009/040331
= IV aD(J~ +)6(V = o-~) + y(VA(I) = V OI) Equation 13
[0091] Velocity functions are considered that contain terms of advection and
diffusion. It is important to understand the difference between these flows in
the level set
context. This can be stated that advective flow is a propagation of finite
speed in a certain
direction, while diffusive flow is defined everywhere in all directions. The
numerical analysis
of these terms relates to solving a hyperbolic PDE for advection that is
solved using an
upwind scheme and a parabolic PDE for diffusion that is solved by central
differences. In this
scheme, stability can be enforced by using the Courant-Friedrichs-Lewy (CFL)
condition,
which states that numerical waves should propagate at least as fast as
physical waves.
Therefore, the time step used for iterating the level set must be less than
the grid spacing
divided by the fastest velocity term in the domain. The time step is
restricted based on the
velocity term as shown in Equation 14 where v(i) is the velocity calculated at
voxel i and Ax,
Ay, and Az are the grid spacing in three-dimensions.
Imax(Ax,Ay,Az)
VT < da Equation 14
max(v(i))
With a velocity function consisting of advective and diffusive terms, image-
based scaling
factors can be used to guide the terms, such as ones derived from volume
attributes.
Hereinafter, a unique set of velocity functions is developed for evolving
surfaces to segment
geologic features in seismic data.
[0092] Level set motion by mean curvature is considered such that the
interface moves in
the normal direction with a velocity proportional to its curvature v=-bxwhere
b>O is a
constant and x is the mean curvature defined in Equation 15.
IV 01 Equation 15
18
CA 02721008 2010-10-07
WO 2009/126951 PCT/US2009/040331
[0093] For b>O the front moves in the direction of concavity, such that
circles (in 2-D) or
spheres (in 3-D) shrink to a single point and disappear (see Figure 4 where
mean curvature
flow shrinks high-curvature regions of an object to a single point (left to
right, top to bottom).
Oscillations on the moving front decay for this case since the total variation
of the speed
function for b positive has derivative v = -b and hence the total variation
decays.
[0094] Returning to further functionality of the structure analysis module,
after removing
noise in seismic data by conducting anisotropic smoothing along stratigraphic
layers, the
result is a new seismic volume with attenuated noise and enhanced features.
The next step is
to use structure analysis for extracting information that helps identify data
features. First, a
more robust representation of the orientation field given by the structure
tensor is computed
using Gaussian convolution, which averages the tensor orientations. Next, the
eigenanalysis
of the smoothed structure tensor can be computed in order to provide the local
orientations as
well as indications of singularities in the data volume. Thanks to the
representation of the
GST, three real eigenvalues and eigenvectors will be found. The eigenvectors
define a local
coordinate axis while eigenvalues describe the local coherence, which
represents the strength
of the gradient along each respective eigenvector. Potential critical points
are located in the
data volume by using the three-dimensional gradient magnitude given by
Equation 16.
VI = VIT2 + h + h Equation 16
y z
The gradient magnitude is a simple and powerful technique for detecting
singularities. When
isolating medial-surfaces in a distance transform volume, singularities are
defined by areas of
low gradient magnitude. The opposite is used when identifying channel edges
from a seismic
volume. After being isolated, singularities can be classified as 1-saddles, 2-
saddles, and
maximums as depicted in Figure 5. In Figure 5, (a): 1-Saddle, (b): 2-Saddle,
and (c)
Maximum critical points of a surface in 3D. Fig. 5 (d) gives examples of each
critical point
19
CA 02721008 2010-10-07
WO 2009/126951 PCT/US2009/040331
type in a seismic fault dataset. These three types of singularities (or
critical points) are
classified by their eigenstructure as:
1. 1-Saddle: X1 X2 Z X3
2. 2-Saddle: X1 Z X2 >> X3
3. Maximum: X1 Z Xz Z X3
where X1, X2, X3 are the three eigenvalues of the structure tensor in
descending order. In the
context of classifying medial-surface components, the dominant eigenvector of
a 1-saddle
represents the orientation of the gradient orthogonal to the surface, while
the smaller two
eigenvectors form an orthogonal plane parallel to the surface. For a 2-saddle,
the two most
dominant eigenvectors represent the gradient orientation of the surface and
the smallest
eigenvector represents the orientation parallel to the surface. A maximum
critical point is
characterized by an incoherent or chaotic eigenstructure with no dominant
orientation. These
three structures can properly identify all critical points from a 3-D object,
and will find
further use in identifying and classifying medial surfaces of level sets.
[0095] A structure analysis technique to specifically enhance geologic
channels in
seismic data is described hereinafter. Previous sections have described more
general
approaches to enhancing and locating features using the first-order structure
tensor. Now, a
mathematical model given by the second order tensor (Equation 5), called the
Hessian matrix,
is used to enhance translation invariant second order structures in a seismic
dataset. The type
of seismic data used in this section is one that has been smoothed to enhance
continuous
stratigraphy more than small discontinuities.
[0096] In similar work, Frangi et al. exploited the eigenvalues of the Hessian
in order to
develop a MRI vessel enhancement filter. This resulted in a vesselness
function that
integrated all three eigenvalues computed at a range of scales in order to
detect various sizes
of vessels. Sato et al. expanded on this work and used the Hessian to detect
sheets and blobs
CA 02721008 2010-10-07
WO 2009/126951 PCT/US2009/040331
in 3-D images. Seismic channels represent a domain-specific image feature that
cannot be
appropriately modeled using either of these existing techniques of Hessian
analysis, due to a
channel's unique layered structure. For that reason a new confidence and
curvature-based
attribute has been created that is able to enhance channel features and
provide the terms for a
PDE used in segmentation.
[0097] Bakker et al. detected channels in 3-D seismic datasets by using the
first order
structure tensor (GST) to identify the location of features while honoring
seismic orientation.
In particular, they used an orientated GST and enhanced features while
removing noise by
filtered eigenanalysis. Through their orientated representation, they were
able create a
curvature-corrected structure tensor that accounted for line-like and plane-
like curvilinear
structures. They attain a confidence measure from the eigenvalues of the
transformed GST,
where larger eigenvalues provide stronger confidence in the orientation
estimation. Their
unique approach to extracting curvature information uses a parabolic
transformation of the
GST, which yields a curvature-corrected confidence measure that is maximized
for the
transformation most closely resembling local structure.
[0098] The exemplary method presented herein is similar to that of Bakker et
al. in how
confidence and curvature information is obtained from image structure
analysis. Although,
there is a significant difference in the approach presented here since it uses
the second order
tensor to directly extract confidence and curvature information with no
intermediate
transformation. The second order tensor has the advantage of directly
providing this
information without needing to use a parabolic transformation. Concerns are
often made
about error in second order calculations that can result in unstable tensor
fields. This problem
is largely overcome by applying tensor smoothing across the volume using a
Gaussian kernel,
which stabilizes the tensor components without destroying the Hessian
representation. The
confidence and curvature information is later used to drive a segmentation
process for
21
CA 02721008 2010-10-07
WO 2009/126951 PCT/US2009/040331
completely extracting channel features, which is something that was not
considered in
previous work.
[0099] A measure of confidence and curvature in seismic data will correspond
to
regions of high depositional curvature that present a strong and confident
amplitude response.
As described, it can be seen that this description maps well to the imaging of
stratigraphic
features such as channels. One exemplary goal is to define a channelness
measure that
captures the specific structure associated with channels. The first
eigenvector vi and its
corresponding eigenvalue Xi are a primary focus. Due to the layered structure
of channels,
they are approximated as planar features with high curvature along the
gradient direction
(Figure 5 (a)), which corresponds to the first eigenvector. Therefore, by
comparing the first
eigenvector to the second, a channelness measure is defined in Equation 17 as
the difference
of the first eigenvalue A, with the second 22 scaled by the mean average of
all 21,:
C(I(x,Y,z)) = n (~I - A2)
Y'~1' (A1 + 22) Equation 17
AEI
[00100] Since channels generally have a relatively constant cross section, the
second order
tensor is smoothed with a single Gaussian sigma value. Choosing a sigma value
that
approximates the distance across a channel results in optimal enhancement.
Figure 6 shows
stratal slices displaying the channelness attribute on three different data
sets. More
specifically, in Figure 6, the channelness measure calculated in 3-D on the
stratal slice shown
on the left, with the resulting attribute on the right where bright values
correspond to a high
likelihood of a channel. Channel edges can be found by computing the gradient
of the
attribute. As described hereinafter, a unique form of the level set equation
driven by this
channelness measure specifically for segmenting channel features using second
order tensors
derived from seismic images is presented.
22
CA 02721008 2010-10-07
WO 2009/126951 PCT/US2009/040331
[00101] Enhancing fault features directly from the seismic volume using the
first-order
structure tensor is described hereinafter. There is a long established line of
research in
seismic interpretation that has lead to the characterization of geologic
faults based on their
structural character: faults are discontinuities in the strata that extend
vertically. This
characterization is the focus in developing a function that returns positive
propagation values
for features and negative propagation values for non-features.
[00102] Typically, faults are enhanced from raw seismic datasets using a 3-
step approach:
vertical discontinuities are detected, vertical discontinuities are enhanced
laterally in 2-D, and
then they are enhanced again laterally and vertically in 3-D. While this is an
over-
simplification of the fault enhancement technique, it should still be obvious
that faults are
never enhanced directly from a seismic volume. Instead, a number of cascaded
techniques
are used to create a final volume that measures fault likelihood. An effective
implementation
of this technique provided by TerraSpark Geosciences (B.J. Kadlec, H.M. Tufo,
Medial
Surface Guided Level Sets for Shape Exaggeration, IASTED Visualization,
Imaging, and
Image Processing (VIIP), Special Session on Applications of Partial
Differential Equations in
Geometric Design and Imaging, Sept 2008) generates a measure of Fault
Enhancement,
which is essentially a probability that represents the likelihood for a fault
to exist at a given
voxel in the volume. The problem with using a number of cascaded attribute
volumes to
enhance fault structure is that incorrect information can be added anywhere
along the pipeline
and it is difficult to reference the source of this misinformation. Although
these cascaded
techniques are computationally efficient and produce reliable and quality
representations of
fault features, it is still beneficial to generalize the approach to a single
function that can be
computed directly from the seismic data.
23
CA 02721008 2010-10-07
WO 2009/126951 PCT/US2009/040331
var(x,y,z) = plane(v2 x v3 )
n
f (x, y,z) = Yvar(x + ivyx, y + ivvy ,z + ivyz) Equation 18
i=-n
[00103] Therefore, it is desired to directly enhance faults from the seismic
data using a
single function. This can be accomplished by looking for discontinuous
features in the
seismic strata by calculating the variance across the strata. In particular,
discontinuities can
be located along the seismic strata defined by the two smaller eigenvectors of
the structure
tensor. Given this representation, the first step is to compute the variance
within a user-
defined planar window along the strata of the voxel under consideration. Next,
moving along
the positive and negative direction of the dominant eigenvector and using the
same planar
window, additional variances are calculated and summed together. The summation
of these
variances completes the fault attribute computation. Other fault imaging
techniques like
coherence, semblance, or continuity follow a similar approach and achieve
comparable
results in recognizing these discontinuous regions. Part of what makes this
approach unique is
that the local strata is used to guide the vertical summation of variances,
which is different
from traditional approaches that make an assumption of perfectly horizontal
strata layering.
[00104] Function f(x,y,z) in Equation 18 results in a scalar value such that
higher values
correspond to a greater likelihood of a fault and a lower value corresponds to
a low likelihood
of a fault. It will be shown that this analysis of discontinuities in seismic
data can be used to
directly guide level sets for fault extraction. As discussed hereinafter, a
technique is described
for the enhancement of fault features calculated on the fly directly in
seismic data during
level set surface evolution.
[00105] A new technique for segmenting channel features from 3-D seismic
volumes is
discussed in relation to and supplemental to previous teachings as well as
Fig. 7. The
strength and direction of second-order eigenvectors are used to enhance
channel features by
24
CA 02721008 2010-10-07
WO 2009/126951 PCT/US2009/040331
generating a confidence and curvature attribute. Now, that tensor-derived
attribute is used to
form the terms of a PDE that is iteratively updated using the level set
method. Results from
this technique are shown on two seismic volumes in order to demonstrate the
effectiveness of
the approach. In Fig. 7, computation of the inside of a channel by identifying
high curvature
on lateral slices is shown on the left, and the location of channel edges
based on the gradient
on the boundary of a channel is shown on the right.
[00106] The confidence and curvature analysis of the Hessian allows for the
volumetric
enhancement of features, but it does not complete the segmentation required to
fully represent
a channel. Recall that 3-D image segmentation can be accomplished explicitly
in the form of
a parameterized surface or implicitly in the form of a level set. As
described, the level set is
the preferential technique because of its ability to handle complex geometries
and topological
changes, among other reasons. The level set method requires additional
information about
regions to be segmented in order to drive the propagation of the implicit
surface. This is
commonly done in the form of a scalar speed function that defines propagation
speeds in the
surface normal direction. Feddern et al. recently described a structure tensor
valued
extension of curvature flow for level sets. Their work generalized the use of
the structure
tensor for mean curvature flow by utilizing image tensor components in the
curvature
calculation. One exemplary embodiment expands on the generalization of Feddern
et al. by
allowing a level set surface to evolve towards specific features using a
propagation speed
given by a tensor-derived channelness term, an advection motion also based on
the
channelness term, and mean-curvature motion to encourage a smooth final
segmentation.
[00107] In order to guide the level set evolution towards channel features,
the velocity
equation comprises two data-dependent terms and the mean-curvature term. The
level set
evolution is therefore defined as the combination of three terms as shown in
Equation 19:
CA 02721008 2010-10-07
WO 2009/126951 PCT/US2009/040331
= V aD(I) + f3(V - oO) + y(vA(I) . o O) Equation 19
The D term is a propagating speed term defined by the channelness (equation
14) and scaled
according to a in the direction of the surface normal. The term V . (V ~/ V )
is the mean-
curvature of the surface and its influence is scaled by 6. The final term \A=
J V is the dot
product of the gradient vector of the advecting force, defined as inverse
channelness, with the
surface normal. The advecting inverse channelness gradient is scaled by y. The
contribution
of each of these terms is generalized in Figure 12 for a simple 2-D
segmentation example of
evolving a shape towards a bright feature. Figure 12, represents a visual
representation of the
contribution of level set terms in Equation 19 for evolving a surface (or
contour) towards a
bright intensity feature (from left to right) in 2-D.
[00108] The combination of two image-fitting functions with a mean-curvature
term is
necessary to achieve realistic channel segmentation. The propagating
channelness term is
derived from the second order structure tensor and drives the segmentation
into regions with
a high likelihood of containing a channel feature. This representation is
appealing as the
physical process being calculated in this term can be interpreted as an
external convection
field. Although far from realistically simulating the ancient fluid flow that
created the channel,
the channelness guided propagation follows convective laws used in the erosion
and
deposition of a flowing medium and therefore has physical meaning. As
channelness
highlights the interior of a channel, the gradient of its inverse highlights
feature boundaries
and edges. Using this gradient as an advecting force represents the way in
which the evolving
surface moves towards channel edges when parallel to them, but does not cross
over the edge.
When driven by the channelness propagation, this advecting force acts like the
bank of an
ancient channel where flowing medium is forced to stop and move parallel along
the edge.
The mean-curvature of the surface is useful for alleviating the effects of
noise in the image by
26
CA 02721008 2010-10-07
WO 2009/126951 PCT/US2009/040331
preventing the surface from leaking into non-channel regions and maintaining a
smooth
representation. The combined contribution of these terms can be adjusted using
the a, (3, and
y constants according to the nature of the feature being segmented. In
general, an equal
contribution value of 1/3 for each term is sufficient to accurately segment
the channel. In the
case of a greatly meandering channel, the mean-curvature term (y) should be de-
emphasized
in order to allow a more sinuous segmentation.
[00109] The results of segmentation using confidence and curvature-guided
level sets are
shown for channels from two different 3-D seismic volumes. In practice,
geoscientists prefer
to manually define the centerline of a channel they hope to segment since it
is a relatively
quick step compared to manually interpreting the entire 3-D channel surface,
which requires
exponentially more time. For this reason, the initial seed used in each of the
segmentations
was a 1-pixel wide tube manually drawn to approximate the center of the
channel from end to
end. Level set seeding is discussed in further detail hereinafter.
[00110] The channel in Figure 13 is cut by discontinuities (faults), which can
be seen on
the time slice view as bright isotropic regions. The image was first
anisotropically diffused
along the seismic strata, which improved imaging near the discontinuities to
create a more
continuous image of the channel. Next, the image was segmented using the
approach
presented in this section. That resulted in the 3-D representation of the
channel shown in
Figure 13. It should be noted that this surface is the result of applying the
method with a
Gaussian sigma of 5.0 for smoothing the structure tensors and equal scaling
values used for a,
(3, and y of the level set evolution equation. In Figure 13, a slice of
channelness attribute of 3-
D seismic volume overlaid by the red outline of the level set segmentation is
illustrated with
from left to right, increasing iterations of 10, 50 and 100 respectively.
[00111] The channel shown in Figure 14 is a narrow meandering channel.
Enhancing this
27
CA 02721008 2010-10-07
WO 2009/126951 PCT/US2009/040331
channel requires a smaller Gaussian sigma of 2.0 and a (3 value approximately
half the size of
a and y. As mentioned above, the (3 value for the mean-curvature should be
adjusted with
respect to the a and y values depending on the channel that is being
segmented. Since this
channel is more sinuous, decreasing the influence of the mean-curvature term
allows it to be
treated as such. In Fig. 14, a slice of channelness attribute of meandering
channel from 3-D
seismic volume, overlaid by the red outline of the level set segmentation is
shown with left to
right, increasing iterations of 10, 50 and 100 respectively.
[00112] In Figure 15, a three-dimensional representation of a segmented
channel displayed
in different orientations is shown on a y,z-slice (top left), y- and z-slice
(top right), x- and z-
slice (bottom left), x- and z-slice rotated (bottom right).
[00113] Figure 16 shows a different slice of the original 3-D volume, and the
3-D
segmentation of the meandering channel at different rotations.
[00114] In general, for this application, it is not desired to have a single
parameter-set used
for all channels, since over geologic time channels often deposit on top of
one another. When
this happens it becomes necessary to differentiate between two intersecting
features by
manually choosing these parameters. For this reason, the technique was
developed such that a
limited amount of user-control is necessary in order to allow semi-automated
segmentation of
channels.
[00115] This section focuses on representing planar level sets in 3-D for the
purposes of
fault segmentation. This is challenging for implicit surface modeling since a
planar fault
surface is a 2-D manifold in three-dimensions, which is both difficult to
represent and
compute. The reason for these problems is that derivatives are not defined
everywhere on the
fault manifold, for instance at the edges of the fault manifold, and that
implicit surfaces
require an inside and outside of a surface to be defined, but a manifold has
no inside points.
Therefore, the approach was taken to represent a segmented fault as the
bounding surface of
28
CA 02721008 2010-10-07
WO 2009/126951 PCT/US2009/040331
the fault's 2-D manifold (see Figure 17). In Figure 17, two views of the
bounding surface of a
fault's 2-D manifold are shown. Colored surfaces represent the actual 2-D
fault manifold and
silver surfaces are the bounding surface of the fault. This representation
allows curvature to
be defined at all points of the segmentation so that the actual fault surface
can be segmented
by a medial-surface extraction. An additional advantage to representing the
segmented fault
as a bounding surface is that it approximates a region called the fault damage
zone, which is
of interest to geoscientists conducting reservoir modeling.
[00116] The starting point for segmenting faults is the initial seeds, which
are assumed to
be either manually picked or automatically extracted. Level set seeding is
covered in more
detail hereinafter. Next, the initial seeds are represented as an implicit
surface, which then
requires a velocity function to drive growth for the accurate segmentation of
faults. A natural
representation for this function can be derived from the approaches described
above. Given
the success gained from using a fault likelihood measure for highlighting
faults, this
measurement is used as a basis for the level set velocity function. The fault
likelihood is a
scalar byte value f from (0-255) and it can be thresholded for the level set
velocity in a
number of different ways. The goal of thresholding on the fault likelihood is
to encourage
growth in regions of high fault likelihood and shrinking in regions of low
fault likelihood.
The T term in the fault likelihood function specifies a threshold value around
which faults are
segmented. For the case of the sawtooth form (Equation 20), all voxels in the
volume greater
than Twill grow and all voxels less than Twill contract the level set. For the
case of the
triangle form (Equation 21), all voxels greater than T plus or minus some
range (6) will grow,
while all voxels outside of this range will contract the level set. The result
of their
corresponding speed functions is shown in Figure 18. In Figure 18, the
threshold-based fault
velocity functions for the triangle (left) and the sawtooth (right) forms are
illustrated.
F(i) = i - T Equation 20
29
CA 02721008 2010-10-07
WO 2009/126951 PCT/US2009/040331
F(i)=s-Ii-Tj Equation 21
[00117] The threshold-based speed function is combined into the level set
equation given
as:
r 1
1 +0 aF(i)+~(V ~p~)Equation 22
Where F(I) is the fault likelihood propagation function on volume I scaled by
a. The term
V.(V~/V ) is the mean curvature of the level set, scaled by /.3. As in other
level set velocity
functions, the coefficients a and 8 designate the amount of influence the
terms of the
equation have on the overall growth process. This velocity equation becomes
more advanced
with the addition of a feature exaggeration term as will be covered
hereinafter, and using
generalized advection constraints.
[00118] When level set growth is determined by parameters of fault likelihood
and
mean curvature there is a challenge to determine the proper weighting of these
terms in the
velocity calculation. The tradeoff is to prevent leaking growth of the fault
into undesirable
regions while still allowing controlled growth into faulted regions. This
tradeoff is controlled
by the a and (3 coefficients. Determining the optimal values of these
coefficients required
significant testing on a number of different data sets in order to properly
model the behavior
of fault growth. Computing multiple iterations of the level set evolution with
a range of
coefficient values allowed for a determination of which coefficients produced
the best growth.
Figure 19 shows one time-slice view from iteration 0 and one slice at
iteration 100 of a fault-
likelihood based simulation where curvature had an effect of 8=.05 and fault-
likelihood an
effect of a=1Ø More specifically, in Figure 19, an example of high-
propagation evolution
for (left) initial and (right) final time steps is shown. Background grayscale
image is the fault-
likelihood data overlaid in red by the level set fault extraction. Black
arrows points to initial
CA 02721008 2010-10-07
WO 2009/126951 PCT/US2009/040331
seeds that shrunk and yellow arrow points to a new fault region that the
technique discovered.
Figure 20 shows one time-slice view from a dataset at iteration 0 and two
slices at iteration
100. In one case (left) high propagation was conducted (c=l.0, )9-0.0) and in
the other case
(right) high propagation was balanced with curvature (c=1.0, X1.0). It can be
seen that the
curvature term has a regulating effect on the flow and maintains a more smooth
evolution.
More specifically, the figure illustrates comparing propagation only flow
(left) to propagation
flow with curvature flow (right) for the initial seeds (top). Blue represents
the level set
surface and red is the boundary of the surface. Bright features in the
background image are
faults and dark features are non-faults. It should be noted that it is
convenient to show 2-D
time-slice images on paper to describe the growth of fault evolution, although
it is important
to remember that this simulation is happening in 3-D. After completing tests
on a variety of
datasets, the optimal starting choice of these coefficients was determined to
be c=.125 and
ft--1Ø Any changes made to the velocity equation will result in a change of
these coefficients
and different datasets will likely require reconsideration of these values.
[00119] In analyzing the results of this process, the advantages of using the
level set
representation for segmenting fault features should be noted. In Figure 19,
black arrows
represent initial features in the seed level set that did not grow into
faults, or in other words,
they shrunk. The yellow arrow points to a feature that was not found in the
initial seed image,
but after sufficient iterations, the level set evolution was able to expand
into this fault region.
In Figure 21, medial-surface extraction and segmentation results from two
different seismic
datasets are shown. The top row shows Seismic-A and bottom row shows Seismic-B
as (a,e):
original level set simulation output, (b,f): level set distance transform,
(c,g): medial surface
slices, and (d,h): segmented components. Figures 17, 21, 27 and 33 illustrate
these results in
three-dimensions in order to describe more intuitively what this technique is
accomplishing
and the complexity of fault structures (i.e., intersecting and X-pattems) the
system is able to
31
CA 02721008 2010-10-07
WO 2009/126951 PCT/US2009/040331
represent.
[00120] In accordance with one exemplary embodiment, implicit surface
visulation is a
task that is well suited to being computed on a GPU (Graphics Processing Unit)
due to the
dense volumetric representation of the level sets and the localized finite
differencing used to
calculate derivatives. The level set algorithm developed to compute the
implicit surface
visulation will be described in the context of stream processing, which is a
SIMD model of
parallel processing described by a data set (stream) and an operation applied
to the stream
(kernel function). This model of processing is suitable for applications that
exhibit high
compute intensity, data parallelism, and data locality, all of which are
qualities of the implicit
surface visulation technique.
[00121] The streaming level set implementation comprises three major
components:
data packing, numerical computation, and visualization. The data packing
focuses on
optimally storing the 3-D level set function into GPU texture memory such that
it can be
accessed and indexed efficiently. The numerical computation of the level set
should be done
in a way that takes advantage data locality and maximizes compute intensity of
a kernel
function during each iteration. The visualization component comprises a
marching cubes
kernel that extracts and displays the implicit surface at every iteration.
[00122] An initial seed point is used to start a level set segmentation and
this seed
point should be represented by its signed distance transform in order to
enable level sets to be
computed. A signed distance transform represents the arrival times of an
initial front moving
in its normal direction with constant speed, which is negative inside and
positive outside of
the initial front. As mentioned, this is most often computed on the CPU using
the fast
marching method, which maintains a heap data structure to ensure correct
ordering of point
updates. Unfortunately, this technique does not map well to a streaming kernel
due to the
trouble of maintaining the heap structure on a GPU. Therefore an iterative
method is used to
32
CA 02721008 2010-10-07
WO 2009/126951 PCT/US2009/040331
allow the distance transform to be computed in-stream.
[00123] The fast iterative method (FIM) calculates the distance transform used
for
initializing the level set front. The FIM is an appropriate technique for
streaming
architectures, like GPUs, due to the way local and synchronous updates allow
for better cache
coherency and scalability. FIM works by managing a list of active blocks that
are iteratively
updated until convergence is reached. A convergence measure is used to
determine whether
or not blocks should be added or removed from the active list through
synchronous tile
updates.
[00124] In the thread decomposition paradigm, the threads that execute a
kernel are
organized as a grid of blocks. A block is a batch of threads that work
together and
communicate by sharing data through the local shared memory and can
synchronize their
memory accesses. Threads in different blocks cannot communicate or synchronize
with each
other. At the lowest level, a warp is a sub-set of threads from a block that
gets processed at
the same time by the microprocessor. Warps are issued in an undefined order by
a thread
scheduler and therefore cannot be synchronized, so the lowest level of thread
synchronization
occurs at the block-level. This block-independence is what allows the CUDA
architecture to
scale well because as more processing units are added to future devices, more
blocks can be
independently computed in parallel.
[00125] A block-based updating scheme is used during computation on the IVE
such
that a block of threads share resources and work in parallel to update blocks
of the solution.
In this work blocks are fixed to a size of 8x8x4 such that 256 threads are
executed in parallel
and have access to same region of the volume stored in shared-memory. A one-to-
one
mapping of threads to voxels is used in this implementation, such that a block
of 256 threads
computes the solution iteratively for blocks of 256 voxels until the entire
grid of all voxels
have been computed. For a grid size of 2563 voxels it takes approximately 2562
individual
33
CA 02721008 2010-10-07
WO 2009/126951 PCT/US2009/040331
block updates to compute a solution.
[00126] A 3-D array mapped to a texture is used to represent a volume on the
GPU.
The data is stored in 32-bit floating-point for both the input volumes and the
level set
volumes. It is necessary to store the level set volumes in floating point to
ensure accurate
calculations. Depending on the application, as many as four input volumes can
be necessary
for representing scalar values that control level set terms. In addition, at
least two level set
volumes are allocated for conducting a ping-pong computation where the active
and result
storage volumes are swapped each iteration. Along with these volumes, three
large texture-
mapped arrays are allocated for look-up tables to implement the isosurface
extraction routine
for storing edges, triangles, and numbers of vertices. Lastly, two vertex
buffer objects
(VBOs) are created for storing triangle vertices and normals used in
rendering. It can be seen
that this approach is greedy in its use of available GPU memory in order to
enable fast
computation.
[00127] In order to more efficiently move data from global to shared memory on
the
GPU, it should be stored in global memory (DRAM) in a way that allows reads to
be as
coalesced as possible. Coalesced memory accesses by a multiprocessor read
consecutive
global memory locations and create the best opportunity to maximize memory
bandwidth.
Therefore, packing a volume in global memory with the same traversing order as
memory
accesses made by the algorithm is the most efficient way to store a volume in
global memory.
This can be accomplished in a straightforward manner by re-ordering a volume
such that
8x8x4 blocks of the volumes occur consecutively in linear memory. Next, the re-
ordered
volumes in global memory can be mapped to textures, which provides an
opportunity for data
to be entered in a local on-chip cache (8 KB) with significantly lower
latency. With this
combined approach, chances are significantly increased that when data is
requested from
global memory it will be cached either from texture-mapping or when requesting
nearby
34
CA 02721008 2010-10-07
WO 2009/126951 PCT/US2009/040331
memory locations. Memory reads are thereby optimized as long as there is some
locality in
the fetches. For the purposes of one exemplary embodiment, non-local texture
fetches rarely
need to be made since the level set computation requires access only to
neighboring voxels in
the volume. In practice, texture memory that has been cached can be accessed
like an L 1
cache (1-2 cycles) as compared to global (non-coalesced) memory reads that
require a
significant 400-600 cycle latency. In practice, these numbers will vary
greatly depending on
exact memory access patterns and how often the texture cache needs to be
updated, which
cannot be controlled by the programmer.
[00128] There are significant advantages to reading from texture memory as
compared
to global GPU memory, which is necessary to experience the full benefits of
the GPU
architecture. Textures act as low-latency caches that provide higher bandwidth
for reading
and processing data. In particular, textures are optimized for 2-D spatial
locality such that
localized accesses to texture memory is cached on-chip. Textures also provide
for linear
interpolation of voxel values through texture filtering that allows for easy
renderings at sub-
voxel precision (see Figure 22 - As shown in Figure 22, tri-linear texture
filtering on a
seismic volume (top) and a level set volume (bottom) is shown. The left image
is non-
filtered and right image is filtered.) Data access using textures also
provides automatic
handling for out of bounds addressing conditions by automatically clamping
accesses to the
extents of a volume.
[00129] Since shared memory provides over 2 orders of magnitude faster access
to
data than global memory, it should be pre-loaded with data that is expected to
be frequently
used. Shared memory is first set aside for the storing the level set volume,
since it is the
volume most frequently accessed during computation of the evolving surface
(e.g., when
calculating finite differences). Blocks of size 8x8x4 comprise 256 floating-
point values or
1KB of shared memory. Since each SM (Streaming Multiprocessor) has 16KB of
shared
CA 02721008 2010-10-07
WO 2009/126951 PCT/US2009/040331
memory available, additional data can be stored in the remaining memory. This
memory
should next be assigned to the bordering voxels around each block (-I KB) so
that level set
values computed on block edges do not have to access global memory. Next, we
can store
blocks of size 1 KB from any of the feature volumes that provide information
for the level set
terms such as the input seismic data or a fault likelihood volume.
[00130] Since shared memory, caches, and registers are shared by one or more
blocks
on a SM, there is a limit to how many blocks can be launched at one time. This
depends on
how many SM resources are required by a single block. Therefore, there exists
a tradeoff
between block sizes and the use of shared memory since larger block sizes will
require more
data to be accessed from shared memory, thereby reducing the amount of data
that can be
stored in the banks. An additional concern is that the 16KB of shared memory
is divided into
16 banks that allow for simultaneous access. When multiple banks are accessed
at the same
time (i.e., bank conflict), requests must be serialized which causes
performance to degrade.
Block sizes of 8x8x4 provide a good middle ground between resource allocation
per thread as
well as being large enough to hide memory latency through many parallel
computations.
[001311 One of the many advantages of using an implicit surface representation
for
modeling geologic features, as opposed to an explicit representation like a
triangulated mesh,
is its ability to dynamically adapt to drastically changing topologies and
maintain a stable
representation during computation. A disadvantage with the implicit
representation is that it
poses a challenge to extracting and directly visualizing isosurfaces of the
function, something
that comes cheaply with an explicit surface representation. The natural way to
visualize an
implicit surface is using direct volume rendering, which renders the implicit
surface directly
in its native state on the GPU. This could be accomplished by using a ray-
marching pixel
shader to render the level set directly in the GPU texture. By marching rays
through the
volume and accumulating densities from the "3-D texture" as a stack of 2-D
textures, a value
36
CA 02721008 2010-10-07
WO 2009/126951 PCT/US2009/040331
for the level set can be rendered. Unfortunately, direct volume rendering is
only a rendering
technique and may not provide a final form of the surface that can be used for
further
processing and editing by geoscientists in a geologic model. More importantly
though, is that
volume rendering is much more computationally expensive than extracting an
isosurface to
visualize using marching cubes. In order to assure that the speed of the IVE
is as fast as
possible, an isosurface extraction technique can be used for visualization
instead of volume
rendering.
[00132] Isosurface extraction using the marching cubes algorithm extracts a
triangulated mesh of the level set surface. This approach is desirable since
the resulting
surface is identical to the level set surface and can be used in the many mesh-
based reservoir-
modeling tools. For this reason, a new technique was developed for extracting
the isosurface
of a level set surface using a modified streaming marching cubes algorithm
that allows for
fast and easy visualization on the GPU. Marching cubes is efficiently
implemented to run on
the GPU in a way that extracts triangles directly from the level set
representation. This
approach requires no further processing or intermediate storage of triangles
prior to rendering
and is therefore able to run at interactive rates.
[00133] The first step is to classify each voxel of the level set surface
based on the
number of triangle vertices it will generate (if any). In this voxel
classification step, the goal
is to determine whether each vertex of a voxel is inside or outside of the
isosurface (i.e., level
set) of interest. Next, the process iterates over all voxels in the volume and
records the
number of vertices that lie within the isosurface. If there are no vertices
found for a voxel that
lies within the isosurface, that voxel is designated as inactive so that it
will be skipped.
[00134] The next step is to compact all active voxels into a single array.
This is
accomplished by iterating over the array that designates whether or not a
voxel is active, and
in the case where it is active, the voxel's index is saved in a compacted
array. In order to
37
CA 02721008 2010-10-07
WO 2009/126951 PCT/US2009/040331
exploit parallelism during the isosurface extraction, a prefix sum (scan) is
performed across
the volume in order to determine which voxels contain vertices and compact
those voxels into
a single array, while ignoring empty ones with no vertices. This scan can be
accomplished
efficiently in parallel by using the prefix sum. This scan results in a
compacted array that
ensures for the remaining steps the only voxels being calculated are truly
active. Well-
balanced parallelism is then accomplished by evenly dividing this compacted
array among
GPU stream processors.
[00135] The final step is to iterate over the compacted active voxel array and
generate
triangles for rendering. This is done by simply checking all active voxels in
the compacted
array and calculating the points of their intersecting triangles. Since the
compacted array
contains the locations of vertices where the isosurface intersected a given
voxel, 3-D point
locations are readily available. The three points that make up the triangle
are then used to
calculate the surface normal for the triangle face using a cross product. The
triangle vertices
and normal vector are then saved into vertex buffer objects, which are buffers
on the GPU for
storing geometric data. Finally, the isosurface is displayed by rendering the
triangles in the
vertex buffer. The normals are used for calculating the lighting and shading
of the triangles.
The result is a triangulated mesh representation of the implicit surface that
is readily
visualized on the GPU and can easily be transferred to main system memory for
post-
processing and editing at the end of a simulation.
[00136] Advanced techniques for level set modeling and a fast GPU solver have
been
presented, so now the prospect of real-time structure analysis conducted on-
the-fly as the
level set evolves can be discussed. By conducting structure analysis on a
narrow-band around
the implicit surface in real-time, it allows geologic features to be imaged on
the fly for
driving surface evolution (see Figure 23 where the calculation of the
structure tensor on the
seismic data around a narrow-band of the level set returns propagation and
advection terms
38
CA 02721008 2010-10-07
WO 2009/126951 PCT/US2009/040331
on the fly for use in surface evolution is illustrated). This can be a useful
technique for
analyzing data that cannot easily be pre-computed by standard structure
analysis, for adaptive
segmentation of simple shapes, and for situations where input data is being
received in real-
time and must be immediately processed before it changes.
[00137] The techniques described use implicit surfaces to model geologic
features require
many level set terms (propagation, advection, etc) to be calculated before the
implicit
surfaces can be computed. The reason for this is largely due to computational
efficiency,
since it is more efficient to compute these terms all at once for the entire
domain rather than
on an as-needed basis. The advent of GPGPU (General-Purpose computation on
GPUs) is
providing significant changes to this paradigm by allowing for greater
interaction and faster
responses to data interrogations. The GPGPU paradigm provides sufficient
computational
power to calculate many level set terms on the fly in a way that steers the
level set surface in
real-time. This removes many of the requirements to pre-process the structure
analysis of an
input volume before it can be interpreted using level sets. This also provides
geoscientists
with a more immediate response to their interrogations.
[00138] For applying this technique to seismic data features, the structure
analysis
techniques described need to be written as a kernel. Although the existence of
a kernel has
already been mentioned, it has not been defined in what it means for this
particular
application. A kernel refers to a function that is called on a single voxel
and returns some
value based on the structural analysis of an input dataset and/or topological
properties of an
implicit surface. This value is intended to be used as a term in the level set
evolution. In the
previous section, the 3-D edge detector was a kernel used to generate a
propagation term.
[00139] Following from the definition of a kernel, it seems straightforward to
implement the structure analysis techniques as function calls for a given
voxel. Unfortunately
this approach does not take advantage of the volumetric representation of the
input data or the
39
CA 02721008 2010-10-07
WO 2009/126951 PCT/US2009/040331
level set representation, and therefore many redundant calculations result. In
particular, in the
case where a kernel is being calculated on an input dataset that is constant
and never changes,
a single voxel may have its kernel calculated multiple times. This is not a
problem for a
dataset where the ratio of feature to non-feature is very low, meaning the
final surface will be
small in relation to the size of the volume. In the case where the ratio of a
feature to a non-
feature is very large, such as if the final surface encompasses a large part
of the input volume,
this becomes a significant inefficiency. The reason is two-fold.
[00140] First is the already mentioned fact that as the narrow-band of the
level set
computation moves through the volume, the same voxel will have its kernel
calculated
multiple times possibly resulting in redundant calculations. Second is that
many of the
structure analysis techniques require a series of calculations on a region of
voxels around the
voxel in the kernel. This regional computation becomes more pronounced in
operations that
conduct smoothing on a region of voxels around a center voxel, as the region
of influence can
be quite large. When a smoothing operation is cascaded by a subsequent
computation that
also requires a region of voxels, the previous operation must be first
computed for each of the
voxels in the region. The result is that for cascaded operations requiring a
region of voxels,
the kernel paradigm becomes far more computationally intensive than pre-
calculating the
level set terms at one time. Therefore, the kernels described in this section
are adapted for
simple structure analysis techniques and assume the input volume has been
previously
smoothed.
[00141] In order to calculate structural attributes of faults and channels in
seismic data, the
local horizon or stratum must first be found at a given location in the
seismic data. This
requires first calculating the structure tensor by finite differences and then
finding the sorted
eigenvalues and orthonormalized eigenvectors of the structure tensor. Since in
the GPU
implementation both the level set domain and the seismic data are stored in 3-
D texture-
CA 02721008 2010-10-07
WO 2009/126951 PCT/US2009/040331
mapped memory, memory values can be quickly retrieved for use in very fast
derivative
calculations for generating the structure tensor.
[00142] Next, the eigenvalues and eigenvectors of the structure tensor must be
determined.
This is accomplished by using a noniterative algorithm from the medical
imaging community.
For solving the eigensystem, an algorithm was chosen that does not require
iteration in order
to allow fast calculations of eigenvalues and eigenvectors that leverage the
high
computational throughput of, for example, a general purpose parallel computing
architecture
that leverages the parallel compute engine in NVIDIA graphics processing units
(GPUs) to
solve many complex computational problems in a fraction of the time required
on a CPU
(CUDA). Iterative techniques can decrease the throughput of the GPU if they
are not taking
advantage of the large number of calculations that can be quickly computed on
the GPU.
[00143] After having a representation of the structure tensor and its
eigenvalues and
eigenvectors, it is straightforward to determine the kernels described for
imaging faults and
channels. The kernels are computed during each block update of the level set
domain that was
described. As every voxel in the evolving level set surface is solved, the
feature kernel is first
computed then the resulting values are immediately used in the level set
equation. This order
of computations is important because it results in feature kernels only being
computed when
the evolving surface is driven into that region of the volume. This also
provides a layer of
adaptivity to the technique since kernels can use information about the
current position and
shape of the implicit surface into the parameters and orientations of their
computation.
[00144] All level set evolutions require a seed or set of seed points from
which the
evolution begins to grow. One standard way for accomplishing this is by using
a shape-prior
model, which approximates the object being segmented and helps the evolution
proceed to a
solution faster. Another more obvious way is by a manual seed, which is picked
or drawn
into the segmentation by the user. A number of techniques are described for
creating seed
41
CA 02721008 2010-10-07
WO 2009/126951 PCT/US2009/040331
inputs to level set evolutions for seismic interpretation applications. This
section focuses on
applications to fault segmentation, although the techniques described are
generally applicable
to other features.
[00145] Automatic seeds can be generated using techniques that approximate the
location
of features of interest. One exemplary goal of these techniques is that they
are fast to compute
and their approximation to the feature of interest is close enough to at least
intersect at one
point. In the case of geologic faults, an automatic seed input can come from a
lineament
extraction technique that auto-tracks peaks or from a traditional Hough
transform operated on
2-D time slices of a 3-D volume. Both of these techniques attempt to trace
features two-
dimensionally (i.e., on horizontal slices) by following peaks in an attribute
volume such as
channelness or a fault likelihood volume. Figure 24 shows an example of
automatically
extracted lineaments that approximate fault locations. In Figure 24,
automatically extracted
seed lineaments for seed points to the level set are shown where different
colored lineaments
represent distinct seeds that are approximated to align with faults in the
data. For the case of
channels, automatic seeds are more difficult to generate due to the complexity
of channel
attribute volumes and the high-likelihood of false-positives. The same holds
true for
identifying other geobodies, which is why the seeding techniques discussed
hereinafter are
recommended for that purpose.
[00146] The use of local orientation information between features can help
improve on the
manual merging technique by identifying which surface patches are good
candidates to be
combined. This describes a new technique called "smart merging." Two surfaces
are often
manually merged together if they have a common orientation and a close
distance to each
other. Therefore, using a smart merging technique would make it possible to
pre-empt the
merging decisions a user would make on their own.
[00147] Figure 38 illustrates an example of Smart Merging by selecting a patch
for
42
CA 02721008 2010-10-07
WO 2009/126951 PCT/US2009/040331
consideration (left) then highlighting all patches that meet the distance,
normal dot product,
and coplanarity constraints. (right) Highlighted points are then automatically
merged into a
new feature.
[00148] The smart merge works by when a surface patch is first selected for
merging, a
search is made for all other surface patches being displayed that are a given
distance away.
The distance is measured between two sets of points by using the distance of
their midpoints.
Although the midpoint approximation is not the most accurate way to compare
the distance
between two patches, it is fast and when the patches being used are compact it
performs well.
For those patches that are within the distance cutoff, their orientation is
then compared to the
first-selected patch. There are many ways to compare the orientation between
two surface
patches; the technique used here is to calculate the dot product of the
normals and the
coplanarity between the two patches. The dot product between the two normals
is close to 1.0
when the normals are pointing in the same orientation. Coplanarity is
calculated by taking the
dot product of the first patch's normal with the vector between the two
midpoints of the
patches. This dot product is close to 0.0 when the patches are coplanar. The
results of these
calculations are compared to three user-defined parameters: minimum distance,
minimum
normal dot product, and maximum coplanarity dot product. If the result passes
each of these
parameter tests, the current patch in the search queue is automatically merged
with the
selected patch.
[00149] Another way of thinking about the smart merging technique is as a
lightweight
clustering technique. Above was described a complex clustering and
segmentation technique
for combining a large surface into discrete components. When choosing
clustering parameters
a choice is made between erring on the side of over-segmentation (i.e.,
creating too many
patches) or under-segmentation. Since it is generally easier to combine two
discrete patches
into one than it is to break an under-segmented component into two pieces, a
default of over-
43
CA 02721008 2010-10-07
WO 2009/126951 PCT/US2009/040331
segmentation is preferred. Unfortunately, due to the simplicity of the smart-
merging
technique compared to the more complex clustering and segmentation techniques,
it may
make wrong decisions by merging together two patches that shouldn't be merged.
Therefore,
the technique allows for easy undo operations if the result is less than
desirable.
[00150] Figure39 illustrates an example of Hide Merging by (left) selecting a
patch for
consideration then (middle) hiding all patches that do not meet the distance,
normal dot
product, and coplanarity constraints (right). The user can then manually
choose which
patches to merge with the patches still left displaying.
[00151] Motivated by the techniques developed for smart merging, a more
effective
technique was created for assisting with the merging of many discrete surface
patches. Hide
merging essentially works the opposite of smart merging by simplifying the
visual display
through hiding all patches that are certainly not going to be merged with the
patch under
consideration (See Figure 39). The technique for determining which patches to
hide is the
same as discussed in relation to interactive steering only that the
interpretation of the
parameters are inverted. Figure 40 shows the relationship between smart
merging and hide
merging. In practice, hide merging is more useful than smart merging because
it continues to
provide users with a level of manual control that does not exist for smart
merging. Since hide
merging only limits the number of patches that are displayed, it can be
thought of as a sort of
occlusion rendering technique that limits the rendering of patches that are
not relevant to the
surface patch being investigated. The user is then still able to use domain
knowledge about
the nature of features being combined, albeit with less clutter on the screen.
[00152] Semi-automatic seeds comprise using the previous output of a level set
evolution
as the input to a new simulation. This approach can be used as a way to
iteratively segment
by using the output of a previous level set simulation as the input to a later
simulation. This
may be a desired order of operations if a user does not know how much
evolution is
44
CA 02721008 2010-10-07
WO 2009/126951 PCT/US2009/040331
necessary to segment a feature, and if not enough evolution was done
previously so that the
process can continue evolving further. Continuing a level set evolution that
has reached its
final iteration can be considered a special case of a semi-automatic seed.
Figure 25 shows an
example of a fault that was segmented using the planar level set approach
(left) and
afterwards using it as the input to a second level set evolution so that the
gap can be filled-in,
resulting in a better segmentation (right).
[00153] Manual seeds are hand-drawn into the computer using an interaction
technique
similar to "painting." This is the most versatile technique for creating seed
points since it
gives a user the most control over the process, but it also can be more time
consuming than
automatic and semi-automatic seeds. The manual seeding has been implemented in
two ways
by using either a cubic paintbrush that can be elongated in any direction or a
point set dropper
that places points at mouse cursor locations. In either case, the user moves
along 2-D slices in
the 3-D volume and places seeds at places that approximate the location of
features. The
result of the painting procedure is then used as the initial zero level set
for segmentation. The
different use cases between the two approaches are that the cubic paintbrush
is typically used
to enclose a feature of interest (as in Figure 26), whereby the surface
shrinks and collapses
around the feature with some outward growth. The point set dropper is used to
define a sparse
starting point that definitely intersects the feature of interest, thereby
allowing the surface to
grow extensively into the feature with minimal inward growth (see Figure 27
which
illustrates a time series computed on the GPU (left to right, top to bottom)
showing a fault
surface evolving from a seed point in a seismic dataset, Figure 28 which
illustrates
segmentation of a high-amplitude geobody in a 3-D seismic volume showing (a)
user defined
seed point to start evolution, and where (b) and (c) show the extracted
isosurface of the level
set while it evolves at 50 and 200 iterations respectively and Figure 29 which
illustrates a
time series computed on the GPU (left to right, top to bottom) showing a
channel surface
CA 02721008 2010-10-07
WO 2009/126951 PCT/US2009/040331
evolving from a line of seed points).
[00154] Previous sections have described techniques for level set methods that
model a
wide variety of features, but there still exists a need to modify these
evolutions in an
interactive setting. The interactive guiding of level set evolution, also
called interactive
steering, can be accomplished through careful modifications of the velocity
function.
Applying user-defined control to the level set surface in this way allows
growth and
shrinkage in specific, which is the desired functionality.
[00155] Interactive steering is implemented using a shaped 3-D paintbrush,
which
defines the region of the surface where growing and shrinking occurs. Since
both the implicit
surface and the propagation function are stored in a volumetric format, there
are two potential
ways to approach this topic. The first approach is to modify the surface
directly by applying
the 3-D paintbrush to the implicit surface volume. This requires dynamically
modifying the
distance transform representation of the implicit surface in order to redefine
the zero-valued
surface to encompass the changes made by the paintbrush. The implementation of
this
approach requires a reinitialization of the distance transform representation
such that the user-
defined modifications are treated as a zero crossing that is intersected with
the implicit
surface. In the case of growth the logical union of the zero crossings is the
result and in the
case of shrinkage the result is the logical difference of the implicit surface
zero crossing with
the zero crossing of the user-defined modification. The background motivation
for this
approach based on CSG modeling was described above. After the combination of
zero
crossings is complete, the domain needs to be reinitialized so that it again
correctly represents
a distance transform volume.
[00156] An alternative way to implement growth and shrinkage based on user-
defined
modifications is to work indirectly by changing the underlying velocity
function, which in
turn modifies the implicit surface (after a few iterations). This is one
approach that was
46
CA 02721008 2010-10-07
WO 2009/126951 PCT/US2009/040331
developed due to its simplicity and speed. Since the first approach requires
recomputing the
distance transform, a computationally expensive move, it is usually preferable
to compute the
surface evolution for extra iterations in order to encompass the modifications
via the velocity
function. Although, there is a point at which recomputing the distance
transform volume
requires less computation. This occurs when user-defined modifications
significantly modify
the implicit surface to the point that a large number of iterations would be
necessary to evolve
the surface into a new shape.
[00157] The velocity function modifying approach works by using the 3-D
paintbrush to
directly assign velocity values to the volume representing the evolution
velocity. In the case
of growth, positive propagation values are assigned by the paintbrush to the
velocity volume,
and in the case of shrinkage negative propagation values are used to retract
the surface. This
allows for the real-time modification of the surface as shown in Figure 30 for
growing and
Figure 31 for shrinking using an elongated cubic paintbrush. This technique
finds use for
preventing a surface from evolving into an incorrect region of the dataset or
for encouraging
the surface to evolve into a region of the dataset that it would not
otherwise. Allowing all the
interaction to take place in real-time fully represents a working
implementation of
computational steering.
[00158] The techniques presented for level set modeling based on the paradigm
where an
initial seed computes a final solution surface needs to be expanded for
situations where a
surface requires further evolution in specific regions in order to fully
describe a feature.
Therefore, a technique is presented for allowing an existing implicit surface
to expand or
shrink in specific regions while the remainder of the surface remains fixed.
Instead of using a
shaped 3-D paintbrush to accomplish this approach, the technique described for
manual seed
points using a point set dropper can be employed. Since there is already an
existing
representation of the implicit surface available, seed points can be drawn
directly on the
47
CA 02721008 2010-10-07
WO 2009/126951 PCT/US2009/040331
region of the implicit surface where growing or shrinking should occur (see
Figure 32, where
from left to right, adding blue seed points to the edge of a surface then
evolving it for 30
iterations results in an extended version of the implicit surface). After
these seeds are defined
a new implicit surface is created and evolved using one of the velocity
functions presented
herein. Next, when the specific region finishes evolution, it is merged with
the original
implicit surface and a new distance transform is computed to generate the
final surface (see
Figure 33 where evolution of fault based on a manual seed is shown, followed
by merging
and surface creation). This steering technique allows the interactive
modification of surfaces
by restricting evolution to user-defined parts of a surface in order to fully
represent features.
[00159] In Figure 34, an exemplary illustration of how a fault feature can be
imaged in
seismic data by computing a vertical summation of discontinuities along the
seismic strata is
shown.
[00160] In Figure 35, an exemplary illustration of how a geobody feature is
imagined in
seismic data as a set of connected voxels with similar seismic amplitude
characteristics is
shown.
[00161] In Figure 36, segmentation of an exemplary channel in a 3-D seismic
volume
showing user defined seed points (left) to start the growth is shown, followed
by the surface
evolving from 0 to 200 iterations (from left to right).
[00162] Figure 37 illustrates an example of segmentation of a high-amplitude
geobody in a
3-D seismic volume showing user defined seed points (left) to start the
growth, followed by
the surface evolving from 0 to 200 iterations (from left to right).
[00163] Fig. 8 illustrates an exemplary method for developing an interactive
visualization
environment according to an exemplary embodiment of this invention. In
particular, control
begins in step S800 and continues to step S805. In step S805, a seismic volume
is input.
Next, in step 5810, seed points are defined. These seed points can be defined
in accordance
48
CA 02721008 2010-10-07
WO 2009/126951 PCT/US2009/040331
with an implicit volume or by the declining of explicit points. For either of
these two options,
the points can either be hand-drawn or attribute-defined in step S815 or step
S820. Control
then continues to Step S-840.
[00164] In step 5840, a surface velocity technique is applied based on the
specific type of
geologic feature for which modeling and visualization is desired. For example,
for faults,
control continues to step S825. For channels, control continues to step S830.
For salt bodies,
control continues to step S835. For geobodies, control continues to step S840.
[00165] In step S825, a determination is made whether the fault is to be
defined by
attribute or defined by seismic amplitude. If the fault is to be defined by
attribute, control
continues to step 5845, with control otherwise continuing to step S850 if it
is defined by
seismic amplitude. Next, in step S845, fault likelihood is determined with
control continuing
to step S855 if it is an AFE-style fault enhanced volume or to step S860 if it
is a coherence or
edge stacked volume. Then, in step S865 and step S870, respectively, a
determination is
made whether a threshold has been met. For example, one is directed toward
Fig. 18 and the
corresponding description thereof for determining whether a threshold has been
met. As
discussed, this can be a voxel-by-voxel progression throughout a portion of
the inputted
volume until a surface defined by one or more voxels has satisfied the
thresholding criteria.
Control then continues to step S875 where a bounding surface of the fault is
generated.
Control then continues to step S880.
[00166] In step S880, one or more of the determined surfaces can optionally be
merged.
Next, in step S885, the data representing the geologic body is used to
visualize, for example,
on a computer display, the one or more geologic features. These features are
then presented
in step S890 with control continuing to step S895 where the control sequence
ends.
[00167] Fig. 9 outlines an exemplary method for structure analysis according
to an
exemplary embodiment of this invention. In particular, control begins in step
S900 and
49
CA 02721008 2010-10-07
WO 2009/126951 PCT/US2009/040331
continues to step 5910. In step 5910, an input volume is received that has
attenuated noise
and enhanced features. Next, in step S920, the more robust representation of
an orientation
field is determined. Then, in step 5930, an eigenanalysis of the smooth
structure tensor is
performed. Control then continues to step S940.
[00168] In step S940, one or more critical points are determined. Next, in
step S950,
singularities are classified with control continuing to step S960 where the
control sequence
ends.
[00169] Fig. 8A illustrates and exemplary method for channel identification
according to
this invention. In particular, control begins in step S200 and continues to
step 5210. In step
5210, a determination is made whether the channel should be defined by seismic
amplitude,
attribute or channelocity. If defined by seismic amplitude, control continues
to step S220
with control otherwise continuing to step S270.
[00170] In step S220, the stratal domain or time/depth domain is determined.
Next, in step
S230, a determination is made whether the threshold has been met. If the
threshold has not
been met, control jumps back to step S220 with control otherwise continuing to
step S240.
[00171] If the channel is defined by attribute, control continues to step S250
where, in
conjunction with step S260, a determination is made whether the threshold has
been met.
Upon finding the boundaries of the surface, control continues to step S240.
[00172] In step S270, a similar procedure is performed based on channelocity.
Again,
when a threshold is met, control continues to step S240 with control otherwise
jumping back
to step S270.
[00173] In step S240, a channel surface is generated with control continuing
to step S290
where the control sequence ends.
[00174] Fig. 8C outlines an exemplary method for geobody visualization
according to an
exemplary embodiment of this invention. In particular, control begins in step
S300 and
CA 02721008 2010-10-07
WO 2009/126951 PCT/US2009/040331
continues to step S310. In step S310, and if the geobody is to be defined by
seismic
amplitude, control continues to step S320. Otherwise, control continues to
step S350 based
on being defined by attribute.
[00175] In step S320, and based on either analysis in the stratal domain or
the time/depth
domain, an analysis is performed and a determination in step S330 made whether
a threshold
has been met. If a threshold has been met, control jumps back to step S320
with control
otherwise continuing to step S340. A similar methodology is applied if the
body is defined
by attribute with an analysis of the data occurring in step S350 and control
continuing to step
S360 to determine whether a threshold has been met. If a threshold has been
met, control
jumps back to step S350 with control otherwise continuing to step S340.
[00176] In step S340, one or more of the geobody surfaces are generated with
control
continuing to step S370 where the control sequence ends.
[00177] Fig. 8B illustrates an exemplary method for salt body visualization
according to
an exemplary embodiment of this invention. In particular, control begins in
step S400 and
continues to step S410. In step S410, and when the body is defined by
attribute data, control
continues to step S420 with an analysis of the data to determine whether or
not the
thresholding criteria have been met. If the thresholding criteria have not
been met, control
jumps back to step S420 with control otherwise continuing to step S440. In
step S440, one or
more salt body surfaces are generated with control continuing to step S450
where the control
sequence ends.
[00178] Figure 10 illustrates an exemplary user interface that can be used
with the systems
and methods of this invention. For example, user-controlled parameters can be
adjusted in
the Graphical User Interface (GUI) of the IVE (Left) and the results of the
changes can be
immediately computed and visualized in the 3-D graphics window (Right). As
shown the
parameter adjustments can be made via a selectable portion, such as a slider
and optional
51
CA 02721008 2010-10-07
WO 2009/126951 PCT/US2009/040331
numerical input and such items as iterations, scaling, slowest growth value
and fastest growth
value controlled.
[00179] In Figure 11, the segmentation of a fault in a 3-D seismic volume is
illustrated.
Here, user defined seed points (left) to start the growth, followed by the
surface evolving
from 0 to 200 iterations (from left to right).
[00180] While the above-described flowcharts have been discussed in relation
to a
particular sequence of events, it should be appreciated that changes to this
sequence can
occur without materially effecting the operation of the invention.
Additionally, the exact
sequence of events need not occur as set forth in the exemplary embodiments.
Additionally,
the exemplary techniques illustrated herein are not limited to the
specifically illustrated
embodiments but can also be utilized with the other exemplary embodiments and
each
described feature is individually and separately claimable.
[00181] The systems, methods and techniques of this invention can be
implemented on a
special purpose computer, a programmed microprocessor or microcontroller and
peripheral
integrated circuit element(s), an ASIC or other integrated circuit, a digital
signal processor, a
hard-wired electronic or logic circuit such as discrete element circuit, a
programmable logic
device such as PLD, PLA, FPGA, PAL, any means, or the like. In general, any
device
capable of implementing a state machine that is in turn capable of
implementing the
methodology illustrated herein can be used to implement the various methods
and techniques
according to this invention.
[00182] Furthermore, the disclosed methods may be readily implemented in
processor
executable software using object or object-oriented software development
environments that
provide portable source code that can be used on a variety of computer or
workstation
platforms. Alternatively, the disclosed system may be implemented partially or
fully in
hardware using standard logic circuits or VLSI design. Whether software or
hardware is used
52
CA 02721008 2010-10-07
WO 2009/126951 PCT/US2009/040331
to implement the systems in accordance with this invention is dependent on the
speed and/or
efficiency requirements of the system, the particular function, and the
particular software or
hardware systems or microprocessor or microcomputer systems being utilized.
The systems,
methods and techniques illustrated herein can be readily implemented in
hardware and/or
software using any known or later developed systems or structures, devices
and/or software
by those of ordinary skill in the applicable art from the functional
description provided herein
and with a general basic knowledge of the computer and geologic arts.
[00183] Moreover, the disclosed methods may be readily implemented in software
that can
be stored on a computer-readable storage medium, executed on programmed
general-purpose
computer with the cooperation of a controller and memory, a special purpose
computer, a
microprocessor, or the like. The systems and methods of this invention can be
implemented
as program embedded on personal computer such as an applet, JAVA or CGI
script, in C or
C++, Fortran, or the like, as a resource residing on a server or computer
workstation, as a
routine embedded in a dedicated system or system component, or the like. The
system can
also be implemented by physically incorporating the system and/or method into
a software
and/or hardware system, such as the hardware and software systems of a
dedicated seismic
interpretation device.
[00184] It is therefore apparent that there has been provided, in accordance
with the
present invention, systems and methods for interpreting data. While this
invention has been
described in conjunction with a number of embodiments, it is evident that many
alternatives,
modifications and variations would be or are apparent to those of ordinary
skill in the
applicable arts. Accordingly, it is intended to embrace all such alternatives,
modifications,
equivalents and variations that are within the spirit and scope of this
invention.
53
CA 02721008 2010-10-07
WO 2009/126951 PCT/US2009/040331
References:
One of ordinary skill in the art would be aware of the following references
which are
incorporated herein by reference in their entirety:
1. D. Adalsteinson, J.A. Sethian, A fast level set method for propagating
interfaces. Journal of Computational
Physics, 269-277, 1995.
2. Apple Computer Speakable Items, htt ://urww.a ?le.coan%accessabality/macosx
p~hysacal.html, 2008.
3. AMD "Close to Metal" Technology Unleashes the Power of Stream Computing:
AMD Press Release,
November 14, 2006.
4. G. Amdahl, Validity of the Single Processor Approach to Achieving Large-
Scale Computing Capabilities,
AFIPS Conference Proceedings, (30), pp. 483-485, 1967.
5. P. Bakker, L.J. van Vliet, and P.W. Verbeek. Edge preserving orientation
adaptive filtering. Proceedings of
the IEEE Conference on Computer Vision and Pattern Recognition, June, 1999.
6. P. Bakker, L.J. van Vliet, and P.W. Verbeek. Confidence and curvature of
curvilinear structures in 3D.
Proceedings of the Eighth IEEE International Conference on Computer Vision,
Vancouver, Canada, July
2001.
7. H. Blum, A transformation for extracting new descriptors of shape, In W.
Walthen-Dunn, editor, Models
for the Perception of Speech and Visual Form, MIT Press, 1967.
8. H. Blum and R. N. Nagel, Shape description using weighted symmetric axis
features, Pattern Recognition,
nr. 10, 1978, pp. 167-180.
9. B. Blundell, A. Schwarz, Volumetric Three-Dimensional Display Systems, John
Wiley & Sons, 2000.
10. M.R. Bone, B.F. Giles, E.R. Tegland, 3-D high resolution data collection,
processing, and display: Houston,
Texas, presented at 46th Annual SEG Meeting. 1976.
11. S. Bouix and K. Siddiqi, Divergence-based Medial Surfaces, Proc. ECCV
2000, pp. 603-618, 2000.
12. E. Bradley, N. Collins and W. Kegelmeyer, Feature Characterization in
Scientific Data, Proceedings of the
Fourth International Symposium on Intelligent Data Analysis (IDA-0 1), 2001, 1-
12.
13. A. Brown, Interpretation of Three-Dimensional Seismic Data, AAPG Memoir 42
SEG Investigations in
Geophysics, No. 9, 1999.
14. M. Brown, W. Feng, T. Hall, M. McNitt-Gray, B. Churchill, Knowledge-based
segmentation of pediatric
kidneys in CT for measurement of parenchymal volume. J Comput Assist Tomogr
2001;25:639-48.
15. A. M. Bruckstein, Analyzing and synthesizing images by evolving curves,
Proc. ofICIP'94, Austin Texas,
Nov. 1994.
16. A. M. Bruckstein, G. Sapiro, and D. Shaked, Evolutions of Planar Polygons,
Int. J. Pattern Recognition
9(6), 1995, 991-1014.
17. A. M. Bruckstein and D. Shaked, On Projective Invariant Smoothing and
Evolutions of Planar Curves and
Polygons, J. Math. Imaging Vision, 7(3), 1997, 225-240.
18. A. Buades, B. Coll, J.M. Morel, A non-local algorithm for image denoising,
CVPR, 2005.
19. A. Buades, B. Coll, J.M. Morel, Image enhancement by non-local reverse
heat equation, Technical report,
CMLA Prepring N 2006-22, 2006.
20. I. Buck, Stream Computing on Graphics Hardware. Doctoral Thesis. UMI Order
Number: AAI3162314.,
Stanford University, 2005.
21. J. Carlson, F.A. Dorn, Surface Draping and Surface Wrapping in CASI: User -
Guided Automated
Techniques for Rapid Interpretation of Structural and Stratigraphic Features,
AAPG Annual Meeting, April
20-23, 2008.
22. S. Chopra, Coherence cube and beyond. First Break 20, (January 2002), 27-
33.
23. D. Clark, SEG's 2006 Member Compensation Survey, The Leading Edge; v. 26;
no. 5; p. 578-581; May,
2007.
24. E. Cohen, R. Riesenfeld, G. Elber, Geometric Modeling with SPlines, AK
Peters, 2001.
25. R. Cole, J. Mariani, H. Uszkoreit, et al., editors, Survey of the state of
the art in human language
technology, vol. XII-XIII, Cambridge Studies In Natural Language Processing,
Cambridge University
Press, ISBN 0-521-59277-1, 1997.
26. T.H. Cormen, C.E. Leiserson, R.L. Rivest, and C. Stein. Introduction to
Algorithms, Second Edition. MIT
Press and McGraw-Hill, 2001. ISBN 0-262-03293-7. Section 24.3: Dijkstra's
algorithm, pp.595-601.
27. N. Cornea, D. Silver, X. Yuan, and R. Balasubramanian, Computing
Hierarchical Curve-Skeletons of 3D
Objects, The Visual Computer, October 2005.
54
CA 02721008 2010-10-07
WO 2009/126951 PCT/US2009/040331
28. Dargay, J., D. Gately, and M. Sommer, "Vehicle ownership and income
growth, Worldwide: 1960-2030",
ESRC Transport Studies Unit, University College, London, UK, January 2007.
29. C. De Graaf, A. Koster, K. Vinken, M. Viergever, A methodology for the
validation of image segmentation
methods. IEEE Symp Comput Based Med Syst Proc;17-24, 1992.
30. N.A. Dodgson, "Autostereoscopic 3D Displays". IEEE Computer 38 (8): 31-36,
August, 2005.
31. J. Donnelly, Second IPTC Addresses Challenges of Project Execution, Talent
Shortage, JPT, February,
2008.
32. G. Dorn. Detection and Mapping of Faults in 3-D Seismic Surveys; ARCO Oil
and Gas Co., Research
Report RR88-0044, September 1988 (released by ARCO management in March 2000).
33. G.A. Dorn, F.A. Coady, J. Marbach, W.S. Hammon, J.A. Carlson, B.J. Kadlec,
G. Pech, A Case Study of
Semi-Automatic True Volume Interpretation in CASI of Both Structure and
Stratigraphy from a 3D Survey
in the Gulf of Mexico, AAPG Annual Meeting, April 20-23, 2008.
34. G.A. Dorn, Advanced 3-D Seismic Interpretation, pre-press, to be published
jointly by the SEG and the
AAPG, Tulsa, OK., 2009.
35. Energy Information Administration, International Energy Outlook 2007,
Report #:DOE/EIA-0484(2007)
Release Date: May 2007,ivtp_ /lrT sn_ _i_ _ gE /o f!ieorighihs _lltlr_, May
2007.
36. C. Englund, Speech Recognition in the JAS 39 Gripen aircraft - adaption to
speech at differeng G-loads,
Master Thesis in Speech Technology, Dept of Speech, Music and Hearing, Royal
Institute of Technology,
Stockholm, March 11, 2004.
37. Eurofighter Typhoon Direct Voice Input, htt ://ww~v.eurofx~hterocom/et as
vt dv.as , 2008.
38. C. Feddern, J. Weickert, B. Burgeth, M. Welk, Curvature-Driven PDE Methods
for Matrix-Valued Images,
International Journal of Computer Vision, Volume 69, Number 1, August, 2006.
39. G. Fehmers and C. Hocker. Fast structural interpretation with structure-
oriented filtering. Geophysics 68, 4,
July-August 2003.
40. A. F. Frangi, W. J. Niessen, K.L. Vincken, M.A. Viergever, Multiscale
Vessel Enhancement Filtering,
Lecture Notes in Computer Science, Issue 1496, pp. 130-137, Springer, 1998.
41. M. Gage, "Curve shortening makes convex curves circular," Inventiones
Mathematica, Vol. 76, pp. 357,
1984.
42. M. Gage and R. S. Hamilton. The heat equation shrinking convex plane
curves. J. Differential Geom.,
23(1):69-96, 1986.
43. M. Grayson, "The heat equation shrinks embedded plane curves to round
points," J. Diff. Geom., Vol. 26,
pp. 285-314, 1987.
44. J. Gomes and O.D. Faugeras, Reconciling Distance Functions and Level Sets,
Journal of Visual
Communication and Image Representation, no. 11, 2000, pp. 209-223.
45. K. Gruchalla, Immersive Well-Path Editing: Investigating the Added Value
of Immersion, IEEE Virtual
Reality, March 27-3 1, Chicago, IL, 2004.
46. http://www.GPGPU.org
47. W.S. Hammon, G.A. Dorn, B.J. Kadlec, J. Marbach, Domain Transformation in
CASI: Building a Volume
of Paleo-Depositional Surfaces, AAPG Annual Meeting, April 20-23, 2008.
48. M. Harris, S. Sengupta, J. Owens, Parallel Prefix Sum (Scan) in CUDA, GPU
Gems 3, 2007.
49. K. Hasan, P. Basser, D. Parker, A. Alexander, Analytical computation of
the eigen-values and eigenvectors
in dt-mri. Journal ofMagnetic Resonance 152 (2001), 41-47.629-639.
50. M. S. Hassouna and A.A. Farag, Robust Centerline Extraction Framework
Using Level Sets, CVPR (1)
2005: 258-465.
51. S. Henry, Understanding Seismic Amplitudes, AAPG Explorer, July and
August, 2004.
52. C. Hoffmann, Geometric and Solid Modeling, Morgan Kaufmann, 1989.
53. G. Huisken. Flow by mean curvature of convex surfaces into spheres. J.
Differential Geom., 20(1), 1984,
237-266.
54. G. Huisken, C. Sinestrari, Mean curvature flow singularities for mean
convex surfaces. Cale. Vat. Partial
Differential Equations, 8, 1999, 1-14.
55. G. Huisken. Flow by mean curvature of convex surfaces into spheres. J.
Differential Geom., 20(1):237-266,
1984.
56. G. Huisken, C. Sinestrari, Mean curvature flow singularities for mean
convex surfaces. Cale. Vat. Partial
Differential Equations, 8 (1999), 1-14.
57. D. Huttenlocher, G. Klanderman, W. Rucklidge, Comparing images using the
Hausdorff distance, IEEE
Trans Pattern Anal Mach Intell;15:850-63. 1993.
58. A. Iske, T. Randen (Editors), Mathematical Methods and Modelling in
Hydrocarbon Exploration and
Production, Springer, 451 pages, 2005.
59. Insight Segmentation and Registration Toolkit (ITK), ITK Software Guide
2.4.0, November, 2005.
CA 02721008 2010-10-07
WO 2009/126951 PCT/US2009/040331
60. W.K. Jeong, R. Whitaker, and M. Dobin. Interactive 3D seismic fault
detection on the Graphics
Hardware.Volume Graphics, 2006.
61. W.K. Jeong, R.T. Whitaker, A Fast Iterative Method for a Class of Hamilton-
Jacobi Equations on Parallel
Systems, University of Utah Technical Report UUCS-07-010, April 18, 2007.
62. G. Johansson, H, Can, Accelerating Marching Cubes with Graphics Hardware,
Proceedings of the 2006
Conference of the Center for Advanced Studies on Collaborative Research, 2006.
63. J.C. Junqua, J.P. Haton, Robustness in Automatic Speech Recognition:
Fundamentals and Applications,
Kluwer Academic Publishers, ISBN 978-0792396468, 1995.
64. B.J. Kadlec, Channel Segmentation using Confidence and Curvature-Guided
Level Sets on Noisy Seismic
Images, IEEE Workshop on Applications of Computer Vision, January 2008.
65. B.J. Kadlec, H.M. Tufo, 3D Structure Tensor Approach to Medial-Surface
Extraction and Segmentation
Using Level Sets, LASTED Visualization, Imaging, and Image Processing (VIIP),
Special Session on
Applications of Partial Differential Equations in Geometric Design and
Imaging, Sept 2008.
66. B.J. Kadlec, H.M. Tufo, Medial Surface Guided Level Sets for Shape
Exaggeration, LASTED Visualization,
Imaging, and Image Processing (VIIP), Special Session on Applications of
Partial Differential Equations in
Geometric Design and Imaging, Sept 2008.
67. B.J. Kadlec, G.A. Dorn, J. Marbach, F.A. Coady, 3D Semi-Automated Fault
Interpretation in CASI Using
Evolving Surfaces, AAPG Annual Meeting, April 20-23, 2008.
68. B.J. Kadlec, H.M. Tufo, G.A. Dom, D.A. Yuen, Interactive 3-D Computation
of Fault Surfaces using Level
Sets, Visual Geosciences, Springer, 2008.
69. B.J. Kadlec, G.A. Dom, H.M. Tufo, Confidence and Curvature-Guided Level
Sets for Channel
Segmentation, SEG Annual Meeting, November 12, 2008.
70. B.J. Kadlec, H.M. Tufo, D.A. Yuen, Seismic Interpretation and
Visualization using Level Sets on the GPU,
IEEE Visualization, 2009 (to be submitted).
71. C.M. Karat, J. Vergo, D. Nahamoo, "Conversational Interface Technologies",
in Sears, Andrew & Jacko,
Julie A., The Human-Computer Interaction Handbook: Fundamentals, Evolving
Technologies, and
Emerging Applications (Human Factors and Ergonomics), Lawrence Erlbaum
Associates Inc, ISBN 978-
0805858709.2007.
72. K.H. Karlsen, K.A. Lie, and N.H. Risebro, A fast level set method for
reservoir simulation, Computational
Geosciences 4(2), 185-206.
73. M. Kass, A. Witkin and D. Torsopolos, Snakes: Active Contour Models,
International J. of Computer
Vision, 1988, 321-331.
74. Khronos Group, The Khronos Group Releases OpenCL 1.0 Specification,
December 8th, 2008.
75. N. Kiryati and G. Szekely, Estimating shortest paths and minimal distances
on digitized three-dimensional
surfaces. Pattern Recognition, 26:1623-1637, 1993.
76. R. Kimmel, D. Shaked, N. Kiryati, A.M. Bruckstein, Skeletonization via
distance maps and level sets,
Computer Vision and Image Understanding, v.62 n.3, p.382-391, Nov. 1995.
77. L.S.G. Kovasznay, H.M. Joseph, Image processing, Proc. IRE, 43 (1955), p.
560.
78. K. Lalonde, Investigations into the analysis of remote sensing images with
a growing neural gas pattern
recognition algorithm, IEEE International Joint Conference on Neural Networks,
Volume 3, Issue 31, Pages
1698-1703, 2005.
79. L. J. Latecki, Q. Li, X. Bai, W. Liu. Skeletonization using SSM of the
Distance Transform. IEEE Int. Conf.
on Image Processing (ICIP), San Antonio, Texas, September 2007.
80. T. Lee, R. Kashyap, C. Chu, Building skeleton models via 3-D medial
surface/axis thinning algorithms,
CVGIP: Graphical Models and Image Processing, Volume 56, Issue 6, Pages: 462-
478, 1994.
81. A. E. Lefohn, J.M. Kniss, C.D. Hansen, R.T. Whitaker, A Streaming Narrow-
Band Algorithm: Interactive
Computation and Visualization of Level Sets, IEEE TRANSACTIONS ON
VISUALIZATION AND
COMPUTER GRAPHICS, VOL. 10, NO. 4, JULY/AUGUST 2004.
82. C. Lewis, and J. Rieman, Task-centered user interface design: A practical
guide, http://hcibib.org/tcuid,
1993.
83. Lorensen, W.E. and Cline, H.E., "Marching Cubes: a high resolution 3D
surface reconstruction algorithm,"
Computer Graphics, Vol. 21, No. 4, pp 163-169 (Proc. of SIGGRAPH), 1987.
84. R. Malladi, J.A. Sethian, and B.C. Vemuri, Shape modeling with front
propagation: A level set approach.
IEEE Trans. On Pattern Analysis and Machine Intelligence 17, 158-175. 1995.
85. R. Malladi, J.A. Sethian, A unified framework for Shape Segmentation,
Representation and Recognition,
LBL-36039, Lawrence Berkeley Laboratory, UC-Berkeley, August, 1994.
86. G. Medioni, M. Lee and C. Tang, A Computational Framework for Feature
Extraction and Segmentation.
Elsevier Science. March 2000.
56
CA 02721008 2010-10-07
WO 2009/126951 PCT/US2009/040331
87. Microsoft Windows Vista Speech Recognition,
ht 3://www.microssott.eom/enab.e/ rod'cods/`vw indo`vwlsvista/s eech.ah x,
2008.
88. J.D. Mulder, J.J. van Wijk, and R. van Liere, A survey of computational
steering environments. Future
Gener. Comput. Syst. 15, 1, Feb. 1999, 119-129.
89. K. Museth, R. Whitaker, D. Breen, Editing Geometric Models, Geometric
Level Set Methods in Imaging,
Vision, and Graphics, Springer-Verlag, 2003.
90. U. Montanari, A Method for Obtaining Skeletons Using a Quasi-Euclidean
Distance, Journal of the ACM
(JACM), v.15 n.4, p.600-624, Oct. 1968.
91. J. Mulligan and G. Grudic. Topological mapping from image sequences,
Proceedings of the IEEE
Workshop on Learning in Computer Vision and Pattern Recognition (with CVPR05),
June 2005.
92. W.W. Mullins, R.F. Sekerka, Morphological stability of a particle growing
by diffusion or heat flow, J.
Appl. Math, 34, 1963, 321-332.
93. C.W. Niblack, P.B. Gibbons, and D.W. Capson, Generating skeletons and
centerlines from the distance
transform, CVGIP: Graphical odels and Image Processing, nr. 54, 1992, pp. 420-
437.
94. NVIDIA CUDA Compute Unified Device Architecture, Programming Guide,
Version Beta 2.0, April 2,
2008.
95. NVIDIA Tesla S1070, http://www.nvidia.com/object/product tesla s1070
us.html, December, 2008.
96. S. Osher, J.A. Sethian, Fronts propagating with curvature-dependent speed-
Algorithms based on Hamilton-
Jacobi formulations, Journal of Computational Physics, 1988.
97. S. Osher and R. Fedkiw, Level Set Methods: An Overview of Some Recent
Results, Journal of
Computational Physics, pages 463-502, 2001.
98. S. Osher, R. Fedkiw, Level Set Methods and Dynamic Implicit Surfaces,
Springer, 2002.
99. S. Osher, N. Paragios, Geometric Level Set Methods in Imaging, Vision, and
Graphics, Springer-Verlag,
2003.
100.J. Owens, D. Luebke, N. Govindaraju, M. Harris, J. Kruger, A. Lefohn, and
T. Purcell, A survey of general-
purpose computation on graphics hardware, Computer Graphics Forum, 26(1):80-
113, March 2007.
101.K. Palagyi, A 3-subiteration 3D thinning algorithm for extracting medial
surfaces, Pattern Recognition
Letters 23 (2002) 663-675.
102.D.T. Paris and F.K. Hurd, Basic Electromagnetic Theory, McGraw-Hill 1969,
pg. 383-385.
103.S.G. Parker, C.R. Johnson, and D. Beazley, Computational Steering Software
Systems and Strategies. IEEE
Comput. Sci. Eng. 4, 4 (Oct. 1997), 50-59.
104.P. Perona, J. Malik, Scale-Space and Edge Detection Using Anisotropic
Diffusion, IEEE Transactions on
Pattern Analysis and Machine Intelligence vol. 12, no. 7, pp. 629-639, July,
1990.
105.S. K. Richardsen, T. Randen, Mapping 3D Geo-Bodies Based on Level Set and
Marching Methods,
Mathematical Methods and Modelling in Hydrocarbon Exploration and Production,
pp. 247-265, Springer,
2005.
106.Rea1D CrystalEyes, http://reald-corporate.com/scientific/crystalcycs.asp,
2008.
107.D. Reniers and A. Telea, 2007. Skeleton-based Hierarchical Shape
Segmentation. In Proceedings of the
IEEE international Conference on Shape Modeling and Applications 2007 (June 13
- 15, 2007). SMI. IEEE
Computer Society, Washington, DC, 179-188.
108.V. Robins, J. Meiss and E. Bradley, Computing Connectedness: An Exercise
in Computational Topology,
Nonlinearity, 11, 1998, 913-922.
109.V. Robins, J. Meiss and E. Bradley, Computing Connectedness:
Disconnectedness and discreteness,
Physica, 139, 2000, 276-300.
110.V. Robins, J. Abernethy, N. Rooney and E. Bradley, Topology and
intelligent data analysis, Intelligent Data
Analysis, 8, 2004, 505-515.
111 .V. Robins, N. Rooney and E. Bradley, Topology-Based Signal Separation,
Chaos, 14, 2004, 305-316.
112.M.M Roksandic, Seismic Facies Analysis Concepts, Geophys Prospect, Volume
26 Issue 2 Page 383-398,
June 1978,
113.M. Rudisill, C. Lewis, P. Polson, and T. McKay, Human-Computer
Interaction: Success Cases, Emerging
Methods, and Real-world Context. San Francisco: Morgan Kaufman, 1996.
114.M. Rumpf, A. Telea, A continuous skeletonization method based on level
sets, Proceedings of the
symposium on Data Visualisation 2002, May 27-29, 2002, Barcelona, Spain
115.P.K. Saha, B.B. Chaudhuri, Detection of 3-D simple points for topology
preserving transformations with
application to thinning, IEEE Transactions on Pattern Analysis and Machine
Intelligence, Volume: 16,
Issue: 10, pages: 1028-1032, 1994.
116.G. Sapiro, Vector (self) snakes: A geometric framework for color, texture
and multiscale image
segmentation. In Proc. IEEE International Conference on Image Processing, Vol.
1. Lausanne, Switzerland,
1996.
57
CA 02721008 2010-10-07
WO 2009/126951 PCT/US2009/040331
117.Y. Sato, S. Nakajima, H. Atsumi, T. Koller, G. Gerig, S. Yoshida, R.
Kikinis, 3D Multi-scale line filter for
segmentation and visualization of curvilinear structures in medical images,
Lecture Notes in Computer
Science, Issue 1205, pp. 213-222, Springer, 1997.
118.H. Scharsach, 2005. "Advanced GPU Raycasting."InProceedings of CESCG 2005.
119.W. Schroeder, K. Martin, B. Lorensen, The Visualization Toolkit, 3rd
Edition, Kitware Inc., 2004.
120.J.A. Sethian, Curvature and the Evolution of Fronts, Communication of
Mathematical Physics, 101, 4,
1985.
121.J.A. Sethian, J. Strain, Crystal Growth and Dendritic Solidification, J.
Comp Phys. 98, 2, pp. 231-253,
1992.
122.J.A. Sethian, A Fast Marching Level Set Method for Monotonically Advancing
Fronts, Proc. Nat. Acad.
Sci. vol. 93, nr. 4, pp 1591-1595, 1996.
123.J. A. Sethian, Level Set Methods and Fast Marching Methods: Evolving
Interfaces in Computational
Geometry, Fluid Mechanics, Computer Vision, and Materials Science, Cambridge
University Press, 1999.
124.M. Showerman, J. Enos, A. Pant, QP: A Heterogeneous Multi-Accelerator
Cluster, NCSA Technical
Report, 2008.
125.K. Siddiqi , S. Bouix, A. Tannenbaum, S.W. Zucker, The Hamilton-Jacobi
Skeleton, Proceedings of the
International Conference on Computer Vision-Volume 2, p.828, September 20-25,
1999.
126.P. Soille, Morphological Image Analysis: Principles and Applications,
Springer, 1999.
127.A. Steiner, R. Kimmel, A.M. Bruckstein, Planar Shape Enhancement and
Exaggeration, Graphics Models
and Image Processing, Volume 60, Issue 2, March 1998, Pages 112-124.
128.htt ://www.taa nano.com
129.N. Tatarchuk, J. Shopf, C. DeCoro, Real-Time Isosurface Extraction Using
the GPU Programmable
Geometry Pipeline, International Conference on Computer Graphics and
Interactive Techniques, 2007.
130.H.M. Tufo, P.F. Fischer, M.E. Papka, and K. Blom, "Numerical Simulation
and Immersive Visualization of
Hairpin Vortex Generation", Proceedings of SC99, 10 pages, 1999.
131.H.M. Tufo, P.F. Fischer, M.E. Papka, and M. Szymanski, "Hairpin Vortex
Formation, a Case Study for
Unsteady Visualization", Proceedings of the 41st CUG Conference, 10 pages,
1999.
132.J.K. Udupa, V.R. LeBlanc, Y. Zhuge, C. Imielinska, H. Schmidt, L.M.
Currie, B.E. Hirsch, J. Woodburn, A
framework for evaluating image segmentation algorithms, Computerized Medical
Imaging and Graphics
30, p. 75-87. 2006.
133.Visible Human Project, National Library of Medicine, National Institutes
of Health,
http://www.nlm.nih.gov/research/visible/Visible - human.html
134.G.G. Walton, Three-dimensional seismic method: Geophysics, v. 37, p. 417-
430. 1972.
135.S. Wang, A. Kaufman, Volume-Sampled 3D Modeling, IEEE Graphics and
Applications, 14:26-32, 1994.
136.J. Weickert. Anisotropic diffusion in image processing. ECMI Series,
Teubner, Stuttgart, 1998.
137.J. Weickert.: Coherence-enhancing diffusion filtering. International
Journal of Computer Vision 31: 111-
127, 1999.
138. Weimer, P. & Davis, T.L. Applications of 3-D seismic data to exploration
and production. AAPG Studies in
Geology, 42, 270pp, 1996.
139.C.J. Weinstein, Opportunities for Advanced Speech Processing in Military
Computer-Based Systems,
Lincoln Laboratory, MIT, Lexington, MA, 19XX?.
140.R. T. Whitaker, Volumetric deformable models: Active blobs. Visualization
In Biomedical Computing,
SPIE, Mayo Clinic Rochester, Minnesota, R.A. Robb, Ed., 122-134. 1994.
141.R.T. Whitaker, A level-set approach to 3D reconstruction from range data.
International Journal of
Computer Vision 29, 3, 203-231, 1998.
142.Wikipedia contributors (Various Entries). Wikipedia, The Free
Encyclopedia. February 8, 2009.
143.B. Wyvill, A. Guy, E. Galin, Extending the CSG Tree, Warping, Blending and
Boolean Operations in an
Implicit Surface Modeling System, Computer Graphics Forum, 18:149-158, 1999.
144.D.A. Yuen, B.J. Kadlec, E.F. Bollig, W. Dzwinel, Z.A. Garbow, C. da Silva,
Clustering and Visualization
of Earthquake Data in a Grid Environment, Visual Geosciences, Jan, 2005.
145.A. Yuille, D. Cohen and P. Hallinan, Feature Extraction from Faces Using
Deformable Templates, CVPR,
1989, 104-109.
146.J. Zhang, K. Siddiqi, D. Macrini, A. Shokoufandeh, S. Dickinson,
Retrieving Articulated 3-D Models Using
Medial Surfaces and Their Graph Spectra, EMMCVPR 2005, LNCS 3757, pp. 285-300,
2005.
147.H. Zhao, A fast sweeping method for Eikonal equations, Mathematics of
Computation, 2004.
148.Y. Zhou, A. W. Toga, Efficient Skeletonization of Volumetric Objects, IEEE
TVCG, vol. 5, no. 3, 1999,
pp. 210-225.
149.L. Zhukov, K. Munseth, D. Breen, R. Whitaker, and A.H. Barr, Level set
modeling and segmentation of
DT-MRI brain data. 2003.
58