Note: Descriptions are shown in the official language in which they were submitted.
CA 02721966 2010-10-19
WO 2010/005614 PCT/US2009/041129
METHOD AND SYSTEM OF DETECTING LIQUID IN AN ACOUSTIC FLOW
METER
CROSS REFERENCE TO RELATED APPLICATIONS
[0001] None.
BACKGROUND
[0002] After natural gas has been removed from the ground, the gas stream is
transported from place-to-place via pipelines. It is desirable to know with
accuracy the amount of gas flowing in the stream, and particular accuracy is
demanded when the fluid is changing hands, or "custody transfer." Ultrasonic
flow meters may be used to measure the amount of natural gas flowing in a
pipeline, and ultrasonic flow meters have sufficient accuracy to be used in
custody
transfer.
[0003] In an ultrasonic flow meter, acoustic signals are sent back and forth
across the gas stream to be measured. Based on parameters of received
acoustic signals, the gas flow velocity at several distinct elevations in the
flow
meter is determined. Based on the flow velocities and the known cross-
sectional
area of the flow meter, the gas flow volume may be calculated.
[0004] However, in some cases liquids accumulate in the lower portion of the
flow meters measuring natural gas stream. The liquids may be hydrocarbons or
water. For example, depending on pressure and dew point, hydrocarbons may
precipitate out of the natural gas stream, causing liquid accumulations. As
yet
another example, pipelines may be hydrostatically tested by filling the lines
with
water, and in some cases the water is not fully removed before the pipeline
carries
natural gas. Regardless of the nature of the liquid, liquid accumulations
reduce the
cross-sectional area of the flow meter, and the reduced cross-sectional area
has
double effect on flow volume measurements. For a constant actual flow volume
through a meter, a reduced cross-sectional area results in increased measured
flow velocity. Moreover, the flow meter assumes a cross-sectional area, and
determines a flow volume based on measured flow velocity and cross-sectional
area. Liquid accumulations reduce the actual cross-sectional area, and thus
CA 02721966 2010-10-19
WO 2010/005614 PCT/US2009/041129
2
actual volumes will be less than measured volumes based both on the reduced
cross-sectional area and the tendency for the gas flow velocity to increase in
the
presence of the reduced cross-sectional area.
[0005] Some related art ultrasonic flow meters attempt to determine whether
liquid has accumulated in the flow meter by way of a transducer pair that
directs
acoustic signals toward the lower-most portion of the meter. When no liquid is
present, an acoustic signal created by one transducer traverses the meter,
reflects
from the lower-most portion of the meter, and then propagates to the second
transducer. However, when liquid is present, the acoustic signal intersects
and
reflects from the surface of the liquid, rather than the lower-most portion of
the
meter, and thus the path length for the acoustic signal changes. Parameters of
the acoustic signal indicate the changed path length, and thus the presence of
liquid. However, a dedicated transducer pair used for liquid detection
increases
the cost and complexity of the flow meter, and retrofitting existing meters
(whose
acoustic signals traverse the flow meter substantially horizontally), though
theoretically possible, is prohibitively expensive. Thus, systems and methods
to
determine whether liquid is present in acoustic meters would be beneficial.
BRIEF DESCRIPTION OF THE DRAWINGS
[0006] For a detailed description of exemplary embodiments, reference will now
be made to the accompanying drawings in which:
[0007] Figure 1A shows a cross-sectional overhead view of a flow meter in
accordance with at least some embodiments;
[0008] Figure 1 B shows an elevation end-view of a flow meter in accordance
with at least some embodiments;
[0009] Figure 1 C shows an overhead view of a flow meter in accordance with at
least some embodiments;
[0010] Figure 2 shows electronics of a flow meter in accordance with at least
some embodiments;
[0011] Figure 3 shows an elevation end-view of a flow meter in accordance with
at least some embodiments;
[0012] Figures 4A-4E show fluctuations of a flow velocity profile;
[0013] Figures 5A-5E show fluctuations of a flow velocity profile;
CA 02721966 2010-10-19
WO 2010/005614 PCT/US2009/041129
3
[0014] Figure 6 shows a method in accordance with at least some
embodiments; and
[0015] Figure 7 shows a flow computer coupled to a plurality of flow meters in
accordance with at least some embodiments.
NOTATION AND NOMENCLATURE
[0016] Certain terms are used throughout the following description and claims
to
refer to particular system components. As one skilled in the art will
appreciate,
meter manufacturing companies may refer to a component by different names.
This document does not intend to distinguish between components that differ in
name but not function.
[0017] In the following discussion and in the claims, the terms "including"
and
"comprising" are used in an open-ended fashion, and thus should be interpreted
to mean "including, but not limited to... ." Also, the term "couple" or
"couples" is
intended to mean either an indirect or direct connection. Thus, if a first
device
couples to a second device, that connection may be through a direct
connection,
or through an indirect connection via other devices and connections.
CA 02721966 2010-10-19
WO 2010/005614 PCT/US2009/041129
4
DETAILED DESCRIPTION
[0018] The following discussion is directed to various embodiments of the
invention. Although one or more of these embodiments may be preferred, the
embodiments disclosed should not be interpreted, or otherwise used, as
limiting
the scope of the disclosure, including the claims. In addition, one skilled in
the art
will understand that the following description has broad application, and the
discussion of any embodiment is meant only to be exemplary of that embodiment,
and not intended to intimate that the scope of the disclosure, including the
claims,
is limited to that embodiment.
[0019] The various embodiments are directed to methods and systems of
determining whether liquid has accumulated in a lower portion of a central
passage of an acoustic-type flow meter. The determination is based on
parameters of acoustic energy sent through the meter between transducer pairs,
but where the acoustic energy does not intersect the liquid. Figure 1 A shows
a
cross-sectional overhead view of an acoustic flow meter 101 in order to
explain
the various components and relationships. A meter body or spool piece 100,
suitable for placement between sections of a pipeline, has a predetermined
size
and defines a central passage 102 through which a measured gas (e.g., natural
gas) flows. An illustrative pair of transducers 120 and 130, and their
respective
housings 125 and 135, are located along the length of spool piece 100.
Transducers 120 and 130 are acoustic transceivers, and more particularly
ultrasonic transceivers, meaning that they both generate and receive acoustic
energy having frequencies of above about 20 kilohertz. The acoustic energy is
generated and received by a piezoelectric element in each transducer. To
generate an acoustic signal, the piezoelectric element is stimulated
electrically by
way of a sinusoidal signal, and it responds by vibrating. The vibration of the
piezoelectric element generates the acoustic signal that travels through the
measured fluid to the corresponding transducer of the transducer pair.
Similarly,
upon being struck by acoustic energy (i.e., the acoustic signal and other
noise
signals), the receiving piezoelectric element vibrates and generates an
electrical
signal that is detected, digitized, and analyzed by electronics associated
with the
meter.
CA 02721966 2010-10-19
WO 2010/005614 PCT/US2009/041129
[0020] A path 110, sometimes referred to as a "chord" or a "chordal pathway",
exists between illustrative transducers 120 and 130 at an angle 8 to a
centerline 105. The length of chord 110 is the distance between the face of
transducer 120 and the face of transducer 130. Points 140 and 145 define the
locations where acoustic signals generated by transducers 120 and 130 enter
and leave gas flowing through the spool piece 100 (i.e., the entrance to the
spool
piece bore). The position of transducers 120 and 130 may be defined by the
angle 8, by a first length L measured between transducers 120 and 130, a
second
length X corresponding to the axial distance between points 140 and 145, and a
third length "d" corresponding to the pipe inside diameter. In most cases
distances d, X and L are precisely determined during meter fabrication.
Further,
transducers such as 120 and 130 are placed a specific distance from points 140
and 145, respectively, regardless of meter size (i.e., spool piece size). A
gas,
(e.g., natural gas) flows in a direction 150 with a flow velocity profile 152.
Velocity
vectors 153-158 illustrate that in some cases the gas velocity through spool
piece 100 increases toward the centerline 105 of the spool piece 100.
[0021] Initially, downstream transducer 120 generates an acoustic signal that
propagates across the fluid in the spool piece 100, and is then incident upon
and
detected by upstream transducer 130. A short time later (e.g., within a few
milliseconds), the upstream transducer 130 generates a return acoustic signal
that propagates back across the fluid in the spool piece 100, and is then
incident
upon and detected by the downstream transducer 120. Thus, the
transducers 120 and 130 play "pitch and catch" with acoustic signals 115 along
chordal path 110. During operation, this sequence may occur thousands of times
per minute.
[0022] The transit time of the acoustic signal 115 between transducers 120
and 130 depends in part upon whether the acoustic signal 115 is traveling
upstream or downstream with respect to the gas flow. The transit time for an
acoustic signal traveling downstream (i.e., in the same direction as the gas
flow)
is less than its transit time when traveling upstream (i.e., against the gas
flow).
The upstream and downstream transit times can be used to calculate the average
CA 02721966 2010-10-19
WO 2010/005614 PCT/US2009/041129
6
flow velocity of the gas along and/or proximate to the chord, and the transit
times
can be used to calculate speed of sound in the measured gas.
[0023] Acoustic flow meters can have one or more chords. Figure 1 B
illustrates
an elevational end view of one end of a multi-path acoustic flow meter. The
flow
meter of Figure 1 B comprises four chordal pathways A, B, C and D at varying
levels within the spool piece 100. In particular, chord A is an upper-most
chord,
chord B is an upper-middle chord, chord C is the lower-middle chord, and chord
D
is the lower-most chord. Inasmuch as the concern of this specification is
detection
of liquids that accumulate, under the force of gravity, in a lower-most
portion of a
flow meter, the elevation designations upper and lower, and the variants, are
in
reference to gravity. Each chordal path A-D corresponds to a transducer pair
behaving alternately as a transmitter and receiver. Also shown is control
electronics enclosure 160, within which control electronics reside that
acquire and
process the data from the illustrative four chordal pathways A-D. Hidden from
view in Figure 1 B, because of the flange, are the four pairs of transducers
and
transducer ports that correspond to chordal pathways A-D.
[0024] Figure 1C shows an overhead view of the flow meter 101 to illustrate
another aspect of the relationship of the chordal pathways. A first pair of
transducer ports 125 and 135 (which may correspond to the upper-most chord,
chord A) comprises transducers which define a chordal pathway at a non-
perpendicular angle 8 to centerline 105 of spool piece 100. Another pair of
transducer ports 165 and 175 (which may correspond to upper-middle chord,
chord B) comprises transducers which define a chordal pathway that loosely
forms
the shape of an "X" with respect to the chordal pathway of transducer ports
125
and 135. Similarly, a third pair of transducer ports 185 and 195 (which may
correspond to the lower-middle chord, chord C) likewise comprises transducers
which define a chordal pathway parallel to the chordal pathway for transducer
ports 125 and 135, but lower in the central passage than the chordal pathway
for
either transducer ports 125 and 135 or transducer ports 165 and 175. Not
explicitly shown in Figure 1 C, because of the curvature of the illustrative
spool
piece 100, is a fourth pair of transducer ports (which may correspond to the
lower-
CA 02721966 2010-10-19
WO 2010/005614 PCT/US2009/041129
7
most chord, chord D) that comprises transducers which define a chordal pathway
parallel to the chordal pathway for transducer ports 165 and 175.
[0025] Taking Figures 1 B and 1 C together, the pairs of transducers are
arranged
such that the upper two pairs of transducers corresponding to chords A and B
form an the shape of an "X", and the lower two pairs of transducers
corresponding
to chords C and D also form the shape of an "X". The flow meter determines the
velocity of the gas proximate to each chord A-D to obtain chordal flow
velocities,
and the chordal flow velocities are combined to determine an average flow
velocity
across the entire central passage. From the average flow velocity and the
cross-
sectional area of the central passage, the amount of gas flowing in the spool
piece, and thus the pipeline, may be determined.
[0026] Figure 2 illustrates control electronics 200 of an acoustic flow meter
in
accordance with at least some embodiments. The control electronics 200 may
reside with the electronics enclosure 160 of Figure 1 B, which electronics
enclosure 160 may couple to the spool piece 100. Alternatively, the
electronics
enclosure 160 may be equivalently mounted proximate (i.e., within a few feet)
of
the spool piece. The control electronics 200 comprise a processor 202 coupled
to a random access memory (RAM) 204, read only memory (ROM) 206 and
communication port (COM) 208. The processor 202 is the device within which
programs execute to perform the tasks of the various embodiments. The
ROM 206 is a non-volatile memory which stores operating system programs, as
well as programs to implement the various embodiments. The RAM 204 is the
working memory for the processor 202, and before execution some programs
and/or data structures may be copied from the ROM 206 to the RAM 204. In
alternative embodiments, programs and data structures may be accessed directly
from the ROM 206. The communication port 208 is the mechanism by which the
meter communicates with other devices, such as flow computers (which may
accumulate measured flow volumes from a plurality of flow meters) and/or a
data
acquisition system. While the processor 202, RAM 204, ROM 206 and
communication port 208 are illustrated as individual devices, in alternative
embodiments microcontrollers are used, which microcontrollers integrally
comprise a processing core, RAM, ROM and communication ports.
CA 02721966 2010-10-19
WO 2010/005614 PCT/US2009/041129
8
[0027] Processor 202 further couples to and controls a plurality of devices in
order to send and receive acoustic signals through the measured gas. In
particular, the processor 202 couples to a transducer driver 210, receiver
212,
and two multiplexers 214 and 216 by way of control lines 218 and 220,
respectively. In some embodiments, the transducer driver 210 comprises an
oscillator circuit and an amplifier circuit. In embodiments in which the
transducer
driver 210 has an internal oscillator, the transducer driver 210 creates an
initial
signal, amplifies the signal to sufficient signal strength to drive a
transducer, and
provides impedance matching with respect to the transducers. In other
embodiments, the transducer driver receives an alternating current (AC) signal
of
the desired frequency from the processor 202, amplifies the signal and
provides
impedance matching with respect to the transducers. The receiver 212 likewise
may take many forms. In some embodiments, the receiver 212 is an analog-to-
digital converter which takes the analog waveform created by a transducer
representative of the received acoustic energy, and converts the signal to
digital
form. In some cases, the receiver 212 may filter and/or amplify the signals
prior
to or after digitization. The digitized version of the received signal may
then pass
to the processor 202 for purposes of determining gas flow, and also for
determining whether liquid has accumulated in the flow meter (discussed more
below).
[0028] The processor 202, executing a program, selectively controls the
multiplexers 214 and 216 to couple each transducer of each transducer pair 222
to the transducer driver 210 (to drive the transducer to create the acoustic
signal)
and to the receiver 212 (to receive the electrical signal created by the
transducer
in response to the acoustic energy). In some embodiments, the processor 202,
within the span of an illustrative one second measurement period, directs each
transducer pair to send approximately 30 upstream acoustic signals and 30
downstream acoustic signals. Greater or fewer sets of upstream and downstream
acoustic signals for each transducer pair, and longer or shorter measurement
periods, may be equivalently used.
[0029] Still referring to Figure 2, and focusing particularly on transducer
pair 222A as representative of all the transducer pairs 222. For purposes of
this
CA 02721966 2010-10-19
WO 2010/005614 PCT/US2009/041129
9
discussion, transducer 224 is the sending transducer, and transducer 226 is
the
receiving transducer; however, in actual operation these roles change
alternately.
Under control of the processor 202, the transducer driver 210 is coupled,
through
multiplexers 214 and 216, to the transducer 224. An electrical signal
generated
and/or amplified by the transducer driver 210 propagates to and excites a
piezoelectric element in transducer 224, and in turn transducer 224 generates
an
acoustic signal. The acoustic signal traverses the distance between
transducer 224 and transducer 226 in the measured gas. For convenience of the
drawing, the transducer pair 222A of Figure 2 is not aligned, but in operation
the
transducer pair would be substantially coaxial, as illustrated in Figure 1 A.
During
the flight time of the acoustic signal between transducer 224 and transducer
226,
the processor 202 changes the configuration of the multiplexers 214 and 216 to
couple transducer 226 to the receiver 212. Transducer 226 receives the
acoustic
energy (i.e., acoustic signal and noise signals), and an electrical signal
corresponding to the received acoustic energy propagates to the receiver 212.
[0030] Though undesirable, in some situations liquids gather in the lower-most
portion of a flow meter when a measured gas (e.g., natural gas) flows through
the
flow meter. The liquids may be hydrocarbons precipitated from the flowing gas,
hydrocarbons introduced from upstream devices (e.g., compressor lubricating
oils), water left over from hydrostatic testing, or liquids from other
sources.
Regardless of the source, liquid accumulations in the flow meter decrease the
cross-sectional area of meter, which causes gas flow increases (for constant
volume flows) and corresponding flow volume computation errors (based on both
the increased flow velocity and reduced cross-sectional area). The various
embodiments are directed to detecting the presence of liquid accumulations
indirectly. That is, rather than having a dedicated pair of transducers whose
chordal pathway intersects the surface of the liquid (if present), the various
embodiments detect liquid based on parameters detected from chordal pathways
that reside above, and do not intersect, a horizontal plane defined by the
surface
of liquid accumulations in the flow meter.
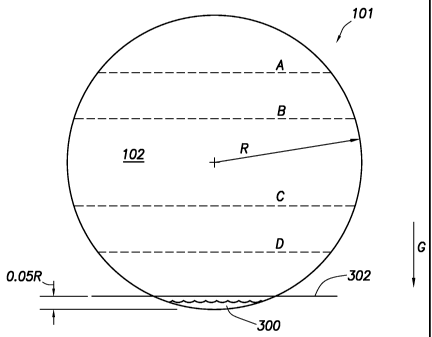
[0031] Figure 3 illustrates an elevation end-view of a flow meter 101 in order
to
more fully describe the relationship of the chordal pathways to liquid
CA 02721966 2010-10-19
WO 2010/005614 PCT/US2009/041129
accumulations in the flow meter. In particular, Figure 3 illustrates the
central
passage 102, as well as the illustrative four chords A, B, C and D. The
central
passage has a radius R. In accordance with the various embodiments, each of
the chords A, B, C and D resides above, and does not intersect the surface of
a
liquid 300 accumulated in the lower-most portion (in relation to gravity G) of
the
central passage 102. Inasmuch as the elevation in the central passage of the
surface of the liquid changes based on the amount of liquid, the specification
further defines that the each chord resides above and does intersect (within
the
central passage) a horizontal plane 302 defined at an elevation of five
percent
(5%) of the radius R of the central passage, as measured from the lower-most
point in the central passage. In Figure 3, each chord A, B, C and D is shown
substantially horizontal (stated otherwise, parallel to the horizontal plane
302);
however, the chords need not be horizontal, and any attitude of the chords may
be used so long as the chords do not intersect the surface of the liquid with
the
central passage.
[0032] The inventors of the present specification have found that even if
liquid is
not directly detected (e.g., a chordal pathway reflected off the surface of
the
liquid), the presence of liquid may nonetheless be determined by analysis of
parameters calculable based on the chordal flow velocities. In particular, the
inventors have found that liquid manifests itself both in terms of the flow
velocity
profile, and cross-flow within the flow meter. Each of these will be discussed
in
turn.
[0033] As mentioned with respect to the overhead cross-sectional view of
Figure 1 A, gas flow with the flow meter defines a flow velocity profile. With
gas
(e.g., natural gas) flowing through the central passage, the flow velocity
profile
takes a "bell" shape, with the highest flow velocities at the center, and
lower flow
velocities near the walls, as shown by the flow velocity profile 152 in the
overhead
view of Figure 1A, and the flow velocity profile 400 in the side elevation
view of
Figure 4A. With respect to flow velocity profile, the inventors have
determined
that liquid accumulations manifest themselves, at least in part, by rapid
fluctuation
of the flow velocity profile between more bell shaped profiles, and flatter
profiles,
such as the illustrative flow velocity profile 402 of Figure 4B. In
particular, over a
CA 02721966 2010-10-19
WO 2010/005614 PCT/US2009/041129
11
relatively small period of time the flow velocity profile fluctuates back and
forth
between the more bell shaped profile, and a flatter profile, as illustrated in
the
progression with time "t" as shown by Figures 4A-4E. Stated otherwise, in the
presence of liquid the measured gas flow velocity profile tends to take on the
profile of a swimming jellyfish.
[0034] The fluctuations are rapid, and thus many fluctuations may occur over a
measurement period; however, over a measurement period, the fluctuations tend
to average to expected values, and thus have not heretofore been identified as
indicative of the presence of liquid. For example, within an illustrative
measurement period of one second, the flow meter may send 30 upstream
and 30 downstream acoustic signals on each chord (i.e., in a one second
measurement period, an acoustic signal is generated, propagated and received
every 4.16 milliseconds). A flow velocity profile may be established after a
complete set of acoustic signals are sent (i.e., one upstream and one
downstream on each chord), or roughly every 33 milliseconds for a four chord
meter. In accordance with at least some embodiments, the flow velocity
profiles
within a measurement period are analyzed in some fashion to determine whether
fluctuations are present.
[0035] In some embodiments, particularly where the computing power of
processor 202 (Figure 2) is relatively high, the determination of whether
liquid is
present in the meter may be made by graphical analysis of the flow velocity
profiles. In yet still other embodiments, a parameter is calculated that is
indicative
of the flow velocity profile for a particular set of measurements, and the
parameter
is analyzed against previously (or subsequently) calculated versions of the
parameter (e.g., within the same measurement period) to determine whether
liquid is present in the meter. In some embodiments, the standard deviation of
a
plurality of such parameters is taken, and if the standard deviation is above
a
predetermined threshold, then liquid is present in the meter. In yet still
other
embodiments, a magnitude of the difference between the parameter and
previously calculated versions of the parameter is calculated, and if the
difference
is above a predetermined threshold, then liquid is present in the meter.
CA 02721966 2010-10-19
WO 2010/005614 PCT/US2009/041129
12
[0036] The parameter indicative of the flow velocity profile likewise may take
many forms. In some embodiments, the parameter is a dimensionless profile
factor indicative the flatness of the flow velocity profile. For a four chord
flow
meter, the profile factor parameter takes the form:
Profile Factor = VB
+V (1)
A D
where VA is the flow velocity at an upper most chord, VB is the flow velocity
at an
upper-middle chord, Vc is the flow velocity at a lower-middle chord, and VD is
the
flow velocity at a lower most chord.
[0037] Consider, as an example, a measurement period of one second and a
four chord meter. As above, the flow meter may make a complete set (all four
chords) of flow velocity determinations in approximately 33 milliseconds, and
from
each set compute a value of the profile factor. In accordance with at least
some
embodiments, the standard deviation of the parameter is taken over a
measurement period (e.g., approximately 30 values in a one second
measurement period), and the standard deviation is compared against a
predetermined value. For example, if the standard deviation of the profile
factor
is above 0.08, then liquid is present in the flow meter, and the flow meter
thus
takes further action to alert the user/owner. The further action may involve,
for
example, asserting an output signal to trigger a local alarm, or sending an
electronic message to other devices (e.g., SCADA system) indicating that
liquid is
present. In alternative embodiments, a difference in magnitude of the values
of
the profile factor (e.g., between the largest value and the smallest value)
may be
determined, and compared against a predetermined values. If the difference in
magnitude exceeds a predetermined value, then the flow meter takes further
action to alert the user/owner. These cases are merely examples, and longer or
shorter measurement periods, and correspondingly greater or fewer values, may
be used in the determinations.
[0038] The flow velocity profile discussed to this point has focused on "bell
shaped" flow velocity profiles, and how the bell shape fluctuates in the
presence
liquids; however, liquids may manifest themselves in other ways in relation to
the
flow velocity profile as well. In particular, the inventors of the present
specification
have found that the peak of the bell shape itself may alternately, and
rapidly, shift
CA 02721966 2010-10-19
WO 2010/005614 PCT/US2009/041129
13
away from the centerline of the central passage (known as "asymmetry"), and
then shift back, in the presence of liquid in the flow meter. The shift of the
peak
off the center line may take place concurrently with the fluctuation of the
bell
shaped flow velocity profile as discussed above. In particular, in a relative
small
period of time the flow velocity profile may fluctuate between a centered
peak,
and an off-center peak, as illustrated in the progression with time "t" shown
by
Figures 5A-5E. The fluctuations are rapid, and thus many fluctuations may
occur
over a measurement period; however, over a measurement period, the
fluctuations tend to average to expected values, and thus have not heretofore
been identified as indicative of the presence of liquid.
[0039] In some embodiments, particularly where the computing power of
processor 202 (Figure 2) is relatively high, the determination of whether
liquid is
present in the meter may be made by graphical analysis of the flow velocity
profiles, particularly the asymmetry of the flow velocity profiles. In yet
still other
embodiments, a parameter is calculated that is indicative of the asymmetry for
a
particular set of measurements, and the parameter is analyzed against
previously
(or subsequently) calculated versions of the parameter (e.g., within the same
measurement period) to determine whether liquid is present in the meter. In
some embodiments, the standard deviation is calculated based on the parameter
(in relation to a plurality of previously calculated versions), and if the
standard
deviation is above a predetermined threshold, then liquid is present in the
meter.
In yet still other embodiments, a magnitude of the difference between the
parameter and previously calculated versions of the parameter is calculated,
and
if the difference is above a predetermined threshold, then liquid is present
in the
meter.
[0040] In embodiments that determine the presence of liquid by calculating
parameters being values indicative of asymmetry, and for four chord meters,
the
asymmetry parameter takes the form:
Asymmetry = VA +VB (2)
VC +VD
where VA is the flow velocity at an upper most chord, VB is the flow velocity
at an
upper-middle chord, Vc is the flow velocity at a lower-middle chord, and VD is
the
flow velocity at a lower most chord.
CA 02721966 2010-10-19
WO 2010/005614 PCT/US2009/041129
14
[0041] Consider, as an example, a measurement period of one second and a
four chord meter. As above, the flow meter may make a complete set (all four
chords) of flow velocity determinations in approximately 33 milliseconds, and
from
each set compute a value of the asymmetry. In accordance with at least some
embodiments, the standard deviation of the parameter is taken over a
measurement period (e.g., approximately 30 values in a one second
measurement period), and the standard deviation is compared against a
predetermined value. For example, if the standard deviation of the asymmetry
is
above 0.08, then liquid is present in the flow meter, and the flow meter thus
takes
further action to alert the user/owner. In alternative embodiments, a
difference in
magnitude of the values of the asymmetry (e.g., between the largest value and
the smallest value) may be determined, and compared against a predetermined
values. If the difference in magnitude exceeds a predetermined value, then the
flow meter takes further action to alert the user/owner. These cases are
merely
examples, and longer or shorter measurement periods, and correspondingly
greater or fewer values, may be used in the determinations.
[0042] In addition to, or in place of, the determination of the presence of
liquid
based on fluctuations in flow velocity profile, the inventors of the present
specification have also found that liquids manifest themselves in the form of
cross-flow within the flow meter. In particular, the flow direction of the gas
in the
flow meter is, in most situations, parallel to an axial center-line, or
central axis, of
the central passage. However, in the presence of liquid, the gas flow tends to
fluctuate from flow parallel to the central axis, to flow in non-parallel
directions to
the central axis. The fluctuations are rapid, and thus many fluctuations may
occur
over a measurement period; however, over a measurement period, the
fluctuations tend to average to expected values, and thus have not heretofore
been identified as indicative of the presence of liquid.
[0043] In some embodiments, a parameter is calculated that is indicative of
the
cross-flow for a particular set of measurements, and the parameter is analyzed
against previously (or subsequently) calculated versions of the parameter
(e.g.,
within the same measurement period) to determine whether liquid is present in
the meter. In some embodiments, the standard deviation of the parameter (in
CA 02721966 2010-10-19
WO 2010/005614 PCT/US2009/041129
relation to a plurality of previously calculated versions) is taken, and if
the
standard deviation is above a predetermined threshold, then liquid is present
in
the meter. In yet still other embodiments, a magnitude of the difference
between
the parameter and previously calculated versions of the parameter is
calculated,
and if the difference is above a predetermined threshold, then liquid is
present in
the meter.
[0044] In embodiments that determine the presence of liquid by calculating
parameters being values indicative of cross-flow, and for four chord meters,
the
cross-flow parameter takes the form:
Cross Flow = VA + VC (3)
VB + VD
where VA is the flow velocity at an upper most chord, VB is the flow velocity
at an
upper-middle chord, Vc is the flow velocity at a lower-middle chord, and VD is
the
flow velocity at a lower most chord.
[0045] Consider, as an example, a measurement period of one second and a
four chord meter. As above, the flow meter may make a complete set (all four
chords) of flow velocity determinations in approximately 33 milliseconds, and
from
each set compute a value of the cross-flow. In accordance with at least some
embodiments, the standard deviation of the parameter is taken over a
measurement period (e.g., approximately 30 values in a one second
measurement period), and the standard deviation is compared against a
predetermined value. For example, if the standard deviation of the cross flow
is
above 0.08, then liquid is present in the flow meter, and the flow meter thus
takes
further action to alert the user/owner. In alternative embodiments, a
difference in
magnitude of the values of the asymmetry (e.g., between the largest value and
the smallest value) may be determined, and compared against a predetermined
values. If the difference in magnitude exceeds a predetermined value, then the
flow meter takes further action to alert the user/owner. These cases are
merely
examples, and longer or shorter measurement periods, and correspondingly
greater or fewer values, may be used in the determinations.
[0046] The various embodiments discussed to this point analyze a particular
parameter for the presence of liquid; however, in other embodiments the
various
parameters may be used in combination. For example, if the standard deviation
CA 02721966 2010-10-19
WO 2010/005614 PCT/US2009/041129
16
of cross flow is higher than normal (e.g., 0.2), but still below the
predetermined
threshold definitively indicating the presence of liquid, one of the
illustrative flow
velocity profile factors (e.g., profile factor, asymmetry) may be used to
verify the
presence or absence of liquid. Alternatively, even if a single parameter
indicates
liquid (e.g., profile factor and/or asymmetry), the flow meter may verify the
determination using another parameter (e.g., cross-flow). Thus, the various
parameters may be used in any combination to ascertain the presence or
absence of liquid in the flow meter.
[0047] Figure 6 illustrates a method in accordance with at least some
embodiments. In particular, the method starts (block 600) and proceeds to
flowing a gaseous substance through a central passage of a meter body (block
604). For example, the gaseous substance may be hydrocarbons in the form of
natural gas, but any gaseous substances may be used. The method then
proceeds to sending acoustic signals along respective chordal pathways across
the central passage, and none of the chordal pathways intersect a lower
portion
of the central passage where liquid, if present during flow of the gaseous
substance, accumulates (block 608). Based on transit times of the acoustic
signals along the respective chordal pathways, the method proceeds to
calculating a flow velocity of the gaseous substance proximate to each chordal
pathway (block 612). Then a determination is made as to the presence of a
liquid
accumulated in the lower portion based on the flow velocity proximate to each
chordal pathway (block 616), and the method ends (block 620). The
determination may take many forms. In some embodiments, a parameter
indicative of the flow velocity profile (e.g., profile factor, asymmetry) is
calculated
and analyzed. In yet still other embodiments, a parameter indicative of the
cross
flow within the flow meter is calculated and analyzed.
[0048] The discussion of the specification to this point has assumed that the
determination of the present of liquid takes place in the flow meter. However,
in
alternative embodiments the determination regarding liquid may take place in
other devices coupled to the flow meter. Figure 7 illustrates alternative
embodiments where another device, communicatively coupled to the flow meter,
makes the determination as to the presence or absence of liquid. In
particular,
CA 02721966 2010-10-19
WO 2010/005614 PCT/US2009/041129
17
Figure 7 illustrates a flow computer 700 coupled to a plurality flow meters
702.
The flow computer is configured to accumulate (i.e., maintain a running total)
of
fluid flow measured by each of the ultrasonic flow meters over a predetermined
period of time. Each of the flow meters 702 may be constructed and operated
substantially as described above. However, each meter 702 may be a different
size (i.e., each spool pieces defines a central passage of a different size).
For
example, a natural gas meter run at a power plant may comprise a plurality of
parallel and independent metering sections, each section optimized for
particular
range of natural gas flow rates. The flow computer 700 may thus accumulate
measured gas flows from each of the flow meters 502 to establish total natural
gas flow into the power plant.
[0049] The illustrative flow computer 700 comprises processor 704 coupled to a
RAM 706, ROM 708, communication port 710 and communication port 712. The
processor 704 is the device within which programs execute to perform the tasks
of accumulating flow volume, and also determining whether liquid is present in
any of the flow meters 702. The ROM 708 is a non-volatile memory which stores
operating system programs, as well as programs to implement the various
embodiments. The RAM 706 is the working memory for the processor 704, and
before execution some programs and/or data structures may be copied from the
ROM 708 to the RAM 704. In alternative embodiments, some programs and data
structures may be access directly from the ROM 708. The communication
port 710 is the mechanism by which the flow computer 700 communicates with
upstream devices, such as a data acquisition system. Likewise, communication
port 712 is the mechanism by which the flow computer 700 communicates with
the flow meters 702. In alternative embodiments, the flow computer may have an
individual communication port 712 for each ultrasonic flow meter 702, and in
yet
still other embodiments a single communication port may serve to communicate
both to the ultrasonic flow meters and the upstream devices. While the
processor 704, RAM 706, ROM 708 and communication ports 710, 712 are
illustrated as individual devices, in alternative embodiments microcontrollers
are
used, which microcontrollers integrally comprise a processing core, RAM, ROM
and communication ports.
CA 02721966 2010-10-19
WO 2010/005614 PCT/US2009/041129
18
[0050] In accordance with these embodiments, at least one of the flow
meters 702 is configured to send data indicative of liquid accumulations in a
lower
portion of the gas meter. In some cases the data sent to the flow computer 700
are electronic representations of the received acoustic energy. In other
cases,
the data sent to the flow computer 700 are representations of the gas flow
velocities proximate to each chordal pathway of the flow meter. In yet still
other
cases, the data sent to the flow computer 700 are parameters indicative of the
flow velocity profile within the flow meter. Correspondingly, the flow
computer 700, and particularly the processor 704 and communication port 712,
is
configured to receive the data. In accordance the illustrative embodiments,
the
flow computer 700 is configured to determine whether liquid is present in the
associated flow meter using any of the techniques described above. Thus, if a
flow meter has insufficient computing power to perform the calculations to
determine whether liquid is present, the computations may be performed by the
flow computer to which the meter couples.
[0051] From the description provided herein, those skilled in the art are
readily
able to combine software created as described with appropriate general-purpose
or special-purpose computer hardware to create a computer system and/or
computer subcomponents in accordance with the various embodiments, to create
a computer system and/or computer subcomponents for carrying out the methods
of the various embodiments, and/or to create a computer-readable media for
storing a software program to implement the method aspects of the various
embodiments.
[0052] The above discussion is meant to be illustrative of the principles and
various embodiments of the present invention. Numerous variations and
modifications will become apparent to those skilled in the art once the above
disclosure is fully appreciated. It is intended that the following claims be
interpreted to embrace all such variations and modifications.