Note: Descriptions are shown in the official language in which they were submitted.
CA 02725602 2010-11-24
WO 2008/143533 PCT/NZ2008/000118
1
PROGNOSIS PREDICTION FOR MELANOMA CANCER
RELATED APPLICATION
This application claims the benefit of New Zealand Provisional Patent
Application No. 555363
filed 24 May 2007, which is incorporated by reference herein in its entirety.
FIELD OF TIE INVENTION
This invention relates to methods and compositions for determining the
prognosis of cancer,
particularly melanoma, in a patient. Specifically, this invention relates to
the use of genetic and
proteomic markers for determining the prognosis of cancer, such as melanoma,
based on
prognostic signatures.
BACKGROUND OF THE INVENTION
In industrial nations, the incidence of melanoma has steadily risen over the
previous 25 years,
with the incidence in Australia being the highest in the world. Although the
perceived
"melanoma epidemic" most probably represents increased detection of thin
melanomas 2,
melanoma affects predominantly younger age groups resulting in a loss of
productive-life years
exceeded only by childhood malignancies and testicular cancer3'4. Melanoma is
largely
unresponsive to cytotoxic chemotherapy5, biological agents6'' and various
vaccination
strategies8. A small subgroup of patients appear to benefit from biological
and/or cytotoxic
chemotherapies, but identifying these patients a priori is currently
impossible, which necessitates
the exposure of many patients to substantial toxicities with a low probability
of benefit.
Once melanoma has metastasized to local lymph nodes, 70% of patients will die
within 5 years9.
The sub-group of patients with prolonged survival represents a unique cohort.
No current
adjuvant therapies offer an overall survival benefit, and while some
clinicians offer interferon-a
to improve disease-free survival10, many international centers offer no active
adjuvant treatment
outside clinical trials. Predicting which patients are likely to do well
regardless of the use of
adjuvant therapies would prevent needless toxicity, and enable the development
of better
therapeutic strategies targeting those more likely to obtain benefit. Better
stratification of
patients in adjuvant clinical trials will reduce both type I and type II
errors. The 12 year update
following the ECOG 1684 study and other randomized studies have demonstrated
that
interferon-a improves TTP but not overall survival in stage III melanomas' 10'
' . Inherent
heterogeneity within the patient populations, which are now well recognized
but unable to be
CA 02725602 2010-11-24
WO 2008/143533 PCT/NZ2008/000118
2
controlled for, may have confounded the promising effects on survival seen in
the initial ECOG
1684 study1 and other smaller phase 11 studies. Stratifying those patients
more likely to relapse
may balance this heterogeneity and allow treatments to be compared more
accurately.
There is a need for further tools to predict the prognosis of melanoma. This
invention provides
methods, compositions, kits, and devices based on prognostic cancer markers,
specifically
melanoma prognostic markers, to aid in the prognosis and treatment of cancer.
SUMMARY OF THE INVENTION
In certain embodiments there is provided a set of markers genes identified to
be differentially
expressed in melanomas with a good prognosis and melanomas with a poor
prognosis. This set
of genes can be used to generate prognostics signatures, comprising two or
more markers,
capable of predicting the speed of progression of melanoma in a patient.
The individual markers can be differentially expressed depending on whether
the tumour
progresses rapidly or not. The accuracy of prediction can be enhanced by
combining the
markers together into a prognostic signature, providing for much more
effective individual tests
than single-gene assays. Also provided for is the application of techniques,
such as statistics,
machine learning, artificial intelligence, and data mining to the prognostics
signatures to
generate prediction models. In another embodiment, expression levels of the
markers of a
particular prognostic signature in the tumour of a patient can then be applied
to the prediction
model to determine the prognosis.
In certain embodiments, the expression level of the markers can be established
using microarray
methods, quantitative polymerase chain reaction (qPCR), or immunoassays.
Specifically the present invention provides for a method for determining the
prognosis of
melanoma in a patient, comprising the steps of,
(i) determining the expression level of a melanoma prognostic marker (MPM), or
of a
prognostic signature comprising two or more MPMs, in a melanoma tumour sample
from
the patient,
(ii) applying a predictive model, established by applying a predictive method
to
expressions levels of the MPM or the predictive signature in prognostically
good and poor
tumour samples,
CA 02725602 2010-11-24
WO 2008/143533 PCT/NZ2008/000118
3
(iii) establishing a prognosis.
Alternatively the present invention also provides for a method for determining
the suitability of a
melanoma patient for a drug trial, comprising the steps of;
(i) determining the expression level of an MPM, or of a prognostic signature
comprising
two or more MPMs, in a melanoma tumour sample from the patient,
(ii) applying a predictive model, established by applying a predictive method
to
expressions levels of the MPM or predictive signature in prognostically good
and poor
tumour samples,
(iii) establishing the suitability of the patient to the trial.
The MPMs according to the methods can be selected from table 1. The predictive
method is
selected from the group consisting of linear models, support vector machines,
neural networks,
classification and regression trees, ensemble learning methods, discriminant
analysis, nearest
neighbor method, bayesian networks, independent components analysis.
Determining the expression level of a MPM or a prognostic signature can be
carried out by
detecting the expression level of mRNA of each gene, for example using qPCR
method using a
forward primer and a reverse primer. Determining the expression level of an
MPM or a
prognostic signature can also be carried out by detecting the expression level
of cDNA of each
gene, for example by using a nucleotide complementary to at least a portion of
said cDNA,
Further the expression level of an MPM or a prognostic signature can be
determined by detecting
the expression level of the protein of each marker, or by detecting the
expression level of the
peptide of each marker, for example by using an antibody directed against each
marker, such as a
monoclonal antibody or a polyclonal antiserum. A sandwich-type immunoassay
method or
ELISA assay could be used.
The present invention also provides for a prognostic signature for determining
the risk of
progression of melanoma, comprising two or more melanoma prognostic markers
(MPMs). The
MPMs of the prognostic signature can be selected from table 1.
In another aspect, the present invention provides for a device for determining
prognosis of
melanoma, comprising:
CA 02725602 2010-11-24
WO 2008/143533 PCT/NZ2008/000118
4
a substrate having one or more locations thereon, each location having two or
more
oligonucleotides thereon, each oligonucleotide selected from the one or more
MPMs.
The two or more oligonucleotides can be MPMs selected from table 1.
The present invention also provides for the use of a reagent for detecting the
expression of a
MPM, or of a prognostic signature comprising two or more MPMs, in the
manufacture of a kit
for predicting the prognosis of melanoma in a patient. The MPMs can be
selected from table 1.
The reagent can detect the level of expression of the one or more MPMs by
detecting expression
of MPM mRNA or MPM cDNA. The reagent can be an oligonucleotide complementary
to at
least a portion of the MPM mRNA or cDNA. Alternatively the reagent can detect
the level of
expression of the one or more MPMs by detecting expression of a MPM protein or
peptide. The
reagent can be an antibody, such as a monoclonal antibody of polyclonal
antiserum.
The kit may be suitable for undertaking a sandwich-type immunoassay or an
ELISA assay.
BRIEF DESCRIPTION OF THE FIGURES
This invention is described with reference to specific embodiments thereof and
with reference to
the figures, in which:
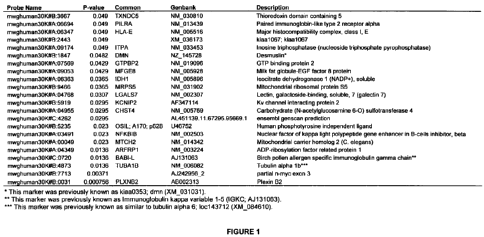
Figure 1 depicts the 22 genes used to build predictive scores ("melanoma
markers").
Genes were selected using a Mann-Whitney test.
Figure 2 depicts the Gene Ontology groupings of the differentially expressed
genes and
associated significance. The most significant ontologies are determined by the
number of genes
which overlap between categories i.e the likelihood that it is a co-incidence
that this many genes
were in both the gene list and the category.
Figure 3 Experimental schema comprising a training set and two independent
applied to
Validation Set A using the qPS and Set B using the aPS. The training set was
used to develop
predictive genes which were then applied to Validation Set A using the qPS and
Set B using the
aPS.
CA 02725602 2010-11-24
WO 2008/143533 PCT/NZ2008/000118
Figure 4 depicts RNA used to create the Reference cDNA used in both the array
experiments and as a comparator in qPCR assays.
Figure 5 depicts the assays used for qPCR using Universal Probe Library
Probes.
Figure 6 depicts the patient characteristics for the test set and validation
set A.
Figure 7 depicts Principal Components Analysis using all genes (A) and
differentially
expressed genes (B), demonstrating the ability of the 15 genes to segregate
the good (filled
boxes) from the poor (unfilled boxes) prognostic groups. These genes were used
to develop the
array and qPCR based predictors.
Figure 8 depicts the application of the aPS (a-b) and qPS (c-d) in the
training set
demonstrating its correlation with TTP and overall survival. The aPS used only
the 15 genes
with the strongest correlation between the array data and qPCR data and the
qPS used the five
genes with the greatest ability to separate the two groups.
Figure 9 depicts the qPS logistic regression algorithm applied to the training
set and
validation set A. A horizontal line is drawn at mean values.
Figure 10 depicts the distribution of the qPS scores from the good and poor
prognostic
groups of third independent set.
DETAILED DESCRIPTION
Definitions
Before describing embodiments of the invention in detail, it will be useful to
provide some
definitions of terms used herein.
The term "marker" refers to a molecule that is associated quantitatively or
qualitatively with the
presence of a biological phenomenon. Examples of "markers" include a
polynucleotide, such as
a gene or gene fragment, RNA or RNA fragment; or a gene product, including a
polypeptide such
as a peptide, oligopeptide, protein, or protein fragment; or any related
metabolites, by products,
or any other identifying molecules, such as antibodies or antibody fragments,
whether related
directly or indirectly to a mechanism underlying the phenomenon. The markers
of the invention
CA 02725602 2010-11-24
WO 2008/143533 PCT/NZ2008/000118
6
include the nucleotide sequences (e.g., GenBank sequences) as disclosed
herein, in particular, the
full-length sequences, any coding sequences, any fragments, or any complements
thereof, and
any measurable marker thereof as defined above.
The terms "MPM" or "melanoma prognostic marker" or "MPM family member" refer
to a
marker with altered expression that is associated with a particular prognosis,
e.g., a higher or
lower likelihood of a cancer progressing to a more advanced stage, as
described herein, but can
exclude molecules that are known in the prior art to be associated with
prognosis of melanoma.
It is to be understood that the term MPM does not require that the marker be
specific only for
melanomas. Rather, expression of an MPM can be altered in other types of
tumours, including
malignant tumours.
The terms "prognostic signature," "signature," and the like refer to a set of
two or more markers,
for example MPMs, that when analysed together as a set allow for the
determination of or
prediction of an event, for example the prognostic outcome of melanoma. The
use of a signature
comprising two or more markers reduces the effect of individual variation and
allows for a more
robust prediction. Non-limiting examples of MPMs are set fourth in XX. In the
context of the
present invention, reference to "at least one," "at least two," "at least
five," etc., of the markers
listed in any particular set (e.g., any signature) means any one or any and
all combinations of the
markers listed.
The term "prediction method" is defined to cover the broader genus of methods
from the fields
of statistics, machine learning, artificial intelligence, and data mining,
which can be used to
specify a prediction model. The term also includes any method suitable for
predicting an
outcome, and includes the methods of not only using complex analysis of
multiple markers, but
also the direct comparison of the expression of a single marker or signature
to that of a control
tissue, or to a predetermined threshold, in order to predict an outcome. These
are discussed
further in the Detailed Description section.
The term "prediction model" refers to the specific mathematical model obtained
by applying a
prediction method to a collection of data. In the examples detailed herein,
such data sets consist
of measurements of gene activity in tissue samples taken from melanoma
patients with a good or
poor prognosis, for which the class (good or poor) of each sample is known.
Such models can be
used to (1) classify a sample of unknown prognosis status as being one of good
or poor, or (2)
CA 02725602 2010-11-24
WO 2008/143533 PCT/NZ2008/000118
7
make a probabilistic prediction (i.e., produce either a proportion or
percentage to be interpreted
as a probability) which represents the likelihood that the unknown sample has
a good prognosis,
based on the measurement of mRNA expression levels or expression products, of
a specified
collection of genes, in the unknown sample. The exact details of how these
gene-specific
measurements are combined to produce classifications and probabilistic
predictions are
dependent on the specific mechanisms of the prediction method used to
construct the model.
The term also includes any model suitable for predicting an outcome, and
includes the models
not only using complex analysis of multiple markers, but also models involving
the direct
comparison of the expression of a single marker or signature to that of a
control tissue, or to a
predetermined threshold, in order to predict an outcome.
"Sensitivity", "specificity" (or "selectivity"), and "classification rate",
when applied to describing
the effectiveness of prediction models mean the following:
"Sensitivity" means the proportion of truly positive samples that are also
predicted (by the
model) to be positive. In a test for prognosis of melanoma, that would be the
proportion of
tumours that have a good prognosis predicted by the model to be good.
"Specificity" or
"selectivity" means the proportion of truly negative samples that are also
predicted (by the
model) to be negative. In a test for the prognosis of melanoma, this equates
to the proportion of
samples that have a poor prognosis that are predicted to by poor by the model.
"Classification
Rate" is the proportion of all samples that are correctly classified by the
prediction model (be that
as positive or negative).
As used herein "antibodies" and like terms refer to imrunoglobulin molecules
and
immunologically active portions of immunoglobulin (Ig) molecules, i.e.,
molecules that contain
an antigen binding site that specifically binds (immunoreacts with) an
antigen. These include,
but are not limited to, polyclonal, monoclonal, chimeric, single chain, Fc,
Fab, Fab', and Fab2
fragments, and a Fab expression library. Antibody molecules relate to any of
the classes IgG,
IgM, IgA, IgE, and IgD, which differ from one another by the nature of heavy
chain present in
the molecule. These include subclasses as well, such as IgGI, IgG2, and
others. The light chain
may be a kappa chain or a lambda chain. Reference herein to antibodies
includes a reference to
all classes, subclasses, and types. Also included are chimeric antibodies, for
example,
monoclonal antibodies or fragments thereof that are specific to more than one
source, e.g., a
mouse or human sequence. Further included are camelid antibodies, shark
antibodies or
nanobodies.
CA 02725602 2010-11-24
WO 2008/143533 PCT/NZ2008/000118
8
The terms "cancer" and "cancerous" refer to or describe the physiological
condition in mammals
that is typically characterized by abnormal or unregulated cell growth. Cancer
and cancer
pathology can be associated, for example, with metastasis, interference with
the normal
functioning of neighbouring cells, release of cytokines or other secretory
products at abnormal
levels, suppression or aggravation of inflammatory or immunological response,
neoplasia,
premalignancy, malignancy, invasion of surrounding or distant tissues or
organs, such as lymph
nodes, etc. Specifically included are melanomas.
The term "melanoma" refers to a tumor originating from melanocytes which are
found in skin but
also other sites such as oral and anogenital mucosal surfaces, esophagus,
meninges and the eye.
These tumors are able to metastasize to any organ.
The terms "differentially expressed," "differential expression," and like
phrases, refer to a gene
marker whose expression is activated to a higher or lower level in a subject
(e.g., test sample)
having a condition, specifically cancer, such as melanoma, relative to its
expression in a control
subject (e.g., reference sample). The terms also include markers whose
expression is activated to
a higher or lower level at different stages of the same condition; in diseases
with a good or poor
prognosis; or in cells with higher or lower levels of proliferation. A
differentially expressed
marker may be either activated or inhibited at the polynucleotide level or
polypeptide level, or
may be subject to alternative splicing to result in a different polypeptide
product. Such
differences may be evidenced by a change in mRNA levels, surface expression,
secretion or other
partitioning of a polypeptide, for example.
Differential expression may include a comparison of expression between two or
more markers
(e.g., genes or their gene products); or a comparison of the ratios of the
expression between two
or more markers (e.g., genes or their gene products); or a comparison of two
differently
processed products (e.g., transcripts or polypeptides) of the same marker,
which differ between
normal subjects and diseased subjects; or between various stages of the same
disease; or between
diseases having a good or poor prognosis; or between cells with higher and
lower levels of
proliferation; or between normal tissue and diseased tissue, specifically
cancer, or melanoma.
Differential expression includes both quantitative, as well as qualitative,
differences in the
temporal or cellular expression pattern in a gene or its expression products
among, for example,
normal and diseased cells, or among cells which have undergone different
disease events or
disease stages, or cells with different levels of proliferation.
CA 02725602 2010-11-24
WO 2008/143533 PCT/NZ2008/000118
9
The term "expression" includes production of polynucleotides and polypeptides,
in particular, the
production of RNA (e.g., mRNA) from a gene or portion of a gene, and includes
the production
of a polypeptide encoded by an RNA or gene or portion of a gene, and the
appearance of a
detectable material associated with expression. For example, the formation of
a complex, for
example, from a polypeptide-polypeptide interaction, polypeptide-nucleotide
interaction, or the
like, is included within the scope of the term "expression". Another example
is the, binding of a
binding ligand, such as a hybridization probe or antibody, to a gene or other
polynucleotide or
oligonucleotide, a polypeptide or a protein fragment, and the visualization of
the binding ligand.
Thus, the intensity of a spot on a microarray, on a hybridization blot such as
a Northern blot, or
on an immunoblot such as a Western blot, or on a bead array, or by PCR
analysis, is included
within the term "expression" of the underlying biological molecule.
The terms "expression threshold," and "defined expression threshold" are used
interchangeably
and refer to the level of a marker in question outside which the
polynucleotide or polypeptide
serves as a predictive marker for patient survival. The threshold will be
dependent on the
predictive model established are derived experimentally from clinical studies
such as those
described in the Examples below. Depending on the prediction model used, the
expression
threshold may be set to achieve maximum sensitivity, or for maximum
specificity, or for
minimum error (maximum classification rate). For example a higher threshold
may be set to
achieve minimum errors, but this may result in a lower sensitivity. Therefore,
for any given
predictive model, clinical studies will be used to set an expression threshold
that generally
achieves the highest sensitivity while having a minimal error rate. The
determination of the
expression threshold for any situation is well within the knowledge of those
skilled in the art.
The term "long-term survival" is used herein to refer to survival for at least
5 years, more
preferably for at least 8 years, most preferably for at least 10 years
following surgery or other
treatment.
The term "microarray" refers to an ordered or unordered arrangement of capture
agents,
preferably polynucleotides (e.g., probes) or polypeptides on a substrate. See,
e.g., Microarray
Analysis, M. Schena, John Wiley & Sons, 2002; Microarray Biochip Technology,
M. Schena,
ed., Eaton Publishing, 2000; Guide to Analysis of DNA Microarray Data, S.
Knudsen, John
Wiley & Sons, 2004; and Protein Microarray Technology, D. Kambhampati, ed.,
John Wiley &
Sons, 2004.
CA 02725602 2010-11-24
WO 2008/143533 PCT/NZ2008/000118
The term "oligonucleotide" refers to a polynucleotide, typically a probe or
primer, including,
without limitation, single-stranded deoxyribonucleotides, single- or double-
stranded
ribonucleotides, RNA: DNA hybrids, and double-stranded DNAs. Oligonucleotides,
such as
single-stranded DNA probe oligonucleotides, are often synthesized by chemical
methods, for
example using automated oligonucleotide synthesizers that are commercially
available, or by a
variety of other methods, including in vitro expression systems, recombinant
techniques, and
expression in cells and organisms.
The term "polynucleotide," when used in the singular or plural, generally
refers to any
polyribonucleotide or polydeoxribonucleotide, which may be unmodified RNA or
DNA or
modified RNA or DNA. This includes, without limitation, single- and double-
stranded DNA,
DNA including single- and double- stranded regions, single- and double-
stranded RNA, and
RNA including single- and double-stranded regions, hybrid molecules comprising
DNA and
RNA that may be single-stranded or, more typically, double-stranded or include
single- and
double-stranded regions. Also included are triple-stranded regions comprising
RNA or DNA or
both RNA and DNA. Specifically included are mRNAs, cDNAs, and genomic DNAs,
and any
fragments thereof. The term includes DNAs and RNAs that contain one or more
modified bases,
such as tritiated bases, or unusual bases, such as inosine. The
polynucleotides of the invention
can encompass coding or non-coding sequences, or sense or antisense sequences.
It will be
understood that each reference to a "polynucleotide" or like term, herein,
will include the full-
length sequences as well as any fragments, derivatives, or variants thereof.
"Polypeptide," as used herein, refers to an oligopeptide, peptide, or protein
sequence, or fragment
thereof, and to naturally occurring, recombinant, synthetic, or semi-synthetic
molecules. Where
"polypeptide" is recited herein to refer to an amino acid sequence of a
naturally occurring protein
molecule, "polypeptide" and like terms, are not meant to limit the amino acid
sequence to the
complete, native amino acid sequence for the full-length molecule. It will be
understood that
each reference to a "polypeptide" or like term, herein, will include the full-
length sequence, as
well as any fragments, derivatives, or variants thereof.
The term "prognosis" refers to a prediction of medical outcome, for example, a
poor or good
outcome (e.g., likelihood of long-term survival); a negative prognosis, or
poor outcome, includes
a prediction of relapse, disease progression (e.g., tumour growth or
metastasis, or drug
CA 02725602 2010-11-24
WO 2008/143533 PCT/NZ2008/000118
11
resistance), or mortality; a positive prognosis, or good outcome, includes a
prediction of disease
remission, (e.g., disease-free status), amelioration (e.g., tumour
regression), or stabilization.
The term "proliferation" refers to the processes leading to increased cell
size or cell number, and
can include one or more of: tumour or cell growth, angiogenesis, innervation,
and metastasis.
The term "qPCR" or "QPCR" refers to quantative polymerase chain reaction as
described, for
example, in PCR Technique: Quantitative PCR, J.W. Larrick, ed., Eaton
Publishing, 1997, and
A-Z of Quantitative PCR, S. Bustin, ed., IUL Press, 2004.
The term "tumour" refers to all neoplastic cell growth and proliferation,
whether malignant or
benign, and all pre-cancerous and cancerous cells and tissues.
"Stringency" of hybridization reactions is readily determinable by one of
ordinary skill in the art,
and generally is an empirical calculation dependent upon probe length, washing
temperature, and
salt concentration. In general, longer probes require higher temperatures for
proper annealing,
while shorter probes need lower temperatures. Hybridization generally depends
on the ability of
denatured DNA to reanneal when complementary strands are present in an
environment below
their melting temperature. The higher the degree of desired homology between
the probe and
hybridisable sequence, the higher the relative temperature which can be used.
As a result, it
follows that higher relative temperatures would tend to make the reaction
conditions more
stringent, while lower temperatures less so. Additional details and
explanation of stringency of
hybridization reactions, are found e.g., in Ausubel et al., Current Protocols
in Molecular Biology,
Wiley Interscience Publishers, (1995).
"Stringent conditions" or "high stringency conditions", as defined herein,
typically: (1) employ
low ionic strength and high temperature for washing, for example 0.015 M
sodium
chloride/0.0015 M sodium citrate/0.1% sodium dodecyl sulfate at 50 C; (2)
employ a denaturing
agent during hybridization, such as formamide, for example, 50% (v/v)
formamide with 0.1%
bovine serum albumin/0.1 % FicolUO.1 % polyvinylpyrrolidone/50 mM sodium
phosphate buffer
at pH 6.5 with 750 mM sodium chloride, 75 mM sodium citrate at 42 C; or (3)
employ 50%
formamide, 5X SSC (0.75 M NaCl, 0.075 M sodium citrate), 50 mM sodium
phosphate (pH 6.8),
0.1% sodium pyrophosphate, 5X, Denhardt's solution, sonicated salmon sperm DNA
(50 g/ml),
0.1% SDS, and 10% dextran sulfate at 42 C, with washes at 42 C in 0.2X SSC
(sodium
CA 02725602 2010-11-24
WO 2008/143533 PCT/NZ2008/000118
12
chloride/sodium citrate) and 50% formamide at 55 C, followed by a high-
stringency wash
comprising 0.1 X SSC containing EDTA at 55 C.
"Moderately stringent conditions" may be identified as described by Sambrook
et at., Molecular
Cloning: A Laboratory Manual, New York: Cold Spring Harbor Press, 1989, and
include the use
of washing solution and hybridization conditions (e. g., temperature, ionic
strength, and % SDS)
less stringent that those described above. An example of moderately stringent
conditions is
overnight incubation at 37 C in a solution comprising: 20% formamide, 5X SSC
(150 mM NaCl,
15 mM trisodium citrate), 50 mM sodium phosphate (pH 7.6), 5X Denhardt's
solution, 10%
dextran sulfate, and 20 mg/ml denatured sheared salmon sperm DNA, followed by
washing the
filters in IX SSC at about 37-50 C. The skilled artisan will recognize how to
adjust the
temperature, ionic strength, etc. as necessary to accommodate factors such as
probe length and
the like.
The practice of the present invention will employ, unless otherwise indicated,
conventional
techniques of molecular biology (including recombinant techniques),
microbiology, cell biology,
and biochemistry, which are within the skill of the art. Such techniques are
explained fully in the
literature, such as, Molecular Cloning: A Laboratory Manual, 2nd edition.
Sambrook et al., 1989;
Oligonucleotide Synthesis, MJ Gait, ed., 1984; Animal Cell Culture, R.I.
Freshney, ed., 1987;
Methods in Enzymology, Academic Press, Inc.; Handbook of Experimental
Immunology, 4th
edition, D M. Weir & CC. Blackwell, eds., Blackwell Science Inc., 1987; Gene
Transfer Vectors
for Mammalian Cells, J.M. Miller & M.P. Calos, eds., 1987; Current Protocols
in Molecular
Biology, F.M. Ausubel et al., eds., 1987; and PCR: The Polymerase Chain
Reaction, Mullis et al.,
eds., 1994.
Description of Embodiments of the Invention
The present invention discloses the use of microarrays to identify and
determine the specific
prognostic role of specific prognostic markers and signatures in melanoma. The
microarray-
based studies shown herein establish markers that can be used to predict a
good or poor
prognosis for a patient with melanoma. In particular the microarray-based
studies and qPCR
analysis shown herein indicate that particular differentially expressed genes
can be used as
prognostic signatures that are associated with a particular prognosis.The
invention can therefore
be used to identify patients who are likely to have aggressive disease.
CA 02725602 2010-11-24
WO 2008/143533 PCT/NZ2008/000118
13
The present invention provides for markers for the determination of disease
prognosis. Using the
methods of the invention, it has been found that markers are associated with
the prognosis of
melanoma, and can be used to predict outcome. Microarray analysis of samples
taken from
patients with various stages of melanoma has led to the surprising discovery
that specific patterns
of marker expression are associated with prognosis of the cancer. The present
invention
therefore provides for a set of genes, outlined in Table 1, that are
differentially -expressed in
melanomas with a good or poor outcome. The genes outlined in Table 1 provide
for a set of
melanoma prognostic markers (MTMs).
A decrease in certain melanoma prognostic markers (MPMs), for example, can be
indicative of a
particular prognosis. Conversely, an increase in other MPMs is indicative of a
particular
prognosis. A particular prognosis can include the speed of disease
progression. A decrease or
increase in expression can be determined, for example, by comparison of a test
sample, e.g.,
patient's tumour sample, to a reference sample, e.g., a sample associated with
a known
prognosis. In particular, one or more samples from patient(s) with a good
prognosis could be
used as a reference sample.
For example, to obtain a prognosis, expression levels in a patient's sample
(e.g., tumour sample)
can be compared to samples from patients with a known outcome. If the
patient's sample shows
increased or decreased expression of one or more MPMs that compares to samples
with poor
outcome (a rapid disease progression), then a poor prognosis is implicated. If
the patient's
sample shows expression of one or more MPMs that is comparable to samples with
good
outcome (a slow disease progression) then a positive prognosis, or good
prognosis, is implicated.
As further examples, the expression levels of a prognostic signature
comprising two or more
MPMs from a patient's sample (e.g., tumour sample) can be compared to samples
of cancers
known to have good or poor prognosis. If the patient's sample shows increased
or decreased
expression of MPMs by comparison to samples with good prognosis, and/or
comparable
expression to samples of poor prognosis, then a negative prognosis is
implicated. If the patient's
sample shows expression of MPMs that is comparable to samples of a good
prognosis, and/or
lower or higher expression than samples with a poor prognosis, then a
positive, or good,
prognosis is implicated.
CA 02725602 2010-11-24
WO 2008/143533 PCT/NZ2008/000118
14
As one approach, a prediction method can be applied to a panel of markers, for
example the
panel of MPMs outlined in Table 1, in order to generate a predictive model.
This involves the
generation of a prognostic signature, comprising two or more MPMs.
The disclosed MPMs in Table I therefore provide a useful set of markers to
generate prediction
signatures for determining the prognosis of cancer, and establishing a
treatment regime, or
treatment modality, specific for that tumour. In particular, a positive
prognosis can be used by a
patient to decide to pursue particular treatment options. A negative prognosis
can be used by a
patient to decide to terminate treatment or to pursue highly aggressive or
experimental
treatments. In addition, a patient can chose treatments based on their
prognosis predicted from
the expression of prognostic markers (e.g., MPMs).
Levels of MPMs can be detected in tumour tissue, tissue proximal to the
tumour, lymph node
samples, blood samples, serum samples, urine samples, or faecal samples, using
any suitable
technique, and can include, but is not limited to, oligonucleotide probes,
quantitative PCR, or
antibodies raised against the markers. It will be appreciated that by
analyzing the presence and
amounts of expression of a plurality of MPMs in the form of prediction
signatures, and
constructing a prognostic signature, the sensitivity and accuracy of prognosis
will be increased.
Therefore, multiple markers according to the present invention can be used to
determine the
prognosis of a cancer.
The invention includes the use of archived paraffin-embedded biopsy material
for assay of the
markers in the set, and therefore is compatible with the most widely available
type of biopsy
material. It is also compatible with several different methods of tumour
tissue harvest, for
example, via core biopsy or fine needle aspiration. In certain aspects, RNA is
isolated from a
fixed, wax-embedded cancer tissue specimen of the patient. Isolation may be
performed by any
technique known in the art, for example from core biopsy tissue or fine needle
aspirate cells.
In one aspect, the invention relates to a method of predicting a prognosis,
e.g., the likelihood of
long-term survival of a cancer patient following treatment, comprising
determining the
expression level of one or more prognostic markers or their expression
products in a sample
obtained from the patient, normalized against the expression level of other
RNA transcripts or
their products in the sample, or of a reference set of RNA transcripts or
their expression products.
CA 02725602 2010-11-24
WO 2008/143533 PCT/NZ2008/000118
In specific aspects, the prognostic marker is one or more markers listed in
Table 1, or is included
as one or more of the prognostic signatures derived from the markers listed in
Table 1.
In further aspects, the expression levels of the prognostic markers or their
expression products are
determined, e.g., for the markers listed in Table I and a prognostic signature
derived from the
markers listed in Table 1. In another aspect, the method comprises the
determination of the
expression levels of a full set of prognosis markers or their expression
products, e.g., for the
markers listed in Table 1, or, a prognostic signature derived from the markers
listed in Table 1.
In an additional aspect, the invention relates to an array (e.g., microarray)
comprising
polynucleotides hybridizing to two or more markers, e.g., for the markers
listed in Table 1, or a
prognostic signature derived from the markers listed in Table 1. In particular
aspects, the array
comprises polynucleotides hybridizing to prognostic signature derived from the
markers listed in
Table 1. In another specific aspect, the array comprises polynucleotides
hybridizing to the full
set of markers, e.g., for the markers listed in Table 1.
For these arrays, the polynucleotides can be cDNAs, or oligonucleotides, and
the solid surface on
which they are displayed can be glass, for example. The polynucleotides can
hybridize to one or
more of the markers as disclosed herein, for example, to the full-length
sequences, any coding
sequences, any fragments, or any complements thereof. In particular aspects,
an increase or
decrease in expression levels of one or more MPM indicates a decreased
likelihood of long-term
survival, e.g., due to cancer recurrence, while a lack of an increase or
decrease in expression
levels of one or more MPM indicates an increased likelihood of long-term
survival without
cancer recurrence.
CA 02725602 2010-11-24
WO 2008/143533 PCT/NZ2008/000118
16
Table 1: Melanoma Predictive Markers
Description P-value Common Genbank
Thioredoxin domain containing 5 0.049 TXNDC5 NM 030810
Paired immunoglobin-like type 2 receptor 0.049 PILRA NM_013439
alpha
Major histocompatibility complex, class I, 0.049 HLA-E NM_005516
E
kiaa 1067; kiaa 1067 0.049 XM 036173
Inosine triphosphatase (nucleoside 0.049 ITPA NM_033453
tri hos hate ro hos hatase
Desmuslin* 0,0482 DMN NM 145728
GTP binding protein 2 0.0429 GTPBP2 NM 019096
Milk fat globule-EGF factor 8 protein 0.0429 MFGE8 NM 005928
Isocitrate dehydrogenase 1 (NADP+), 0.0365 IDH1 NM_005896
soluble
Mitochondrial ribosomal protein S5 0.0365 MRPS5 NM 031902
Lectin, galactoside-binding, soluble, 7 0.0307 LGALS7 NM_002307
(galectin 7)
Kv channel interacting protein 2 0.0295 KCNIP2 AF347114
Carbohydrate (N-acetylglucosamine 6-0) 0.02.95 CHST4 NM 005769
sulfotransferase 4
ensembl genscan prediction 0.0295 AL451139.11.67295.95669.1
Human phosphotyrosine independent 0.023 OSIL; A170; U46752
ligand 62B
Nuclear factor of kappa light polypeptide 0.023 NFKBIB NM002503
gene enhancer in B-cells inhibitor, beta
Mitochondrial carrier homolog 2 (C. 0.023 MTCH2 NM_014342
ele ans
ADP-ribos lation factor related protein 1 0.0136 ARFRP1 NM 003224
birch pollen allergen specific 0.0136 BABI-L AJ131063
immunoglobulin gamma chain"
Tubulin alpha 1b*'* 0.0136 TUBA1B NM 006082
partial n-myc exon 3 0.00371 AJ242956 2
Plexin B2 0.000756 PLXNB2 AB002313
* This marker was previously known as kiaa0353; dmn (XM_031031).
** This marker was previously known as Immunoglobulin kappa variable 1-5
(IGKC; AJI31063).
*** This marker was previously known as similar to tubulin alpha 6; loc 143712
(XM_084610).
General approaches to prognostic marker detection
The following approaches are non-limiting methods that can be used to detect
the proliferation
markers, including MPM family members: microarray approaches using
oligonucleotide probes
selective for a MPM; real-time qPCR on tumour samples using MPM specific
primers and
probes; real-time qPCR on lymph node, blood, serum, faecal, or urine samples
using MPM
specific primers and probes; enzyme-linked immunological assays (ELISA);
immunohistochemistry using anti-marker antibodies; and analysis of array or
qPCR data using
computers.
CA 02725602 2010-11-24
WO 2008/143533 PCT/NZ2008/000118
17
Other useful methods include northern blotting and in situ hybridization
(Parker and Barnes,
Methods in Molecular Biology 106: 247-283 (1999)); RNase protection assays
(Hod,
BioTechniques 13: 852-854 (1992)); reverse transcription polymerase chain
reaction (RT-PCR;
Weis et al., Trends in Genetics 8: 263-264 (1992)); serial analysis of gene
expression (SAGE;
Velculescu et al., Science 270: 484-487 (1995); and Velculescu et al.,. Cell
88: 243-51 (1997)),
MassARRAY technology (Sequenom, San Diego, CA), and gene expression analysis
by
massively parallel signature sequencing (MPSS; Brenner et al., Nature
Biotechnology 18: 630-
634 (2000)). Alternatively, antibodies may be employed that can recognize
specific complexes,
including DNA duplexes, RNA duplexes, and DNA-RNA hybrid duplexes or DNA-
polypeptide
duplexes.
Primary data can be collected and fold change analysis can be performed, for
example, by
comparison of marker expression levels in tumour tissue and non-tumour tissue;
by comparison
of marker expression levels to levels determined in recurring tumours and non-
recurring
tumours; by comparison of marker expression levels to levels determined in
tumours with or
without metastasis; by comparison of marker expression levels to levels
determined in
differently staged tumours; or by comparison of marker expression levels to
levels determined in
cells with different levels of proliferation. A negative or positive prognosis
is determined based
on this analysis. Further analysis of tumour marker expression includes
matching those markers
exhibiting increased or decreased expression with expression profiles of known
melanoma
turnours to provide a prognosis.
A threshold for concluding that expression is increased will be dependent on
the particular
marker and also the particular predictive model that is to be applied. The
threshold is generally
set to achieve the highest sensitivity and selectivity with the lowest error
rate, although variations
may be desirable for a particular clinical situation. The desired threshold is
determined by
analysing a population of sufficient size taking into account the statistical
variability of any
predictive model and is calculated from the size of the sample used to produce
the predictive
model. The same applies for the determination of a threshold for concluding
that expression is
decreased. It can be appreciated that other thresholds, or methods for
establishing a threshold,
for concluding that increased or decreased expression has occurred can be
selected without
departing from the scope of this invention.
CA 02725602 2010-11-24
WO 2008/143533 PCT/NZ2008/000118
18
It is also possible that a prediction model may produce as it's output a
numerical value, for
example a score, likelihood value or probability. In these instances, it is
possible to apply
thresholds to the results produced by prediction models, and in these cases
similar principles
apply as those used to set thresholds for expression values.
Once the expression level, or output of a prediction model, of a predictive
signature in a tumour
sample has been obtained, the likelihood of the cancer recurring can then be
determined.
From the markers identified, prognostic signatures comprising one or more MPMs
can be used to
determine the prognosis of a cancer, by comparing the expression level of the
one or more
markers to the disclosed prognostic signature. By comparing the expression of
one or more of
the MPMs in a tumour sample with the disclosed prognostic signature, the
likelihood of the
cancer recurring can be determined. The comparison of expression levels of the
prognostic
signature to establish a prognosis can be done by applying a predictive model
as described
previously.
Determining the likelihood of the cancer recurring is of great value to the
medical practitioner.
A high likelihood a tumour not responding to treatment means that a longer or
higher dose
treatment should be considered or treatment may not be given at all. An
accurate prognosis is
also of benefit to the patient. It allows the patient, along with their
partners, family, and friends
to also make decisions about treatment, as well as decisions about their
future and lifestyle
changes. Therefore, the invention also provides for a method establishing a
treatment regime for
a particular cancer based on the prognosis established by matching the
expression of the markers
in a tumour sample with the differential expression signature.
It will be appreciated that the marker selection, or construction of a
prognostic signature, does
not have to be restricted to the MPMs disclosed in Table 1 herein, but could
involve the use of
one or more MPMs from the disclosed signatures, or a new signature may be
established using
MPMs selected from the disclosed marker lists. The requirement of any
signature is that it
predicts the likelihood of rapid disease progression with enough accuracy to
assist a medical
practitioner to establish a treatment regime.
CA 02725602 2010-11-24
WO 2008/143533 PCT/NZ2008/000118
19
Reverse Transcription PCR (RT-PCR)
Of the techniques listed above, the most sensitive and most flexible
quantitative method is RT-
PCR, which can be used to compare RNA levels in different sample populations,
in normal and
tumour tissues, with or without drug treatment, to characterize patterns of
expression, to
discriminate between closely related RNAs, and to analyze RNA structure.
For RT-PCR, the first step is the isolation of RNA from a target sample. The
starting material is
typically total RNA isolated from human tumours or tumour cell lines, and
corresponding
normal tissues or cell lines, respectively. RNA can be isolated from a variety
of samples, such as
tumour samples from breast, lung, colon (e.g., large bowel or small bowel),
skin, colorectal,
gastric, esophageal, anal, rectal, prostate, brain, liver, kidney, pancreas,
spleen, thymus, testis,
ovary, uterus, etc., tissues, from primary tumours, or tumour cell lines, and
from pooled samples
from healthy donors. If the source of RNA is a tumour, RNA can be extracted,
for example,
from frozen or archived paraffin-embedded and fixed (e.g., formalin-fixed)
tissue samples.
The first step in gene expression profiling by RT-PCR is the reverse
transcription of the RNA
template into cDNA, followed by its exponential amplification in a PCR
reaction. The two most
commonly used reverse transcriptases are avian myeloblastosis virus reverse
transcriptase
(AMV-RT) and Moloney murine leukaemia virus reverse transcriptase (M]ALV-RT).
The
reverse transcription step is typically primed using specific primers, random
hexamers, or oligo-
dT primers, depending on the circumstances and the goal of expression
profiling. For example,
extracted RNA can be reverse-transcribed using a GeneAmp RNA PCR kit (Perkin
Elmer, CA,
USA), following the manufacturer's instructions. The derived cDNA can then be
used as a
template in the subsequent PCR reaction.
Although the PCR step can use a variety of thermostable DNA-dependent DNA
polymerases, it
typically employs the Taq DNA polymerase, which has a 5'-3' nuclease activity
but lacks a 3'-5'
proofreading endonuclease activity. Thus, TaqMan (q) PCR typically utilizes
the 5' nuclease
activity of Taq or Tth polymerase to hydrolyze a hybridization probe bound to
its target
amplicon, but any enzyme with equivalent 5' nuclease activity can be used.
Two oligonucleotide primers are used to generate an amplicon typical of a PCR
reaction. A third
oligonucleotide, or probe, is designed to detect nucleotide sequence located
between the two
PCR primers. The probe is non-extendible by Taq DNA polymerase enzyme, and is
labeled with
CA 02725602 2010-11-24
WO 2008/143533 PCT/NZ2008/000118
a reporter fluorescent dye and a quencher fluorescent dye. Any laser-induced
emission from the
reporter dye is quenched by the quenching dye when the two dyes are located
close together as
they are on the probe. During the amplification reaction, the Taq DNA
polymerase enzyme
cleaves the probe in a template-dependent manner. The resultant probe
fragments disassociate in
solution, and signal from the released reporter dye is free from the quenching
effect of the
second fluorophore. One molecule of reporter dye is liberated for each new
molecule
synthesized, and detection of the unquenched reporter dye provides the basis
for quantitative
interpretation of the data.
TaqMan RT-PCR can be performed using commercially available equipment, such
as, for
example, ABI PRISM 7700 Sequence Detection System (Perkin-Elmer-Applied
Biosystems,
Foster City, CA, USA), or Lightcycler (Roche Molecular Biochemicals, Mannheim,
Germany).
In a preferred embodiment, the 5' nuclease procedure is run on a real-time
quantitative PCR
device such as the ABI PRISM 7700tam Sequence Detection System. The system
consists of a
thermocycler, laser, charge-coupled device (CCD), camera, and computer. The
system amplifies
samples in a 96-well format on a thermocycler. During amplification, laser-
induced fluorescent
signal is collected in real-time through fibre optics cables for all 96 wells,
and detected at the
CCD. The system includes software for running the instrument and for analyzing
the data.
5' nuclease assay data are initially expressed as Ct, or the threshold cycle.
As discussed above,
fluorescence values are recorded during every cycle and represent the amount
of product
amplified to that point in the amplification reaction. The point when the
fluorescent signal is
first recorded as statistically significant is the threshold cycle.
To minimize errors and the effect of sample-to-sample variation, RT-PCR is
usually performed
using an internal standard. The ideal internal standard is expressed at a
constant level among
different tissues, and is unaffected by the experimental treatment. RNAs most
frequently used to
normalize patterns of gene expression are mRNAs for the housekeeping genes
glyceraldehyde-3-
phosphate-dehydrogenase (GAPDH) and-actin.
Real-time quantitative PCR (qPCR)
A more recent variation of the RT-PCR technique is the real time quantitative
PCR, which
measures PCR product accumulation through a dual-labeled fluorigenic probe
(i.e., TaqMan
probe). Real time PCR is compatible both with quantitative competitive PCR and
with
CA 02725602 2010-11-24
WO 2008/143533 PCT/NZ2008/000118
21
quantitative comparative PCR. The former uses an internal competitor for each
target sequence
for normalization, while the latter uses a normalization gene contained within
the sample, or a
housekeeping gene for RT-PCR. Further details are provided, e.g., by Held et
al., Genome
Research 6: 986-994 (1996).
Expression levels can be determined using fixed, paraffin-embedded tissues as
the RNA source.
According to one aspect of the present invention, PCR primers and probes are
designed based
upon intron sequences present in the gene to be amplified. In this embodiment,
the first step in
the primer/probe design is the delineation of intron sequences within the
genes. This can be
done by publicly available software, such as the DNA BLAT software developed
by Kent, W. J.,
Genome Res. 12 (4): 656-64 (2002), or by the BLAST software including its
variations.
Subsequent steps follow well established methods of PCR primer and probe
design.
In order to avoid non-specific signals, it is useful to mask repetitive
sequences within the introns
when designing the primers and probes. This can be easily accomplished by
using the Repeat
Masker program available on-line through the Baylor College of Medicine, which
screens DNA
sequences against a library of repetitive elements and returns a query
sequence in which the
repetitive elements are masked. The masked sequences can then be used to
design primer and
probe sequences using any commercially or otherwise publicly available
primer/probe design
packages, such as Primer Express (Applied Biosystems); MGB assay-by-design
(Applied
Biosystems); Primer3 (Steve Rozen and Helen J. Skaletsky (2000) Primer3 on the
WWW for
general users and for biologist programmers in: Krawetz S, Misener S (eds)
Bioinformatics
Methods and Protocols: Methods in Molecular Biology. Humana Press. Totowa, NJ,
pp 365-
386).
The most important factors considered in PCR primer design include primer
length, melting
temperature (Tm), and G/C content, specificity, complementary primer
sequences, and 3' end
sequence. In general, optimal PCR primers are generally 17-30 bases in length,
and contain
about 20-80%, such as, for example, about 50-60% G+C bases. Melting
temperatures between
50 and 80 C, e.g., about 50 to 70 C, are typically preferred. For further
guidelines for PCR
primer and probe design see, e.g., Dieffenbach, C. W. et al., General Concepts
for PCR.Primer
Design in: PCR Primer, A Laboratory Manual, Cold Spring Harbor Laboratory
Press, New York,
1995, pp. 133-155; Innis and Gelfand, Optimization of PCRs in: PCR Protocols,
A Guide to
Methods and Applications, CRC Press, London, 1994, pp. 5-11; and Plasterer, T.
N.
CA 02725602 2010-11-24
WO 2008/143533 PCT/NZ2008/000118
22
Primerselect: Primer and probe design. Methods Mol. Biol. 70: 520-527 (1997),
the entire
disclosures of which are hereby expressly incorporated by reference.
Microarray analysis
Differential expression can also be identified, or confirmed using the
microarray technique.
Thus, the expression profile of MPMs can be measured in either fresh or
paraffin-embedded
tumour tissue, using microarray technology. In this method, polynucleotide
sequences of interest
(including cDNAs and oligonucleotides) are plated, or arrayed, on a microchip
substrate. The
arrayed sequences (i.e., capture probes) are then hybridized with specific
polynucleotides from
cells or tissues of interest (i.e., targets). Just as in the RT-PCR method,
the source of RNA
typically is total RNA isolated from human tumours or tumour cell lines, and
corresponding
normal tissues or cell lines. Thus RNA can be isolated from a variety of
primary tumours or
tumour cell lines. If the source of RNA is a primary tumour, RNA can be
extracted, for
example, from frozen or archived formalin fixed paraffin-embedded (FFPE)
tissue samples and
fixed (e.g., formalin-fixed) tissue samples, which are routinely prepared and
preserved in
everyday clinical practice.
In a specific embodiment of the microarray technique, PCR amplified inserts of
cDNA clones
are applied to a substrate. The substrate can include up to 1, 2, 5, 10, 15,
20, 25, 30, 35, 40, 45,
50, or 75 nucleotide sequences. In other aspects, the substrate can include at
least 10,000
nucleotide sequences. The microarrayed sequences, immobilized on the
microchip, are suitable
for hybridization under stringent conditions. As other embodiments, the
targets for the
microarrays can be at least 50, 100, 200, 400, 500, 1000, or 2000 bases in
length; or 50-100, 100-
200, 100-500, 100-1000, 100-2000, or 500-5000 bases in length. As further
embodiments, the
capture probes for the microarrays can be at least 10, 15. 20, 25, 50, 75, 80,
or 100 bases in
length; or 10-15, 10-20, 10-25, 10-50, 10-75, 10-80, or 20-80 bases in length.
Fluorescently labeled cDNA probes may be generated through incorporation of
fluorescent
nucleotides by reverse transcription of RNA extracted from tissues of
interest. Labeled cDNA
probes applied to the chip hybridize with specificity to each spot of DNA on
the array. After
stringent washing to remove non-specifically bound probes, the chip is scanned
by confocal laser
microscopy or by another detection method, such as a CCD camera. Quantitation
of
hybridization of each arrayed element allows for assessment of corresponding
mRNA
abundance. With dual colour fluorescence, separately labeled cDNA probes
generated from two
CA 02725602 2010-11-24
WO 2008/143533 PCT/NZ2008/000118
23
sources of RNA are hybridized pairwise to the array. The relative abundance of
the transcripts
from the two sources corresponding to each specified gene is thus determined
simultaneously.
The miniaturized scale of the hybridization affords a convenient and rapid
evaluation of the
expression pattern for large numbers of genes. Such methods have been shown to
have the
sensitivity required to detect rare transcripts, which are expressed at a few
copies per cell, and to
reproducibly detect at least approximately two-fold differences in the
expression levels (Schena
et al., Proc. Natl. Acad. Sci. USA 93 (2): 106-149 (1996)). Microarray
analysis can be
performed by commercially available equipment, following manufacturer's
protocols, such as by
using the Affymetrix GenChip technology, Illumina microarray technology or
Incyte's
microarray technology. The development of microarray methods for large-scale
analysis of gene
expression makes it possible to search systematically for molecular markers of
cancer
classification and outcome prediction in a variety of tumour types.
RNA isolation, purification, and amplification
General methods for mRNA extraction are well known in the art and are
disclosed in standard
textbooks of molecular biology, including Ausubel et al., Current Protocols of
Molecular
Biology, John Wiley and Sons (1997). Methods for RNA extraction from paraffin
embedded
tissues are disclosed, for example, in Rupp and Locker, Lab Invest. 56: A67
(1987), and De
Sandres et al., BioTechniques 18: 42044 (1995). In particular, RNA isolation
can be performed
using purification kit, buffer set, and protease from commercial
manufacturers, such as Qiagen,
according to the manufacturer's instructions. For example, total RNA from
cells in culture can
be isolated using Qiagen RNeasy mini-columns. Other commercially available RNA
isolation
kits include MasterPure Complete DNA and RNA Purification Kit (EPICENTRE (D,
Madison,
WI), and Paraffin Block RNA Isolation Kit (Ambion, Inc.). Total RNA from
tissue samples can
be isolated using RNA Stat-60 (Tel-Test). RNA prepared from tumour can be
isolated, for
example, by cesium chloride density gradient centrifugation.
The steps of a representative protocol for profiling gene expression using
fixed, paraffin-
embedded tissues as the RNA source, including mRNA isolation, purification,
primer extension
and amplification are given in various published journal articles (for
example: T. E. Godfrey et
al. J. Molec. Diagnostics 2: 84-91 (2000); K. Specht et al., Am. J. Pathol.
158: 419-29 (2001)).
Briefly, a representative process starts with cutting about 10 m thick
sections of paraffin-
embedded tumour tissue samples. The RNA is then extracted, and protein and DNA
are
CA 02725602 2010-11-24
WO 2008/143533 PCT/NZ2008/000118
24
removed. After analysis of the RNA concentration, RNA repair and/or
amplification steps may
be included, if necessary, and RNA is reverse transcribed using gene specific
promoters followed
by RT-PCR. Finally, the data are analyzed to identify the best treatment
option(s) available to
the patient on the basis of the characteristic gene expression pattern
identified in the tumour
sample examined.
Immunohistochemistrv and proteomics
Immunohistochemistry methods are also suitable for detecting the expression
levels of the
proliferation markers of the present invention. Thus, antibodies or antisera,
preferably
polyclonal antisera, and most preferably monoclonal antibodies specific for
each marker, are
used to detect expression. The antibodies can be detected by direct labeling
of the antibodies
themselves, for example, with radioactive labels, fluorescent labels, hapten
labels such as, biotin.
or an enzyme such as horse radish peroxidase or alkaline phosphatase.
Alternatively, unlabeled
primary antibody is used in conjunction with a labeled secondary antibody,
comprising antisera,
polyclonal antisera or a monoclonal antibody specific for the primary
antibody.
Immunohistochemistry protocols and kits are well known in the art and are
commercially
available.
Proteomics can be used to analyze the polypeptides present in a sample (e.g.,
tissue, organism, or
cell culture) at a certain point of time. In particular, proteomcc techniques
can be used to assess
the global changes of polypeptide expression in a sample (also referred to as
expression
proteomics). Proteomic analysis typically includes: (1) separation of
individual polypeptides in
a sample by 2-D gel electrophoresis (2-D PAGE); (2) identification of the
individual
polypeptides recovered from the gel, e.g., by mass spectrometry or N-terminal
sequencing, d
an
(3) analysis of the data using bioinformatics. Proteomics methods are valuable
supplements to
other methods of gene expression profiling, and can be used, alone or in
combination with other
methods, to detect the products of the proliferation markers of the present
invention.
Once the expression level of one or more prognostic markers in a tumour sample
has been
assessed the likelihood of the cancer responding to treatment can then be
determined. The
inventors have identified a number of markers that are differentially
expressed in melanomas that
respond to treatment (good prognosis) compared to melanomas that don't respond
to treatment
(poor prognosis) in patient data sets. The markers are set out in Table I and
in the example
below.
CA 02725602 2010-11-24
WO 2008/143533 PCT/NZ2008/000118
Selection of Differentially Expressed Genes.
An early approach to the selection of genes deemed significant involved simply
looking at the
"fold change" of a given gene between the two groups of interest. While this
approach hones in
on genes that seem to change the most spectacularly, consideration of basic
statistics leads one to
realize that if the variance (or noise level) is quite high (as is often seen
in microarray
experiments), then seemingly large fold-change can happen frequently by chance
alone.
Microarray experiments, such as those described here, typically involve the
simultaneous
measurement of thousands of genes. If one is comparing the expression levels
for a particular
gene between two groups (for example good prognosis and poor prognosis
tumours), the typical
tests for significance (such as the t-test) are not adequate. This is because,
in an ensemble of
thousands of experiments (in this context each gene constitutes an
"experiment"), the probability
of at least one experiment passing the usual criteria for significance by
chance alone is
essentially unity. In a test for significance, one typically calculates the
probability that the "null
hypothesis" is correct. In the case of comparing two groups, the null
hypothesis is that there is
no difference between the two groups. If a statistical test produces a
probability for the null
hypothesis below some threshold (usually 0.05 or 0.01), it is stated that we
can reject the null
hypothesis, and accept the hypothesis that the two groups are significantly
different. Clearly, in
such a test, a rejection of the null hypothesis by chance alone could be
expected I in 20 times (or
I in 100). The use of t-tests, or other similar statistical tests for
significance, fail in the context
of microarrays, producing far too many false positives (or type I errors).
In this type of situation, where one is testing multiple hypotheses at the
same time, one applies
typical multiple comparison procedures, such as the Bonferroni Method 2.
However such tests
are too conservative for most microarray experiments, resulting in too many
false negative (type
II) errors.
A more recent approach is to do away with attempting to apply a probability
for a given test
being significant, and establish a means for selecting a subset of
experiments, such that the
expected proportion of Type I errors (or false discovery rate; 13) is
controlled for. It is this
approach that has been used in this investigation, through various
implementations; namely the
methods provided with BRB Array Tools14, and the limmal`'I6 package of
Bioconductor (that
uses the R statistical environment, 17'18).
CA 02725602 2010-11-24
WO 2008/143533 PCT/NZ2008/000118
26
General methodology for Data Mining: Generation of Prognostic Signatures
Data Mining is the term used to describe the extraction of "knowledge", in
other words the
"know-how", or predictive ability from (usually) large volumes of data (the
dataset). This is the
approach used in this study to generate prognostic signatures. In the case of
this study the
"know-how" is the ability to accurately predict prognosis from a given set of
gene expression
measurements, or "signature" (as described generally in this section and in
more detail in the
examples section).
The specific details used for the methods used in this study are described in
Examples 17-20.
However, application of any of the data mining methods (both those described
in the Examples,
and those described here) can follow this general protocol.
Data mining19, and the related topic machine learning20 is a complex,
repetitive mathematical
task that involves the use of one or more appropriate computer software
packages (see below).
The use of software is advantageous on the one hand, in that one does not need
to be completely
familiar with the intricacies of the theory behind each technique in order to
successfully use data
mining techniques, provided that one adheres to the correct methodology. The
disadvantage is
that the application of data mining can often be viewed as a "black box": one
inserts the data and
receives the answer. How this is achieved is often masked from the end-user
(this is the case for
many of the techniques described, and can often influence the statistical
method chosen for data
mining. For example, neural networks and support vector machines have a
particularly complex
implementation that makes it very difficult for the end user to extract out
the "rules" used to
produce the decision. On the other hand, k-nearest neighbours and linear
discriminant analysis
have a very transparent process for decision making that is not hidden from
the user.
There are two types of approach used in data mining: supervised and
unsupervised approaches.
In the supervised approach, the information that is being linked to the data
is known, such as
categorical data (e.g. good vs. poor prognosis). What is required is the
ability to link the
observed response (e.g. good vs. poor prognosis) to the input variables. In
the unsupervised
approach, the classes within the dataset are not known in advance, and data
mining methodology
is employed to attempt to find the classes or structure within the dataset.
In the present example the supervised approach was used and is discussed in
detail here,
although it will be appreciated that any of the other techniques could be
used.
CA 02725602 2010-11-24
WO 2008/143533 PCT/NZ2008/000118
27
The overall protocol involves the following steps:
= Data representation. This involves transformation of the data into a form
that is most
likely to work successfully with the chosen data mining technique. In where
the data is
numerical, such as in this study where the data being investigated represents
relative
levels of gene expression, this is fairly simple. If the data covers a large
dynamic range
(i.e. many orders of magnitude) often the log of the data is taken. If the
data covers many
measurements of separate samples on separate days by separate investigators,
particular
care has to be taken to ensure systematic error is minimised. The minimisation
of
systematic error (i.e. errors resulting from protocol differences, machine
differences,
operator differences and other quantifiable factors) is the process referred
to here as
"normalisation".
= Feature Selection. Typically the dataset contains many more data elements
than would
be practical to measure on a day-to-day basis, and additionally many elements
that do not
provide the information needed to produce a prediction model. The actual
ability of a
prediction model to describe a dataset is derived from some subset of the full
dimensionality of the dataset. These dimensions are the most important
components (or
features) of the dataset. Note in the context of microarray data, the
dimensions of the
dataset are the individual genes. Feature selection, in the context described
here, involves
finding those genes which are most "differentially expressed". In a more
general sense, it
involves those groups which pass some statistical test for significance, i.e.
is the level of
a particular variable consistently higher or lower in one or other of the
groups being
investigated. Sometimes the features are those variables (or dimensions) which
exhibit
the greatest variance.
The application of feature selection is completely independent of the method
used to
create a prediction model, and involves a great deal of experimentation to
achieve the
desired results. Within this invention, the selection of significant genes,
entailed feature
selection. In addition, methods of data reduction (such as principal component
analysis)
can be applied to the dataset.
= Training. Once the classes (e.g. good/poor prognosis) and the features of
the dataset have
been established, and the data is represented in a form that is acceptable as
input for data
mining, the reduced dataset (as described by the features) is applied to the
prediction
CA 02725602 2010-11-24
WO 2008/143533 PCT/NZ2008/000118
28
model of choice. The input for this model is usually in the form a multi-
dimensional
numerical input. (known as a vector), with associated output information (a
class label or
a response). In the training process, selected data is input into the
prediction model,
either sequentially (in techniques such as neural networks) or as a whole (in
techniques
that apply some form of regression, such'as linear models, linear discriminant
analysis,
support vector machines). In some instances (e.g. k-nearest neighbours) the
dataset (or
subset of the dataset obtained after feature selection) is itself the model.
As discussed,
effective models can be established with minimal understanding of the detailed
mathematics, through the use of various software packages where the parameters
of the
model have been pre-determined by expert analysts as most likely to lead to
successful
results.
= Validation. This is a key component of the data-mining protocol, and the
incorrect
application of this frequently leads to errors. Portions of the dataset are to
be set aside,
apart from feature selection and training, to test the success of the
prediction model.
Furthermore, if the results of validation are used to effect feature selection
and training of
the model, then one obtains a further validation set to test the model before
it is applied to
real-life situations. If this process is not strictly adhered to the model is
likely to fail in
real-world situations. The methods of validation are described in more detail
below.
= Application. Once the model has been constructed, and validated, it must be
packaged in
some way as it is accessible to end users. This often involves implementation
of some
form a spreadsheet application, into which the model has been imbedded,
scripting of a
statistical software package, or refactoring of the model into a hard-coded
application by
information technology staff.
Examples of software packages that are frequently used are:
- Spreadsheet plugins, obtained from multiple vendors.
- The R statistical environment.
- The commercial packages MatLab, S-plus, SAS, SPSS, STATA.
- Free open-source software such as Octave (a MatLab clone)
- many and varied C++ libraries, which can be used to implement prediction
models in a
commercial, closed-source setting.
CA 02725602 2010-11-24
WO 2008/143533 PCT/NZ2008/000118
29
Examples of Data Mining Methods
The methods of the invention can be performed by first undertaking the step of
data mining
(above), and then applying the appropriate known software packages. Further
description of the
process of data mining is described in detail in many extremely well-written
texts19.
= Linear models19' 9,21 : The data is treated as the input of a linear
regression model, of which
the class labels or responses variables are the output. Class labels, or other
categorical
data, must be transformed into numerical values (usually integer). In
generalised linear
models, the class labels or response variables are not themselves linearly
related to the
input data, but are transformed through the use of a "link function". Logistic
regression
is the most common form of generalized linear model.
= Linear Discriminant analysis19' 22, 23. Provided the data is linearly
separable (i.e. the
groups or classes of data can be separated by a hyperplane, which is an n-
dimensional
extension of a threshold), this technique can be applied. A combination of
variables is
used to separate the classes, such that the between group variance is
maximised, and the
within-group variance is minimised. The byproduct of this is the formation of
a
classification rule. Application of this rule to samples of unknown class
allows
predictions or classification of class membership to be made for that sample.
There are
variations of linear discriminant analysis such as nearest shrunken centroids
which are
commonly used for microarray analysis.
= Support vector machines24: A collection of variables is used in conjunction
with a
collection of weights to determine a model that maximizes the separation
between classes
in terms of those weighted variables. Application of this model to a sample
then produces
a classification or prediction of class membership for that sample.
= Neural networks23: The data is treated as input into a network of nodes,
which
superficially resemble biological neurons, which apply the input from all the
nodes to
which they are connected, and transform the input into an output. Commonly,
neural
networks use the "multiply and sum" algorithm, to transform the inputs from
multiple
connected input nodes into a single output. A node may not necessarily produce
an
output unless the inputs to that node exceed a certain threshold. Each node
has as its
input the output from several other nodes, with the final output node usually
being linked
CA 02725602 2010-11-24
WO 2008/143533 PCT/NZ2008/000118
to a categorical variable. The number of nodes, and the topology of the nodes
can be
varied in almost infinite ways, providing for the ability to classify
extremely noisy data
that may not be possible to categorize in other ways. The most common
implementation
of neural networks is the multi-laver perceptron.
= Classification and regression trees2': In these, variables are used to
define a hierarchy of
rules that can be followed in a stepwise manner to determine the class of a
sample. The
typical process creates a set of rules which lead to a specific class output,
or a specific
statement of the inability to discriminate. A example classification tree is
an
implementation of an algorithm such as:
if gene A> x and gene Y > x and gene Z = z
then
class A
else if geneA = q
then
class B
= Nearest neighbour methods2123 Predictions or classifications are made by
comparing a
sample (of unknown class) to those around it (of known class), with closeness
defined by
a distance function. It is possible to define many different distance
functions.
Commonly used distance functions are the Euclidean distance (an extension of
the
Pythagorean distance, as in triangulation, to n-dimensions), various forms of
correlation
(including Pearson Correlation co-efficient). There are also transformation
functions that
convert data points that would not normally be interconnected by a meaningful
distance
metric into euclidean space, so that Euclidean distance can then be applied
(e.g.
Mahalanobis distance). Although the distance metric can be quite complex, the
basic
premise of k-nearest neighbours is quite simple, essentially being a
restatement of "find
the k-data vectors that are most similar to the unknown input, find out which
class they
correspond to, and vote as to which class the unknown input is".
= Other methods:
- Bayesian networks. A directed acyclic graph is used to represent a
collection of
variables in conjunction with their joint probability distribution, which is
then used to
determine the probability of class membership for a sample.
CA 02725602 2010-11-24
WO 2008/143533 PCT/NZ2008/000118
31
- Independent components analysis, in which independent signals (e.g., class
membership) re isolated (into components) from a collection of variables.
These
components can then be used to produce a classification or prediction of class
membership for a sample.
Ensemble learning methods in which a collection of prediction methods are
combined
to produce a joint classification or prediction of class membership for a
sample
There are many variations of these methodologies that can be explored'9, and
many new
methodologies are constantly being defined and developed. It will be
appreciated that any one of
these methodologies can be applied in order to obtain an acceptable result.
Particular care must
be taken to avoid overfitting, by ensuring that all results are tested via a
comprehensive
validation scheme.
Validation
Application of any of the prediction methods described involves both training
and
cross-validation12' 26 before the method can be applied to new datasets (such
as data from a
clinical trial). Training involves taking a subset of the dataset of interest
(in this case gene
expression measurements from melanoma), such that it is stratified across the
classes that are
being tested for (in this case tumours with good or poor likelihood of rapid
progression). This
training set is used to generate a prediction model (defined above), which is
tested on the
remainder of the data (the testing set).
It is possible to alter the parameters of the prediction model so as to obtain
better performance in
the testing set, however, this can lead to the situation known as over-
fitting, where the prediction
model works on the training dataset but not on any external dataset. In order
to circumvent this,
the process of validation is followed. There are two major types of validation
typically applied,
the first (hold-out validation) involves partitioning the dataset into three
groups: testing, training,
and validation. The validation set has no input into the training process
whatsoever, so that any
adjustment of parameters or other refinements must take place during
application to the testing
set (but not the validation set). The second major type is cross-validation,
which can be applied
in several different ways, described below.
There are two main sub-types of cross-validation: K-fold cross-validation, and
leave-one-out
cross-validation.
CA 02725602 2010-11-24
WO 2008/143533 PCT/NZ2008/000118
32
K-fold cross-validation: The dataset is divided into K subsamples, each
subsample containing
approximately the same proportions of the class groups as the original.
In each round of validation, one of the K subsamples is set aside, and
training is accomplished
using the remainder of the dataset. The effectiveness of the training for that
round is guaged by
how correctly the classification of the left-out group is. This procedure is
repeated K- times, and
the overall effectiveness ascertained by comparison of the predicted class
with the known class.
Leave-one-out cross-validation: A commonly used variation of K-fold cross
validation, in which
K=n, where n is the number of samples.
Combinations of MPMS, such as those described above in Table 1, can be used to
construct
predictive models for prognosis.
Prognostic Signatures
Prognostic signatures, comprising one or more of these markers, can be used to
determine the
outcome of a patient, through application of one or more predictive models
derived from the
signature. In particular, a clinician or researcher can determine the
differential expression (e.g.,
increased or decreased expression) of the one or more markers in the
signature, apply a
predictive model, and thereby predict the negative prognosis, e.g., likelihood
of disease relapse,
of a patient, or alternatively the likelihood of a positive prognosis
(continued remission).
A prognostic signature has been developed. As described in the Example below,
a prognostic
signature comprising 22 genes has been established from a set of patients with
melanoma.(Table
1). By obtaining a patient sample (e.g., tumour sample), and matching the
expression levels of
one or more markers in the sample to the differential expression profile, the
likelihood of the
cancer progressing rapidly can be determined.
Drug Trials
The present invention can also be used to select individuals for particular
drug trials. By
establishing the prognosis of an individual with melanoma, then a better
decision can be made on
whether a patient should undergo conventional treatment for which they are
likely to respond to,
or whether they should participate in a particular drug trial that is aim at a
particular tumour type
or stage.
CA 02725602 2010-11-24
WO 2008/143533 PCT/NZ2008/000118
33
The selection of patients with a short predicted time to disease progression
would also enable the
shortening of the duration of drug trials and allow fewer patients to be
enrolled to achieve
statistically significant drug response data.
EXAMPLES
The examples described herein are for purposes of illustrating embodiments of
the invention.
Other embodiments, methods, and types of analyses are within the scope of
persons of ordinary
skill in the molecular diagnostic arts and need not be described in detail
hereon. Other
embodiments within the scope of the art are considered to be part of this
invention.
To investigate biological mechanisms within tumors which may affect clinical
outcome in stage
III melanoma, gene expression profiling was performed on an initial test set
of 29 melanoma
specimens from patients with diverse clinical outcome following
lymphadenectomy for Stage
IIIB and IIIC melanoma. This was then used to prospectively predict clinical
outcome based on
a molecular profile in two independent validation sets comprising 10 and 14
patients. Using this
molecular information, cellular pathways and networks were also identified
which may be
differentially regulated between the two patient groups and are possible
targets for therapeutic
intervention.
MATERIALS AND METHODS
Specimen Collection and Selection for Microarray Analysis
The overall schema of the experiments performed is represented in Figure 3. Ex
vivo melanoma
tissue from 29 patients who underwent surgical lymphadenectomy for clinically
palpable nodes
between 1997 and 2004 at Austin Health were selected for microarray analysis.
All specimens
were collected under a tissue procurement protocol approved by the Austin
Health Human
Research Ethics Committee and with the written informed consent of each
patient. Snap frozen
specimens were embedded in optimal cutting temperature compound (OCT) and
stored as tissue
blocks at -80 C within the Ludwig/Austin tissue bank repository. Diagnosis was
confirmed by a
pathologist in all cases.
Patient samples were selected for microarray analysis on the basis of time
taken to tumor
progression (TTP) from Stage III to Stage IV disease and included 16 "poor"
(mean TTP 4
months) and 13 "good" (mean TTP 42 months) prognosis patients. Post operative
reviews in a
CA 02725602 2010-11-24
WO 2008/143533 PCT/NZ2008/000118
34
dedicated Melanoma Unit were carried out on a monthly basis for the initial 12
months post-
lymphadenectomy, followed by three and six monthly reviews thereafter
according to clinical
requirement until four years, with annual review thereafter. Staging
investigations were
performed according to clinical suspicion or routinely every 3-6 months.
Tissues were considered acceptable for this study if minimal necrosis was
present and tumor
cells comprised at least 60% of the total cell population. At the time of RNA
extraction, two
54m sections were cut and stained with hematoxylin and eosin to ensure
integrity of the
extracted tissue.
RNA Extraction and cDNA Synthesis
cDNA synthesis and hybridization with a common reference design were conducted
in duplicate
for the 29 selected patients. Total RNA was extracted from OCT embedded tissue
by immersing
and homogenizing tissue sections in Tri-reagent (Molecular Research Center,
Cincinnati, Off).
1.5mL of chloroform was added to the homogenate, the sample centrifuged, and
the top phase
was removed and mixed with 100% ethanol. Purification using an RNeasy column
was
performed according to the manufacturer's instructions (Qiagen, Valencia, CA).
RNA quality
was confirmed on the basis of 260:280 ratios of absorbances and integrity was
inspected on
formaldehyde-agarose gels against rRNA standard markers. cDNA was synthesized
from 204g
of RNA in the presence of oligo(dT) and amino allyl deoxynucleotide. Cy dyes
(Amersham
Biosciences, Buckinghamshire, UK) were coupled to tumor cDNA and reference
cDNA
produced in parallel. Reference cDNA was synthesized from pooled RNA from a
variety of
tumors and cell lines including melanoma, as well as from normal tissues (see
Figure 4).
Oligonucleotide Arrays and Data Analysis
30,888 oligonucleotide probes, representing individual genes and internal
controls, were
obtained from MWG Biotech (Erbesberg, Germany) and spotted as high density
arrays using an
Omnigrid robot (Gene Machines, San Carlos, CA). Labeled tumor/reference cDNA
was co-
hybridized and scanned using a Genepix 4000A microarray scanner (Axon
Instruments, Union
City, CA). The matrix overlay was aligned to the scanned image and feature
extraction
performed using Gene Pix v6.0 software (Axon Instruments, Foster City, CA).
The raw data was
analyzed using GeneSpring v7.2 (Silicon Genetics, Redwood City, CA). The data
was
normalized to print-tip group and then median normalized. Briefly, a lowers
curve was fit to the
log-intensity versus log-ratio plot. Twenty percent of the data was used to
calculate the lowers
CA 02725602 2010-11-24
WO 2008/143533 PCT/NZ2008/000118
fit at each point. This curve was used to adjust the control value for each
measurement. Each
gene was then divided by the median of its measurements in all samples.
Data for independent validation set B from the EORTC melanoma study27, was
made available
through the Array Express public data repository; http://w w,.ebi.ac.uk/
arravexpress/. The data
was uploaded into Genespring v7.2 and normalized per spot, per chip and per
gene. In brief each
gene's measured intensity was divided by its control channel value in each
sample and then
divided by the 50th percentile of all measurements in that sample. Finally
each gene was divided
by the median of its measurements in all samples. Expression values for the
differentially
expressed genes were used to calculate a predictive score as described below.
Statistical Methods
Gene expression data was first subjected to a filter that excluded probes
which were not present
in all samples. Of the initial 30,888 probes considered, 18,807 passed this
filter and were used
for analysis of variance, hierarchical clustering and principal component
analysis. Differentially
expressed genes were discovered by performing a Wilcoxon-Mann-Whitney test
with the false
discovery rate controlling method of Benjamin and Hochberg28 used to correct
for multiple
testing correction based on a p-value cut-off of 0.05. Hierarchical clustering
of samples was
performed using Spearman correlation as the distance function and average
linkage.
Quantitative Real Time PCR (qPCR)
qPCR was performed on differentially expressed genes to confirm the array
results, and then in
validating the predictor using validation set A. First strand cDNA was
synthesized from 2 g of
total RNA extracted for the array experiment using a random hexamer primer
(Promega,
Madison, WI). Negative controls were obtained by omitting reverse
trancriptase. Intron-
spanning multiplex assays were designed for qPCR (see Figure 5 for assay
design) using the
Universal Probe Library assay design centre https://w,ww.roche-applied-
science.com/ (Roche,
Mannheim, Germany). All reactions were carried out in duplicate using the ABI
7700 sequence
detector (Applied Biosystems, Foster City, CA). Thermal cycler conditions were
as follows:
50 C for 2 minutes, 95 C for 10 minutes followed by 40 cycles of 94 C for 20
seconds and 60 C
for 45 seconds. All results were normalized to 18S amplification (Applied
Biosystems, Foster
City, CA). We calculated relative expression using the target threshold (CT)
value for reference
as our comparator
29
CA 02725602 2010-11-24
WO 2008/143533 PCT/NZ2008/000118
36
The relative expression values for individual genes were then plotted along
side the normalized
log` ratio array values and correlation coefficients calculated.
RESULTS
Clinical and pathological features for the patients included in the test set
and validation set A are
listed (see Figure 6). All patients had information on age at initial
diagnosis, sex, and number
and location of positive lymph nodal metastases. Not all patients had their
initial diagnosis made
at our hospital and so in some cases we were unable to ascertain whether
ulceration was present
in the primary melanoma. Ulceration in the primary is an independent
prognostic factor which if
present upstages the disease from 11113 to IIIC30.
The mean TTP for the "good" prognosis group was 40 months compared to 4 months
in the
"poor" group. There were no statistically significant differences in the
median age and sex
between the groups, although the "good" group appeared younger and contained
more women.
There were no statistically significant differences in other known prognostic
characteristics
including AJCC staging, the use of adjuvant interferon and the presence of
tumor infiltrating
lymphocytes, although there was a limitation of the sample size.
One patient had isolated Stage IV disease confined to resected spleen, but
given that they
remained disease-free this sample was included. Exclusion of this sample did
not alter the gene
expression profile.
Differentially Expressed Genes Segregate the Two Prognostic Groups
Unsupervised hierarchical clustering did not reveal subgroups of melanomas
which correlated
with prognostic nor other clinical information, which was expected given the
similarities
between the samples. To search for genes which could effectively segregate the
prognostic
groups, differential gene expression was investigated. 2,140 genes were
differentially expressed
between the two groups, however the stringent application of multiple testing
correction reduced
this to 22 genes with highly significant differential expression (Figure 1).
The 22 genes were
further validated in the training set using qPCR and the genes with the
highest correlation co-
efficient between the two platforms (r>0.5, p<0.05) were selected for further
analysis (data not
shown). Of the initial 22, fifteen genes exhibited high cross-platform
correlation and these were
used in the development of a predictive score. Principal Components Analysis
demonstrated the
ability of the 15 genes to segregate the prognostic groups (Figure 7).
CA 02725602 2010-11-24
WO 2008/143533 PCT/NZ2008/000118
37
Development of Predictive Scores
The initial test set was used to develop a predictor which was tested on two
independent
validation sets, Two predictive algorithms were developed based on the array
data and then the
qPCR data:
1. To calculate a predictive score for the array data (aPS), the fifteen genes
with the most
significant correlation between the array and qPCR were used. The normalized
loge expression
ratios were transformed by raising the values to the power of two. Genes down
regulated in the
"good" prognostic group were ascribed a negative value. The final score was
then calculated by
the sum of values for all fifteen genes. A positive score was associated with
improved outcome.
2. For the qPCR data (qPS), AA CT values for the fifteen most correlated genes
were applied to a
logistic regression algorithm which utilizes Akaike Information Criterion to
select only
those genes which contribute to class distinction. This selected five
significant genes which
were then used in the following equation:
qPS = [ 1328.1 -187.42(1DH) +137.10(MFG8) +73.61(PILRA) +211.22 (IILA-E)
+143.94(TXNDC5)] x
-1
As with the aPS, a positive score was associated with improved outcome using
this method.
The Predictive Scores Correlate with TTP and Survival
As expected, both the aPS and qPS applied to the test set were capable of
distinguishing the two
prognostic groups. A strong correlation between individual scores and both TTP
and overall
survival were evident, such that the magnitude of individual scores (high
scores with aPS and
negative scores for qPS) correlated with improved outcome for both the qPS and
aPS (Figure 8,
Spearman rank correlation r=0.7908" p<0.0001). This suggests that the
expression level of these
differentially expressed genes is related to underlying biological mechanisms
which directly
influence clinical outcome, emphasizing their prognostic relevance.
Application of the Predictive Score to Three Independent Sets
The results were then applied on independently generated data. One published
dataset with a
subgroup of similar patients to our own was identified. Of the 83 patients who
were profiled in
CA 02725602 2010-11-24
WO 2008/143533 PCT/NZ2008/000118
38
this study`, 14 had Stage III disease with long term follow up. In this
subgroup, ten patients
would have been classified as "poor" (mean TTP 10 months) and four "good"
(mean TTP 62
months) using similar criteria applied in our test set. When the aPS algorithm
was applied to
these samples, all ten "poor" patients and two of the four "good" patients
were correctly
predicted, yielding an overall correct classification rate of 85%.
Next we applied the qPS algorithm to an independent set of ten tumors from the
Ludwig/Austin
tissue bank for which qPCR assays were conducted using the five most
powerfully predictive
genes. The predictor correctly classified all five of the "good" prognosis
tumors but
misclassified one of the five "poor" samples (Figure 9). The incorrectly
classified "poor" sample
represented a patient in whom TTP was brief, but who had a prolonged overall'
survival of six
years with metastatic disease.
The five gene qPS was also applied to a third, independent set of stage 3
melanoma samples.
These samples were composed of 19 patients with survival of under 18 months
following
diagnosis of stage 3 disease and a further 18 patients who survived greater
than four years from
stage 3 diagnosis. The distributions of the qPS scores from these good and
poor prognostic
groups were significantly different (p=0.02) and are shown in Figure 10.
DISCUSSION
This example shows the successful prediction of clinical outcome in an
otherwise
indistinguishable group of Stage III melanoma patients using an expression
profile derived from
microarray gene expression data and qPCR. In two independent sets it has been
established that
the two developed predictive score algorithms, which is based on 15
differentially expressed
genes, can be applied to microarray and qPCR data to prospectively predict
clinical outcome in
patients with Stage IIIB/C melanoma.
These patients were selected for similar stage disease and several studies
have demonstrated
more similarities in gene expression amongst autologous samples taken at
different stages than
between patients with similar stage disease 273L32 . The observation that
there are genes
differentially expressed between the groups which can be used to prospectively
predict outcome
with up to 92% accuracy, underscores their importance. Furthermore the
correlation of the
predictor with both TTP and overall survival also highlight the utility of the
predictor such that
the magnitude of difference in scores directly correlates with clinical
outcome.
CA 02725602 2010-11-24
WO 2008/143533 PCT/NZ2008/000118
39
Wherein in the description reference has been made to integers or components
having known
equivalents, such equivalents are herein incorporated as if individually set
fourth. Although the
invention has been described by way of example and with reference to possible
embodiments
thereof, it is to be appreciated that improvements and/or modifications may be
made without
departing from the scope thereof.
References
1. Australian Institute of Health and Welfare (AIHW): Cancer in Australia
2001. Canberra,
Australian Institute of Health and Welfare
Australasian Association of Cancer Registries (AACR), 2004
2. Florez A, Cruces M: Melanoma epidemic: true or false? Int J Dermatol 43:405-
7, 2004
3. Thursfield V, Farrugia H, Giles G: Cancer in Victoria 2004, Canstat.
Victoria, Cancer
Epidemiology Centre, 2006, pp 32
4. Thompson JF, Scolyer RA, Kefford RF: Cutaneous melanoma. Lancet 365:687-
701, 2005
5. Verma S, Quirt I, McCready D, et a]: Systematic review of systemic adjuvant
therapy for
patients at high risk for recurrent melanoma. Cancer 106:1431-42, 2006
6. Hersey P: Adjuvant therapy for high-risk primary and resected metastatic
melanoma. Intern
Med J 33:33-43, 2003
7. Kirkwood JM, Manola J, Ibrahim J, et al: A pooled analysis of eastern
cooperative
oncology group and intergroup trials of adjuvant high-dose interferon for
melanoma. Clin Cancer
Res 10:1670-7, 2004
8. Sondak VK, Sabel MS, Mule JJ: Allogeneic and autologous melanoma vaccines:
where
have we been and where are we going? Clin Cancer Res 12:2337s-2341 s, 2006
9. Balch CM, Sober AJ, Soong SJ, et al: The new melanoma staging system. Semin
Cutan
Med Surg 22:42-54, 2003
10. Kirkwood JM, Strawderman ME, Ernstoff MS, et al: Interferon alfa-2b
adjuvant therapy of
high-risk resected cutaneous melanoma: the Eastern Cooperative Oncology Group
Trial EST
1684. J Clin Oncol 14:7-17, 1996
11. Kirkwood JM, Ibrahim JG, Sondak VK, et al: High- and low-dose interferon
alfa-2b in
high-risk melanoma: first analysis of intergroup trial E1690/S911I/C9190. J
Clin Oncol
18:2444-58, 2000
12. Efron, B. and Tibshirani, R. An Introduction to the Bootstrap. Chapman &
Hall. 2005
13. McLaughlan GJ, Do K, Ambroise C Analyzing Microarray Gene Expression Data
(Wiley
Series in Probability and Statistics) 2004
CA 02725602 2010-11-24
WO 2008/143533 PCT/NZ2008/000118
14. Wright GW, Simon RM A random variance model for detection of differential
gene
expression in small microarray experiments. Bioinformatics 2003;19:2448-2455.
15. Smyth GK. Linear models and empirical Bayes methods for assessing
differential
expression in microarray experiments. Statistical Applications in Genetics and
Molecular
Biology 2004;3:Article 3.
16. LSnnstedt I. and Speed TP. Replicated microarray data. Statistica Sinica
2002;12:31-46.
17. Ihaka R, Gentleman R. R: A language for data analysis and graphics.
Journal of
Computational and Graphical Statistics 1996;5:299-314.
18. Becker RA, Chambers, JM and Wilks AR The New S Language. Wadsworth &
Brooks/Cole 1988.
19. Hastie T, Tibshirani R, Friedman J The Elements of Statistical Learning
Data Mining,
Inference and Prediction Springer 2003
20. Gentleman R., Carey VJ, Huber W., Irizarry RA, Dudoit S. Bioinformatics
and
Computational Biology Solutions Using R and Bioconductor. Springer 2005.
21. Neter J, Kutner MH, Wasserman W, Nachtsheim CJ, Applied Linear Statistical
Models
McGraw-Hill/Irwin 1996
22. Venables, WN, Ripley, BD Modem Applied Statistics with S. 4t' ed..
Springer 2002.
23. Ripley, B. D. Pattern Recognition and Neural Networks Cambridge University
Press 1996
24. Cristianini N, Shawe-Taylor J An Introduction to Support Vector Machines
(and other
kernel-based learning methods) Cambridge University Press 2000
25. Breiman L, Friedman J, Stone CJ, Olshen RA Classification and Regression
Trees
Chapman & Ha1UCRC 1984
26. Good, PI Resampling Methods: A Practical Guide to Data Analysis Birkhauser
1999
27. Winnepenninckx V, Lazar V, Michiels S, et al: Gene expression profiling of
primary
cutaneous melanoma and clinical outcome. J Natl Cancer Inst 98:472-82, 2006
28. Benjamin Y, Hochberg Y: Controlling the false discovery rate: a practical
and powerful
approach to multiple testing. Journal of the Royal Statistical Society 57:289-
300, 1995
29. Livak KJ, Schmittgen TD: Analysis of relative gene expression data using
real-time
quantitative PCR and the 2(-Delta Delta C(T)) Method. Methods 25:402-8, 2001
30. Balch CM, Sober AJ, Soong SJ, et al: The new melanoma staging system.
Semin Cutan
Med Surg 22:42-54, 2003
31. Wang E, Miller LD, Ohnmacht GA, et al: Prospective molecular profiling of
melanoma
metastases suggests classifiers of immune responsiveness. Cancer Res 62:3581-
6, 2002
CA 02725602 2010-11-24
WO 2008/143533 PCT/NZ2008/000118
41
32. Ramaswamv S, Ross KN, Lander ES, et al: A molecular signature of
metastasis in primary
solid tumors. Nat Genet 33:49-54, 2003
INDUSTRIAL APPLICABILITY
The methods, compositions, kits, and devices of the invention, which are based
on prognostic
cancer markers, specifically melanoma prognostic markers, are useful for the
prognosis and
treatment of cancer, particularly melanoma.