Note: Descriptions are shown in the official language in which they were submitted.
CA 02730636 2011-01-12
WO 2010/007489 PCT/IB2009/006214
Cross Reference to Related Application
This application claims the benefit of United States Provisional Application
No.
61/080,977, filed July 15, 2008 which is hereby incorporated by reference
herein in its
entirety.
Summary
The present disclosure relates to signal processing and, more particularly,
the
present disclosure relates to using continuous wavelet transforms for
processing, for
example, a photoplethysmograph (PPG) signal. PPG signals are used in a variety
of
fields, including in medical monitoring devices, such as a pulse oximeter. A
pulse
oximeter is a device that is capable of indirectly measuring blood oxygen
saturation and
is typically used by healthcare providers as a monitoring device for patients.
The
oximeter generally uses a light emitter that shines through a monitoring site
or point on a
patient. A photodetector or other sensor may be used to receive the light that
has passed
through the monitoring site. The light passing through the site may be
measured and
analyzed to determine the patient's blood oxygen saturation using, for
example, a
scalogram generated by wavelet-transformation of the PPG signal.
Since oxygen is critical to sustain human life, monitoring patients' blood
oxygen
saturation is one important indicator of a patient's physiological condition.
If blood
oxygen saturation levels determined by the oximeter are low, out of range,
above or
below a certain threshold, this may be an indication that the patient is
generally
experiencing low perfusion, high vascular peripheral resistance, or other
condition, or
that the monitoring site is locally experiencing low perfusion, high vascular
peripheral
resistance, or other condition. Certain illnesses or physiological conditions
may cause
low perfusion, and high peripheral resistance. Low perfusion may also be
caused (or
worsened) by patient position, or external factors.
In the various embodiments disclosed herein, features of a PPG scalogram are
analyzed to determine whether the monitored patient is experiencing low
perfusion or
high vascular peripheral resistance. When low perfusion or high vascular
peripheral
resistance is detected, a corrective action may be triggered. The corrective
action may
include an alert to examine the patient, reposition a sensor, use a second
sensor, or other
action.
One way to perform the analysis may include identifying features of the
scalogram, for example, marker regions, and residual markers located near a
pulse band.
Another technique may be provided by comparing features of the scalogram
against, for
1
CA 02730636 2011-01-12
WO 2010/007489 PCT/IB2009/006214
example, selectable thresholds, other scalograms having known and distinct
aspects and
features, or other comparative elements. These techniques are further
described herein.
Although the embodiments herein are discussed in reference to use with a pulse
oximeter, they are equally applicable to other types of devices, including
continuous
non-invasive blood pressure (CNIBP) measurement devices. Systems and methods
for
calculating CNIBP are described in Chen et al. U.S. Patent No. 6,566,251 and
Sethi et al.
U.S. Patent Application No. 12/242,238, entitled "SYSTEMS AND METHODS FOR
NON-INVASIVE BLOOD PRESSURE MONITORING," filed September 30, 2008
(Docket No. H-RM-0 1205-1 (COV-11-01)), both of which are incorporated by
reference
herein in their entireties.
An embodiment is provided by a method comprising receiving a signal that may
be transformed using a wavelet transform. The transformed signal may be used
to
generate a scalogram. A pulse band and a marker region adjacent to the pulse
band in
the scalogramn may be identified. A characteristic of the marker region may be
identified
and used as a basis for determining that a low perfusion condition exists. If
such
condition exists, an event may trigger. The marker region may be identified
using ridges
or modulus maxima of the scalogram. Some characteristics of the marker region
include: a change in energy within the marker region over time, a change in
amplitude
within the marker region over time, a residual marker, a number of residual
markers, a
size of the residual marker, a location of the residual marker, energy of the
residual
marker, amplitude of the residual marker, and strength of the residual marker.
The
characteristics may be compared with a threshold, which may cause the event to
trigger.
The threshold may be based in part on a user classification. The user
classification may
also be used as a basis for triggering the event. Some types of events
include: sending a
control signal to a display, sending a control signal to a speaker, generating
an alert,
sending a control signal to a second sensor, and moving a sensor. Some
examples of
alerts include: an indication of a low perfusion condition, an indication to
examine a
patient, an indication to move the sensor, an indication to move the sensor
closer to an
artery, an indication to move the sensor away from an artery, and an
indication of use of
a second sensor. In some embodiments, a second scalogram may be generated and
compared against the original scalogram.
In another embodiment, a system is provided comprising: a signal generator for
generating a signal, a processor coupled to the signal generator, and a
display. The
2
CA 02730636 2011-01-12
WO 2010/007489 PCT/IB2009/006214
processor is capable of transforming the signal using a wavelet transform. The
transformed signal may be used as a basis for generating a scalogram. A pulse
band and
marker region adjacent to the pulse band in the scalogram may be identified by
the
processor. The processor is also capable of identifying a characteristic of
the marker
region, which may be used for determining that a low perfusion condition
exists. The
processor may also trigger an event.
Brief Description of the Drawings
The patent or application file contains at least one drawing executed in
color.
Copies of this patent or patent application publication with color drawing(s)
will be
provided by the Office upon request and payment of the necessary fee.
The above and other features of the present disclosure, its nature and various
advantages will be more apparent upon consideration of the following detailed
description, taken in conjunction with the accompanying drawings in which:
FIG. 1 shows an illustrative pulse oximetry system in accordance with an
embodiment;
FIG. 2 is a block diagram of the illustrative pulse oximetry system of FIG. 1
coupled to a patient in accordance with an embodiment;
FIGS. 3(a) and 3(b) show illustrative views of a scalogram derived from a PPG
signal in accordance with an embodiment;
FIG. 3(c) shows an illustrative scalogram derived from a signal containing two
pertinent components in accordance with an embodiment;
FIG. 3(d) shows an illustrative schematic of signals associated with a ridge
in
FIG. 3(c) and illustrative schematics of a further wavelet decomposition of
these newly
derived signals in accordance with an embodiment;
FIGS. 3(e) and 3(f) are flow charts of illustrative steps involved in
performing an
inverse continuous wavelet transform in accordance with embodiments;
FIG. 4 is a block diagram of an illustrative continuous wavelet processing
system
in accordance with some embodiments;
FIG. 5 shows an illustrative method for identifying a low perfusion condition
in
accordance with an embodiment.
FIG. 6(a) shows a plot of a pulse signal and scalogram in accordance with an
embodiment;
FIG. 6(b) shows a plot of energy density in accordance with an embodiment;
3
CA 02730636 2011-01-12
WO 2010/007489 PCT/IB2009/006214
FIG. 6(c) shows a plot of representative energy in accordance with an
embodiment;
FIG. 6(d) shows an illustrative scalogram derived from a PPG signal in
accordance with an embodiment; and
FIG. 7 shows an illustrative method for identifying a characteristic of a
marker
region in accordance with an embodiment.
Detailed Description
In medicine, a plethysmograph is an instrument that measures physiological
parameters, such as variations in the size of an organ or body part, through
an analysis of
the blood passing through or present in the targeted body part, or a depiction
of these
variations. An oximeter is an instrument that may determine the oxygen
saturation of the
blood. One common type of oximeter is a pulse oximeter, which determines
oxygen
saturation by analysis of an optically sensed plethysmograph.
A pulse oximeter is a medical device that may indirectly measure the oxygen
saturation of a patient's blood (as opposed to measuring oxygen saturation
directly by
analyzing a blood sample taken from the patient) and changes in blood volume
in the
skin. Ancillary to the blood oxygen saturation measurement, pulse oximeters
may also
be used to measure the pulse rate of the patient. Pulse oximeters typically
measure and
display various blood flow characteristics including, but not limited to, the
oxygen
saturation of hemoglobin in arterial blood.
An oximeter may include a light sensor that is placed at a site on a patient,
typically a fingertip, toe, forehead or earlobe, or in the case of a neonate,
across a foot.
The oximeter may pass light using a light source through blood perfused tissue
and
photoelectrically sense the absorption of light in the tissue. For example,
the oximeter
may measure the intensity of light that is received at the light sensor as a
function of
time. A signal representing light intensity versus time or a mathematical
manipulation of
this signal (e.g., a scaled version thereof, a log taken thereof, a scaled
version of a log
taken thereof, etc.) may be referred to as the photoplethysmograph (PPG)
signal. In
addition, the term "PPG signal," as used herein, may also refer to an
absorption signal
(i.e., representing the amount of light absorbed by the tissue) or any
suitable
mathematical manipulation thereof. The light intensity or the amount of light
absorbed
may then be used to calculate the amount of the blood constituent (e.g.,
oxyhemoglobin)
being measured as well as the pulse rate and when each individual pulse
occurs.
4
CA 02730636 2011-01-12
WO 2010/007489 PCT/IB2009/006214
The light passed through the tissue is selected to be of one or more
wavelengths
that are absorbed by the blood in an amount representative of the amount of
the blood
constituent present in the blood. The amount of light passed through the
tissue varies in
accordance with the changing amount of blood constituent in the tissue and the
related
light absorption. Red and infrared wavelengths may be used because it has been
observed that highly oxygenated blood will absorb relatively less red light
and more
infrared light than blood with a lower oxygen saturation. By comparing the
intensities of
two wavelengths at different points in the pulse cycle, it is possible to
estimate the blood
oxygen saturation of hemoglobin in arterial blood.
When the measured blood parameter is the oxygen saturation of hemoglobin, a
convenient starting point assumes a saturation calculation based on Lambert-
Beer's law.
The following notation will be used herein:
I (~ , t) = to (2) exp(-(s(3" (a,) + (1- s)(3r (1%))l(t)) (1)
where:
X=wavelength;
t=time;
I=intensity of light detected;
I0=intensity of light transmitted;
s=oxygen saturation;
00, 0,=empirically derived absorption coefficients; and
l(t)=a combination of concentration and path length from emitter to detector
as a function
of time.
The traditional approach measures light absorption at two wavelengths (e.g.,
red
and infrared (IR)), and then calculates saturation by solving for the "ratio
of ratios" as
follows.
1. First, the natural logarithm of (1) is taken ("log" will be used to
represent the natural
logarithm) for IR and Red
log I=log Ia (s(30+(1-s) (3,)l (2)
2. (2) is then differentiated with respect to time
d log I = _(s/j,, + (1- s)/jr)dl (3)
dt dt
5
CA 02730636 2011-01-12
WO 2010/007489 PCT/IB2009/006214
3. Red (3) is divided by IR (3)
dlogI(2R)/dt _ s/3o,(AR)+(1-s)I3r(AR) (4)
d logI(2IR)/dt sf30(AIR)+(1-s)lr(AIR)
4. Solving for s
d log I(AIR) d log I(2,R)
dt /''r(~R) dt A(AIR)
s= dlogI(2R) /~ 9 /~
dt (A(AIR)A(AIR))
d logl(a,R)
dt (18,(AR)-Nr(2R))
Note in discrete time
d log1(2,t) log1(2,t2)- log1(2,t1)
dt
Using log A-log B=log A/B,
d log I(2, t) I t2,
dt tog 2)
I(t1,A)
So, (4) can be rewritten as
dlogI(2R) to I(t1,AR)
dt g I(t2,2R)
d log A AIR) log I(t, - R (5)
1 AIR )
dt I (t2I AIR )
where R represents the "ratio of ratios." Solving (4) for s using (5) gives
s _ I8,.(AR)-R/r(AIR)
R(No(AIR) -)6,. (AIR)) No(AR)+)'r(AR)
From (5), R can be calculated using two points (e.g., PPG maximum and
minimum), or a
family of points. One method using a family of points uses a modified version
of (5).
Using the relationship
d log I dI / dt
dt I (6)
now (5) becomes
d logI(2R) I(t2,2R)-I(ti,AR)
dt = I(t,,AR)
dlogI(2IR) I(t2,2/R)-I(ti,2/R)
dt I(tI,AIR)
_ _I(t21 aR)-I(t1_R)]I IIAIR)
[I(t2,AIR) -I(ti,2IR)]I(tt,2R)
6
CA 02730636 2011-01-12
WO 2010/007489 PCT/IB2009/006214
= R (7)
which defines a cluster of points whose slope of y versus x will give R where
.x /(t) -C[I(t2,AIR) -I(tl,A1R)JI(tl,2R)
Y(t) =LI(t2e2R)-I(t1,2R),I(t1,AIR) (8)
Y(t) = Rx(t)
FIG.1 is a perspective view of an embodiment of a pulse oximetry system 10.
System 10 may include a sensor 12 and a pulse oximetry monitor 14. Sensor 12
may
include an emitter 16 for emitting light at two or more wavelengths into a
patient's
tissue. A detector 18 may also be provided in sensor 12 for detecting the
light originally
from emitter 16 that emanates from the patient's tissue after passing through
the tissue.
According to another embodiment and as will be described, system 10 may
include a plurality of sensors forming a sensor array in lieu of single sensor
12. Each of
the sensors of the sensor array may be a complementary metal oxide
semiconductor
(CMOS) sensor. Alternatively, each sensor of the array may be charged coupled
device
(CCD) sensor. In another embodiment, the sensor array may be made up of a
combination of CMOS and CCD sensors. The CCD sensor may comprise a photoactive
region and a transmission region for receiving and transmitting data whereas
the CMOS
sensor may be made up of an integrated circuit having an array of pixel
sensors. Each
pixel may have a photodetector and an active amplifier.
According to an embodiment, emitter 16 and detector 18 may be on opposite
sides of a digit such as a finger or toe, in which case the light that is
emanating from the
tissue has passed completely through the digit. In an embodiment, emitter 16
and
detector 18 may be arranged so that light from emitter 16 penetrates the
tissue and is
reflected by the tissue into detector 18, such as a sensor designed to obtain
pulse
oximetry data from a patient's forehead.
In an embodiment, the sensor or sensor array may be connected to and draw its
power from monitor 14 as shown. In another embodiment, the sensor may be
wirelessly
connected to monitor 14 and include its own battery or similar power supply
(not
shown). Monitor 14 may be configured to calculate physiological parameters
based at
least in part on data received from sensor 12 relating to light emission and
detection. In
an alternative embodiment, the calculations may be performed on the monitoring
device
itself and the result of the oximetry reading may be passed to monitor 14.
Further,
7
CA 02730636 2011-01-12
WO 2010/007489 PCT/IB2009/006214
monitor 14 may include a display 20 configured to display the physiological
parameters
or other information about the system. In the embodiment shown, monitor 14 may
also
include a speaker 22 to provide an audible sound that may be used in various
other
embodiments, such as for example, sounding an audible alarm in the event that
a
patient's physiological parameters are not within a predefined normal range.
[0001] In an embodiment, sensor 12, or the sensor array, may be
communicatively
coupled to monitor 14 via a cable 24. However, in other embodiments, a
wireless
transmission device (not shown) or the like may be used instead of or in
addition to cable
24.
In the illustrated embodiment, pulse oximetry system 10 may also include a
multi-parameter patient monitor 26. The monitor may be cathode ray tube type,
a flat
panel display (as shown) such as a liquid crystal display (LCD) or a plasma
display, or
any other type of monitor now known or later developed. Multi-parameter
patient
monitor 26 may be configured to calculate physiological parameters and to
provide a
display 28 for information from monitor 14 and from other medical monitoring
devices
or systems (not shown). For example, multiparameter patient monitor 26 may be
configured to display an estimate of a patient's blood oxygen saturation
generated by
pulse oximetry monitor 14 (referred to as an "Sp02" measurement), pulse rate
information from monitor 14 and blood pressure from a blood pressure monitor
(not
shown) on display 28.
Monitor 14 may be communicatively coupled to multi-parameter patient monitor
26 via a cable 32 or 34 that is coupled to a sensor input port or a digital
communications
port, respectively and/or may communicate wirelessly (not shown). In addition,
monitor
14 and/or multi-parameter patient monitor 26 may be coupled to a network to
enable the
sharing of information with servers or other workstations (not shown). Monitor
14 may
be powered by a battery (not shown) or by a conventional power source such as
a wall
outlet.
FIG. 2 is a block diagram of a pulse oximetry system, such as pulse oximetry
system 10 of FIG. 1, which may be coupled to a patient 40 in accordance with
an
embodiment. Certain illustrative components of sensor 12 and monitor 14 are
illustrated
in FIG. 2. Sensor 12 may include emitter 16, detector 18, and encoder 42. In
the
embodiment shown,- emitter 16 may be configured to emit at least two
wavelengths of
light (e.g., RED and IR) into a patient's tissue 40. Hence, emitter 16 may
include a RED
8
CA 02730636 2011-01-12
WO 2010/007489 PCT/IB2009/006214
light emitting light source such as RED light emitting diode (LED) 44 and an
IR light
emitting light source such as IR LED 46 for emitting light into the patient's
tissue 40 at
the wavelengths used to calculate the patient's physiological parameters. In
one
embodiment, the RED wavelength may be between about 600 nm and about 700 nm,
and
the IR wavelength may be between about 800 nm and about 1000 nm. In
embodiments
where a sensor array is used in place of single sensor, each sensor may be
configured to
emit a single wavelength. For example, a first sensor emits only a RED light
while a
second only emits an IR light.
It will be understood that, as used herein, the term "light" may refer to
energy
produced by radiative sources and may include one or more of ultrasound,
radio,
microwave, millimeter wave, infrared, visible, ultraviolet, gamma ray or X-ray
electromagnetic radiation. As used herein, light may also include any
wavelength within
the radio, microwave, infrared, visible, ultraviolet, or X-ray spectra, and
that any suitable
wavelength of electromagnetic radiation may be appropriate for use with the
present
techniques. Detector 18 may be chosen to be specifically sensitive to the
chosen targeted
energy spectrum of the emitter 16.
In an embodiment, detector 18 may be configured to detect the intensity of
light
at the RED and IR wavelengths. Alternatively, each sensor in the array may be
configured to detect an intensity of a single wavelength. In operation, light
may enter
detector 18 after passing through the patient's tissue 40. Detector 18 may
convert the
intensity of the received light into an electrical signal. The light intensity
is directly
related to the absorbance and/or reflectance of light in the tissue 40. That
is, when more
light at a certain wavelength is absorbed or reflected, less light of that
wavelength is
received from the tissue by the detector 18. After converting the received
light to an
electrical signal, detector 18 may send the signal to monitor 14, where
physiological
parameters may be calculated based on the absorption of the RED and IR
wavelengths in
the patient's tissue 40.
In an embodiment, encoder 42 may contain information about sensor 12, such as
what type of sensor it is (e.g., whether the sensor is intended for placement
on a forehead
or digit) and the wavelengths of light emitted by emitter 16. This information
may be
used by monitor 14 to select appropriate algorithms, lookup tables and/or
calibration
coefficients stored in monitor 14 for calculating the patient's physiological
parameters.
9
CA 02730636 2011-01-12
WO 2010/007489 PCT/IB2009/006214
Encoder 42 may contain information specific to patient 40, such as, for
example,
the patient's age, weight, and diagnosis. This information may allow monitor
14 to
determine, for example, patient-specific threshold ranges in which the
patient's
physiological parameter measurements should fall and to enable or disable
additional
physiological parameter algorithms. Encoder 42 may, for instance, be a coded
resistor
which stores values corresponding to the type of sensor 12 or the type of each
sensor in
the sensor array, the wavelengths of light emitted by emitter 16 on each
sensor of the
sensor array, and/or the patient's characteristics. In another embodiment,
encoder 42
may include a memory on which one or more of the following information may be
stored
for communication to monitor 14: the type of the sensor 12; the wavelengths of
light
emitted by emitter 16; the particular wavelength each sensor in the sensor
array is
monitoring; a signal threshold for each sensor in the sensor array; any other
suitable
information; or any combination thereof.
In an embodiment, signals from detector 18 and encoder 42 may be transmitted
to
monitor 14. In the embodiment shown, monitor 14 may include a general-purpose
microprocessor 48 connected to an internal bus 50. Microprocessor 48 may be
adapted
to execute software, which may include an operating system and one or more
applications, as part of performing the functions described herein. Also
connected to bus
50 may be a read-only memory (ROM) 52, a random access memory (RAM) 54, user
inputs 56, display 20, and speaker 22.
RAM 54 and ROM 52 are illustrated by way of example, and not limitation. Any
suitable computer-readable media may be used in the system for data storage.
Computer-readable media are capable of storing information that can be
interpreted by
microprocessor 48. This information may be data or may take the form of
computer-
executable instructions, such as software applications, that cause the
microprocessor to
perform certain functions and/or computer-implemented methods. Depending on
the
embodiment, such computer-readable media may include computer storage media
and
communication media. Computer storage media may include volatile and non-
volatile,
removable and non-removable media implemented in any method or technology for
storage of information such as computer-readable instructions, data
structures, program
modules or other data. Computer storage media may include, but is not limited
to, RAM,
ROM, EPROM, EEPROM, flash memory or other solid state memory technology, CD-
ROM, DVD, or other optical storage, magnetic cassettes, magnetic tape,
magnetic disk
CA 02730636 2011-01-12
WO 2010/007489 PCT/IB2009/006214
storage or other magnetic storage devices, or any other medium which can be
used to
store the desired information and which can be accessed by components of the
system.
In the embodiment shown, a time processing unit (TPU) 58 may provide timing
control signals to a light drive circuitry 60, which may control when emitter
16 is
illuminated and multiplexed timing for the RED LED 44 and the IR LED 46. TPU
58
may also control the gating-in of signals from detector 18 through an
amplifier 62 and a
switching circuit 64. These signals are sampled at the proper time, depending
upon
which light source is illuminated. The received signal from detector 18 may be
passed
through an amplifier 66, a low pass filter 68, and an analog-to-digital
converter 70. The
digital data may then be stored in a queued serial module (QSM) 72 (or buffer)
for later
downloading to RAM 54 as QSM 72 fills up. In one embodiment, there may be
multiple
separate parallel paths having amplifier 66, filter 68, and A/D converter 70
for multiple
light wavelengths or spectra received.
In an embodiment, microprocessor 48 may determine the patient's physiological
parameters, such as Sp02 and pulse rate, using various algorithms and/or look-
up tables
based on the value of the received signals and/or data corresponding to the
light received
by detector 18. Signals corresponding to information about patient 40, and
particularly
about the intensity of light emanating from a patient's tissue over time, may
be
transmitted from encoder 42 to a decoder 74. These signals may include, for
example,
encoded information relating to patient characteristics. Decoder 74 may
translate these
signals to enable the microprocessor to determine the thresholds based on
algorithms or
look-up tables stored in ROM 52. User inputs 56 may be used to enter
information about
the patient, such as age, weight, height, diagnosis, medications, treatments,
and so forth.
In an embodiment, display 20 may exhibit a list of values which may generally
apply to
the patient, such as, for example, age ranges or medication families, which
the user may
select using user inputs 56.
The optical signal through the tissue can be degraded by noise, among other
sources. One source of noise is ambient light that reaches the light detector.
Another
source of noise is electromagnetic coupling from other electronic instruments.
Movement of the patient also introduces noise and affects the signal. For
example, the
contact between the detector and the skin, or the emitter and the skin, can be
temporarily
disrupted when movement causes either to move away from the skin. In addition,
because blood is a fluid, it responds differently than the surrounding tissue
to inertial
11
CA 02730636 2011-01-12
WO 2010/007489 PCT/IB2009/006214
effects, thus resulting in momentary changes in volume at the point to which
the
oximeter probe is attached.
Noise (e.g., from patient movement) can degrade a pulse oximetry signal relied
upon by a physician, without the physician's awareness. This is especially
true if the
monitoring of the patient is remote, the motion is too small to be observed,
or the doctor
is watching the instrument or other parts of the patient, and not the sensor
site.
Processing pulse oximetry (i.e., PPG) signals may involve operations that
reduce the
amount of noise present in the signals or otherwise identify noise components
in order to
prevent them from affecting measurements of physiological parameters derived
from the
PPG signals.
It will be understood that the present disclosure is applicable to any
suitable
signals and that PPG signals are used merely for illustrative purposes. Those
skilled in
the art will recognize that the present disclosure has wide applicability to
other signals
including, but not limited to other biosignals (e.g., electrocardiogram,
electroencephalogram, electrogastrogram, electromyogram, heart rate signals,
pathological sounds, ultrasound, or any other suitable biosignal), dynamic
signals, non-
destructive testing signals, condition monitoring signals, fluid signals,
geophysical
signals, astronomical signals, electrical signals, financial signals including
financial
indices, sound and speech signals, chemical signals, meteorological signals
including
climate signals, and/or any other suitable signal, and/or any combination
thereof.
In one embodiment, a PPG signal may be transformed using a continuous wavelet
transform. Information derived from the transform of the PPG signal (i.e., in
wavelet
space) may be used to provide measurements of one or more physiological
parameters.
The continuous wavelet transform of a signal x(t) in accordance with the
present
disclosure may be defined as
T(a,b) _ 1 x(t)y/ I t -bJdt (9)
where xr'* (t) is the complex conjugate of the wavelet function uV(t), a is
the dilation
parameter of the wavelet and b is the location parameter of the wavelet. The
transform
given by equation (9) may be used to construct a representation of a signal on
a
transform surface. The transform may be regarded as a time-scale
representation.
Wavelets are composed of a range of frequencies, one of which may be denoted
as the
12
CA 02730636 2011-01-12
WO 2010/007489 PCT/IB2009/006214
characteristic frequency of the wavelet, where the characteristic frequency
associated
with the wavelet is inversely proportional to the scale a. One example of a
characteristic
frequency is the dominant frequency. Each scale of a particular wavelet may
have a
different characteristic frequency. The underlying mathematical detail
required for the
implementation within a time-scale can be found, for example, in Paul S.
Addison, The
Illustrated Wavelet Transform Handbook (Taylor & Francis Group 2002), which is
hereby incorporated by reference herein in its entirety.
The continuous wavelet transform decomposes a signal using wavelets, which are
generally highly localized in time. The continuous wavelet transform may
provide a
higher resolution relative to discrete transforms, thus providing the ability
to garner more
information from signals than typical frequency transforms such as Fourier
transforms
(or any other spectral techniques) or discrete wavelet transforms. Continuous
wavelet
transforms allow for the use of a range of wavelets with scales spanning the
scales of
interest of a signal such that small scale signal components correlate well
with the
smaller scale wavelets and thus manifest at high energies at smaller scales in
the
transform. Likewise, large scale signal components correlate well with the
larger scale
wavelets and thus manifest at high energies at larger scales in the transform.
Thus,
components at different scales may be separated and extracted in the wavelet
transform
domain. Moreover, the use of a continuous range of wavelets in scale and time
position
allows for a higher resolution transform than is possible relative to discrete
techniques.
In addition, transforms and operations that convert a signal or any other type
of
data into a spectral (i.e., frequency) domain necessarily create a series of
frequency
transform values in a two-dimensional coordinate system where the two
dimensions may
be frequency and, for example, amplitude. For example, any type of Fourier
transform
would generate such a two-dimensional spectrum. In contrast, wavelet
transforms, such
as continuous wavelet transforms, are required to be defined in a three-
dimensional
coordinate system and generate a surface with dimensions of time, scale and,
for
example, amplitude. Hence, operations performed in a spectral domain cannot be
performed in the wavelet domain; instead the wavelet surface must be
transformed into a
spectrum (i.e., by performing an inverse wavelet transform to convert the
wavelet surface
into the time domain and then performing a spectral transform from the time
domain).
Conversely, operations performed in the wavelet domain cannot be performed in
the
spectral domain; instead a spectrum must first be transformed into a wavelet
surface (i.e.,
13
CA 02730636 2011-01-12
WO 2010/007489 PCT/IB2009/006214
by performing an inverse spectral transform to convert the spectral domain
into the time
domain and then performing a wavelet transform from the time domain). Nor does
a
cross-section of the three-dimensional wavelet surface along, for example, a
particular
point in time equate to a frequency spectrum upon which spectral-based
techniques may
be used. At least because wavelet space includes a time dimension, spectral
techniques
and wavelet techniques are not interchangeable. It will be understood that
converting a
system that relies on spectral domain processing to one that relies on wavelet
space
processing would require significant and fundamental modifications to the
system in
order to accommodate the wavelet space processing (e.g., to derive a
representative
energy value for a signal or part of a signal requires integrating twice,
across time and
scale, in the wavelet domain while, conversely, one integration across
frequency is
required to derive a representative energy value from a spectral domain). As a
further
example, to reconstruct a temporal signal requires integrating twice, across
time and
scale, in the wavelet domain while, conversely, one integration across
frequency is
required to derive a temporal signal from a spectral domain. It is well known
in the art
that, in addition to or as an alternative to amplitude, parameters such as
energy density,
modulus, phase, among others may all be generated using such transforms and
that these
parameters have distinctly different contexts and meanings when defined in a
two-
dimensional frequency coordinate system rather than a three-dimensional
wavelet
coordinate system. For example, the phase of a Fourier system is calculated
with respect
to a single origin for all frequencies while the phase for a wavelet system is
unfolded into
two dimensions with respect to a wavelet's location (often in time) and scale.
The energy density function of the wavelet transform, the scalogram, is
defined
as
S(a,b) _ JT (a,b) (10)
where `11' is the modulus operator. The scalogram may be rescaled for useful
purposes.
One common rescaling is defined as
JT(a,b)
SR(a,b) _ (11)
a
and is useful for defining ridges in wavelet space when, for example, the
Morlet wavelet
is used. Ridges are defined as the locus of points of local maxima in the
plane. Any
reasonable definition of a ridge may be employed in the method. Also included
as a
definition of a ridge herein are paths displaced from the locus of the local
maxima. A
14
CA 02730636 2011-01-12
WO 2010/007489 PCT/IB2009/006214
ridge associated with only the locus of points of local maxima in the plane
are labeled a
"maxima ridge".
For implementations requiring fast numerical computation, the wavelet
transform
may be expressed as an approximation using Fourier transforms. Pursuant to the
convolution theorem, because the wavelet transform is the cross-correlation of
the signal
with the wavelet function, the wavelet transform may be approximated in terms
of an
inverse FFT of the product of the Fourier transform of the signal and the
Fourier
transform of the wavelet for each required a scale and then multiplying the
result by .
In the discussion of the technology which follows herein, the "scalogram" may
be
taken to include all suitable forms of rescaling including, but not limited
to, the original
unsealed wavelet representation, linear rescaling, any power of the modulus of
the
wavelet transform, or any other suitable rescaling. In addition, for purposes
of clarity
and conciseness, the term "scalogram" shall be taken to mean the wavelet
transform,
T(a,b) itself, or any part thereof. For example, the real part of the wavelet
transform, the
imaginary part of the wavelet transform, the phase of the wavelet transform,
any other
suitable part of the wavelet transform, or any combination thereof is intended
to be
conveyed by the term "scalogram".
A scale, which may be interpreted as a representative temporal period, may be
converted to a characteristic frequency of the wavelet function. The
characteristic
frequency associated with a wavelet of arbitrary a scale is given by
f =f' (12)
a
where f,, the characteristic frequency of the mother wavelet (i.e., at a=1),
becomes a
scaling constant and f is the representative or characteristic frequency for
the wavelet at
arbitrary scale a.
Any suitable wavelet function may be used in connection with the present
disclosure. One of the most commonly used complex wavelets, the Morlet
wavelet, is
defined as:
w o = 1/4(ei2/tfot -e-(2arf0)2/2 )e t2/2 (13)
wherefo is the central frequency of the mother wavelet. The second term in the
parenthesis is known as the correction term, as it corrects for the non-zero
mean of the
complex sinusoid within the Gaussian window. In practice, it becomes
negligible for
CA 02730636 2011-01-12
WO 2010/007489 PCT/IB2009/006214
values of fo>>0 and can be ignored, in which case, the Morlet wavelet can be
written in a
simpler form as
1 eM'fOte _t2 /2 (14)
() 1/4
This wavelet is a complex wave within a scaled Gaussian envelope. While both
definitions of the Morlet wavelet are included herein, the function of
equation (14) is not
strictly a wavelet as it has a non-zero mean (i.e., the zero frequency term of
its
corresponding energy spectrum is non-zero). However, it will be recognized by
those
skilled in the art that equation (14) may be used in practice with fo>>0 with
minimal
error and is included (as well as other similar near wavelet functions) in the
definition of
a wavelet herein. A more detailed overview of the underlying wavelet theory,
including
the definition of a wavelet function, can be found in the general literature.
Discussed
herein is how wavelet transform features may be extracted from the wavelet
decomposition of signals. For example, wavelet decomposition of PPG signals
may be
used to provide clinically useful information within a medical device.
Pertinent repeating features in a signal give rise to a time-scale band in
wavelet
space or a resealed wavelet space. For example, the pulse component of a PPG
signal
produces a dominant band in wavelet space at or around the pulse frequency.
FIGS. 3(a)
and (b) show two views of an illustrative scalogram derived from a PPG signal,
according to an embodiment. The figures show an example of the band caused by
the
pulse component in such a signal. The pulse band is located between the dashed
lines in
the plot of FIG. 3(a). The band is formed from a series of dominant coalescing
features
across the scalogram. This can be clearly seen as a raised band across the
transform
surface in FIG. 3(b) located within the region of scales indicated by the
arrow in the plot
(corresponding to 60 beats per minute). The maxima of this band with respect
to scale is
the ridge. The locus of the ridge is shown as a black curve on top of the band
in FIG.
3(b). By employing a suitable rescaling of the scalogram, such as that given
in equation
(11), the ridges found in wavelet space may be related to the instantaneous
frequency of
the signal. In this way, the pulse rate may be obtained from the PPG signal.
Instead of
rescaling the scalogram, a suitable predefined relationship between the scale
obtained
from the ridge on the wavelet surface and the actual pulse rate may also be
used to
determine the pulse rate.
16
CA 02730636 2011-01-12
WO 2010/007489 PCT/IB2009/006214
By mapping the time-scale coordinates of the pulse ridge onto the wavelet
phase
information gained through the wavelet transform, individual pulses may be
captured. In
this way, both times between individual pulses and the timing of components
within each
pulse may be monitored and used to detect heart beat anomalies, measure
arterial system
compliance, or perform any other suitable calculations or diagnostics.
Alternative
definitions of a ridge may be employed. Alternative relationships between the
ridge and
the pulse frequency of occurrence may be employed.
As discussed above, pertinent repeating features in the signal give rise to a
time-
scale band in wavelet space or a rescaled wavelet space. For a periodic
signal, this band
remains at a constant scale in the time-scale plane. For many real signals,
especially
biological signals, the band may be non-stationary; varying in scale,
amplitude, or both
over time. FIG. 3(c) shows an illustrative schematic of a wavelet transform of
a signal
containing two pertinent components leading to two bands in the transform
space,
according to an embodiment. These bands are labeled band A and band B on the
three-
dimensional schematic of the wavelet surface. In this embodiment, the band
ridge is
defined as the locus of the peak values of these bands with respect to scale.
For purposes
of discussion, it may be assumed that band B contains the signal information
of interest.
This will be referred to as the "primary band". In addition, it may be assumed
that the
system from which the signal originates, and from which the transform is
subsequently
derived, exhibits some form of coupling between the signal components in band
A and
band B. When noise or other erroneous features are present in the signal with
similar
spectral characteristics of the features of band B then the information within
band B can
become ambiguous (i.e., obscured, fragmented or missing). In this case, the
ridge of
band A may be followed in wavelet space and extracted either as an amplitude
signal or a
scale signal which will be referred to as the "ridge amplitude perturbation"
(RAP) signal
and the "ridge scale perturbation" (RSP) signal, respectively. The RAP and RSP
signals
may be extracted by projecting the ridge onto the time-amplitude or time-scale
planes,
respectively. The top plots of FIG. 3(d) show a schematic of the RAP and RSP
signals
associated with ridge A in FIG. 3(c). Below these RAP and RSP signals are
schematics
of a further wavelet decomposition of these newly derived signals. This
secondary
wavelet decomposition allows for information in the region of band B in FIG.
3(c) to be
made available as band C and band D. The ridges of bands C and D may serve as
instantaneous time-scale characteristic measures of the signal components
causing bands
17
CA 02730636 2011-01-12
WO 2010/007489 PCT/IB2009/006214
C and D. This technique, which will be referred to herein as secondary wavelet
feature
decoupling (SWFD), may allow information concerning the nature of the signal
components associated with the underlying physical process causing the primary
band B
(FIG. 3(c)) to be extracted when band B itself is obscured in the presence of
noise or
other erroneous signal features.
In some instances, an inverse continuous wavelet transform may be desired,
such
as when modifications to a scalogram (or modifications to the coefficients of
a
transformed signal) have been made in order to, for example, remove artifacts.
In one
embodiment, there is an inverse continuous wavelet transform which allows the
original
signal to be recovered from its wavelet transform by integrating over all
scales and
locations, a and b:
x(t) - f f T(a,b) t-b1 dadb (15)
a a J a
C
which may also be written as:
x(t) = C f fT (a, b)'!/u,n (t) dadb (16)
where Cg is a scalar value known as the admissibility constant. It is wavelet
type
dependent and may be calculated from:
Cg = f f ,f )I2 d f (17)
FIG. 3(e) is a flow chart of illustrative steps that may be taken to perform
an inverse
continuous wavelet transform in accordance with the above discussion. An
approximation to the inverse transform may be made by considering equation
(15) to be
a series of convolutions across scales. It shall be understood that there is
no complex
conjugate here, unlike for the cross correlations of the forward transform. As
well as
integrating over all of a and b for each time t, this equation may also take
advantage of
the convolution theorem which allows the inverse wavelet transform to be
executed
18
CA 02730636 2011-01-12
WO 2010/007489 PCT/IB2009/006214
using a series of multiplications. FIG. 3(f) is a flow chart of illustrative
steps that may
be taken to perform an approximation of an inverse continuous wavelet
transform. It
will be understood that any other suitable technique for performing an inverse
continuous wavelet transform may be used in accordance with the present
disclosure.
FIG. 4 is an illustrative continuous wavelet processing system in accordance
with
an embodiment. In this embodiment, input signal generator 410 generates an
input
signal 416. As illustrated, input signal generator 410 may include oximeter
420 coupled
to sensor 418, which may provide as input signal 416, a PPG signal. It will be
understood that input signal generator 410 may include any suitable signal
source, signal
generating data, signal generating equipment, or any combination thereof to
produce
signal 416. Signal 416 may be any suitable signal or signals, such as, for
example,
biosignals (e.g., electrocardiogram, electroencephalogram, electrogastrograin,
electromyogram, heart rate signals, pathological sounds, ultrasound, or any
other suitable
biosignal), dynamic signals, non-destructive testing signals, condition
monitoring
signals, fluid signals, geophysical signals, astronomical signals, electrical
signals,
financial signals including financial indices, sound and speech signals,
chemical signals,
meteorological signals including climate signals, and/or any other suitable
signal, and/or
any combination thereof.
In this embodiment, signal 416 may be coupled to processor 412. Processor 412
may be any suitable software, firmware, and/or hardware, and/or combinations
thereof
for processing signal 416. For example, processor 412 may include one or more
hardware processors (e.g., integrated circuits), one or more software modules,
computer-
readable media such as memory, firmware, or any combination thereof. Processor
412
may, for example, be a computer or may be one or more chips (i.e., integrated
circuits).
Processor 412 may perform the calculations associated with the continuous
wavelet
transforms of the present disclosure as well as the calculations associated
with any
suitable interrogations of the transforms. Processor 412 may perform any
suitable signal
processing of signal 416 to filter signal 416, such as any suitable band-pass
filtering,
adaptive filtering, closed-loop filtering, and/or any other suitable
filtering, and/or any
combination thereof.
Processor 412 may be coupled to one or more memory devices (not shown) or
incorporate one or more memory devices such as any suitable volatile memory
device
(e.g., RAM, registers, etc.), non-volatile memory device (e.g., ROM, EPROM,
magnetic
19
CA 02730636 2011-01-12
WO 2010/007489 PCT/IB2009/006214
storage device, optical storage device, flash memory, etc.), or both. The
memory may be
used by processor 412 to, for example, store data corresponding to a
continuous wavelet
transform of input signal 416, such as data representing a scalogram. In one
embodiment, data representing a scalogram may be stored in RAM or memory
internal
to processor 412 as any suitable three-dimensional data structure such as a
three-
dimensional array that represents the scalogram as energy levels in a time-
scale plane.
Any other suitable data structure may be used to store data representing a
scalogram.
Processor 412 may be coupled to output 414. Output 414 may be any suitable
output device such as, for example, one or more medical devices (e.g., a
medical monitor
that displays various physiological parameters, a medical alarm, or any other
suitable
medical device that either displays physiological parameters or uses the
output of
processor 412 as an input), one or more display devices (e.g., monitor, PDA,
mobile
phone, any other suitable display device, or any combination thereof), one or
more audio
devices, one or more memory devices (e.g., hard disk drive, flash memory, RAM,
optical
disk, any other suitable memory device, or any combination thereof), one or
more
printing devices, any other suitable output device, or any combination
thereof.
It will be understood that system 400 may be incorporated into system 10
(FIGS.
1 and 2) in which, for example, input signal generator 410 may be implemented
as parts
of sensor 12 and monitor 14 and processor 412 may be implemented as part of
monitor
14.
The components and methods described herein may be used to generate one or
more scalograms using a wavelet transform as described above or any other
suitable
method. Characteristics of the generated scalograms may be identified and used
for,
among other things, identifying a condition of a patient, such as a low
perfusion
condition, high vascular peripheral resistance, or other condition. When such
conditions
are identified, an alert or other event may be triggered.
A scalogram derived from a healthy individual in a steady state condition may
have a dominant pulse band with low amplitudes adjacent to the pulse band.
FIG. 3(c),
which is discussed above, shows an illustrative scalogram of a signal. If a
PPG signal
were used to generate the scalogram in FIG. 3(c), band A may be the pulse band
and
band B may be the respiration band. Pulse band A in FIG. 3(c) is an example of
a
dominant band with low amplitudes adjacent to the pulse band.
CA 02730636 2011-01-12
WO 2010/007489 PCT/IB2009/006214
A scalograrn derived from a person that may be experiencing a medical
condition
or problem, such as low perfusion, may have different characteristics than a
scalogram
derived from a person who is not experiencing such a condition or problem. A
low
perfusion condition, which may be caused by increased vascular peripheral
resistance,
may cause changes in blood flow and pulse rates that may be detected in the
scalogram.
For example, a low perfusion condition may cause regions adjacent to the pulse
band
(e.g., above, below, or both above and below the pulse band) to contain
relatively higher
energy as the pulse signal becomes weaker. These regions may be referred to as
marker
regions. The marker regions may be spaced apart from the pulse band or may be
an
extension of the pulse band. Consecutive marker regions on the scalogram may
be
evenly spaced apart in time, randomly spaced apart in time, or the spacing may
change
over time. The marker regions may have any suitable shape such as, for
example,
rectangular, oval, square, circular, triangular, or a combination of shapes.
In one
example, the marker regions may be narrower in time, and longer in scale.
The marker regions may be identified in a scalogram using any suitable
technique. In general, a scalogram is generated by a processor, such as
processor 412
(FIG. 4) or microprocessor 48 (FIG. 2), based on signal data received from an
oximeter
(such as oximeter 14 (FIG. 1) or 420 (FIG. 4)) or a sensor (such as a sensor
418 (FIG.
4) or sensor 12 (FIG. 1)) that is located on a patient. The marker regions may
be
identified using the processor 412 (FIG. 4) or microprocessor 48 (FIG. 2) by
analyzing
the scalogram, as further described herein. In an embodiment, the marker
regions and
their sizes and shapes may be identified by the processor 412 (FIG. 4) or
microprocessor
48 (FIG. 2) using an amplitude threshold. The amplitude threshold may be
predetermined or may dynamically change (e.g., as a function of the height
and/or shape
of the pulse band). The threshold may be selected by a user (e.g., via user
input 56 (FIG.
2)), or programmed for the processor 412 (FIG. 4) or microprocessor 48 (FIG.
2), and
may be based in part on patient information, such as patient classification.
In another
embodiment, the marker regions may be identified by the processor 412 (FIG. 4)
or
microprocessor 48 (FIG. 2), other component, or user, based on a change in
energy
within one or more regions in the scalogram over time. For example, a
rectangular
region may be used and the energy within the region may be determined using
any
suitable methods such as by taking a median or average amplitude within the
region or
summing the amplitudes within the region. For example, a percentile of
energies in a
21
CA 02730636 2011-01-12
WO 2010/007489 PCT/IB2009/006214
region may be used to provide a measure of background noise for comparison
with the
pulse band. A marker region may also be identified by the processor 412 (FIG.
4) or
microprocessor 48 (FIG. 2) based on an increase and subsequent decrease in
energy
within the region over time. The marker regions may also be identified by
using a
combination of techniques by the processor 412 (FIG. 4) or microprocessor 48
(FIG. 2)
or other component.
A low perfusion condition may also result in a signal that causes the
amplitudes
in marker regions above and below the pulse band to increase. Changes in these
amplitudes may be detected and categorized by the processor 412 (FIG. 4) or
microprocessor 48 (FIG. 2). In an embodiment, the amplitudes may be detected
by
analyzing a defined region above and/or below the pulse band over time. The
defined
region may be defined by the processor 412 (FIG. 4) based on one or more
features of
the scalogram, selected by a user (via user input 56 (FIG. 2)) or programmed
in
processor 412 (FIG. 4). The region may be analyzed by calculating the energy
within
the region or by using any other suitable technique. A low perfusion condition
may also
cause the amplitude of the pulse band to decrease. Any decrease in pulse band
amplitude
may be detected and analyzed over time by the processor 412 (FIG. 4) or
microprocessor
48 (FIG. 2).
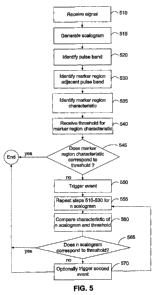
FIG. 5 is an illustrative method for identifying a low perfusion condition, or
other condition, according to an embodiment. At step 510, one or more signals
may be
received by the processor 412 (FIG. 4) or microprocessor 48 (FIG. 2). The
received
signal may be a PPG signal (e.g., a red and/or infrared signal), or other
signal described
herein, which may be transmitted by an oximeter (such as oximeter 14 of FIG. I
or 420
of FIG. 4), sensor (such as sensor 418 of FIG. 4 or sensor 12 of FIG. 1), or
other device,
and may be transmitted directly (via cables 24 (FIG. 1)) to a processor (412
(FIG. 4) or
microprocessor 48 (FIG. 2)), via an intermediary component, or using any
appropriate
transmission means. At step 515, the received signal may be used by the
processor 412
(FIG. 4) or microprocessor 48 (FIG. 2) to generate a scalogram using a wavelet
transform (e.g., a continuous wavelet transform), or other technique described
herein or
known to one of skill in the art. The scalogram may be any scalogram, such as
the
scalograms depicted in FIGS. 3(a)-(b) and FIG. 6(a).
[0002] FIGS. 6(a)-(c) depict an example of a weakening pulse signal, which may
be
observed in the signal plot above the scalogram of FIG. 6(a) and in the
scalogram of
22
CA 02730636 2011-01-12
WO 2010/007489 PCT/IB2009/006214
FIG. 6(a) which shows regions adjacent to a pulse band (A) that contain
relatively
higher energy (B) in proportion to the pulse band (A) as the pulse signal
weakens, for
example in a low perfusion condition. As shown, FIG. 6(a) depicts a scalogram
for a
signal (shown at the top of the scalogram) where the pulse signal weakens. A
pulse
signal may weaken because of a change in a physiological condition, such as
low
perfusion. It may also weaken if a sensor (such as sensor 418 (FIG. 4) or
sensor 12
(FIG. 1)) is moved from one location to another less optimal location, or if
the sensor is
loosened. Weakening a pulse signal in such ways may cause a pulse signal to
reduce in
amplitude. Other system noise (such as a mains hum, thermal noise, or other
noise),
however, typically remains constant.
The scalogram depicted in FIG. 6(a) may be generated based on the plotted
pulse
signal of FIG. 6(a) using techniques described herein and analyzed using
techniques
described herein, such as those discussed in connection with FIG. 5. The pulse
signal
may manifest itself in the associated wavelet scalogram as a pulse band (a
distinct band
across the transform plane) (marked A). Mains noise (or other noise) may
manifest itself
as one or more streaks (or other shape) across the scalogram at higher
frequencies
(marked B in the scalogram). Low amplitude signal noise from, for example,
thermal
noise, may be present in one or more locations in the scalogram at low energy
values.
In one embodiment, in order to quantify a relative value of signal and noise,
a
marker region defined as a window that may be ten seconds long (or other time
period),
and of various widths was scanned across the scalogram and representative
energies
computed as described below in connection with FIGS. 6(b) and 6(c).
FIG. 6(b) shows: (1) a sum of energy densities within a ten second window
localized to scales in a region of the pulse band (line A of FIG. 6(b)), (2) a
sum of
energy densities within a 10 second window localized to scales in the region
of a mains
hum artifact (line B of FIG. 6(b)) and (3) the lowest tenth percentile of
energy values in
the ten second window run across a region between the mains hum artifact and
the pulse
band (line C of FIG. 6(b)). The tenth percentile may be taken as a marker
region
characteristic. In one embodiment, other measures (marker region
characteristics) or
identifiable features (residual markers) may be interrogated or used. The
plots shown in
FIG. 6(b) may be produced using one or more processors, such as 412 (FIG. 4)
or
microprocessor 48 (FIG. 2).
23
CA 02730636 2011-01-12
WO 2010/007489 PCT/IB2009/006214
To derive a measure of a pulse signal and noise levels, a pulse band's
representative energy may be divided by a mains noise representative energy
(line D in
FIG. 6(c)), and the pulse band's representative energy may also be divided by
the
representative energy of low level noise (line E of FIG. 6(c)). Both of lines
D and E
show a decreasing trend indicative of the signal reducing relative to
background noise.
Such a decreasing trend may be parameterized through, for example, curve
fitting,
including a linear straight line fit or a nonlinear curve fit. In this way a
measure of the
signal quality may be obtained using wavelet transforms. This measure may be
an
absolute measure, a relative measure or an indication of trending over time.
The plots
shown in FIG. 6(c) may be produced using one or more processors, such as 412
(FIG. 4)
or microprocessor 48 (FIG. 2).
Embodiments of the measures, processing, and calculations described with
reference to FIGS. 6(a)-(c) may also be provided using any suitable
percentiles, window
lengths, and widths, to derive representative energies. Representative
energies may be
derived in other ways such as taking a peak value in time along a pulse band
maximum
(i.e. its ridge). In addition, other parts of a transform may be taken or
used, such as a real
part, imaginary part, various powers of the modulus, and the phase.
Another exemplary simplified scalogram is depicted in FIG. 6(d). FIG. 6(d)
shows a simplified scalogram 600 derived from a PPG signal. Scalogram 600
depicts
pulse band 615, marker regions 618 adjacent to the pulse band 615, and
residual markers
620 on either side of pulse band 615. For simplicity, scalogram 600 does not
depict
other features typically found in a scalogram of a PPG signal (e.g., the
respiration band,
noise, etc.). The scalogram 600 may be generated during a low perfusion
condition.
Characteristics of the residual markers 620 may be detected and analyzed by
the
processor 412 (FIG. 4) or microprocessor 48 (FIG. 2) to determine that there
is a low
perfusion condition.
Turning again to FIG. 5, at step 520, the scalogram pulse band may be
identified.
The pulse band may be identified by the processor (412 (FIG. 4) or
microprocessor 48
(FIG. 2)) based at least in part on the scalogram data and/or the received
signal from the
oximeter (14 (FIG. 1) or 420 (FIG. 4)) or sensor (418 (FIG. 4) or 12 (FIG.
1)). For
example, the pulse band may be identified using ridge following techniques on
the
scalogram, or via input for a pulse rate or interbeat time periods to locate
pulse in the
scalogram, or other appropriate technique. At step 530, the processor (412
(FIG. 4) or
24
CA 02730636 2011-01-12
WO 2010/007489 PCT/IB2009/006214
microprocessor 48 (FIG. 2)) or other component may also be used to detect one
or more
marker regions adjacent to the pulse band. The marker regions may be
identified by the
processor (412 (FIG. 4) or microprocessor 48 (FIG. 2)) using, for example,
ridge or
modulus maxima techniques, or other techniques well known to those skilled in
the art.
Marker regions may also be a defined region set forth by a user.
Characteristics of the marker region may be identified at step 535 using the
processor (412 (FIG. 4) or microprocessor 48 (FIG. 2)). Some examples of
characteristics of marker regions include, for example, residual markers that
may be
detected adjacent to the pulse band, spaced apart from the pulse band, or as
an extension
of the pulse band, changes in the pulse band and/or the marker regions.
Residual
markers may be isolated regions or may be a continuous region having increased
or
decreased amplitude. The size, shape, location, and amplitude of the residual
markers
may be determined by the processor (412 (FIG. 4) or microprocessor 48 (FIG.
2)) based
on the scalogram data. A residual marker may be an identifiable feature in a
marker
region. Marker regions are typically regions of arbitrary shape above and/or
below the
pulse band. Marker region characteristics may describe characteristic measures
such as a
10th percentile (or other percentile) of energy, for example, as used in the
example of
FIGS. 6(a)-(c).
Characteristics of the marker regions may also be identified according to the
process flowchart depicted in FIG. 7. At step 700, a marker region may be
identified in
a manner similar to that described at step 530 (FIG. 5). The marker region may
be
identified using the processor (412 (FIG. 4) or microprocessor 48 (FIG. 2))
via ridge or
modulus maxima techniques, or other techniques well known to those skilled in
the art.
In some embodiments, marker regions may be a user-defined region. Identifying
characteristics of the marker region include, for example, determining energy
of the
marker region at step 710 and determining amplitude of the marker region at
step 720.
The energy and amplitude of the marker region may be obtained by processing
scalogram data via processor 412 (FIG. 4) or microprocessor 48 (FIG. 2).
In some embodiments, residual markers may also be detected at step 730. The
residual markers may also be detected by processor 412 (FIG. 4) or
microprocessor 48
(FIG. 2) using ridge or modulus maxima techniques, or other techniques.
Certain
features of the residual markers may also be detected by the processor 412
(FIG. 4) or
microprocessor 48 (FIG. 2), such as counting a number of residual markers at
step 740,
CA 02730636 2011-01-12
WO 2010/007489 PCT/IB2009/006214
determining a location of the residual markers at step 750, determining a size
of the
residual markers at step 760, determining energy of the residual markers at
step 770,
determining amplitude of the residual markers at step 780, and determining the
strength
of the residual markers at step 790.
Referring again to FIG. 5, at step 540 a threshold for marker region
characteristics may be received. The threshold may be selected by a user using
user
input 56 (FIG. 2) (or other input means), or programmed in processor 412 (FIG.
4) or
microprocessor 48 (FIG. 2). The processor 412 (FIG. 4) or microprocessor 48
(FIG. 2)
may determine whether the marker region characteristics correspond to the
threshold at
step 545. The threshold may be any combination of characteristics of the
marker regions
and residual markers. The number and characteristics of residual markers
caused by low
perfusion may vary for different people or different groups or classes of
people.
Therefore, thresholds used to provide an indication of low perfusion may also
vary for
different people, groups or classes of people. Accordingly, in an embodiment
the system
(via processor programming) or operator (via user inputs) may classify a
patient (e.g.,
based on age, health condition, heart rate, body position, etc.) and the
system may trigger
events based at least in part on the user's classification.
The existence of residual markers (e.g., the existence of residual markers
outside
of the pulse band or as an extension of the pulse band) having certain
characteristics has
been found to indicate that the PPG signal was obtained from an oximeter (18
(FIG. 1))
or sensor (12 (FIG. 1)) located on a site having low perfusion (e.g., from
high vascular
peripheral resistance) or other problem. Thus, in some embodiments, if at step
545 the
residual marker features are determined to not correspond to a threshold, at
step 550 an
event may trigger. In general, not corresponding to the threshold may include
being
substantially dissimilar to the threshold, exceeding or failing to meet the
threshold. The
event that may be triggered may be, for example, an alert or alarm that
signals existence
of a low perfusion condition or other condition. Other examples of alerts or
events may
also be triggered, for example, notifications indicating: examination of a
patient is
necessary, movement of the sensor is required, examination of the sensor is
required, or
other notification. Alerts may be of any type, such as an audible noise,
lighted indicator,
message, visual display, or other alarm. In addition to (or instead of) the
alert, the event
may be to move the sensor or oximeter (by a user operator, or using a control
signal from
the processor 412 (FIG. 4) sent to a wheel or roller assembly integrated in
the oximeter),
26
CA 02730636 2011-01-12
WO 2010/007489 PCT/IB2009/006214
switch use of the sensor to a second sensor, or other event. In general, the
events are
triggered by the processor 412 (FIG. 4) or microprocessor 48 (FIG. 2) sending
a control
signal to another system component, such as displays 20 or 28 (FIG. 1),
speaker 22
(FIG. 1), sensor 12 (FIG. 1), oximeter 16 (FIG. 1), or other component.
In some embodiments, steps 510-530 are repeated at step 555 as a follow up
routine to determine, for example, whether the event at step 550 improved
monitoring
conditions. New signal information may be used to generate a new scalogram in
which
new marker region characteristics may be detected by the processor 412 (FIG.
4) or
microprocessor 48 (FIG. 2). At step 560, the new scalogram marker region
characteristics may be compared against the original scalogram and/or the
threshold
(received at step 540). If the new scalogram marker region characteristics
correspond to
the threshold at step 565, the routine may end. However, if the new scalogram
marker
region characteristics do not correspond to the threshold, another event may
trigger at
step 570. The second event may be one or more of the same or different events
discussed with reference to step 555. For example, a first event triggered at
step 555
may be a flashing light indicator, and a second event triggered at step 570
may be a
message, audible alarm, and a flashing light. Other events, and combinations
of events,
may also be used. Following step 570, the system may end the routine, or
optionally
repeat the steps at step 555 n times.
In an embodiment, the system implementing the foregoing methods and
techniques may also be used to calculate oxygen saturation. The oxygen
saturation may
be calculated using scalograms derived from PPG signals. For example, oxygen
saturation may be calculated using the methods described in Addison et al.
U.S. Patent
Publication No. 2006/0258921, published November 16, 2006. In an embodiment,
during periods of low perfusion, the oxygen saturation may continue to be
calculated
using the scalograms. A reliable oxygen saturation value may continue to be
calculated
because low perfusion may affect scales within the scalogram without
significantly
affecting the pulse band. The methods and system may also be used to identify
other
types of conditions, as would be recognized by one of skill in the art.
The foregoing is merely illustrative of the principles of this disclosure and
various modifications can be made by those skilled in the art without
departing from the
scope and spirit of the disclosure.
27