Note: Descriptions are shown in the official language in which they were submitted.
= CA 02732978 2015-06-25
METHODS AND SYSTEMS FOR CHEMICAL COMPOSITION MEASUREMENT
AND MONITORING USING A ROTATING FILTER SPECTROMETER
Field of the Invention
[0002] The invention relates generally to spectroscopic methods and systems.
More
particularly, in certain embodiments, the invention relates to methods and
systems for
measuring and/or monitoring the chemical composition of a sample (e.g., a
process stream),
and/or detecting substances or compounds in a sample, using light
spectroscopy.
Background of the Invention
[0003] Several chemical composition measurement devices using light
spectrometers are
currently commercially available. Examples of the types of spectrometers
currently used
include Fourier transform infrared spectrometer (FUR), dispersive spectrometer
(spectrograph
or monochromator) and linear variable filter (LVF) spectrometer. FTIR based
devices use
Michelson interferometers and have generally been considered to provide the
highest
performance, due to their high optical throughput, which enables high-
sensitivity
measurements. In contrast, dispersive and linear variable filter spectrometers
have significantly
lower optical throughput and thus lower sensitivity performance. However,
dispersive and
linear variable filter spectrometers generally provide simpler and more rugged
instrumentation,
and are less expensive to manufacture.
CA 02732978 2015-06-25
- 2 -
[0004] Another type of chemical composition measurement and monitoring device
that is
widely used, in particular, in the field of gas monitoring, is non-dispersive
infrared (NOIR)
devices. These devices use fixed narrowband optical filters to select a
particular wavelength
band region. They have high optical throughput, rivaling that of FTIR based
devices, and thus
provide high-sensitivity measurement. This type of device, however, is
generally not
considered to be a spectrometer, as it does not measure light intensity as a
function of
wavelength; rather, it provides a single measurement value corresponding to
the light intensity
at a particular wavelength band. For this reason, each device (employing one
filter, one photo-
detector and one light source) can only measure one compound. Therefore, such
devices are
not considered to be chemical "composition" measuring devices.
[00051 The transmitted wavelength band of a narrowband optical filter, such as
that used in
NDIR instruments, can be varied or "tuned" by varying the angle of incidence
(U.S. Pat. No.
4,040,747 to Webster, 1977 and U.S. Pat. No. 2,834,246 to Foskett, 1958.).
Such methods enable the measurement of optical signals
from multiple wavelengths or wavelength bands using only a single optical
filter, light source
and detector, thus potentially creating a simple, low-cost, high-throughput
spectrometer.
[0006] One method of varying the incident angle is to continuously rotate the
filter in one
direction and capture the data at the relevant angular positions. This type of
continuously-
rotating filter spectrometers has been described (U.S. Pat. No. 4,040,747 to
Webster, 1977,
U.S. Pat. No. 2,834,246 to Foskett, 1958, U.S. Pat No. 5,268,745 to Goody,
1993, U.S. Pat No.
7,099,003 to Saptati, 2004 However,
these
devices have not been in significant commercial use. FTIR spectrometers,
grating based
spectrometers and LVF spectrometers are still by far the most commonly used
hardware for
chemical composition monitoring, despite the potential advantages for the
rotating tunable filter
instruments.
CA 02732978 2011-01-28
WO 2010/014277
PCT/US2009/041254
- 3 -
[0007] There are weaknesses of the previous rotating tunable filter systems
which prevent
them from being used in a commercial setting as chemical composition measuring
or
monitoring devices. For example, these systems lack measurement stability and
robustness due
to wavelength instability, spectral interferences, environmental variations
and/or instrumental
changes. Such systems also lack versatility, in particular, in that they are
not able to provide
wide spectral coverage. Furthermore, there are difficulties in volume
manufacturing, in
particular, difficulties in producing reproducible instruments that are
interchangeable without
each instrument requiring empirical sample based calibration.
Summary of the Invention
[0008] The invention provides methods and systems for measuring and/or
monitoring the
chemical composition of a sample (e.g., a process stream in an industrial
setting), using a
spectrometer with rotating narrow-band interference optical filter(s). In
preferred
embodiments, the spectrometer system features a rotatable filter assembly with
a position
detector rigidly attached thereto, providing more accurate and robust
detection. The rotatable
filter is preferably tilted with respect to the rotation axis, thereby
providing surprisingly
improved measurement stability and significantly improved control of the
wavelength coverage
of the filter spectrometer. Also, in certain embodiments, the invention
includes methods of
using such spectrometers for measuring and monitoring chemical composition of
compounds in
gas, liquid and/or solid forms, for example, in both laboratory and non-lab
(e.g., industrial)
settings.
[0009] Various oversampling methods and techniques are also presented herein,
which are
found to be particularly useful when employed in conjunction with a
spectrometer with the
rotatable filter assembly feature as described herein. In certain embodiments,
the invention
includes methods of using such spectrometers for measuring and monitoring
chemical
CA 02732978 2011-01-28
WO 2010/014277
PCT/US2009/041254
- 4 -
composition of compounds in gas, liquid and/or solid forms, for example, in
both laboratory
and non-lab (e.g., industrial) settings.
[0010] In certain embodiments, the invention provides a rotating filter
spectrometer for
chemical composition measurement and monitoring, employs one or multiple light
sources, one
or multiple photo-detectors, one or multiple narrow-band optical interference
filters, a DC
motor, a position encoder, an analog-to-digital conversion device, and a
computing unit. In
preferred embodiments, the narrow-band optical filter(s) are rigidly mounted
on a rotating
mechanical assembly driven by a DC motor. The rotating filter assembly is
positioned relative
to a collimated light beam from the light source such that the axis of
rotation is perpendicular to
the light beam or, preferably, positioned such that the axis of rotation is
slightly non-
perpendicular to the light beam, such non-perpendicular conformation resulting
in surprisingly
improved measurement stability due to apparent suppression of back-reflected
or stray light,
and resulting in significantly improved control of the wavelength coverage of
the filter
spectrometer, given the filter characteristics and the angular coverage of the
mechanical
system.
[0011] In preferred embodiments, the rotating filter assembly rotates
continuously in one
angular direction. A rotary positional encoder is rigidly attached to the
rotating filter assembly
such that there is no relative displacement or mechanical "compliance" or
"play" between it
and the rotating filter assembly. The digital pulses generated by the encoder
during motion are
used to clock the analog-to-digital conversion of the signal collected by the
photo-detector.
Furthermore, the encoder and its processing electronics are designed,
configured and/or
selected in such a way that it produces significantly more pulses-per-rotation
than what is
required to accurately measure the relevant spectral features. The spectral
signal is over-
sampled. A convolution algorithm is then preferably applied to digitally
process the recorded
CA 02732978 2011-01-28
WO 2010/014277
PCT/US2009/041254
- 5 -
spectrum to enhance wavelength stability or repeatability and to improve
spectral signal-to-
noise ratio.
[0012] In certain embodiments, inherent or deliberately-introduced spectral
features are used
to lock the relative position of the encoder with respect to the rotating
filter assembly. The
spectral features may be those due to the spectral characteristics of the
light source, system's
optical components, and/or the sample compound itself. Such methods ensure
wavelength
stability despite alignment changes due to mechanical forces or temperature
changes.
[0013] A variable gain amplifier is preferably employed to automatically
adjust the photo-
detector signal amplification gain in real-time. The gain profile may be
scheduled based upon
the location of the rotating filter assembly, or updated automatically based
upon the magnitude
of the received signal. Such a feature enables measurement of distinctly
different spectral
regions, such as measurement at the near infrared and the mid infrared regions
simultaneously,
without saturating the analog-to-digital circuitry. Similarly, the light
source intensity may be
varied to further optimize the measurement dynamic range and to better observe
weak spectral
features.
[0014] In certain embodiments, multiple regression regions and calibration
matrices,
combined with cross-analysis, are used to enhance robustness and accuracy of
multi-compound
measurement as well as measurement in highly complex sample matrices. Each
calibration
matrix can be optimized for a particular target compound or features of the
target compounds.
The effects of nonlinearities can be significantly suppressed.
[0015] In certain embodiments, an adaptive regression analysis is employed to
account for
spectral baseline variations that may have complex shapes due to the filter's
non-linear
wavelength-angle function. The algorithm automatically and continually updates
to
compensate for the baseline variations, as well as other spectral variations
such as those due to
light interactions with unknown, interfering compounds.
CA 02732978 2011-01-28
WO 2010/014277
PCT/US2009/041254
- 6 -
[0016] A differential measurement may be employed in applications monitoring
certain
processes or reactions, for example, where the input and output streams are
available for
analysis. The method suppresses the effects of instrumental and environmental
changes, as
well as minimizes the effects of sample background interferences.
[0017] Embodiments of the invention provide methods, systems (including
apparatus) for
chemical composition measurement and monitoring in gas, liquid and/or solid
samples which
utilize a single or multiple continuously rotating narrow-band filters. In
certain embodiments,
the invention provides negligible wavelength instability or drift due to
various environmental
disturbances such as vibrations and temperature variations over a long period
of time.
Embodiments of the invention also provide wide spectral or wavelength coverage
with
optimum use of the measurement dynamic range throughout the analysis range,
suitable for
simultaneous measurement and/or monitoring of multiple compounds. The systems
effectively
compensate for spectral baseline instability and can be built and manufactured
consistently
(without requiring extensive, individual-machine calibration) and relatively
inexpensively.
[0018] The systems and methods can be used for continuous monitoring of gas,
liquid, and/or
solid chemical composition (% levels), for example, for monitoring production
throughput and
quality, e.g., in process streams. They can also be used for gas, liquid, or
solid phase trace
species monitoring (ppm or ppb levels), for example, impurity detection and
monitoring, e.g.,
in process streams. Embodiments may also provide ambient monitoring for safety
purposes.
The systems and methods described herein may be applied, for example, in the
petrochemical,
bioreactor (biofuel), pharmaceutical, food and beverage, specialty chemical,
and/or alternative
energy industries.
[0019] For example, an embodiment of the invention provides combustion process
monitoring (e.g., alternative energy production using a bioreactor) for the
monitoring of any
one or more of the following process gases: CO, CO2, 02, CH4 (methane), N20
(nitrous oxide).
CA 02732978 2011-01-28
WO 2010/014277
PCT/US2009/041254
- 7 -
In other embodiments, the invention provides systems and/or methods for
monitoring trace
levels (e.g., ppm or sub-ppm) of sulfur compounds (e.g., dimethyl sulfide,
dimethyl disulfide,
carbonyl sulfide, hydrogen sulfide, etc.) in a natural gas line, for example,
in a fuel cell-based
power plant. In yet another embodiment, the invention provides a system and/or
method for
monitoring trace levels (e.g., ppm or sub-ppm) of CO, CO2, H20 (moisture), THC
(total
hydrocarbon) gases in N2 or He, for example, for specialty chemical
manufacturers. Other
example applications of the methods and systems of the invention include the
monitoring of
trace water in fuels, the monitoring of aqueous alcohols, and the monitoring
of glucose, lactate,
ammonia, and/or glutamine during fermentation processes.
[0020] In one aspect, the invention provides a spectroscopic system for
detecting
electromagnetic radiation that has passed through or is reflected from a
sample, the system
including an electromagnetic radiation source and a rotatable filter assembly
configured to filter
a beam of electromagnetic radiation produced by the electromagnetic radiation
source, where
the assembly includes one or more bandpass optical interference filters, and
where the rotatable
filter assembly is configured to rotate to provide continuous adjustment of
the incident angle of
the electromagnetic beam onto the one or more optical interference filters,
thereby providing a
continuous wavelength sweep in a single wavelength band or multiple wavelength
bands. One
or more of the bandpass filters is configured such that the surface of the
filter is not exactly
perpendicular to the electromagnetic beam at any point during the continuous
adjustment (e.g.,
the surface is displaced from perpendicular by up to about 3 degrees, by up to
about 5 degrees,
by up to about 10 degrees, by up to about 20 degrees, or by up to about 30
degrees). The
system also includes a motor coupled to the rotatable filter assembly and an
electromagnetic
radiation detector configured to detect electromagnetic radiation that has
passed through or is
reflected from the sample. In certain embodiments, the rotatable filter
assembly includes a
narrow-band interference filter or plurality of narrow-band interference
filters. In certain
CA 02732978 2011-01-28
WO 2010/014277
PCT/US2009/041254
- 8 -
embodiments, the rotatable filter assembly includes an edge interference
filter or plurality of
edge interference filters (such as low-pass or high-pass interference
filters).
[0021] The description of elements of the embodiments of other aspects of the
invention can
be applied to this aspect of the invention as well.
[0022] In another aspect, the invention provides a spectroscopic system for
detecting
electromagnetic radiation that has passed through or is reflected from a
sample including an
electromagnetic radiation source; a rotatable filter assembly configured to
filter a beam of
electromagnetic radiation produced by the electromagnetic radiation source; a
motor coupled to
the rotatable filter assembly; a position detector including at least one
component rigidly
attached to the rotatable filter assembly, the position detector is configured
to detect an angular
position of the rotatable filter assembly; and an electromagnetic radiation
detector configured to
detect electromagnetic radiation that has passed through or is reflected from
a sample.
[0023] In certain embodiments, the rotatable filter assembly is configured to
rotate about an
axis substantially perpendicular to a path of a beam of electromagnetic
radiation produced by
the electromagnetic radiation source. In certain embodiments, the rotatable
filter assembly is
configured to rotate about an axis non-perpendicular to a path of a beam of
electromagnetic
radiation produced by the electromagnetic radiation source at an angle within
a range from
about 60 degrees to less than 90 degrees (e.g., 89.99 degrees). In certain
embodiments, the
rotatable filter assembly includes a narrow-band interference filter.
[0024] In certain embodiments, the rotatable filter assembly includes a
plurality of filters. In
certain embodiments, the rotatable filter assembly includes at least three
filters.
[0025] In certain embodiments, the surface of the filter(s) is parallel to the
axis of rotation of
the rotatable filter assembly. In certain embodiments, the filter(s) is
angularly tilted about an
axis perpendicular to the axis of rotation of the rotatable filter assembly
and the axis normal to
the surface of the filter.
CA 02732978 2011-01-28
WO 2010/014277
PCT/US2009/041254
- 9 -
[0026] In certain embodiments, the spectroscopic system includes a controller
configured to
adjust a rotational velocity of the rotatable filter assembly. In certain
embodiments, the
position detector includes an encoder configured to produce at least a first
signal including a
series of digital pulses at a first frequency, each digital pulse
corresponding to an angular
position of the rotatable filter assembly. In certain embodiments, the first
frequency is a clock
frequency. In certain embodiments, the encoder is configured to produce a
second signal, and
the spectroscopic system includes an encoder signal processing module
configured to combine
the first and second signals into a third signal. In certain embodiments, the
third signal includes
a series of digital pulses having at least double the first frequency. In
certain embodiments, the
encoder includes an edge detector configured to detect an edge of each of at
least two signals
produced by the encoder and to thereby produce a signal including a series of
digital pulses
having at least quadruple the first frequency.
[0027] In certain embodiments, the encoder is rigidly attached to the
rotatable filter
assembly. In certain embodiments, the system includes a speed-reduction
mechanism
configured to control a velocity of the rotatable filter assembly. In certain
embodiments, the
speed-reduction mechanism is configured to control the velocity using a
digital feedback
control.
[0028] In certain embodiments, the encoder is configured to produce
significantly more
digital pulses per rotation of the rotatable filter assembly than are
necessary to accurately
reproduce an analog signal from the electromagnetic radiation detector. In
certain
embodiments, the encoder is configured to digitize the analog signal at a
frequency greater than
a Nyquist criterion corresponding to the analog signal. In certain
embodiments, the encoder is
configured to digitize the analog signal at a frequency greater than 5 times
the Nyquist
criterion. In certain embodiments, the encoder is configured to digitize the
analog signal at a
frequency at least 8 times the Nyquist criterion. In certain embodiments, the
encoder is
CA 02732978 2011-01-28
WO 2010/014277
PCT/US2009/041254
- 10 -
configured to digitize the analog signal at a frequency at least 10 times the
Nyquist criterion. In
certain embodiments, the encoder is configured to digitize the analog signal
with at least 1000
pulses per rotation of the rotatable filter assembly.
[0029] In certain embodiments, the spectroscopic system includes a variable
gain amplifier
configured to convert a light signal from the electromagnetic radiation
detector into an
electrical signal. In certain embodiments, the variable gain amplifier is in
communication with
the position detector and is configured to automatically adjust a gain profile
of a signal received
from the electromagnetic radiation detector based on a detected angular
position of the
rotatable filter assembly. In certain embodiments, the amplifier is configured
to automatically
adjust a gain profile of a signal received from the electromagnetic radiation
detector based on a
magnitude of the signal.
[0030] In certain embodiments, the spectroscopic system includes a processor
configured to
apply a convolution function to a spectral signal from the electromagnetic
radiation detector,
thereby enhancing wavelength stability and/or repeatability, and/or thereby
improving signal-
to-noise ratio. In certain embodiments, a width of the convolution function is
as great as
possible without altering or broadening spectral features of the spectral
signal.
[0031] In certain embodiments, the spectroscopic system includes a processor
configured to
apply a baseline correction algorithm to a spectral signal from the
electromagnetic radiation
detector, thereby enhancing long-term measurement stability.
[0032] In certain embodiments, the spectroscopic system includes a plurality
of
electromagnetic radiation sources, thereby enabling detection of
electromagnetic radiation over
a broader spectrum and/or over multiple spectra. In certain embodiments, the
plurality of
electromagnetic radiation sources includes a UV radiation source and an IR
radiation source.
In certain embodiments, the spectroscopic system includes an analog-to-digital
acquisition
mechanism in communication with the electromagnetic radiation detector and the
position
CA 02732978 2011-01-28
WO 2010/014277
PCT/US2009/041254
-11 -
detector, where the analog-to-digital acquisition mechanism is configured to
digitize, store,
and/or process data corresponding to the detected electromagnetic radiation.
The spectroscopic
system may include a computer or may otherwise share input and output with a
computer 2802
(e.g., a computer internal or external to the spectroscopic system), the
computer including
software for digitizing, receiving, storing, and or processing data
corresponding to the detected
electromagnetic radiation and/or signals created by such detected
electromagnetic radiation as
illustrated in Fig. 28. The computer may also include a keyboard or other
portal for user input,
and a screen for display of data to the user. The computer may include
software for process
control, data acquisition, data processing, and/or output representation. The
spectroscopic
system may include a wireless system for acquisition of data and/or system
control. For
example, the wireless system may allow wireless data transfer from and/or to a
computer,
allowing wireless input and/or output (and/or system control) by/to a user via
a user interface
connected to the computer, such as a keyboard and/or display screen. The
spectroscopic
system may also include a battery system configured to enable stand-alone
operation capability.
[0033] The description of elements of the embodiments of other aspects of the
invention can
be applied to this aspect of the invention as well.
[0034] In another aspect, the invention provides a spectroscopic system for
detecting
electromagnetic radiation that has passed through or is reflected from a
sample, including an
electromagnetic radiation source; a rotatable filter assembly configured to
filter a beam of
electromagnetic radiation produced by the electromagnetic radiation source; a
motor coupled to
the rotatable filter assembly, an electromagnetic radiation detector
configured to detect
electromagnetic radiation that has passed through or is reflected from a
sample and to output a
corresponding analog spectral signal; and a position detector configured to
detect an angular
position of the rotatable filter assembly, the position detector including an
encoder configured
to produce at least a first signal including a series of digital pulses at a
first frequency, each
CA 02732978 2011-01-28
WO 2010/014277
PCT/US2009/041254
- 12 -
digital pulse corresponding to an angular position of the rotatable filter
assembly, wherein the
encoder is configured to produce significantly more digital pulses per
rotation of the rotatable
filter assembly than are necessary to reproduce the analog spectral signal.
[0035] In certain embodiments, the encoder is configured to digitize the
analog signal at a
frequency greater than a Nyquist criterion corresponding to the analog signal.
In certain
embodiments, the encoder is configured to digitize the analog signal at a
frequency greater than
5 times the Nyquist criterion. In certain embodiments, the encoder is
configured to digitize the
analog signal at a frequency at least 8 times the Nyquist criterion. In
certain embodiments, the
encoder is configured to digitize the analog signal at a frequency at least 10
times the Nyquist
criterion. In certain embodiments, the encoder is configured to digitize the
analog signal with
at least 1000 pulses per rotation of the rotatable filter assembly.
[0036] The description of elements of the embodiments of other aspects of the
invention can
be applied to this aspect of the invention as well.
[0037] In another aspect, the invention provides a spectroscopic system for
detecting
electromagnetic radiation that has passed through or is reflected from a
sample, including an
electromagnetic radiation source having a variable intensity; a filter
assembly configured to
filter a beam of electromagnetic radiation produced by the electromagnetic
radiation source; a
position detector configured to detect a position of the filter assembly; a
controller configured
to adjust the intensity of the electromagnetic radiation source; and an
electromagnetic radiation
detector configured to detect electromagnetic radiation that has passed
through or is reflected
from a sample.
[0038] In certain embodiments, the filter assembly is rotatable and the
position detector is
configured to detect an angular position of the filter assembly.
CA 02732978 2011-01-28
WO 2010/014277
PCT/US2009/041254
- 13 -
[0039] In certain embodiments, the controller is in communication with the
position detector
and is configured to adjust the intensity of the electromagnetic radiation
source based on a
detected position of the filter assembly. In certain embodiments, the filter
assembly includes a
filter having an active portion and an inactive portion and the controller is
configured to
decrease the intensity of the electromagnetic radiation source when a beam of
electromagnetic
radiation from the electromagnetic radiation source is incident on an inactive
portion of the
filter.
[0040] In certain embodiments, the controller includes a voltage regulator for
controlling a
voltage supplied to the electromagnetic radiation source.
[0041] In certain embodiments, the spectroscopic system includes a plurality
of
electromagnetic radiation sources. In certain embodiments, the spectroscopic
system includes a
plurality of electromagnetic radiation detectors.
[0042] In certain embodiments, the spectroscopic system includes a variable
gain amplifier
configured to convert a light signal from the electromagnetic radiation
detector into an
electrical signal. In certain embodiments, the amplifier is in communication
with the position
detector and is configured to automatically adjust a gain profile of the
electrical signal based on
a detected position of the filter assembly.
[0043] In certain embodiments, the filter assembly is configured for rotation
about an axis
substantially perpendicular to a path of a beam of electromagnetic radiation
produced by the
electromagnetic radiation source.
[0044] The description of elements of the embodiments of other aspects of the
invention can
be applied to this aspect of the invention as well.
[0045] In another aspect, the invention provides a spectroscopic system for
monitoring
electromagnetic radiation that has passed through or is reflected from a
sample including an
electromagnetic radiation source; a filter assembly configured to filter a
beam of
CA 02732978 2011-01-28
WO 2010/014277
PCT/US2009/041254
- 14 -
electromagnetic radiation produced by the electromagnetic radiation source; an
electromagnetic
radiation detector configured to detect electromagnetic radiation that has
passed through or is
reflected from a sample; and a processor in communication with the
electromagnetic radiation
detector, the processor configured to: (i) apply a first calibration spectrum
to a first recorded
spectrum obtained from the electromagnetic radiation detector, thereby
determining a measure
of one or more compounds in the sample; and (ii) modify the first calibration
spectrum to
account for a baseline variation of recorded spectra over time using at least
a second,
subsequent recorded spectrum obtained from the electromagnetic radiation
detector.
[0046] The description of elements of the embodiments of other aspects of the
invention can
be applied to this aspect of the invention as well.
[0047] In another aspect, the invention provides a system for monitoring a
process including
an electromagnetic radiation source; a filter assembly configured to filter a
beam of
electromagnetic radiation produced by the electromagnetic radiation source; a
sampling
mechanism configured to alternately direct a sample from a first stream
associated with the
monitored process into a sampling area and direct a sample from a second
stream associated
with the monitored process into the sampling area; an electromagnetic
radiation source
configured to direct an electromagnetic radiation beam from the
electromagnetic radiation
source to the sampling area; an electromagnetic radiation detector configured
to detect
electromagnetic radiation that has passed through or is reflected from the
sampling area; and a
processor configured to: (i) obtain a first spectrum corresponding to the
first stream; (ii) store
the first spectrum as a baseline spectrum; and (iii) obtain a second spectrum
from the second
stream using the baseline spectrum, wherein the second spectrum reflects a
compositional
difference between the first and second streams.
CA 02732978 2011-01-28
WO 2010/014277
PCT/US2009/041254
- 15 -
[0048] In certain embodiments, the sampling mechanism includes a solenoid
valve for
switching between the first and second streams. In certain embodiments, the
first stream is an
input stream to the monitored process and the second stream is an output
stream from the
monitored process. In certain embodiments, the first stream is an output
stream from the
monitored process and the second stream is an input stream to the monitored
process.
[0049] The description of elements of the embodiments of other aspects of the
invention can
be applied to this aspect of the invention as well.
[0050] In another aspect, the invention provides a spectroscopic method for
detecting
electromagnetic radiation that has passed through or is reflected from a
sample, including:
filtering a beam from an electromagnetic radiation source with a rotating
filter assembly;
detecting an angular position of the rotating filter assembly with a position
detector having at
least one component rigidly coupled to the rotating filter assembly;
intercepting the beam with
a sample; detecting the beam with an electromagnetic radiation detector; and
processing a
spectral data signal from the electromagnetic radiation detector to produce
chemical
information about the sample.
[0051] In certain embodiments, the rotating filter assembly is configured to
rotate about an
axis substantially perpendicular to a path of a beam of electromagnetic
radiation produced by
the electromagnetic radiation source. In certain embodiments, the rotating
filter assembly
includes a narrow-band interference filter. In certain embodiments, the
rotating filter assembly
includes at least three filters.
[0052] In certain embodiments, the position detector includes an encoder
configured to
produce at least a first signal comprising a series of digital pulses at a
first frequency, each
digital pulse corresponding to an angular position of the rotating filter
assembly.
CA 02732978 2011-01-28
WO 2010/014277
PCT/US2009/041254
- 16 -
[0053] In certain embodiments, the method includes digitizing an analog
spectral signal from
the electromagnetic radiation detector is performed. In certain embodiments,
digitizing is
performed at a frequency significantly greater than necessary to accurately
reproduce the
analog spectral signal; digitizing is performed at a frequency greater than a
Nyquist criterion
corresponding to the analog spectral signal; and/or digitizing is performed at
a frequency
greater than at least ten times the Nyquist criterion.
[0054] In certain embodiments, a step of applying a convolution function to a
spectral signal
from the electromagnetic radiation detector is performed to enhance wavelength
stability and/or
repeatability, and/or to improve signal-to-noise ratio.
[0055] The description of elements of the embodiments of other aspects of the
invention can
be applied to this aspect of the invention as well.
[0056] In yet another aspect, the invention provides a spectroscopic method
for detecting
electromagnetic radiation that has passed through or is reflected from a
sample to produce
chemical information about the sample, the method including: filtering a beam
from an
electromagnetic radiation source with a rotating filter assembly; intercepting
the beam with a
sample; detecting the beam with an electromagnetic radiation detector
configured to output an
analog spectral signal; detecting an angular position of the rotating filter
assembly with a
position detector, the position detector comprising an encoder configured to
produce at least a
first signal comprising a series of digital pulses at a first frequency, each
digital pulse
corresponding to an angular position of the rotating filter assembly, wherein
the encoder is
configured to produce significantly more digital pulses per rotation of the
rotating filter
assembly than are necessary to reproduce the analog spectral signal;
digitizing the analog
spectral signal using the first frequency as a clock frequency; and processing
the digitized
analog spectral signal to produce chemical information about the sample.
CA 02732978 2011-01-28
WO 2010/014277
PCT/US2009/041254
- 17 -
[0057] In certain embodiments, the first frequency is greater than a Nyquist
criterion
corresponding to the analog spectral signal. In certain embodiments, the first
frequency
corresponds to at least 1000 pulses per rotation of the rotating filter
assembly (or, alternatively,
at least 2000, 1500, 1250, 900, 800, 700, 600, or 500 pulses per rotation).
[0058] The description of elements of the embodiments of other aspects of the
invention can
be applied to this aspect of the invention as well.
[0059] In yet another aspect, the invention provides a spectroscopic method
for detecting
electromagnetic radiation that has passed through or is reflected from a
sample to produce
chemical information about the sample, including: filtering a beam from an
electromagnetic
radiation source with a filter assembly, the electromagnetic radiation source
having a variable
intensity; intercepting the beam with a sample; detecting the beam with an
electromagnetic
radiation detector; detecting a position of the filter assembly with a
position detector; adjusting
the intensity of the electromagnetic radiation source; and processing spectral
data from the
electromagnetic radiation detector to produce chemical information about the
sample.
[0060] In certain embodiments, adjusting the intensity of the electromagnetic
radiation source
is based on a detected position of the filter assembly.
[0061] The description of elements of the embodiments of other aspects of the
invention can
be applied to this aspect of the invention as well.
[0062] In yet another aspect, the invention provides a spectroscopic method
for monitoring
electromagnetic radiation that has passed through or is reflected from a
sample, the method
including: filtering a beam from an electromagnetic radiation source with a
filter assembly;
intercepting the beam with a sample; detecting the beam with an
electromagnetic radiation
detector; applying a first calibration spectrum to a first recorded spectrum
obtained from the
electromagnetic radiation detector, thereby determining a measure of one or
more compounds
in the sample; and modifying the first calibration spectrum to account for
baseline variation of
CA 02732978 2011-01-28
WO 2010/014277
PCT/US2009/041254
- 18 -
the recorded spectra over time using at least a second, subsequent recorded
spectrum obtained
from the electromagnetic radiation detector.
[0063] The description of elements of the embodiments of other aspects of the
invention can
be applied to this aspect of the invention as well.
[0064] In yet another aspect, the invention provides a spectroscopic method
for monitoring a
process, including: directing a first sample from a first stream associated
with the monitored
process into a sampling area; directing a second sample from a second stream
associated with
the monitored process into the sampling area; detecting filtered radiation
that has passed
through or is reflected from the sampling area; determining a first spectrum
corresponding to
the first stream; storing the first spectrum as a baseline spectrum; and
determining a second
spectrum from the second stream using the baseline spectrum, wherein the
second spectrum
reflects a compositional difference between the first and second streams.
[0065] In certain embodiments, the first stream is an input stream to the
monitored process
and the second stream is an output stream to the monitored process. In certain
embodiments,
the first stream is an output stream to the monitored process and the second
stream is an input
stream to the monitored process.
[0066] The description of elements of the embodiments of other aspects of the
invention can
be applied to this aspect of the invention as well.
[0067] In yet another aspect, the invention provides a method for increasing
the robustness
and/or stability of the measurement, including: obtaining a first spectrum
from an
electromagnetic radiation detector; applying a classical least squares
analysis to the first
spectrum using a principal calibration matrix to obtain detection values;
determining a residual
magnitude by quantifying how well the first spectrum fit the principal
calibration matrix;
comparing the residual magnitude to a predetermined threshold to determine if
a threshold
condition exists and, if a threshold condition exists, creating a secondary
reference matrix using
CA 02732978 2011-01-28
WO 2010/014277
PCT/US2009/041254
- 19 -
the first spectrum if a secondary reference matrix does not exist and, if the
secondary reference
matrix exists, adding the first spectrum to the secondary reference matrix as
a row or a column;
adding the rows or columns of the secondary reference matrix to the principal
reference matrix
to update the reference matrix; and reapplying a classical least squares
analysis to a second
spectrum from an electromagnetic radiation detector.
[0068] In certain embodiments, the size of the secondary reference matrix is
predetermined.
In certain embodiments, determining a residual magnitude comprises computing a
mean of an
absolute function of a classical least squares fit of the first spectrum;
and/or determining a
residual magnitude comprises computing a maximum value of an absolute function
of a
classical least squares fit of the first spectrum.
[0069] In certain embodiments, the threshold condition exists when the
residual magnitude
exceeds a predetermined threshold value; the threshold condition exists when
the first spectrum
is substantially orthogonal to the principal calibration matrix; the reference
matrix comprises
spectral data from a beam of electromagnetic radiation that has not passed
through a sample;
the principal calibration matrix comprises spectrum values corresponding only
to substances to
be detected; and/or the principal calibration matrix comprises spectrum values
corresponding to
substances to be detected and other substances likely to be found together
with the substances
to be detected.
[0070] The description of elements of the embodiments of other aspects of the
invention can
be applied to this aspect of the invention as well.
CA 02732978 2011-01-28
WO 2010/014277
PCT/US2009/041254
- 20 -
Brief Description of Drawings
[0071] The objects and features of the invention can be better understood with
reference to
the drawings described below, and the claims. The drawings are not necessarily
to scale,
emphasis instead generally being placed upon illustrating the principles of
the invention. In the
drawings, like numerals are used to indicate like parts throughout the various
views.
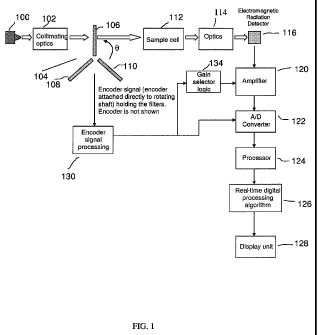
[0072] Fig. 1 is a block diagram of a spectroscopic system for detecting
radiation according
to an illustrative embodiment of the present invention.
[0073] Fig. 2 is a perspective view of a rotating filter assembly, according
to an illustrative
embodiment of the invention.
[0074] Fig. 3 is schematic of an encoder signal processing circuit, according
to an illustrative
embodiment of the invention.
[0075] Fig. 4 is an illustration of signal-to-noise ratio improvement after
application of a
convolution function to a spectral signal, according to an illustrative
embodiment of the
invention.
[0076] Fig. 5 is a block diagram of a spectroscopic method according to an
illustrative
embodiment of the present invention.
[0077] Fig. 6 is a flow chart of a spectral processing method using an
adaptive algorithm
according to an illustrative embodiment of the present invention.
[0078] Fig. 7 is a flow chart for a spectral processing method using an
adaptive algorithm
according to an illustrative embodiment of the present invention.
[0079] Fig. 8 is an illustration of spectral data from an experiment using a
spectroscopic
method according to an illustrative embodiment of the present invention.
[0080] Fig. 9 is an illustration of spectral data from an experiment using a
spectroscopic
method according to an illustrative embodiment of the present invention.
[0081] Fig. 10 is an illustration of wavelength scale error caused by
wavelength shift.
CA 02732978 2011-01-28
WO 2010/014277
PCT/US2009/041254
-21 -
[0082] Fig. ills a block diagram of a method for correcting for wavelength
scale error
according to an illustrative embodiment of the present invention.
[0083] Fig. 12 is an illustration of residual spectrum due to wavelength error
mismatch and a
first order difference spectrum.
[0084] Fig. 13 is an illustration of first order absorption spectra of various
compounds in a
mid-IR region.
[0085] Fig. 14 is an illustration of multi-region, cross-analysis band
selection.
[0086] Fig. 15 is a block diagram of a method for multi-region, cross-analysis
band selection
according to an illustrative embodiment of the present invention.
[0087] Fig. 16 is an illustration of potential non-linear spectral error
caused by wavelength-
dependent spectral magnitude variations.
[0088] Fig. 17 is a block diagram of a method of multi-region, cross analysis
regression
according to an illustrative embodiment of the present invention.
[0089] Fig. 18 is an illustration of programmatically varying light source
intensity with dead
band regions.
[0090] Fig. 19 is a block diagram for a method of modulating the intensity of
an
electromagnetic radiation source according to an illustrative embodiment of
the present
invention.
[0091] Fig. 20 is an illustration of synchronizing two EM radiation sources to
obtain higher
modulation bandwidth, according to an illustrative embodiment of the present
invention.
[0092] Fig. 21 is an illustration of the use of two EM radiation sources and
two detectors for
multi-wavelength region analysis, according to an illustrative embodiment of
the present
invention.
[0093] Fig. 22 is a process flow diagram for a spectroscopic method using
sequential,
differential measurement according to an illustrative embodiment of the
present invention.
CA 02732978 2011-01-28
WO 2010/014277
PCT/US2009/041254
- 22 -
[0094] Fig. 23 is an illustration of a method for quadrupling a clock signal
from an encoder
according to an illustrative embodiment of the present invention.
[0095] Fig. 24 is an illustration of tilted filter, tilted with respect to the
rotation axis,
according to an illustrative embodiment of the present invention.
[0096] Fig. 25 is an illustration of a configuration employing stacked filter
assemblies,
according to an illustrative embodiment of the present invention.
[0097] Fig. 26 is a comparison of measurement stability between (i) system
with rotation axis
perpendicular to the beam and (ii) system with rotation axis non-perpendicular
to the beam,
according to an illustrative embodiment of the present invention.
[0098] Fig. 27 is a graph illustrating the relationship of peak transmission
wavelength of a
bandpass interference filter with the incident angle.
[0099] Fig. 28 is a block diagram illustrating the spectroscopic system in
communication
with a computer and its elements, according to an illustrative embodiment of
the present
invention.
Detailed Description
[0100] It is contemplated that methods, systems, and processes described
herein encompass
variations and adaptations developed using information from the embodiments
described
herein.
[0101] Throughout the description, where systems and compositions are
described as having,
including, or comprising specific components, or where processes and methods
are described as
having, including, or comprising specific steps, it is contemplated that,
additionally, there are
systems and compositions of the present invention that consist essentially of,
or consist of, the
recited components, and that there are processes and methods of the present
invention that
consist essentially of, or consist of, the recited processing steps.
CA 02732978 2011-01-28
WO 2010/014277
PCT/US2009/041254
-23 -
[0102] The mention herein of any publication, for example, in the Background
section, is not
an admission that the publication serves as prior art with respect to any of
the claims presented
herein. The Background section is presented for purposes of clarity and is not
meant as a
description of prior art with respect to any claim.
[0103] Headers are used herein to aid the reader and are not meant to limit
the interpretation
of the subject matter described.
[0104] Fig. 1 is a block diagram of a spectroscopic system for detecting
electromagnetic
(EM) radiation according to an embodiment of the present invention. An EM
radiation source
100, or multiple EM radiation sources 100 covering one or multiple wavelength
regions, are
configured to direct a beam of EM radiation to a filter assembly 104 (as
shown, having three
filters). The EM radiation source 100 may be made out of a heated filament,
LED type, or any
other suitable type. The beam may be collected and collimated by collimating
optics 102,
which may be made out of a series of lenses or mirrors. The collimated beam is
intercepted by
the filter assembly 104, which is shown as viewed from the top.
[0105] In certain embodiments, the filter assembly 104 is configured for
rotation. The filter
assembly 104 may be positioned relative to the collimated beam from the light
source 100 such
that the axis of rotation is substantially perpendicular to the path of the
beam. Alternatively, the
axis of rotation may be fixed such that it is not perpendicular to the path of
the beam, in order
to reduce or eliminate back-reflected light and/or stray light and/or to
further control the
wavelength coverage.
[0106] In certain embodiments, the filter assembly 104 may have at least three
filters (106,
108, 110). Each of the filters may be a narrow-band interference filter
configured to pass a
certain narrowband of the EM radiation incident on it. These individual
filters are generally
available commercially off-the-shelf. The filter assembly 104 may be
configured as indicated
in Fig. 1 such that the angle (0) between the collimated beam and a filter
varies. In addition,
CA 02732978 2011-01-28
WO 2010/014277
PCT/US2009/041254
- 24 -
rotation causes the beam to be incident on the different filters (106, 108,
110) in the assembly.
The numbers of filters that can be employed is between one and four, depending
on the
measurement or monitoring application. In particular, this depends on the
number of
compounds that need to be measured or monitored. The transmission wavelength
of each of
the filters can generally be tuned from its original wavelength to
approximately 95% of the
original wavelength assuming a maximum of 40-degree change in the incident
angle. For
example, a filter that has a nominal (at 90-degree incident angle)
transmission wavelength peak
at 2000 nm can be tuned to approximately 1900 nm (0.95 x 2000 nm). If the
target compounds
happen to have spectral features within this region (1900 nm ¨ 2000 nm), using
only this filter
is sufficient for the measurement. Multiple filters are needed for a wider
spectral coverage.
Multiple filters may also be used to provide spectral coverage of distinct
wavelength regions,
i.e. regions that are not close to each other on the wavelength scale. For
example, one filter
may have a nominal transmission at 2000 nm and the other at 8000 nm.
Continuing on the
beam path in Fig.1, the filtered beam then passes through a sample cell 112,
which may contain
a sample. The sample may be gaseous, liquid or solid. Additional optics 114,
such as focusing,
collimating and/or collecting optical elements, may be used to increase the EM
radiation
throughput or to better manage or direct the EM radiation when necessary. In
the sample cell
112, the beam is intercepted by the sample, which modifies the spectrum of the
original beam.
The interaction may be in the form of absorption, fluorescence or other types
of light-matter
interactions. The beam may be then focused onto an EM radiation detector 116
using focusing
optics 114. The EM radiation detector 116 may be a semiconductor based
detector such as
silicon photo-diode, a pyroelectric photo-detector, or other types of EM
radiation detectors.
Using an amplifier 120, a spectral signal from the EM radiation detector 116
may be turned
into an electrical signal, and may then be converted into a digital signal by
an analog-to-digital
(A/D) converter 122.
CA 02732978 2011-01-28
WO 2010/014277
PCT/US2009/041254
- 25 -
[0107] In certain embodiments, the surface of the filter(s) is parallel to the
axis of the rotation
or the rotatable filter assembly. With this configuration, the angular
coverage of the rotating
filter spectrometer starts from zero incident angle. For example, if a narrow-
band filter has a
nominal (zero angle) peak transmission at 2000 nm, the starting wavelength of
the spectral
coverage of the spectrometer with the surface of filter parallel to the axis
of the rotation is
theoretically 2000 nm.
[0108] In certain embodiment, the surface of one, some, or all of the filters
2400 (Fig. 24) is
angularly tilted about an axis perpendicular to the axis of rotation of the
rotatable filter
assembly and the axis normal to the surface of the filter. It is found that
tilting of the filter(s)
eliminates or suppresses the back-reflected light or stray light that may
cause measurement
inaccuracy, non-linearity and/or instability and results in a significant
advantage in
measurement stability. Figure 26 shows a comparison between the measurement
stability of a
system having the rotation axis perpendicular to the electromagnetic beam
(2600) and the
measurement stability of a system having the rotation axis at 87 degrees to
the electromagnetic
beam (2601). Each plot corresponds to a 72-hour of zero stability run,
specifically, the system
was configured and calibrated for moisture analysis at around 2.7 [tm, and the
sample gas was
dry nitrogen. Both systems employed a least-squares regression chemometric
method to
predict the moisture concentration upon a moisture calibration spectrum. Plots
2600 and 2601
demonstrate the significant advantage in measurement stability afforded by
tilting the filter(s)
in this way.
[0109] It is also found that tilting of the filter(s) improves control of the
wavelength coverage
of the spectrometer, in light of certain filter characteristics and mechanical
angular coverage of
the rotatable filter assembly. For purposes of illustration, and without
wishing to be bound by
any particular theory, Figure 27 shows the theoretical relationship between
the incident angle
and the peak transmission wavelength of a narrowband interference filter with
a nominal (zero-
CA 02732978 2011-01-28
WO 2010/014277
PCT/US2009/041254
- 26 -
angle) peak wavelength of 2000 nm. Configuration "A" illustrates a system with
the surface of
the filter parallel to the axis of rotation. Assuming that the effective
angular coverage from the
rotating filter assembly is 0 ¨ 30 degrees, the resulting spectral coverage is
approximately 2000
nm ¨ 1900 nm. On the other hand, in configuration "B", in which the surface of
the filter is
tilted at 10 degrees with respect to the rotation axis, the resulting incident
angle coverage with
0 ¨ 30 degrees rotation is between 10 ¨ 40 degrees, resulting in a spectral
coverage of
approximately 1980 nm ¨ 1830 nm, as illustrated in Figure 27.
[0110] In some embodiments, the amplifier 120 is a fixed gain amplifier.
Alternatively, the
amplifier 120 may have a variable gain.
[0111] A digital spectral signal from the AID converter 122 may be fed to a
processor 124 in
which a real-time digital signal processing algorithm 126 is applied. The
final outcome of the
process may be quantitative chemical composition data, which may be displayed
in a display
unit 128.
[0112] The use of multiple filters such as shown in Fig. 1 (as shown, filters
106, 108, and
110) enables wide discrete spectral coverage. For example, one filter may
cover the near
infrared region around 2000 nm, and the others may cover the mid-infrared
region around 8000
nm. The EM radiation detector 116 and the EM radiation source 100 may produce
a signal at
extremely different magnitudes in the different spectral regions. For example,
when using an
amplifier 120 with a fixed gain, a signal from the 8000 nm may amount to 1
volt, whereas a
signal from the 2000 nm may amount to 1000 volts due to the higher EM
radiation source
output and better detector responsivity at the near infrared region.
[0113] In certain embodiments, an amplifier 120 switches the gain based upon
an angular
position of the filters as commanded by the gain selector logic 134. In
another embodiment, an
amplifier 120 switches the gain based upon the magnitude of a spectral signal
itself.
CA 02732978 2011-01-28
WO 2010/014277
PCT/US2009/041254
-27 -
[0114] The A/D convertor 122 receives its timing or clock signal from an
encoder 208 that is
preferably attached rigidly to the filter assembly 104. The encoder 208 may
produce digital
pulses that correspond to an angular position of the filter assembly 104.
[0115] Fig. 2 shows an encoder 208 in more detail. The encoder 208 may include
an encoder
electronics unit 206 for carrying the digital pulses corresponding to an
angular position of a
rotating filter assembly 104. An example of such an off-the-shelf encoder is
EM-1-1250 made
by US Digital (Vancouver, WA), which produces 1250 pulses per quadrature
channel per
rotation.
[0116] The encoder pulses may be sent to an encoder signal processing unit
130, of which a
simplified schematic of one embodiment is shown in Fig. 3. An encoder signal
processing unit
130 may include two Schmitt triggers (304, 306) that reject any glitches or
noise due to
electromagnetic interference. The clean digital pulses may then be sent to an
XOR gate 308 to
combine the two quadrature signals (300, 302) from an encoder into a single
signal 310 that is
doubled in frequency. For example, in some embodiments, an encoder 208
produces 1250
quadrature pulses per rotation. Upon exiting the encoder signal processing
unit 130, the signal
310 has a frequency at least double the frequency of one of the quadrature
signals (300, 302) to
become at least 2500 pulses per rotation. The encoder signal processing unit
130 enables
greater over-sampling and data averaging that thereby improves wavelength
stability and the
system's signal-to-noise ratio.
[0117] In certain embodiments, the pulses are multiplied further in frequency
by employing a
different electronics scheme. For example, to quadruple an original clock
frequency, the
following scheme may be used. As shown in Fig. 23, an edge detector 2304 may
be used to
trigger a short pulse by detecting either a positive or negative edge in the
incoming signals from
a first and second channel (2300, 2302). The signals from the first and second
channels (2300,
2302) are sent to the edge detector 2304 and then the same signal is delayed
to create the effect
CA 02732978 2011-01-28
WO 2010/014277
PCT/US2009/041254
- 28 -
of a difference, which will be seen by the edge detector 2304 as a reason to
output a high logic.
The high state may last the duration of the delay introduced. The duration of
the pulse may be
long enough to allow an A/D convertor 122 to perform a conversion. Illustrated
in Fig. 23 is an
implementation of this using logic gates. Other methods include the use of
multiple
combinations of logic gates, flip-flops, logic gates and passive components,
and analog
components to achieve similar purpose. The delay can be implemented using
multiple gates
which are intended to increase the pulse width out of the edge detector.
[0118] With reference to Fig. 3, at least one component of an encoder 208 may
be rigidly
attached to a filter assembly 104. This may help to ensure that there is no
mechanical
compliance (or "play") between the two elements, thus providing for a more
stable and
repeatable timing or clock signal position regardless of variations in
environmental conditions,
such as vibration and temperature variations. Such an arrangement may also
enable the use of
a speed reduction mechanism, such as gear or belt drives, to optimize power
transmission while
maintaining repeatable and stable clock signal positions.
[0119] The filter assembly 104 may include a table 202 for mounting filters
(as shown in Fig.
2, 106, 108, and 110). Each filter may be secured to the table 202 with a
mounting bracket 200.
The table 202 may be coupled to a shaft 204.
[0120] In certain embodiments, a speed-reduction mechanism may be coupled to
the motor
that drives the filter assembly 104. A speed-reduction mechanism may be a belt-
and-pulley
type, which may provide smooth, noise-free motion. In certain embodiments, the
velocity of
the rotating filter assembly 104 is adjusted and controlled using a digital
feedback control.
[0121] To further improve wavelength stability/repeatability, the measured
signal just before
the A/D conversion is over-sampled, i.e. the signal is digitized at a
frequency significantly
higher than the Nyquist criterion which is required to accurately reproduce
the analog signal
digitally. Such over-sampling is achieved by employing an encoder that
provides a large
CA 02732978 2011-01-28
WO 2010/014277
PCT/US2009/041254
- 29 -
number of pulses per rotation. To illustrate by example, if the to-be-measure
spectral features
require a clock signal of 100 pulses per rotation, the encoder 208 should be
designed or chosen
such that it provides significantly more than 100 pulses per rotation. A
suitable encoder for this
example is one that provides on the order of 1000 pulses per rotation. The
upper limit would
be the maximum allowable sampling frequency of the AID converter 122.
[0122] This signal over-sampling may be combined with a digital convolution
step performed
in the processor 124. The combination of data over-sampling and convolution
would improve
the wavelength stability or repeatability and the spectral signal-to-noise
ratio. The convolving
function 402 may be a "boxcar" function, triangular function, Gaussian
function or other
applicable functions. For the purpose of wavelength stability improvement, the
exact type of
convolving function 402 is less important than the width of the function. The
width of the
convolving function 402 should be maximized to the point where widening it
further would
alter or broaden the actual spectral features of the measured compound. For
example, Fig. 4
shows a "box-car" convolution function 402 applied to a raw signal 400. It can
be seen that the
convoluted signal 404 is shown with an improved signal-to-noise ratio without
loss of any of
the relevant spectral features.
[0123] A common source of measurement instability is baseline instabilities of
the recorded
spectrum, which may be due to slight optical alignment changes (for example
due to
temperature variations), light source degradation, dirty optics, etc. Fig. 5
shows a block
diagram schematic of a spectral processing method using a baseline correction
algorithm to
produce a processed spectrum 502. A baseline correction algorithm 500 may be
employed to
ensure long-term measurement stability. In one embodiment, a polynomial fit is
applied to the
spectrum A linear or a second order fit is generally sufficient to remove
common types of
baseline variations, although a higher order fit may also be used as long as
it does not remove
the relevant spectral features. In another embodiment, a spectral
differentiation is used to
CA 02732978 2011-01-28
WO 2010/014277
PCT/US2009/041254
- 30 -
remove the baseline variations. The spectral differentiation algorithm is of
the form S_new(n) =
S(n+1) ¨ S(n), or variations thereof, where S_new is the resulting baseline-
corrected spectrum,
S is the original spectrum, and n is the data element of the spectrum.
[0124] As shown in one embodiment, shown in Figure 6, to produce the actual
measurement
values, i.e. the compounds' concentration or density values, a classical least
squares analysis
600 is applied to the processed spectrum 502. With this method, a calibration
spectra (the "K"
matrix) 602, described below, is needed before hand. This matrix contains the
calibration
spectra of all of the target compounds (compounds to be measured).
[0125] In continuous monitoring applications in which the instrument cannot be
re-zeroed
("zero" or background spectrum taken) frequently, there may be baseline
variations that cannot
be completely fitted by a polynomial function. This is particularly true with
a filter-based
spectroscopy system of the present invention, which tends to be more
susceptible to these type
of baseline errors due to the nonlinear wavelength-angle function. In
addition, spectral
variations that are due to un-modeled interferences such as those due to other
unknown
compounds may also be present, which would also cause measurement
instabilities.
[0126] In one embodiment, shown in Fig. 6, the present invention overcomes
these problems
as described below. An adaptive algorithm is designed; one that continuously
and
automatically modifies the calibration spectra ("K" matrix) to account for any
un-modeled
spectral variation including those associated with long-term drifts or
instabilities. Fig. 6 shows
a flow chart of this algorithm showing its basic operation. The processed
spectrum (raw
spectrum upon passing through convolution and linear baseline correction) is
fitted with a
calibration matrix containing the original or the principal calibration matrix
(calibration spectra
of the target compounds) 606 and a secondary calibration matrix 604. A
secondary calibration
spectrum is added to the secondary calibration matrix each time the magnitude
of the residual
spectrum from the CLS analysis exceeds a certain predetermined threshold
value, as indicated
CA 02732978 2011-01-28
WO 2010/014277
PCT/US2009/041254
- 31 -
by a decision step 618 in the flow chart. The rows or columns of the secondary
calibration
matrix 604 are added 608 to the rows or columns of the principal calibration
matrix 606 to
obtain a modified calibration spectra or "K" matrix 602.
[0127] To illustrate by means of an example, consider a principal calibration
matrix
containing three target compounds: kA(k) for target compound A, kB(k) for
target compound B,
and kc(k) for target compound C, where k(k) is essentially a spectrum of the
target compound
calibrated at a certain compound concentration or density value. When a
disturbance occurs
such that the measured spectrum could not be adequately modeled by the
principal calibration
matrix (as quantified by the residual magnitude or spectrum 614, determined by
employing the
step of residual computation 612), the measured spectrum s(X) is added to the
calibration
matrix. Thus, the calibration matrix 602 becomes:
I-. 1
kA(A)
kB(X)
kc(X)
s(k) Secondary calibration
µsr, .., .4-
spectrum
where n = 1, 2, 3, ...
[0128] There is more than one approach to compute the residual magnitude 616
from the
residual spectrum. For example, in one embodiment, the magnitude computation
of the
residual spectrum involves computing the mean value of the absolute function
of the residual
spectrum. Other magnitude computation method may be used, such as calculating
the
maximum value of the absolute function of the residual spectrum.
[0129] In certain embodiments, the size of the secondary calibration matrix
604 (the number
of the secondary calibration spectra, "n") is predetermined. In other
embodiments, the size of
the secondary calibration matrix may be continuously updated or limited based
upon certain
CA 02732978 2011-01-28
WO 2010/014277
PCT/US2009/041254
- 32 -
variables such as elapsed time of measurement, orthogonality of the secondary
calibration
matrix to the principal calibration matrix, and the magnitude of the residual
spectrum.
[0130] The residual magnitude threshold value used in the comparison step
"exceed
threshold?" 618 may be determined by experimentation, taking into account
factors including
the inherent random spectral noise, the number of spectral averaging which
affects spectral
noise, and the required stability of the measurement.
[0131] Fig. 7 shows another embodiment of the adaptive algorithm, in which
another
condition, "sufficient orthogonality" 700 is added before a measured spectrum
is added to the
calibration matrix. In this embodiment, the measured spectrum is tested
whether it is
sufficiently orthogonal to each of the principal calibration spectrum. The
test involves
computing the inner dot product of the normalized vectors, s. k, where s is
the normalized
measured spectrum (not shown) and k is one of the normalized principal
calibration spectra
606. The result would be between zero (completely orthogonal) and one
(completely parallel).
This test is important to ensure no spectrum that is considerably parallel to
any of the spectra of
the target compounds is entered into the calibration matrix. If that happens,
the measurement
results of the target compounds would be erroneous. An orthogonality test
threshold value
should be chosen to minimize this risk. In the present embodiment, that
threshold value is
chosen to be 0.05.
[0132] When the orthogonality criterion is not met, the processor 124 may be
configured to
produce a signal ("Provide Warning" 700) that can be used to alert the user in
various ways,
including flashing an LED, generating sounds, displaying messages, etc. The
warning signal(s)
tells the user that there are one or more interference compounds that have
spectral features
similar to one of the target compounds. The algorithm can also be designed
such that the
warning signal provide specific messages as to which target compound the
interference
compound is conflicting with.
CA 02732978 2011-01-28
WO 2010/014277
PCT/US2009/041254
- 33 -
[0133] The usefulness of the approach is demonstrated in the following
experiment. A test
unit was set up to monitor N-Butane gas as the target compound, one of the
common
hydrocarbons of interest in safety monitoring application. Isopropanol vapor
(IPA) and 1,1-
Difluoroethane gas were used as the interferents, both of which are commonly
used cleaning
compounds. Note that 1,1-Difluoroethane (R-152a) is commonly used as the main
or sole
ingredient of "dust-off' electronic cleaning products. The high-resolution
absorption spectra (1
cm-1 resolution) of the compounds between 3200 nm and 3600 nm are shown in
Fig. 8. As
seen, the spectra 800 are greatly overlapping. If a traditional chemometric
method, such as the
classical least-squares or principal component analysis technique is to be
used, the spectra of
both interferents must be entered into the calibration matrix. Otherwise,
greatly erroneous
readings would be produced. With an adaptive algorithm, on the other hand, the
calibration
matrix needs to contain only one spectrum, which is the spectrum of the target
gas, N-Butane.
[0134] 1,1-Difluoroethane, one of the test interference gases was sampled by
releasing it
from "dust-off' product near in the inlet of the sampling port. Similarly, IPA
vapor was
sampled by opening a bottle of rubbing alcohol liquid near the sampling inlet.
Fig. 9
demonstrates the ability of the system to compensate for the interfering
compounds, IPA vapor
and 1,1,-Difluoroethane gas. The top graph 900 shows butane concentration
readings using an
adaptive algorithm. The maximum butane concentration error was less than 25
ppm, which
also quickly disappeared (within two measurement cycles). This happened when a
large
amount of IPA vapor was introduced. Note again that the spectrum of IPA vapor
was not
included in the calibration matrix. Without the adaptive algorithm, the
maximum butane
concentration error would have been more than 600 ppm due to the same
interference release,
as can be seen on the lower graph 902. Similarly, the interference
compensation technique
worked well for the R-152 interference, in which the system exhibited
negligible error.
CA 02732978 2011-01-28
WO 2010/014277
PCT/US2009/041254
- 34 -
Wavelength Lock
[0135] Another source of measurement instability is wavelength scale
variations due to
optical alignment changes, inherent temperature dependence of the optical
interference filter 3
and/or temperature dependence of the compound's spectral features themselves.
Interference
optical filters will shift to longer wavelength with increasing temperature
and shorter
wavelength with decreasing temperature. The shift is on the order of 0.01 ¨
0.2 nm/deg.
Celsius. For example, a 10 deg. Celsius shift of temperature could amount to 2
nm of
wavelength scale variation, which would degrade measurement stability. Fig. 10
illustrates a
wavelength scale error causing an apparent shift in the absorption spectrum of
the sample,
potentially causing a significant measurement error using traditional least-
squares,
chemometrics approach.
[0136] A "wavelength lock" algorithm is used to compensate for the wavelength
error by
wavelength shifting the measurement spectrum prior to the least squares
prediction. A block
diagram depicted in Fig. 11 shows the flow chart of the methodology. The raw
spectrum 502,
presumed to contain wavelength error, is modeled using a classical least
squares algorithm
(CLS) 600 (explained below) or other similar approach to obtain the spectrum
residual, i.e. the
"left-over" part of the spectrum that is not fitted by the model. CLS
regression involves the
following computation:
c = sKT(KKT)-1
where c is a vector containing the concentration value(s), s is the sample
spectrum, and K is the
calibration matrix 1106 containing pre-determined basis spectra. The residual
spectrum, r, is
obtained by performing the following computation:
r=s - cTKT
CA 02732978 2011-01-28
WO 2010/014277
PCT/US2009/041254
- 35 -
[0137] The presence of wavelength shift causes a classical least-squares
regression (CLS)
residual spectrum 612 to have similar feature characteristics with a first
order difference
spectrum 1100. To illustrate by means of an example, consider the CH4 spectra
shown in Fig.
10. Using the original spectrum as the calibration spectrum (as the K matrix)
and the
wavelength shifted spectrum as the sample spectrum, s, the resulting residual
spectrum, r, is
computed and shown in the top figure 1200 of Fig. 12. The first order
difference spectrum of
the original spectrum, on the other hand, is shown in the bottom figure 1202
of Fig. 12. As
seen, the residual spectrum and the first order difference spectrum exhibit
great similarities, as
expected. In addition, the magnitude of the residual spectrum, computed in the
step
Wavelength shift magnitude computation 1102 is proportional to the magnitude
of the
wavelength shift error. These features are used to correct the wavelength
shift error as a step
Wavelength correction 1104 to obtain a wavelength corrected spectrum 1108.
This wavelength
error correction algorithm may be applied continuously at a predetermined
interval, as rapid as
once every scan.
[0138] Other methods may be used to correct the wavelength shift error. One
method
includes monitoring the location of the peak of the spectrum. For example, the
spectral peak at
¨3315 nm in Fig. 10 is monitored to indicate the presence of wavelength shift.
Such a method
provides lower sensitivity to wavelength shift. In addition, the presence of
other spectral
features or peaks (such as those due to background or interfering compounds)
may obscure the
result.
Multi-region, cross-analysis regression
[0139] To further enhance measurement sensitivity and selectivity, and to
minimize the
effects of spectral non-linearities, a multi-band, cross-analysis, least-
squares regression is used.
The least-squares regression approach uses a single analysis band or region to
measure the
target compound(s), i.e. using a single calibration matrix, K, over a certain
wavelength region.
CA 02732978 2011-01-28
WO 2010/014277
PCT/US2009/041254
- 36 -
On the other hand, the multi-band, cross-band regression method uses multiple
K calibration
matrices for a single or multiple target compounds. To illustrate by means of
an example, we
consider an application where the spectroscopic device is used to measure the
concentrations of
methane (CH4), ethane (C2H6) and propane (C3H8) vapors in a certain process
stream or in the
ambient air. Fig. 13 shows the first order absorption spectra of the vapors in
the relevant mid-
infrared region. The traditional approach uses a single region covering the
whole relevant
wavelength region, for example, between 3200 and 3500 nm to perform the
analysis using a
certain chemometrics algorithm such as CLS, PLS or PCA. One embodiment makes
use of
multiple regions to perform the analysis, building multiple calibration
matrices and using them
simultaneously to perform the compound concentrations computation. Fig. 14
shows possible
separate band regions, regions 1, 2 and 3 for the analysis, each containing a
calibration matrix
"tuned" for the analysis of one target compounds.
[0140] Furthermore, each calibration matrix (at each region) includes the
models for some of
all of the other compounds present in the sample, to account for their
interferences. Following
the previous example, the calibration matrix for C3H8 (using region 1) would
contain the
models to account for the spectral features of CH4 and C2H6 located within
region 1 to
minimize the interference or cross-sensitivity effects. Fig. 15 illustrates
the general approach.
For example, analysis of region 1, 1502, corresponding to target compound A
and intereferents
B, C, and D 1500, can yield concentration values of compound A, 1506.
Similarly, analysis of
region 2, 1504, yields concentration value of compound B, 1508.
[0141] Furthermore, more than one analysis region may be used to compute the
value of a
single compound, resulting in more than one computed concentration or density
values. These
computed values may later be post-processed to produce a single value or other
information.
Such a method is particularly advantageous in a highly complex sample
mixtures, high-
concentration samples or highly scattering samples, where non-linear behaviors
are present. To
CA 02732978 2011-01-28
WO 2010/014277
PCT/US2009/041254
- 37 -
illustrate the method by means of example, consider an absorption spectrum
shown in Fig. 16,
in particular, notice how an increase in concentration or density value affect
the magnitude of
the absorption spectrum. Instead of uniform or constant magnitude
amplification across the
wavelengths, the amplification itself is wavelength dependent. As such, a
single-region
analysis using a linear least-squares regression will result in a large
residual error and will not
provide an accurate concentration or density computation. The multi-region,
cross-analysis
regression method solves the problem by breaking the wavelength region into
smaller pieces,
each producing a computed concentration or density value. The concentration or
density values
are then post-processed 1700 to produce a single concentration or density
value and/or other
pertinent information related to the state of the sample or measurement 1702.
The general
approach is illustrated in Fig. 17.
Single-beam based correction
[0142] A potential source of spectral baseline instability is instrumental
variations, such as
light source degradation and power variations, optics transmission degradation
due to dust and
particulates, alignment changes, etc. The spectral characteristics of most if
not all of the
instrumental variations can be modeled from the spectral characteristics of
the single beam
spectrum itself. The single-beam spectrum refers to the transmission spectrum
of an EM
radiation source and the optical system without the presence of a sample. The
predicted
spectral features of these potential variations (the instrument-correction
spectra) are derived
from the single-beam spectrum and entered into the calibration matrix. The
instrument-
correction spectra may be in the form of the pure single-beam spectrum, the
derivative(s) of the
single-beam spectrum and/or other derivations of the single-beam spectrum.
CA 02732978 2011-01-28
WO 2010/014277
PCT/US2009/041254
- 38 -
Background Calibration Method
[0143] Certain embodiments of the invention include development of a
calibration matrix, in
particular, a "background" calibration set, Sbackground, i.e. a set containing
the spectra of all of
the interfering background samples except for the target compound, separately
from the target
compound's calibration set, Starget. Two separate calibration sets are
produced, one that of the
background, and one that of the target compound.
[0144] The background calibration set is developed by intentionally varying
the
concentration or density levels of the background interfering compounds. The
background
calibration set may also include the spectral variations model due to
instrumental changes such
as light source intensity changes. Similarly, these instrumental variations
shall be simulated
intentionally to build a calibration set that completely and accurately models
all of the potential
variations. Care should be taken to ensure that the samples used to develop
the background
calibration set do not include any detectable level of the target compounds. A
background
calibration matrix is then developed by reducing the spectral variations in
the background
calibration set into a smaller orthogonal set of variations using PCA
(principal component
analysis), PLS (partial least squares) or other similar methods. In using PLS,
the dependent
variables input would be a vector of zeroes, due to zero values of the target
compound in all of
the samples.
[0145] Independently, the calibration set of the target compound is developed
by varying its
levels of concentration or density within the relevant range. Care should be
taken so as not to
introduce any impurities that might have interference effects to the recorded
spectra. For
example, in the case of infrared gas absorption measurement, nitrogen or
helium may be used
as the balance gas in the calibration set development as neither exhibit any
infrared absorption
signals.
CA 02732978 2011-01-28
WO 2010/014277
PCT/US2009/041254
- 39 -
[0146] The background and target compound calibration sets are then combined
to produce
the calibration matrix. To illustrate by means of example, suppose 100 spectra
are obtained for
the background set and 10 spectra are obtained for the target compound set.
The complete
calibration set will contain 110 spectra upon which the calibration matrix is
developed.
[0147] If there is more than one target compound, the previous steps are
repeated for each
additional target compound. Interference between the target compounds shall be
taken into
account by including the spectra of any other target compounds as part of the
background
calibration set of the subject target compound.
Light source power modulation
[0148] To further optimize the system components' dynamic range and/or to
provide better
detections of compounds having weak signals without increasing the overall
power
requirement, the EM radiation source(s) 100 may be varied in its intensity by
varying the
source voltage or current programmatically, so as to provide higher or lower
intensity
depending on the spectral range that is being analyzed at each particular
instant. Fig. 18 shows
an example of an EM radiation intensity variation profile. In this example,
the EM radiation
source intensity is programmed such that each filter analysis region uses a
constant source
intensity. In another embodiment, the light source intensity may be varied
within each or any
of the filter analysis regions. As the filter assembly 104 rotates, the path
of the beam of EM
radiation will become incident on both active and inactive portions of each
filter. As the beam
is incident on an inactive portion, a dead band 1800 is produced. In an
embodiment, the EM
radiation source 100 is modulated in such a way so that the power is zero or
close to zero in the
dead bands 1800, to minimize the average power dissipation.
[0149] In certain embodiments, the modulation command is originated in the
processor 124,
which uses the angular position of the filter assembly 104 from the encoder
electronics 206 to
determine the level of source intensity to output. The output (generally in
the form of a
CA 02732978 2011-01-28
WO 2010/014277
PCT/US2009/041254
- 40 -
voltage) of the processor 124 enters the EM radiation source power
electronics, which is
configured to vary the voltage (in the case of voltage mode EM radiation
source) or current (in
the case of current mode EM radiation source), and thus varying the resulting
intensity of the
EM radiation source 100. The processor contains an algorithm which is used to
compute the
command signal based on the angular position info from the encoder 208. A
block diagram
illustrating the method is shown in FIG. 19. In another embodiment, the EM
radiation source
intensity is switched between various predetermined levels such as low, med
and high, using
trigger based switch electronics, rather than a processor.
[0150] One possible limitation to this EM radiation modulation method is the
bandwidth of
the EM radiation source(s). Traditional black body sources such as those using
tungsten or
kanthal filaments have low bandwidths, and thus have generally been used for
steady state
application. However, some of today's black body sources are designed with
filament designs
that are capable of bandwidths up to 50 Hz or more. LED (Light Emitting Diode)
and SLED
(Super Luminescence Diode) light sources are capable of higher modulation
bandwidths.
[0151] In the case of black body sources, the bandwidth capability can be
increased by
employing more than one source, synchronized to provide a series of
modulations or pulses at a
higher frequency or duty cycle than obtainable with one source. Fig. 20
illustrates an
implementation of this concept where two EM radiation sources 100 are used
synchronically to
double the pulse frequency from what is obtainable by a single source. In one
embodiment, the
beams from the EM radiation sources 100 are combined through collecting and
collimating
optical elements and directed into the rotating filter assembly 104. In
another embodiment, the
filaments are packaged in a single collecting optics unit, such as a TO-8
package, with or
without an integrated collimating optics.
CA 02732978 2011-01-28
WO 2010/014277
PCT/US2009/041254
- 41 -
Multiple light sources and/or detectors covering multiple wavelength region
[0152] More than one EM radiation source 104 and/or EM radiation detector 116
may be
used to increase the spectral coverage of the system. Some applications
require analysis in
multiple wavelength regions that are not effectively covered by a single EM
radiation source
and detector. In continuous emission monitoring application, for example, the
system needs to
monitor CO, CO2 and NOx in streams containing high level of moisture. While CO
and CO2
are best analyzed in the mid-infrared region, NOx is best analyzed in the UV
region due to its
large interference with water vapor spectrum. There is no single EM radiation
source or
detector that can effectively cover the UV and IR regions simultaneously. A
wavelength
selective device of this invention may be combined with multiple EM radiation
sources and
detectors, providing a novel integrated system. Another example requiring
multiple source
arrangement is one where the EM radiation sources are LED or SLED types where
each only
covers a certain narrow band region. In such a case, multiple sources may used
with a single
detector element.
[0153] In one embodiment, the EM radiation beams from the sources 100 are
combined using
cold/hot mirrors 2104 with a long/short wavelength pass filter or beamsplitter
on the source and
detector side. The concept is illustrated in Fig. 21. Multiple of these "beam
combiner/splitter"
elements may be used for more than two sources and/or two detectors. In
another embodiment,
the EM radiation sources 100 are packaged as an integrated element, producing
a single EM
radiation beam output.
Stacked Filter Assemblies
[0154] Another configuration or feature of the rotating filter spectroscopic
system is that of
stacked filters or filter assemblies, where the two or more filters or filter
assemblies are stacked
along the rotation axis. Figure 25 illustrates the concept of the mechanical
layout. One or
more sources and detector may be used. When one source or detector is used,
the beam may be
CA 02732978 2011-01-28
WO 2010/014277
PCT/US2009/041254
- 42 -
split or combined using beam-splitters, beam-combiners, cold filters, hot
filters and other
equivalent functioning optics. The purpose of the stacked filters or filter
assemblies may
include: (i) increasing the number of wavelength bands that can be covered
with a single motor
assembly and/or (ii) covering multiple wavelength bands that need to use two
different sources
and/or detectors such as the UV and the IR region using a single motor
assembly.
Differential Measurement of Process or Reaction Monitoring
[0155] A differential measurement method may be used for monitoring certain
processes
such as filtration, purification, chemical and biological reaction where
comparison is made
between the input and the output streams. The concept is illustrated in Fig.
22. The process
input and output streams can be selected and sampled sequentially at
predetermined intervals
using a solenoid valve 2206, as depicted in Fig. 22. A monitoring system 2204
is used to
obtain spectrum from samples taken from the input and output streams. A
spectrum obtained
from one of the streams (input stream 2202 or output stream 2208) is stored as
the "zero" or
baseline spectrum. The spectrum obtained from the other stream is then
referenced to the zero
spectrum. In an absorption spectroscopy measurement, the absorption spectrum
A(k) is
obtained by applying the following mathematical function:
A(k) = logio1 Tinput(k) / Toutput 001
where Tmput and Toutput are the spectra of the input stream and the output
stream respectively,
and they may be interchanged in the above equation. The above method reduces
or even
eliminates potential drift or measurement instabilities due to instrumental
and/or environmental
changes. Furthermore, the method would reduce the effects of background
interferences.
[0156] As illustrated in Fig. 28, the spectroscopic system 2801 may include a
computer or
may otherwise share input and output with a computer 2802 (e.g., a computer
internal or
external to the spectroscopic system), the computer including software for
digitizing, receiving,
storing, and or processing data corresponding to the detected electromagnetic
radiation and/or
= CA 02732978 2015-06-25
-43 -
signals created by such detected electromagnetic radiation. The computer may
also include a
keyboard or other portal for user input, and a screen for display of data to
the user. The
computer may include software for process control, data acquisition, data
processing, and/or
output representation. The spectroscopic system may include a wireless system
for acquisition
of data and/or system control. For example, the wireless system may allow
wireless data
transfer from and/or to a computer, allowing wireless input and/or output
(and/or system
control) by/to a user via a user interface connected to the computer, such as
a keyboard and/or
display screen.
Equivalents
[0157] The scope of the claims should not be limited by the preferred
embodiments set forth
in the examples, but should, be given the broadest interpretation consistent
with the description
as a whole.