Note: Descriptions are shown in the official language in which they were submitted.
CA 02733296 2011-02-04
WO 2010/017001 PCT/US2009/050570
USE OF FOCUSED LIGHT SCATTERING TECHNIQUES
IN BIOLOGICAL APPLICATIONS
FIELD OF THE INVENTION
The invention relates generally to methods of using optical sensing of
biological
particles suspended in a liquid medium, and, more particularly to optical
sensing of particles
to determine size and/or number of particles. The methods are useful in
screening and
optimizing drug candidates, evaluating the efficacy and dosage levels of such
drugs, and in
developing approaches for personalized medicine.
BACKGROUND OF THE INVENTION
It is often essential to characterize biological particles by their size,
surface condition,
states of activation of any surface receptors, distribution, and the like.
This information is
useful in cell-based assays and other processes that rely upon those
characteristics.
Additionally, it is useful in certain diagnostic applications to detect known
changes of the
surface of a biological particle. Accordingly, it can be desirable to detect
the surface and
monitor changes to the surface in an efficient and accurate manner.
"Electrophoretic Quasi-Elastic Light Scattering" (EQELS) is one method for
characterizing biological particles. This method uses electrophoresis that is
dependent on the
particle's surface charge density to identify and characterize suspended
biological particles.
EQELS uses cells placed in an electric field, where the surface charge of the
particle will
determine how that particle moves in the electric field. Monitoring the
electrophoretic
mobility of the cells provides information useful in distinguishing among
different particles
in the field. One can screen and optimize drug candidates which interact with
the biological
particles by comparing the spectra of the particles alone, or bound to the
drug candidates.
Coulter counters can also be used to characterize biological particles. These
devices
are primarily used to count and size cells and other biological particles. The
Coulter Counter
works by drawing fluid containing the biological particle through a small
opening located
within a current between two electrodes. As the fluid is drawn through the
opening, the
CA 02733296 2011-02-04
WO 2010/017001 PCT/US2009/050570
biological particles flow through the current and measurably displace a
portion of the current.
The measurable displacement is translated to a pulse that is digitally
processed by the Coulter
Counter and translated to allow one to characterize the size and number of
biological particles
in the fluid.
Flow cytometry can also be used to characterize biological particles. Flow
cytometry
uses a beam of light, such as a laser, trained on a fluid to characterize,
count and optionally
sort particles in the fluid. The fluid is focused into a stream, and detectors
at the intersection
of the light and the fluid stream determine scatter - both forward and side.
Additionally, a
fluorescent detector may be present to detect fluorescent or fluorescently-
tagged particles.
One can determine various physical and chemical characteristics of each
individual particle
by analyzing the detected pattern.
These methods are useful in detecting and characterizing microparticles,
including
determinating the number of particles, density within a fluid medium, size,
and surface
characteristics of the particle, confirming binding, or lack thereof, and the
like. The
microparticles are generally in the size of between 0.1 m and 100 m.
However,
developments in technology demand the characterization of smaller biological
particles,
including, but not limited to, nanoparticles.
The size of biological particles that can be analyzed using currently
available
technology is limited. Accordingly, there is a need for processes for
characterizing biological
particles that can detect biological particles of varying sizes, including
particles smaller than
microparticles, and which can characterize the detected particles with
accuracy, quantify the
particles and/or monitor the particles. The present invention provides such
processes.
-2-
CA 02733296 2011-02-04
WO 2010/017001 PCT/US2009/050570
SUMMARY OF THE INVENTION
The present invention relates to methods of detecting sizes and distributions
of
biological particles using focused light scattering techniques, and using this
information to
diagnose disease, identify therapeutic agents, and obtain other useful
information about
biological particles and/or therapeutic agents in a sample medium.
Representative particle
sizes that can be measured range from between about 0.1 m to about 100 m,
more typically
in the range of between about 0.1 and about 20 m.
Using focused light scattering techniques, significantly smaller particles can
be
detected than if techniques such as EQELS, flow cytometry, and other
conventional methods
of measuring biological particles are used. Mathematical algorithms described
herein can
enable one to not only detect small particles, but also to determine a range
of particle sizes,
relative quantities of such particles, and shapes of the particles.
Briefly, focused light scattering techniques involve passing a sample media
through a
particular path, where a focused beam of light passes through the sample
media. The focused
beam is of a size such that a particle in the size range of 0.1 to 10 m is
sufficient to block all
of the beam, or a significant enough part of the beam, so that the particle
size can be
measured.
When there are no particles passing through the pathway of the beam, the beam
passes through the media and onto a detector. When a particle, or part of a
particle, passes
through the beam, the beam is deflected. A diminished amount of light, or no
light at all,
then reaches the detector, thus indicating that a particle (or part of a
particle) has interacted
with the beam. The amount of diminished light reaching the detector provides
information
about the size of the particle. This is repeated as particles in the sample
medium pass through
the beam, for example, until the sample medium has entirely passed through the
beam.
Appropriate algorithms then take the information, and the output is a spectrum
showing the
particle size and particle distribution.
Cells are one type of biological particle that can be detected. The method can
be used
to determine the presence or absence of a specific type of cell in a given
solution. For
example, a sample of blood, urine, spinal fluid, and the like can be evaluated
for the presence
-3-
CA 02733296 2011-02-04
WO 2010/017001 PCT/US2009/050570
or absence of bacteria, fungi, viruses, and the like. The particle size, and,
optionally, particle
shape, can also provide information about the specific type of bacteria, fungi
or virus.
In one embodiment, suitable information on the particles can be obtained
simply by
obtaining a spectra using focused light scattering of a sample medium, wherein
the particle
size and distribution provides sufficient information about the presence or
absence of certain
biological particles present in the sample medium. For example, specific
bacteria, fungi, or
viruses can be identified solely on the basis of their size, and liposomal
suspensions can be
evaluated for agglomeration solely on the basis of the size of the
agglomerated particles.
In other embodiments, where there is an interest in determining whether a
particular
agent forms a complex with a particular type of biological particle,
additional information
may be required. That is, one can determine the presence or absence of a
particular cell type,
or an ejected particle from a type of cell, by forming a complex between a)
the cell or ejected
particle and b) an active agent conjugated to a microparticle or nanoparticle
("conjugate").
The complex has a larger particle size than the cell, the ejected particle, or
the conjugate, so
the focused light scattering technique can determine whether a complex was
formed.
In some aspects of this embodiment, the biological particle is a cell that
expresses a
specific receptor, and the techniques permit high throughput screening of
putative therapeutic
agents that bind to the receptor.
In other aspects of this embodiment, the biological particle comprises cells
from a
patient, for example, blood cells or cancer cells, and these cells are
incubated with putative
therapeutic agents. Agents that bind to the cells can potentially be useful as
therapeutic
agents for the patient. Accordingly, this embodiment provides personalized
medicine
approaches.
In some of these embodiments, two spectra are taken. The first is taken on the
sample
media before complex formation, and the second is taken after complex
formation, so one can
look for the difference in particle size and distribution. However, in other
embodiments,
where the complex has a known particle size, and all that is required is to
show that the
complex formed, one can simply incubate the biological particle and the
substance which
may or may not form a complex with the biological particle, and use focused
light scattering
techniques to determine whether the complex was formed.
-4-
CA 02733296 2011-02-04
WO 2010/017001 PCT/US2009/050570
If the sample medium, with the biological particle and the conjugate both
present, is
passed repeatedly through the focused light scattering detector over a period
of time, the
kinetics of complex formation can be observed.
If the sample medium is scanned with the biological particle and the conjugate
both
present, but with different scans taken with differing concentrations of the
biological particle
and/or conjugate, one can determine additional information, relative to
binding affinity,
minimum inhibitory concentration, and the like.
If the sample medium includes cells of different sizes, expressing different
receptors,
then information on the selectivity of a putative therapeutic agent for one
receptor over the
other can be obtained.
If the agent binding to the cells results in cell rupture, then the efficacy
of the active
agent can be represented by a decrease in particle (cell) density in the
sample medium over
time.
Thus, complex formation provides useful information about the biological
particle, or
the agent bound to the microparticle or nanoparticle. For example, where the
cell is a known
cell, one can screen putative therapeutic agents for their ability to bind to
the cell. Where the
therapeutic agent is a known therapeutic agent, one can determine whether a
particular cell
binds to the therapeutic agent. This information can be useful in identifying
personalized
medical approaches for a patient.
For example, it is critical to determine in a timely manner whether a cancer
patient
will respond to a particular therapy. That is, the tumors can grow and
metastasize before the
physician determines that the patient does not respond to the therapy.
In another example, a small percentage of patients in need of a drug like
clopidogrel
bisulfate are unable to use clopidogrel bisulfate, because their blood cells
do not bind to it.
While one could screen the blood cells for a particular genetic variation,
genetic testing is
expensive and time consuming. Here, the patient's blood cells can be incubated
with
clopidogrel bisulfate, and one can quickly determine whether the patient will
respond to this
type of therapy. Since platelets will clump if they do not bind to and
interact with the
clopidogrel bisulfate, the clopidogrel bisulfate need not be conjugated to a
microparticle.
That is, one can determine whether a patient will respond to treatment by
looking for platelet
-5-
CA 02733296 2011-02-04
WO 2010/017001 PCT/US2009/050570
aggregation. However, if the biological particle of interest will not
significantly change its
size (i.e., gain or lose size) during the screening assay, then it may be
necessary to conjugate
a putative therapeutic agent to a microparticle.
In one embodiment, the microparticles have a particle size in the range of
between
about 0.1 and 10 m, and ideally have a relatively consistent amount of active
agent bound to
them. One way to produce particles with a relatively consistent amount of
active agent bound
to them is to use dendrimers, where the dendrimers include a known quantity of
the active
agent. Another way is to produce polymer particles with a) a relatively narrow
size
distribution, and b) a relatively consistent amount of protected functional
groups, so that after
the polymers are produced, the protecting groups can be removed, and the
functional groups
used to conjugate the polymer particles to an active agent.
The active agent can be conjugated with the particle in such a way that the
portion of
the active agent that is known to be active (i.e., binds a receptor) is not
significantly sterically
hindered by its conjugation with the particle. In some embodiments, this will
involve
preparing an analogue of the active agent which includes a further functional
group which
can be attached to the particle.
In one embodiment, metallic particles, such as gold particles, are used.
Because these
particles scatter a significant amount of light, they can be conjugated with a
specific active
agent, and used to identify even small molecules that bind to the agent. That
is, the amount
of light that the particle scatters is sufficiently large that the binding of
the agent to the
molecule of interest can be measured, even though the molecule is not within
the size range
of biological particles that can be measured. Means for conjugating active
agents to metallic
particles are known to those of skill in the art.
BRIEF DESCRIPTION OF THE DRAWINGS
Fig. 1 is a simplified block diagram of the LE-type sensor of the present
invention,
hereinafter the "new LE-type sensor," using a relatively narrow, focused light
beam to
illuminate particles flowing in a relatively thin flow channel;
-6-
CA 02733296 2011-02-04
WO 2010/017001 PCT/US2009/050570
Figure 2 is a simplified block diagram of the LS-type sensor described herein,
using a
relatively narrow, focused light beam to illuminate particles flowing in a
relatively thin flow
channel.
Figure 3 is a block diagram showing a further embodiment of the light
scattering
device used in the analytical methods described herein.
Figures 4-7 are illustrative graphs showing a group of biological particles,
and an
antibody coupled to a microparticle, where the antibody/microparticle
conjugate binds to
biological particles. Time zero is shown in Figure 3, and as the conjugate
binds to the
biological particles, the progression of events, including lowering of the
concentration of the
biological particle and the antibody/microparticle conjugate, and the increase
of a peak
showing the biological particle linked to the conjugate, is shown in Figures 4-
7.
DETAILED DESCRIPTION OF THE INVENTION
The present invention relates to methods for using focused light scattering
techniques
in biological applications. Focused light scattering techniques provide one
with the ability to
analyze a fluid and determine the size and number of particles in a given
sample and to,
optionally, further characterize the particles in the sample. Where the
particle is a biological
particle, this information can be used to diagnose disease, to conduct high
throughput
bioassays, and to obtain information for personalized medical treatment.
The methods described herein provide numerous advantages over the previous
methods in the art, including the ability to identify and characterize smaller
particles, identify
particles and determine particle size, number or other characteristics without
using
fluorescent antibodies or expensive flow cytometry, improving the
identification of the initial
onset of the change in voltage due, which would improve resolution of the
generated spectra,
control of particle shearing, and improved information regarding particle
shape.
The methods also provide numerous characteristics of the particles being
evaluated,
including, but not limited to: identifying biological particles and
distinguishing them from
various cells, quantifying particles, identifying surface epitopes,
identifying particle shape,
and correlating this information with platelet activation, thrombin
production, disease states,
and the efficacy of putative therapeutic agents.
-7-
CA 02733296 2011-02-04
WO 2010/017001 PCT/US2009/050570
Definitions:
The term "cell" as used herein refers to any type of cell, including human
cells,
animal cells (such as swine cells, rodent cells, canine cells, bovine cells,
ovine cells and/or
equestrian cells) cloned cells, plant cells, or the like. The cells may be
blood cells, cultured
cells, biopsied cells, or cells that are fixed with a preservative. The cells
can be nucleated,
such as white blood cells or suspended endothelial cells, or non-nucleated,
such as platelets or
red blood cells.
The term "focused light scattering" refers to a method for sensing single
particles,
suspended in a solution, when the solution is passed through a focused beam.
When the
beam passes through the solution without being scattered by a particle, the
beam passes on to
a photodetector and the intensity is measured. When the beam is scattered , in
whole or in
part, by a particle, the intensity of the beam hitting the photodetector is
altered. The particle
size and concentration can be calculated, for example, using light-extinction,
light-scattering
detection, or both.
A "focused light scattering device" is a multi-particle optical sensor, which
has high
sensitivity and responds to relatively concentrated suspensions, uses a
relatively narrow light
beam to illuminate an optical sensing zone non-uniformly.
As used herein "particles" are small fragments or completely intact biological
cells,
and related to a living organism when referred to as "biological particles."
Intact cells may
range in size from about 1 micron to 20 microns. Aggregates of intact cells or
fragments of
cells may range in size from 2 microns to 100 microns. "Microparticles" are
fragments of
biological cells or particles that generally range in size from about 0.1 m
to about 0.8 m,
generally 0.1 - 20 m. Examples include, but are not limited to blood cells,
platelets (1-3
micron), cancer cells (5 -15 micron), red blood cells (-7 m), white blood
cells (-5-10 m),
bacteria (-0.5-1 m), tumors, granulocytes, monocytes, neutrophils,
lymphocytes, endothelial
cells, stem cells, viruses, and fungi.
"Light extinction" as used herein is a measurement of the absorption and/or
scattering of light in an electromagnetic field by particles as they pass
through the field. As a
particle passes through a field, there is a momentary reduction in the
transmitted light
intensity due to the light refraction, absorption and/or scattering.
Measurement of light
-8-
CA 02733296 2011-02-04
WO 2010/017001 PCT/US2009/050570
extinction by the particles provides additional information regarding the
characteristics of the
particles. A light extinction spectrum can be generated for each particle. An
exemplary light
extinction system is illustrated in Fig. 1-3.
"Light scattering" occurs when there is a momentary change in the intensity of
the
incident light caused by the interaction of the incident photons with the
particle. In the case
on focused scattering device, the intensity of the scattered light reaching
the detector is
proportional to the size of the particle. Thus, when the particles being
characterized are
biological particles, the method of light scattering will involve measuring
voltage at the
detector this will be proportional to the particle size. Exemplary focused
light scattering
systems for detecting biological particles are shown in Figures 1-3.
"Nanoparticles" as used herein are particles or biological particles that are
generally
smaller than 0.1 m in size. Because of their small size, nanoparticles have a
very high
surface area to volume ratio. Accordingly, nanoparticles often possess unique
physical
characteristics. The present invention provides a way to both quantify and
monitor
nanoparticles, in particular, cellular nanoparticles, which are often believed
to be responsible
for initiating further biochemical processes in living organisms.
-9-
CA 02733296 2011-02-04
WO 2010/017001 PCT/US2009/050570
1. Focused Light Scattering Devices and Algorithms for Measuring Particle Size
and
Shape
The principal defining characteristic of the focused light scattering method
described
in U.S. Patent Publication No. 20070010974, the contents of which are hereby
incorporated
by reference, is not simply a significant reduction in the size of the
illuminated area, A0,
resulting in a significant reduction in Vosz and improvement in sensitivity.
Rather, it
concerns the nature of the illuminating beam and the resulting OSZ thereby
defined.
An exemplary apparatus useful for performing the methods described herein is
disclosed in U.S. Patent Application Publication No. 20040011975, the contents
of which are
hereby incorporated by reference in its entirety. The apparatus is described
therein is useful
in performing particle analysis using focused light scattering techniques.
However, as
described herein, other similar apparatus can be employed, including detectors
for focused
light scattering and/or light extinction.
The term "focused light scattering" refers to a method for sensing single
particles,
suspended in a solution, when the solution is passed through a focused beam.
When the
beam passes through the solution without being scattered by a particle, the
beam passes on to
a photodetector and the intensity is measured. When the beam is scattered, in
whole or in
part, by a particle, the intensity of the beam hitting the photodetector is
altered. The particle
size and concentration can be calculated, for example, using light-extinction,
light-scattering
detection, or both.
A "focused light scattering device" is a single-particle optical sensor, which
has high
sensitivity and responds to relatively concentrated suspensions, uses a
relatively narrow light
beam to illuminate an optical sensing zone non-uniformly. It differs from
conventional SPOS
devices in that it can handle more concentrated solutions and smaller particle
sizes.
In use, a solution including suspended particles passes through a zone. The
zone is
smaller than the flow channel, so that the sensor responds to only a fraction
of the total
number of particles flowing through the channel, detecting a statistically
significant number
of particles of any relevant diameter.
Because different particle trajectories flow through different parts of the
zone
illuminated at different intensities, it is necessary to deconvolute the
result. Two methods of
deconvolution can be used: modified matrix inversion or successive
subtraction. Both
-10-
CA 02733296 2011-02-04
WO 2010/017001 PCT/US2009/050570
methods use a few basis vectors measured empirically or computed from a
theoretical model,
and the remaining basis vectors are derived from these few. The sensor is
compensated for
turbidity.
The sensor apparatus for single-particle optical sizing of particles in a
fluid
suspension typically includes a means for establishing flow of the suspension
through a
physically well-defined measurement flow channel. There is also an
illumination means for
effectively directing a relatively narrow beam of light, having an axis,
through the
measurement flow channel to form an optical sensing zone within the
measurement flow
channel. The beam of light and the optical sensing zone are of such size
relative to the size of
the measurement flow channel that the sensor apparatus responds to only a
fraction of the
total number of particles flowing through the measurement flow channel. In
this manner, the
sensor apparatus responds effectively to a relatively concentrated fluid
suspension.
The beam has a maximum intensity portion and a continuum of lesser intensities
for
positions spaced transverse to the axis from the maximum intensity portion. In
this manner,
some of the particles have trajectories through the maximum intensity portion,
others of the
particles have trajectories through the lesser intensity positions, and still
others of the
particles may have trajectories outside the zone. Typically, the maximum
intensity portion of
the beam is in a central portion of the beam.
The device also includes a detector means for photo-detecting light from the
zone to
provide pulse height signals. These signals each respond to a particle flowing
through the
zone. The pulse height signals are functions of the sizes and trajectories of
detected particles.
Particles of a given size provide a maximum pulse height signal when flowing
through the
maximum intensity portion, and lesser pulse height signals when flowing
through the lesser
intensity positions of the zone. The pulse height signals, collectively, form
a pulse height
distribution PHD.
The device further includes a means for mathematically deconvoluting the pulse
height distribution to extract a particle size distribution of the PSD
particles in the fluid
suspension. The sensor apparatus can detect a statistically significant number
of particles of
any given diameter or range of diameters that are relevant to the fluid
suspension.
In one embodiment, the measurement flow channel has a thickness dimension
axially
of the beam of light, a width dimension transverse to the beam, and a flow
direction
substantially perpendicular to the thickness and width dimensions. The beam is
narrower
than the measurement flow channel in the width direction. The beam can be
focused with a
depth of field which is substantially larger than the thickness dimension, and
the beam
-11-
CA 02733296 2011-02-04
WO 2010/017001 PCT/US2009/050570
substantially has an effective width which does not vary substantially over
the thickness
dimension.
In another embodiment, the beam has an effective width between opposing
positions
transverse to the axis in the beam, at which the lesser intensities have
fallen to a given
fraction of the maximum intensity. The effective width is chosen so that the
largest particles
of interest can be effectively sized. The given fraction can be, for example,
1/e2 of the
maximum intensity, where e is the base of the natural system of logarithms,
and the effective
width is substantially one half the size of the largest particle to be sized.
The light beam can have, for example, a Gaussian intensity profile, a circular
cross-
section, or an elliptical cross-section being wider in a direction transverse
to particle flow.
The detector means can be include a light extinction-type detector, and can be
a
combination of detectors, for example, a light-extinction detector type and a
light-scattering
type detector. The light-scattering type detector means can include means for
passing a
portion of scattered light from the zone through a mask to select light
scattered between a
first and a second angle to the beam and a means for directing a portion of
the light
transmitted through the zone to a light-extinction type detector.
The detector means can include a mirror for deflecting a portion of the light
from the
optical-sensing zone to the light-extinction detector. The illuminating means
can include a
light source and optical fiber means for conveying light from the light source
to the optical
sensing zone, and projecting the light through the zone.
The detector means can also include an optical fiber means for conveying the
light
passing through the optical sensing zone to the light-extinction type
detector. The detector
means can also include means for passing a portion of the light scattered from
the zone
through a mask, to select light scattered between a first and second angle to
the beam, and an
optical fiber means for conveying the portion of the light to a light-
scattering type detector.
The detector means can also include a light-scattering detector.
In one embodiment, the illumination means provides two light beams directed
through
a pair of optical sensing zones positioned within the measuring flow channel,
and each beam
has an effective width determined by a desired maximum particle size.
The detector means can include a light-scattering detector and a means for
passing
light scattered from the zone through a mask means. The mask means can include
a plurality
of masks and means for selecting one of the masks for passing the light
scattered from the
zone, each mask defining different angles between which the light is
scattered. The masks
-12-
CA 02733296 2011-02-04
WO 2010/017001 PCT/US2009/050570
can be located on a rotatable wheel, and a mask can be selected by rotating
the wheel to a
desired position.
The illuminating means can project a relatively wide collimated beam through
the
optical sensing zone, and can include an acceptance aperture to capture only
those light rays
that closely surround the axis of the beam. This reduces the effective width
of the beam to a
width in a direction transverse to the axis of the light beam which is
substantially one-half the
size of the largest particle to be sized. The illuminating means can also
include a means for
coupling the light rays to the detector means. This can be, for example, an
optical fiber
means.
In one aspect of the invention, a statistically significant number of
particles of each
relevant size flow through all portions and positions of the zone.
In another aspect of the invention, the fluid suspension is relatively
concentrated and
the apparatus further comprises means to compensate for turbidity of the
suspension. In this
aspect, the detector means can operate on a light extinction principle, and
provide a signal
having a baseline voltage level. The pulse height signals appear as downwardly
extending
pulses from the baseline voltage level, and the means for compensation for
turbidity of the
suspension can include means to sense the baseline voltage level and
automatically increase
the level to approximately the baseline voltage level present in the absence
of turbidity in the
suspension. The detector means can operate on a light extinction principle,
and provide a
signal having a baseline voltage level, wherein the means to compensate for
turbidity can
include a computer means for correcting the pulse height signals in response
to the ratio of
the baseline voltage level when the fluid suspension is not turbid, to the
baseline voltage level
for the turbid fluid suspension.
The detector means can also operate on a light extinction principle and
provide a
signal having a baseline voltage level, wherein the means to compensate for
turbidity
includes a means to adjust the intensity of the beam of light by increasing
the amount of light
produced by the illuminating means in response to the ratio of the baseline
voltage level
when the fluid suspension is not turbid, to the baseline voltage level for the
turbid fluid
suspension.
The particle trajectories can be substantially uniformly distributed across
the width of
the measurement flow channel.
The means for deconvoluting the pulse height distribution can include basis
vectors,
each corresponding to a particular particle size, and a source vector
representing a measured
pulse height distribution for a fluid suspension as detected by the detector
means. There can
-13-
CA 02733296 2011-02-04
WO 2010/017001 PCT/US2009/050570
also be a means using a deconvolution algorithm to derive the particle size
distribution from
the pulse height distribution. At least some of the basis vectors can have
values based upon
measurements of particles of known size. Some of the basis vectors can also
have values
based upon measurements of particles of known size and others of the basis
vectors can be
computed from the sum of the basis vectors by interpolation and/or
extrapolation.
The basis vectors can be computed, and the basis vectors can be column basis
vectors
of a matrix, where the means using a deconvolution algorithm performs matrix
inversion and
vector multiplication, or the means using a deconvolution algorithm can
perform successive
subtraction.
The means using a deconvolution algorithm can provide a deconvoluted pulse
height
distribution dPHD, and the apparatus further comprises means providing a
calibration curve
of the relationship of pulse height and diameter, and means using the
calibration curve to
transform each deconvoluted pulse height value in the dPHD into a unique
particle diameter
associated with this pulse height value. This can yield a "raw" particle size
distribution PSD.
There can also be a means for converting the raw PSD into a final PSD by
renormalizing the
raw PSD by multiplying by the value 1/PHId, where PHId is the fraction of
particles actually
detected by the device for particles of each size.
The particle trajectories can be distributed non-uniformly across the width of
the
measurement flow channel, and the basis vectors can be based upon the response
of particles
of known size flowing through the measurement flow channel with the same non-
uniform
distribution of particle trajectories as the fluid suspension.
The sensor apparatus may respond only to a fraction of the total number of
particles
flowing through the measurement flow channel.
One can prepare a matrix for deconvoluting pulse height distributions derived
from
particles of unknown size flowing along different trajectories through a non-
uniform light
field of a single-particle optical sizing device. This can enable one to size
particles in a fluid
suspension. To do this, one can determine the value of at least one empirical
basis vector for
the matrix by measuring the response of particles of known size flowing
through the single-
particle optical sizing device. Then, one can compute other basis vectors for
the matrix
corresponding to particles of other sizes, by interpolating and/or
extrapolating the other basis
vectors from the empirical basis vector.
One can also determine the value of additional empirical basis vectors for the
matrix
by measuring the response of particles of known sizes flowing through the
single-particle
optical sizing device, and computing the other basis vectors for the matrix
corresponding to
-14-
CA 02733296 2011-02-04
WO 2010/017001 PCT/US2009/050570
particles of other sizes from the at least one empirical basis vector and the
additional
empirical basis vectors.
Another way to prepare a matrix for deconvoluting pulse height distributions
derived
from particles of unknown size flowing along different trajectories through a
non-uniform
light field of a single-particle optical sizing device for sizing particles in
a fluid suspension
involves determining the value of at least one computed basis vector
corresponding to
particles of at least one size for the matrix. One can compute other basis
vectors for the
matrix corresponding to particles of other sizes from computed basis vectors.
Also disclosed is a method of deconvoluting a pulse height distribution
derived from
particles of unknown size flowing along different trajectories through a non-
uniform light
field of a single-particle optical sizing device for sizing particles in a
fluid suspension. The
method involves setting up a matrix having a plurality of columns, each
containing a basis
vector comprising a pulse height distribution of particles of a known size
corresponding to
the response of a photo-detector of the device to the particles of known size.
Each successive
column contains a basis vector for particles of successively larger sizes. The
matrix also has
a like plurality of rows, each corresponding to a successive pulse height
channel, each
channel including a range of pulse heights, with successive rows corresponding
to
successively larger pulse heights, and with each column having a maximum count
pulse
height value at a location for a row which relates to a pulse height
corresponding to the
particle of known size associated with the column. The maximum count pulse
height values
for successive columns are arranged on a diagonal of the matrix. The matrix is
modified by
setting all terms corresponding to pulse height values greater than the
maximum count pulse
height value in a column to zero. A deconvolution algorithm is used to perform
matrix
inversion and vector multiplication of the pulse height distribution and the
matrix as
modified.
Before the modifying step, one can renormalize the values of the basis vectors
in the
columns by setting the maximum count pulse height value to equal 1.0 and all
other count
pulse height values in the column to a value maintaining the same
proportionate value to 1.0
that the other count pulse height values had to the maximum count pulse height
value of the
column.
The response of the photo-detection to the particles of known size is
developed
empirically for some of the basis vectors by sending particles of the
substantially known size
through the device and providing a response by the device to the particles of
known size. The
response to the photo-detector for the remaining basis vectors can be computed
by
-15-
CA 02733296 2011-02-04
WO 2010/017001 PCT/US2009/050570
interpolating and/or extrapolating the response for the remaining basis
vectors from the some
of basis vectors.
The response of the photo-detector to the particles of known size can be
computed for
some of the basis vectors and the response to the photo-detector for the
remaining basis
vectors can be computed by interpolating and/or extrapolating the response
from the some
basis vectors.
A pulse height distribution ("PHD") can be derived from particles of unknown
size
flowing along different trajectories through a non-uniform light field of a
single-particle
optical sizing device for sizing particles in a fluid suspension can be
deconvoluted by setting
up a matrix having a plurality of columns. Each column includes a basis vector
comprising a
pulse height distribution of particles of a substantially known size
corresponding to the
response of a photo-detector of the device to the particles of known size, and
each successive
column contains a basis vector for particles of successively larger sizes. The
matrix can also
include a like plurality of rows, each corresponding to a successive pulse
height channel, each
channel including a range of pulse heights, successive rows corresponding to
successively
larger pulse heights, each column having a maximum count pulse height value at
a location
for a row which relates to a pulse height corresponding to the particle of
known size
associates with the column. The maximum count pulse height values for
successive columns
can be arranged on a diagonal of the matrix. A successive subtraction
algorithm can be
implemented, by starting with the basis vector with its maximum count value in
the largest
row number; scaling a column basis vector by a factor corresponding to the
value of the row
in the PHD that matches the column number; subtracting the scaled basis vector
from the
PHD to form an element of a deconvoluted PHD (dPHD), leaving an intermediate
PHD
vector with a smaller number of total particles; and repeating this process
using the remaining
basis vectors until the entire PHD has been consumed and all the elements of
the
deconvoluted dPHD have been formed.
A single-particle optical sizing sensor for sizing particles in a relatively
concentrated
fluid suspension sample for turbidity of the suspension sample can be
compensated using a
sensor operating on a light extinction principle whereby a photo-detector
produces signal
VLE(t) having a baseline voltage level and a response to blockage of light by
a particle as a
downwardly extending pulse from the baseline voltage level. The compensation
method
involves passing a non-turbid suspension through the sensor; measuring a
baseline voltage
level Vo produced in response to the non-turbid suspension; passing the
relatively
concentrated suspension sample through the sensor; measuring a baseline
voltage V0T
-16-
CA 02733296 2011-02-04
WO 2010/017001 PCT/US2009/050570
produced in response to the relatively concentrated suspension sample,
calculating the ratio 1
G = V 0 V 0 T ;and adjusting the sensor in response to G to compensate for the
turbidity
when the relatively concentrated suspension sample passes through the sensor.
The baseline voltage VoT can effectively be subtracted from the signal VLE(t),
the
remaining signal can be inverted to produce a pulse height signal 2 V LE T ( t
), and an
adjustable gain amplifying means can be used to amplify the pulse height
signal 3 V LE T ( t
). The adjustable gain amplifying means can be controlled by the ratio G to
provide a
compensated pulse height signal AVLE(t).
The signal VLE(t) produced by the sensor in response to the relatively
concentrated
suspension sample can be amplified by adjustable gain amplifier means, the
gain of which is
controlled by the ratio G to provide a compensated signal VLE(t) having a
compensated
baseline voltage Vo, subtracting the baseline voltage Vo from the compensated
signal VLE(t),
and inverting the remaining signal to produce compensated pulse height signal
AVLE(t).
In one embodiment, the single-particle optical sizing sensor comprises a light
source
producing a light beam of adjustable intensity, wherein the intensity is
increased in response
to the ratio G to compensate for the turbidity.
Particles in a fluid suspension can also be optically sized by establishing a
flow of the
suspension through a physically well-defined measurement flow channel of a
single-particle
optical sizing sensor apparatus wherein a beam of light, having an axis, is
directed through
the measurement flow channel to form an optical sensing zone within the
measurement flow
channel. The beam of light and the optical sensing zone are ideally of such
size relative to
the size of the measurement flow channel that the sensor apparatus responds to
only a
fraction of the total number of particles flowing through the measurement flow
channel. The
sensor apparatus can respond effectively to a relatively concentrated fluid
suspension. The
beam can have a maximum intensity portion in the beam and a continuum of
lesser intensities
for positions in the beam spaced transversely from the axis, whereby some of
the particles
have a trajectory through the maximum intensity portion, others of the
particles have
trajectories through the lesser intensity positions, and still others of the
particles may have
trajectories outside the zone. Light from the zone can be detected to provide
pulse height
signals, each responsive to a particle flowing through the zone. The pulse
height signals are
functions of the sizes and trajectories of detected particles, and the pulse
height signals
collectively form a pulse height distribution PHD. The PDH can be
mathematically
deconvoluted and processed to extract from the PHD a particle size
distribution PSD of the
particles in the fluid suspension.
-17-
CA 02733296 2011-02-04
WO 2010/017001 PCT/US2009/050570
The step of mathematically deconvoluting the PHD can involve determining the
value
of at least one empirical basis vector by measuring the response to particles
of known size
flowing through the single-particle optical sizing device. Other basis vectors
corresponding
to particles of other sizes can be computed by interpolating and/or
extrapolating the other
basis vectors from the empirical basis vector.
The value of additional empirical basis vectors for particles of known sizes
flowing
through the single-particle optical sizing device can be determined; and the
other basis
vectors for the matrix corresponding to particles of other sizes can be
calculated by
interpolating and/or extrapolating the other basis vectors from at least one
empirical basis
vector and the additional empirical basis vectors. The method can further
involve
determining the value of at least one computed basis vector corresponding to
particles of at
least one size. Other basis vectors corresponding to particles of other sizes
can also be
computed by interpolating and/or extrapolating the other basis vectors from
computed basis
vectors.
The step of deconvoluting and processing the PHD can involve setting up a
matrix
having a plurality of columns, each containing a basis vector comprising a
pulse height
distribution of particles of a known size corresponding to the response of a
photo-detector of
the device to the particles of known size, each successive column containing a
basis vector
for particles of successively larger sizes. The matrix can also have a like
plurality of rows,
each corresponding to a successive pulse height channel, each channel
including a range of
pulse heights, successive rows corresponding to successively larger pulse
heights, each
column having a maximum count pulse height value at a location for a row which
relates to
pulse heights corresponding to the particle of known size associated with the
column. The
maximum count pulse height values for successive columns can be arranged on a
diagonal of
the matrix. The matrix can be modified by setting all terms corresponding to
pulse height
values greater than the maximum count pulse height value in a column to zero.
A
deconvolution algorithm can be used to perform matrix inversion and vector
multiplication of
the pulse height distribution and the inverted matrix as modified. The
response of the photo-
detector to the particles of known size can be developed empirically for some
of the basis
vectors by directing a flow of particles of the known size through the device
and providing a
response by the device to the particles of known size. The response to the
photo-detector for
the remaining basis vectors can be calculated by interpolating and/or
extrapolating the
response for the remaining basis vectors from the some of basis vectors.
-18-
CA 02733296 2011-02-04
WO 2010/017001 PCT/US2009/050570
The step of mathematically deconvoluting the PHD can also involve using a
deconvolution algorithm to provide a deconvoluted pulse height distribution
dPHD. The
method can further involve providing a calibration curve of the relationship
of pulse height
and diameter, and using the calibration curve to translate each deconvoluted
pulse height
value in the dPHD into a unique particle diameter associated with this pulse
height value
yielding a "raw" particle size distribution in PSD. The raw PSD can be
converted into a final
PSD by renormalizing the raw PSD by multiplying by the value 1/PHId, where
PHId is the
fraction of particles actually detected by the device for particles of each
size.
Representative focused light scattering devices are shown in Figures 1-3.
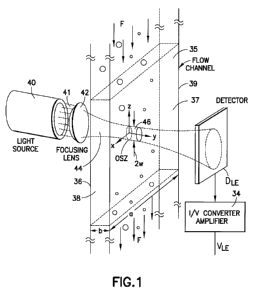
As is shown in FIG. 1, there are two important features inherent in the
optical design.
First, the incident beam alone (in conjunction with the front and back windows
36 and 37 of
the measurement flow channel 35) defines the OSZ. The side walls 38 and 39
that confine the
fluid-particle suspension along the x-axis are no longer of any consequence
with respect to
definition of the OSZ. Second, the physical volume associated with the OSZ can
no longer be
described by a single value; rather, it now depends on the size of the
particles being
measured.
The approach, shown schematically in FIG. 1, is to illuminate measurement flow
channel 35 with a light beam 41 from a laser light source 40 which is focused
by a lens 42 to
form a beam 44 of relatively narrow cross section--i.e., smaller than. a
typical illuminated
width, a, of the flow cell in a conventional LE-type sensor. The resulting OSZ
is therefore
defined approximately by a "pencil" beam of light 46, together with the front
and back
windows of the flow cell, separated by dimension "b." The schematic diagram in
FIG. 1
provides a simplified picture of the OSZ defined by focused light beam 46.
First, the region
of illumination that comprises the OSZ is not sharply defined, as implied by
the
approximately cylindrical zone indicated in FIG. 1. Rather, the outer boundary
of the OSZ is
"fuzzy," extending well beyond the zone indicated, as discussed below. Second,
the beam
passing through the flow channel 10, assuming that it has been focused, is
typically is not
uniform in width. Rather, in the case of a focused beam, its width varies over
the depth of the
measurement flow cell 35. The extent to which the beam waist varies over the
depth of the
channel depends on the depth of field of the focused beam, defined as the
distance (y-axis)
between the points at which the beam waist grows to 2 times its minimum value.
Ideally, the
-19-
CA 02733296 2011-02-04
WO 2010/017001 PCT/US2009/050570
depth of field is significantly greater than the channel thickness, b,
resulting in a relatively
uniform beam width throughout the flow channel.
Consequently, focused light scattering devices may include a fundamentally
different
sensor. In the conventional design, the physical width of the flow channel 10
and the
effective width (x-axis) of the OSZ are one and the same, equal to dimension
"a." By
contrast, the physical width of the flow channel in a sensor used for focused
light scattering
devices (also defined as "a") is typically much larger than the nominal width,
2w, of the
incident light beam and therefore has no significant influence on the OSZ.
Hence, the spacers
(or shims) 38 and 39 that separate the front and back windows 36 and 37,
determining the
depth, b, of the flow cell (and OSZ), no longer need to be opaque or smooth on
an optical
scale to avoid scattering by the edges. This is a significant advantage,
making fabrication of
the flow cell easier and less expensive.
It is usually convenient and effective to employ a "circularized" light beam,
in which
the incident intensity ideally depends only on the radial distance, r, from
the beam axis
(coincident with the y-axis, with x=z=0, as seen in FIG. 1). Typically, one
employs a
"gaussian" light beam--i.e. one having a gaussian intensity profile, described
in the focal
plane (minimum beam waist), at y=b/2, by I(r)=Ioexp(-2r2/w2) (7) where
r2=x2+z2 for the
assumed circular beam.
Quantity 2w is the diameter of an imaginary cylinder containing most of the
incident
light flux. The intensity on its surface equals 1/e2, where e is the base for
natural logarithms,
or 0.135 times its value, 10, at the center of the beam (r=0). Essentially
100% (apart from
losses due to reflections at optical interfaces and extinction by particles in
the beam) of the
light flux contained in the incident beam traverses the fluid-particle mixture
in the flow
channel and impinges on the distant detector DLE. This causes detector DLE to
provide a light
extinction signal VLE in the form of a downwardly extending pulse, resembling
pulse 30 in
FIG. 2 at the output of UV converter amplifier 34.
This behavior is in sharp contrast to the illumination scheme employed in a
conventional LE-type sensor. There, the starting light beam is expanded
greatly along the
lateral (x) axis of the flow cell, so that its width (1/e2 intensity) is much
larger than the width,
a, of the front window (and OSZ). As a result, there is relatively little
variation in the incident
-20-
CA 02733296 2011-02-04
WO 2010/017001 PCT/US2009/050570
intensity along the x-axis (i.e. for y=z=0) where the beam enters the flow
cell, because the
light is captured at the top of the x-expanded gaussian beam. Therefore, a
particle passing
through the OSZ will experience substantially the same maximum beam intensity
(i.e. at
z=0), regardless of its trajectory. The specific values of x and y defining
the trajectory ideally
have no influence on the resulting sensor response, i.e. the pulse height.
There is a sharp contrast between the conventional optical design and the
scheme
employed in the sensor used for focused light scattering devices. There is a
large variation in
the incident intensity as a function of position (x-axis) across the width of
the flow channel.
In the case in which the incident light beam has a symmetric (circular)
gaussian profile, the
intensity variation is given by Equation 7, with r=x. The maximum intensity,
10, is achieved at
the center of the beam (x==0), where for simplicity x=0 represents the
midpoint of the
channel (with the side walls at x= a/2). As noted, the intensity occurring at
x= w, z=0 is
reduced substantially, to 0.135 I0. The intensity drops steeply with
increasing distance from
the beam, falling, for example, to 0.018 10 at x= 2w, z=0 and 0.00033 10 at
x= 4 w, z=0.
The consequences for the light-extinction signal thus generated by the passage
of
particles through the new OSZ are far-reaching. First, as for a conventional
LE-type sensor,
the pulse height, AV1, generated by passage of a particle through the OSZ in
general
increases with increasing particle size, all other factors being equal. In
general, the larger the
particle, the larger the fraction of light "removed" from the incident beam,
thus unable to
reach the detector D1. However, with the new sensor the fraction of light
removed from the
beam now depends on the precise trajectory of the particle--specifically, the
minimum
distance, Ixl, of the particle to the center of the beam, x=0. (To first
approximation, the
response of the sensor will not vary significantly with changes in the y-axis
value of the
trajectory, assuming that the beam width is approximately constant over the
depth of the flow
channel, given an appropriately large depth of field, as discussed above.)
For a particle of given size and composition (hereinafter assumed to be
spherical and
homogeneous, for simplicity), the maximum "signal," or pulse height, is
achieved when the
particle passes through the center of the beam, x=0. A particle of given
effective cross-
sectional area, AA, blocks the largest amount of incident light at the center
of the beam,
where the intensity is greatest. Particles of identical size that pass through
the flow channel
along different trajectories, with different minimum distances, Ixl, from the
beam axis, are
exposed to varying, but smaller, maximum levels of illumination. The greater
the distance
from the beam axis, the lower the integrated intensity incident on a particle
and, hence, the
-21-
CA 02733296 2011-02-04
WO 2010/017001 PCT/US2009/050570
less light flux removed from the beam, and the smaller the resulting pulse
height. The
response therefore consists of a continuous "spectrum" of pulse heights,
ranging from a
maximum value, for trajectories that pass through the center of the beam, to
essentially zero
(i.e. indistinguishable from noise fluctuations), for trajectories located
very far from the
incident beam (Ixl>>w). The maximum pulse height depends on the beam waist,
2w, and the
size of the particles, as well as in some cases the refractive indices of the
particles and
surrounding fluid. (This depends on the extent to which light scattering is
significant relative
to refraction and reflection in contributing to the overall light extinction
signal.) A crucial
assumption is that the particle trajectories are distributed randomly (i.e.
occur with equal
frequency) within the flow channel. This assumption is usually valid, given
the typical
dimensions of the flow channel and the relatively low flow rates utilized. It
is also assumed
that the number of particles passing through the sensor is sufficiently large
that the statistical
fluctuations in the number of particles having trajectories with any given x-
axis value (i.e.
over any (narrow) range of x values) can be ignored.
The relationship between particle size and pulse height for the sensor in a
focused
light scattering device is therefore radically different from that obtained
for a sensor of
conventional design. In the latter case, particles of a given size (and
composition) give rise to
pulses of nearly uniform height, irrespective of their trajectories. This
behavior is important
for sensor design for the conventional SPOS method. The typically small
variations in pulse
height that occur, for example, when measuring polystyrene latex "standard"
particles of
essentially uniform size are caused by variations in the incident beam
intensity within the
OSZ along the x- and y-axes, for a given z-axis value. These variations
ultimately determine
the resolution of the sensor. The resulting width of the PSD is therefore
mostly a consequence
of residual non-uniformity of illumination across the OSZ, rather than an
actual range of
particle diameters.
By contrast, there is an obvious deterioration in the particle size resolution
for sensor
design for focused light scattering devices. When a single particle passes
through the sensor,
it gives rise to a light-extinction pulse with a height, AVLE that can vary
between a given
maximum value and essentially zero. Conversely, given a single detected pulse,
it is
impossible to determine the size of the particle that has produced it, solely
from knowledge of
the pulse height. For example, a particle that is relatively small, but which
passes directly
through the beam axis, yields the maximum pulse height possible for a particle
of that size
(and composition). Alternatively, a particle that is much larger but which
passes relatively far
from the beam axis yields a pulse height that could actually be the same,
depending on its
-22-
CA 02733296 2011-02-04
WO 2010/017001 PCT/US2009/050570
size and trajectory. Even though the large particle is able to intercept a
much larger area of
incident illumination than the small one, the average intensity incident on it
is smaller than
the intensity incident on the small particle. Hence, the resulting pulse
height could turn out to
be the same as that produced by the small particle. Obviously, there are an
infinite number of
pairs, {d, IxI}, of particle diameters and minimum beam-trajectory distances
that can give rise
to the same pulse height. The particle diameter, d, and the resulting pulse
height, AVLE, are
effectively "decoupled" from each other. This is the problem of "trajectory
ambiguity", which
for more than twenty years has motivated the search for new light-scattering
based schemes
for particle size determination using gaussian beams.
The effects of trajectory ambiguity described above might present a difficulty
in
measuring the size of a single particle, or a relatively small number of
particles. However, the
apparently poor size resolution associated with the sensor used for focused
light scattering
devices can be restored to a very acceptable level by means of appropriate
mathematical
deconvolution of the pulse-height data. The resulting dramatic improvement in
the effective
sensor resolution is possible by virtue of the fact that the sensor in a
focused light scattering
device is intended to be exposed to a large, statistically significant number
of particles of
every relevant diameter, or range of diameters, contained in the sample of
interest. This is the
circumstance that renders the new sensing method very useful for particle size
analysis, in
sharp contrast to the situation that holds for "contamination" applications.
There, the sensor is
exposed to relatively small numbers of particles of any given size, for which
statistical
significance is often not achieved.
The "raw" response of the sensor used in a focused-beam device, like its
conventional
SPOS predecessor, consists of the pulse height distribution (PHD)--a histogram
of particle
"counts" vs pulse height, AVLE. The pulse-height scale is typically divided
into a relatively
large number (e.g. 32, 64 or 128) of "channels," or "bins," each of which
encompasses an
appropriately narrow range of pulse height voltages, thus defining the voltage
resolution of
the PH). It is usually convenient to establish channels that are evenly spaced
on a logarithmic
voltage scale. Measurement of a new pulse causes the number of particle counts
stored in the
appropriate pulse height channel in the histogram to be incremented by one.
Data are ideally
collected from the particle suspension of interest for a sufficiently long
time that the resulting
PHD becomes statistically reliable, and thus smooth and reproducible. This
means that the
number, N1, of particle counts collected in the I-th pulse-height channel is
statistically
significant, dominating the fluctuations due to statistical "noise," for all
I, e.g. for 1 < I <128,
in the case of 128 channels. Assuming Poisson statistics, this means that Ni
N1, for all I.
-23-
CA 02733296 2011-02-04
WO 2010/017001 PCT/US2009/050570
Relatively high levels of particle concentration are possible because the
sensor
responds to only a small fraction of the total number of particles passing
through it. For
example, concentrations in the range of hundreds of thousands of particles/ml,
in sample
sizes of tens of mls, can be measured. That is, millions of particles can be
present, a portion
of which is passed through the beam of light and counted. The fraction of
particles that are
actually counted, relative to the number of particles present in the sample
(Np), is known as
phid, or "sensor efficiency," and is calculated by taking the ratio of the
particles actually
detected over the number of particles in the sample. The number of particles
detected over
the number of particles in the sample typically ranges from about 0.5 to about
5%.
The fact that the sensor efficiency is so relatively small is not surprising.
In the case
of a tightly focused beam, the width, a, of the flow channel is invariably
much larger than the
nominal width, 2w, of the focused beam. Therefore, most of the particles
passing through the
sensor are exposed to negligible levels of light intensity, because their
trajectories are located
so relatively far from the beam axis--i.e. Ixl>>w. Consequently, only a small
fraction of the
total number of particles are able to "block" enough light to give rise to
detectable pulses,
relative to the prevailing noise level. The great majority of particles pass
undetected through
the sensor.
While this limitation may appear to be serious, in practice it is of little
concern, for
two reasons. First, the fraction, phid, of particles that produce detectable,
measurable pulses
will be fixed for a given sensor width, a, even though the value changes with
particle
diameter, d. Second, the new sensing method is intended for use in determining
the particle
size distribution (PSD) for samples that, by definition, are highly
concentrated to begin with.
Even following dilution, if required, the concentration of particles of any
given size (i.e.
within any (narrow) size range) is, by definition, relatively high. Assuming a
suitable flow
rate and data collection time, the resulting PHD will possess an acceptable
signal/noise ratio,
with a low level of statistical fluctuations. Hence, even though only a small
fraction of the
available particles will contribute to the raw data, the resulting PHD will be
representative of
the much larger number of particles in the sample that are ignored. Therefore,
a reliable and
accurate PSD, representative of.the entire sample, can be obtained from the
"inefficient"
sensor used in the focused light scattering devices described herein.
Several additional features of the PHD that can be obtained are noteworthy.
First, as a
consequence of the fact that the particle trajectories span a large range of
Ixi values, passage
of uniform particles through the sensor indeed results in a PHD containing a
wide range of
pulse heights. In this case, these range from the threshold of individual
pulse detection
-24-
CA 02733296 2011-02-04
WO 2010/017001 PCT/US2009/050570
(dictated by the prevailing r.m.s. noise level), roughly 5 millivolts (mV), to
a maximum of
approximately 326 mV for the nominal "end" of the distribution. (This excludes
a small
number of "outlier" pulses, due to agglomerates and over-size primaries that
extend to 500
mV). Given the uniformity of the particles, this 65-fold range of pulse
heights can only be
ascribed to differences in particle trajectory. (To a first approximation, one
can neglect
variations in the beam width over the depth of the flow channel, as discussed
earlier.)
Second, as expected, the PHD is highly asymmetric, skewed greatly in the
direction of
smaller pulse heights. Clearly, there are many particle trajectories that
sample a large range of
IxI values (and, hence, beam intensities), but only relatively few that probe
the central portion
of the gaussian profile, where the intensity is substantially uniform. The PHD
exhibits a
broad, smooth upswing in the number of particles with increasing pulse height,
accelerating
to a relatively sharp peak, followed by a dramatic decline to the baseline,
representing zero
pulse events. This sharp "cut-off" at the upper end of the distribution
defines the maximum
pulse height, referred to hereafter as MAV . The counts collected at this
maximum value
represent particles that passed through, or very close to, the center of the
beam--i.e.
trajectories with x approximately equal to 0--where the fraction of total
incident light flux
"blocked" by the particles is the largest value possible. The counts collected
in smaller pulse
height channels represent particles that passed further from the beam axis;
the greater
parameter IxI, the smaller the resulting pulse heights.
There is a relationship between the particle trajectory and the resulting
pulse height.
Trajectory "A" gives rise to extinction pulses having the maximum pulse
height, MAV,
immediately preceding the upper cut-off of the PHD. Trajectories "B," "C," "D"
and "E"
located progressively further from the beam axis, give rise to pulses with
correspondingly
lower pulse heights and progressively lower numbers of particle counts.
Eventually, the
number of particle counts per channel approaches zero, as the pulse height
reaches the
detection limit (approximately equal to 5 mV).
The reproducibility of the PHD depends only on the degree to which the number
of
counts contained in the various channels are large compared to statistical
fluctuations.
Therefore, the "reliability" (i.e. the smoothness and reproducibility) of the
PHD should
depend on the total number of particles counted during a measurement. For a
given particle
size there will obviously exist a minimum number of pulses that should be
counted and
analyzed, below which the PHD should be expected to exhibit significant,
irreproducible
"structure" from one measurement to the next, due to statistical noise. Again,
the PHDs
produced by the new sensor have meaning only to the extent that relatively
large, statistically
-25-
CA 02733296 2011-02-04
WO 2010/017001 PCT/US2009/050570
meaningful numbers of particles of the same size are detected during the data
collection
period. Only if this is true can one expect to obtain optimal, reproducible
PHD results, and
correspondingly accurate, representative particle size distribution (PSD)
results derived from
the latter using the methods discussed below.
To confirm that the data measured is significant, one can overlay two or more
PHDs
taken from measuring the same sample in multiple runs.
Exposing the sensor to larger particles will yield a PHD that is shifted to
larger pulse
heights. Specifically, the maximum pulse height, MAVLE, corresponding to
particle
trajectories passing through, or very close to, the beam axis, increases.
As shown in Figure 2, the main design difference that distinguishes the new LS-
type
sensor from its LE counterpart is the addition of a light collection means--
typically one or
more lenses--in order to gather scattered light rays originating from
individual particles
passing through the OSZ, created by the incident light beam.
The lens system is designed to collect scattered light over a particular,
optimal range
of angles, typically encompassing relatively small angles of scattering. In
the scheme shown
in FIG. 2, a mask 50 has been placed in front of the first collection lens.
Mask 50 comprises
an outer opaque ring 52 and an inner opaque area 54, which form a transparent
ring 56. Mask
50 allows only light rays with scattering angles, theta, located within an
imaginary annular
cone defined by angles .thetas and theta2 (i.e. theta, < thetaz) to impinge on
the first collection
lens 62. Typically, this lens is centered on the axis of the incident beam, at
an appropriate
distance (i.e. its focal length) from the center of the flow channel, causing
a portion of the
diverging scattered light rays from the OSZ to be captured by the lens and
become
approximately collimated. A second lens 64 can then be used to focus the
resulting parallel
scattered rays onto a suitable (small-area) detector DLs. The resulting signal
is "conditioned"
by one or more electronic circuits, typically including the functions of
current-to-voltage
conversion and amplification.
There is a crucial difference between the signal, VLS, created by this optical
scheme
and the signal, VLE, produced by the LE-type sensor. Unlike the latter, the LS-
type sensor, by
design, prevents the incident light beam emerging from the back window of the
flow cell
from reaching the detector, DLS. Instead, the incident beam is either
"trapped" by means of a
suitable small opaque beam "stop" (e.g., the inner opaque area 54) or
deflected by a small
mirror away from the lens that is used to collect the scattered light rays
originating from the
OSZ. Consequently, the relatively large "baseline" level, V0, necessarily
present in the
overall signal, VLE, produced by the LE-type sensor is now absent from the LS
signal, VLS.
-26-
CA 02733296 2011-02-04
WO 2010/017001 PCT/US2009/050570
Ideally, the new "baseline" signal level is zero--i.e. there should be no
scattered light
generated from sources within the OSZ in the absence of a particle. In
practice, of course,
there will be some amount of background light caused by light scattered from
the surfaces of
the front and/or back windows of the flow channel, due to imperfections on, or
contaminants
attached to, the latter surfaces. In addition, there may be fluctuating
background light due to
scattering from small contaminant particles suspended in the diluent fluid.
Also, for some
samples there may be fluctuations in background light produced by a "sea" of
ultra-fine
particles which comprise a major fraction of the overall particle population,
but which are too
small to be detected individually.
When a particle of sufficient size passes through the OSZ, defined by the
incident
gaussian light beam and front and back windows of flow channel 35, a momentary
pulse
occurs in the output signal produced by the detector, DLS, and associated
signal-conditioning
circuit. In general, one might naively expect that the larger the particle,
the greater the
amount of light scattered by it, assuming the same trajectory, and therefore
the greater the
height of the signal pulse.
In practice, the actual pulse height depends not only on the size of the
particle, but
also its composition--specifically, its index of refraction (and that of the
surrounding fluid)
and absorbance, if any, at the incident wavelength. The pulse height also
depends on the
wavelength of the beam and the orientation of the particle as it passes
through the OSZ, if it
is not spherical and homogeneous. Finally, for particles comparable in size
to, or larger than,
the wavelength, the scattering intensity varies significantly with the
scattering angle.
Consequently, in this case the pulse height depends on the range of angles
over which the
scattered light is collected and measured.
The relationship between the scattered light "radiation pattern" (i.e.
intensity vs angle)
and all of these variables is described by classical Mie scattering theory,
which takes into
account the mutual interference of the scattered light waves within the
particle. In general, the
larger the particle, the more complex (i.e. non-isotropic) the angular
dependence of the
scattered intensity resulting from intra-particle interference. In order to
optimize the response
and performance of the LS-type sensor, one must confine the collection of
scattered light to a
range of angles, theta, for which the net integrated response, AVLE, increases
monotonically
with the diameter, d, of particles of a given composition (i.e. refractive
index) over the largest
possible, or expected, size range. This requirement can usually be satisfied
by choosing a
range of relatively small angles, theta s<theta<theta2, close to the forward
direction. In this
way, one avoids "reversals" in the integrated scattering intensity with
increasing particle size
-27-
CA 02733296 2011-02-04
WO 2010/017001 PCT/US2009/050570
due to variations of the intensity with changes in angle, especially
significant at larger angles
as a consequence of Mie intra-particle interference.
There are two properties of the signal, VLS, produced by the new LS-type
sensor that
are qualitatively different from the properties of the signal, V1, produced by
the
corresponding LE-type sensor. First, the signal pulse caused by passage of a
particle through
the OSZ and the "overall" signal, VLS, are essentially the same in the case of
the LS-type
sensor. The relatively high background signal level that accompanies the pulse
of interest in
the LE-type sensor is absent: (The same situation clearly holds for a
conventional LS-type
sensor).
Therefore, in the case of relatively small particles that give rise to pulses
of low
magnitude, the signal/noise ratio achieved in practice using the LS method
should be
significantly better than that realized using the LE method. This advantage
becomes more
important the smaller the particle and the weaker the resulting pulse, as the
latter approaches
the prevailing noise fluctuations. Another way of appreciating the inherent
advantage of the
LS method over its LE counterpart is to realize that the former is based on
"detection at null."
That is, quantitative detection of a pulse ideally is carried out in the
presence of zero
background signal. From a signal/noise perspective, this is in sharp contrast
to the situation
that obtains for the LE method, which requires high "common-mode rejection."
The
"common-mode" signal, Vo, is always present in the raw signal, V1, and must be
subtracted,
or otherwise suppressed, in order to extract the (often small) signal pulse of
interest.
There is a second important and distinguishing property of the LS signal, VLS.
The
signal/noise ratio associated with the measurement of AV1 can in principle be
improved by
increasing the power of the incident light beam, so as to increase the light
intensity incident
on a particle at all points within the OSZ. Therefore, in principle one can
reduce the lower
size detection limit for the new LS sensor by increasing the power of the
light source, as for a
conventional LS sensor. Eventually, a lowest size limit will be reached, based
on noise
fluctuations associated with the suspending fluid and/or the light source and
detection system.
Of course, as discussed above, the lower particle size limit can also be
improved for the new
LS-type sensor by reducing the width, 2w, of the incident beam, assuming no
change in the
power of the latter. This action will obviously increase the maximum intensity
incident on the
particles that pass through the beam axis (x=O), and therefore the height of
the largest
resulting pulse for a particle of given size, as well. However, this method of
improving the
sensitivity eventually reaches a point of diminishing return, due to
limitations imposed by
-28-
CA 02733296 2011-02-04
WO 2010/017001 PCT/US2009/050570
diffraction theory (establishing a minimum beam width) and excessive variation
of the
focused beam width over the depth, b, of the flow cell due to excessively-long
depth of field.
By contrast, an increase in the power of the light source has relatively
little effect on
the lowest particle size that can be measured using the LE method. For
example, a doubling
of the power of the light source will result in a doubling of the baseline
signal level (FIG. 2),
to 2V0. The height of the pulse, AV1, produced by a particle of the same size
and trajectory
will also be doubled, assuming no change in the beam width. However, the root-
mean-square
magnitude of the noise fluctuations associated with the relatively high
baseline signal level
will typically also be approximately doubled, because these fluctuations are
usually
associated with the light source and therefore scale with the output power.
Hence, one
expects little or no improvement in the signal/noise level for the LE-type
sensor.
Consequently, there should be little or no reduction in the lower size
detection limit
achievable by the LE method as a consequence of increasing the power of the
light source.
An improvement will be realized only if the signal/noise ratio associated with
the light source
improves with increased power.
When uniform size particles flow through the new LS-type sensor, depending on
their
trajectories they are individually exposed to different values of maximum
incident intensity,
given by Equation 7, with r=x, z=0. (For simplicity, it can be assumed that
the particles are
much smaller than the beam width, so that every point in a given particle is
exposed to the
same intensity at any given time.) Therefore, as with the new LE-type sensor,
the height,
AVLS, of the resulting pulse generated by a particle of given size depends on
the distance, IxI,
of closest approach (z=0) to the axis of the incident beam. The smaller the
distance IxI, the
larger the value of AVLS. Hence, like its LE counterpart, the LS-type sensor
generates a
distribution of widely varying pulse heights, AVLS, when a suspension of
uniform particles
passes through it at an appropriate flow rate. The shape of the resulting PHD
bears a strong
qualitative resemblance to the highly asymmetric shape of the PHDs obtained
using the new
LE method, exemplified in FIGS. 4, 6 and 7. That is, the number of pulse
counts (y-axis) is
relatively small at the smallest measurable pulse height just above the noise
fluctuations) and
rises with increasing pulse height, AV1. The pulse count value culminates in a
peak value at
a maximum pulse height, referred to as MAVL, corresponding to particle
trajectories for
which Ixl.apprxeqØ Above AAVLs the number of pulse counts ideally falls to
zero, assuming
that the particle concentration is below the coincidence concentration
(discussed earlier) for
particles of that size, so that at most one particle effectively occupies the
OSZ at any given
time. Of course, a PHD obtained using the new LS method usually pertains to
particles that
-29-
CA 02733296 2011-02-04
WO 2010/017001 PCT/US2009/050570
are smaller--often significantly so--than those used to generate a typical PHD
using the new
LE method.
As noted above, the shape of the PHD--number of pulse counts vs AVLS--
generated
for uniform particles using the new LS method is qualitatively similar to the
shape of the
PHD obtained for uniform (typically larger) particles using the new LE method.
Both kinds
of PHDs share the distinguishing characteristic of a sharp "cut-off" following
their respective
peak number of pulse counts, coinciding with their maximum pulse height
values, MAVLS and
MAVLE. However, it should be appreciated that there are quantitative
differences in the shapes
of the two kinds of d=1, notwithstanding their qualitative similarities, even
for the same
particle size--e.g. d=1 m. The "front end" design of the new LS-type sensor--
i.e. the focused
light beam and relatively thin flow cell--is essentially the same as that
utilized for the new
LE-type sensor. Therefore, what distinguishes one type of sensor from the
other concerns the
means and manner of light detection and the type and magnitude of the response
pulses
generated by each method, even in the case of particles of the same size. For
the new LS
method, the response is due only to light scattering, and its magnitude, AVLS,
is proportional
to the intensity of the light incident on the particle, all other relevant
variables being the
same.
By contrast, for the new LE method the magnitude of the response, AVLE, is a
more
complex function of the intensity incident on the particle. First, the
response is due to a
combination of physical effects--refraction (and reflection) plus light
scattering. However, the
scattering phenomenon asserts itself in an "inverse" sense. That is, a small
fraction of the
incident light flux is removed from the beam before it reaches the detector.
Second, over the
typical size range for which the new LE method is applicable, there is a
substantial variation
in the incident intensity across the particle. Therefore, it should not be
surprising that the
fractional change of pulse height due to a given change in Ixl, dependent on
both particle size
and trajectory, is generally different for the two methods. Similarly, the
fractional change in
pulse height with particle diameter, dependent on both particle size and
trajectory, is also
generally different for the two methods.
The task of converting the "raw" data--the PHD--obtained from a sample of
suspended particles into the object ultimately desired--the particle size
distribution, or PSD, is
described in detail below.
It is useful to compare this task conceptually with the operation required in
the case of
a conventional LE- or LS-type sensor. There, the height of the pulse due to
passage of a
particle through the OSZ is nearly independent of its trajectory, because the
intensity of the
-30-
CA 02733296 2011-02-04
WO 2010/017001 PCT/US2009/050570
incident beam is designed to be approximately constant across the flow channel
(i.e. along the
x-axis) for a given z-axis value (e.g. z=0). Consequently, particles of a
given size ideally give
rise to pulses of substantially the same height, and the resulting PHD is
therefore, in effect,
equivalent to the final desired PSD. There is a one-to-one correspondence
between a given,
measured pulse height, AV1 (or AVLS), and the particle diameter, d. If
particles of a larger or
smaller size pass through the sensor, the resulting pulse heights are larger
or smaller,
respectively. A "calibration curve," consisting of pulse height vs particle
diameter, is all that
is needed to obtain, by simple interpolation, the PSD from the PHD. Obtaining
the raw PHD
data using the conventional SPOS method is equivalent to determining the
final, desired PSD.
By contrast, as discussed earlier, the response of the LE- (or LS-) type
sensor is much
more "convoluted." Even in the simplest case of particles of a single size,
the resulting PHD
consists of a broad spectrum of pulse heights, from the smallest values just
above the
prevailing noise fluctuations, to the maximum value, MAVI (or MAVI),
associated with that
size. Therefore, in the typical case of particles of widely varying size, the
resulting PHD
consists of an even wider assortment of pulse heights. No longer is there a
simple
correspondence between pulse height and particle size. It is therefore no
longer a simple,
straightforward procedure to transform the set of particle counts vs pulse-
height values
contained in the PHD into the desired size distribution--particle counts vs
particle diameter.
It typically involves three procedures to convert the PHD to the desired PSD.
First,
the raw PHD must be inverted, or deconvoluted, using a specialized
mathematical algorithm.
Its purpose is to convert the "wide-spectrum" PHD produced by the new LE- (or
LS-) type
sensor into a "sharp", idealized PHD, equivalent, in effect, to what would
have been obtained
using a conventional LE- (or LS-) type sensor. Such an idealized, deconvoluted
PHD--
hereinafter referred to as the dPHD--has the property that all pulses of a
given height, AV3
(or AVLS), belong exclusively to particles of a given size (assuming, always,
particles of a
given composition). The dPHD is equivalent to what would have been obtained if
all of the
particles contributing to the original PHD had passed through the center
(axis) of the incident
beam.
A second straightforward procedure is then carried out. A preliminary, or
"raw", PSD
is obtained from the dPHD by simple interpolation of the calibration curve
that applies to the
specific new LE- (or LS-) type sensor utilized--e.g. the curve shown in FIG.
8A. This
procedure permits a one-to-one translation of each deconvoluted pulse height
value in the
dPHD into a unique particle diameter associated with this value, thus yielding
the raw PSD.
A third procedure is then needed to convert the raw PSD thus obtained into a
final PSD that is
-31-
CA 02733296 2011-02-04
WO 2010/017001 PCT/US2009/050570
quantitatively accurate. The number of particle counts in each diameter
channel of the raw
PSD is the number of this size that actually contributed to the measured PHD.
As discussed
above, this is typically only a small fraction of the total number of
particles of the same size
(i.e. within the size range defined by the diameter channel) residing in the
volume of sample
suspension that passed through the sensor during data collection. This
fraction, phid, of
particles actually detected by the new LE- (or LS-) type sensor varies
significantly with the
particle diameter, d.
The third procedure involves multiplying the number of particles contained in
each
diameter channel of the raw PSD by the value of 1/phi, that applies for that
channel. This
operation yields the final, desired PSD, describing the number of particles of
each size
estimated to reside in the quantity of sample suspension that passed through
the sensor during
data acquisition. Values of 1/phid for each value of diameter, d, can be
obtained from the
sensor efficiency curve, phid vs d, by interpolation.
There are two independent algorithms presented herein for deconvoluting a
measured
PHD, to obtain the dPHD, hereinafter referred to as "matrix inversion" and
"successive
subtraction." Implementation of either procedure is based on the property that
the response of
the new LE- (or LS-) type sensor--like its conventional SPOS counterpart--is
additive.
Because the particles passing through the sensor give rise to signal pulses
one at a time, the
resulting PHD can be considered to be composed of a linear combination, or
weighted sum,
of individual PHDs corresponding to uniform particles of various sizes,
referred to as "basis
vectors." (This term is well known in linear algebra.) Each of these basis
vectors represents
the response of the system to a statistically significant number of particles
of a single, given
size.
A preferred embodiment of the focused light scattering device described herein
is
shown in Figure 3. The device incorporates both the new LE- and LS-type SPOS
sensors of
the invention in a single sensor, having two independent output signals, VLE
and VLS. The
resulting dual "LE+LS" design offers increased capability and flexibility,
providing single-
particle counting and sizing over a relatively large range of particle sizes.
The LS-type sensor
subsystem can be used to extend the size range below the lower detection limit
provided by
the new LE-type sensor subsystem. The extent to which the lower particle size
limit can be
extended depends on a variety of parameters. These include: the width, 2w, of
the narrow
(typically focused) beam within the measurement flow cell; the power of the
light source; the
range of angles over which scattered light is collected for implementation of
the new LS-type
-32-
CA 02733296 2011-02-04
WO 2010/017001 PCT/US2009/050570
sensing function; and the physical properties, including the refractive index,
of both the
particles and the suspending fluid.
The dual LE+LS sensor include a light source 160, preferably consisting of a
laser
diode module, typically having an output wavelength in the range of 600 to
1100 nanometers
(nm). The beam 162 produced by the light source means preferably is collimated
(parallel)
and "circularized"--i.e. the intensity is a function only of the distance, r,
from the central axis.
Furthermore, the beam preferably has a gaussian intensity profile, as
described by Equation 7,
along any axis normal to the axis of propagation of the beam. The new LE+LS
sensor also
includes a focusing means 164, typically a single- or multi-element lens,
capable of focusing
the starting collimated light beam 162 to the desired beam width, 2w, at the
center of the
measurement flow channel 166 in the OSZ 168, consistent with the desired
particle size
range. It is assumed that the focusing means has an appropriate focal length,
thus yielding
acceptable values for both the width and depth of field of the focused beam.
The latter is
preferably significantly longer than the thickness, b, of the flow channel, in
order to optimize
the resolution of the resulting PSD.
The measurement flow cell 166 is fabricated from a suitable transparent
material,
such as glass, quartz or sapphire, or alternative semi-transparent material,
such as PTFE (e.g.
Teflon.TM., manufactured by DuPont) or other suitable plastic that is
sufficiently transparent
at the operating wavelength and compatible with the fluid-particle mixture. A
suitable
fluidics system, including a flow pump means and optional means for automatic
dilution of
the starting sample suspension (if needed), are typically required to
facilitate the steady flow
of the particle-fluid suspension through flow cell 166. The flow rate, F, is
usually chosen to
be the same as, or close to, the value used to generate the calibration curve
for the LE- or LS-
type sensor.
The thickness, b, of the flow channel should be small enough to achieve a high
coincidence concentration limit and as uniform a beam width as possible
(ideally with
b<<depth of field), resulting in improved resolution for the final PSD.
However, it must be
large enough to prevent frequent clogging by over-size particles (e.g.
agglomerated primaries
and contaminants in the fluid/diluent). The width, a, of the flow channel is
also chosen to
strike a compromise between two competing effects. A relatively large value
reduces the
impedance to the flowing fluid-particle mixture and lowers the velocity (and
increases the
pulse width) for a given flow rate, F. However, the larger parameter a, the
smaller the sensor
efficiency, phid, for any given particle diameter, d. This results in a
smaller fraction of
-33-
CA 02733296 2011-02-04
WO 2010/017001 PCT/US2009/050570
particles in the sample actually contributing to the measured PHD and final
PSD, which, if
too small, may be undesirable.
The new LE+LS sensor contains two separate light collection and detection
subsystems, used independently to extract the desired LE- and LS-type signals.
The LE-type
signal can be captured using a small light reflecting means M (e.g. mirror),
positioned so as
to intercept the narrow beam 167 of incident light after it passes through the
flow cell and
fluid-particle mixture. The resulting transmitted beam 169, thus deflected
away from the
optical axis of the combined sensor, is caused to impinge on a nearby light
detection means
DLE. The latter typically consists of a small-area, solid-state (silicon)
detector, operating in a
linear region and having a spectral response that is matched to the wavelength
of light source
160, thus providing an output signal with an acceptable signal/noise (S/N)
ratio. The output
of the detector means is typically a current (the "photocurrent"), which can
be conditioned by
a current-to-voltage converter ("transimpedance" amplifier) 170, yielding an
output signal in
the generally desired form of a time-varying voltage, VLE(t).
Alternatively, a small detector element can be placed directly in the path of
the light
beam 167 after it emerges from the flow cell, thus eliminating the need for
the intermediate
light reflecting means discussed above. Regardless of whether a mirror or
detector element is
used to "capture" the transmitted light beam, there are two requirements.
First, the means
used must function as an effective beam "stop." That is, it must be able to
prevent any
significant fraction of the arriving light flux from being reflected back
toward the flow cell,
thus becoming a source of "stray" light. Through unintended internal
reflections from the
various optical surfaces, a portion of the stray light can find its way to the
scattering detection
means DLS, thus corrupting the resulting LS signal, by contributing a portion
of the incident
intensity to the latter. Second, the means used to capture the LE signal must
be small enough
not to intercept, and therefore block, scattered light rays at any angles that
are intended to be
captured and redirected to the light detection means DLS, as discussed below.
Separately, scattered light originating from particles passing through OSZ 168
is
collected over a range of scattering angles, theta, with theta,<theta<theta2,
where angles
theta, and theta2 are defined by a suitable aperture means, such as an annular
mask 172
fabricated from a photographic negative with an outer opaque portion 174, a
transparent
intermediate portion 176, and an inner opaque portion 178. The scattered rays
selected by
mask 172 are allowed to impinge on a collecting lens 180 of appropriate focal
length and
location, which converts the diverging scattered rays into an approximately
parallel beam
182. A second lens 184 is then typically used to refocus the rays onto a
relatively small light
-34-
CA 02733296 2011-02-04
WO 2010/017001 PCT/US2009/050570
detection means DLs. As in the case of the LE subsystem, the output signal of
D1 is typically
a current, which can be optionally conditioned, typically by means of a
transimpedance
amplifier 186, so that the final output is in the form of a time-varying
voltage, VJs(t).
The signals VJ(t) and VLS(t) are organized into respective pulse height
distributions
PHD by pulse height analyzers 188 and 189. The PHDs are then respectively
deconvoluted in
computer deconvolution means 190 and 191, which ultimately compute a pair of
respective
particle size distributions PSD 192 and 193.
This embodiment can be implemented as an LE-type or LS-type sensor only,
simply
by removing (or not installing in the first place) the optical elements,
detection means and
signal conditioning circuitry associated with the unwanted subsystem. In this
case, it may be
useful to adjust the width, 2w, of the focused beam within the measurement
flow channel, in
order to optimize the resulting performance of the LE- or LS-type sensor. This
parameter will
impact the usable particle size range, coincidence concentration limit and
minimum
detectable particle size differently for the two sensing modes, as discussed
earlier.
II. Particles that can be Detected
Using the techniques described herein, various biological particles can be
detected.
Cells are one type of biological particle that can be detected. The method can
be used to
determine the presence or absence of a specific type of cell in a given
solution. For example,
a sample of blood, urine, spinal fluid, and the like can be evaluated for the
presence or
absence of bacteria, fungi, viruses, and the like. The particle size, and,
optionally, particle
shape, can also provide information about the specific type of bacteria, fungi
or virus.
III. Microparticles and Nanoparticles Suitable for Use in Focused Light
Scattering
In some embodiments, where the complex between an active agent and a
biological
particle does not result in a change in particle size (i.e., no particle
agglomeration or cell
rupture), it may be necessary to conjugate the active agent with a
microparticle (such as a
nanoparticle, polystyrene bead, gold particle, and the like). Thus, when the
agent forms a
complex with the biological particle, the complex increases the size of the
biological particle
by the size of the microparticle, and this increased particle size is
measurable using the
techniques described herein.
-35-
CA 02733296 2011-02-04
WO 2010/017001 PCT/US2009/050570
In one embodiment, the particles have a particle size in the range of between
about
0.1 and 10 m, and ideally have a relatively consistent amount of active agent
bound to them.
That is, if all that is important is to determine that the biological
particles bound to an active
agent of interest, then one can simply incubate the biological particle with
the conjugate, and
look for the decrease in peak corresponding to the biological particle. This
will confirm that
a complex of the biological particle and the active agent was formed.
If there is an interest in quantifying how much of the biological particle was
present,
then it may be important to use particles with a nearly uniform particle size,
defined as
having 90% or more of the particles within 5% of the mean particle size, more
preferably
around 99% uniformity or better. In addition to a uniform particle size, in
some
embodiments, it may be desirable to have uniform substitution on the particles
themselves.
That is, rather than having particles of a relatively uniform particle size
form complexes of
different particle sizes with the biological particle of interest, it may be
desirable to form
complexes with a relatively uniform particle size, to ease their
quantification.
One way to produce particles with a relatively constant particle size, and
with a
relatively consistent amount of active agent conjugated to the particles, is
to use dendrimers.
The dendrimers can include a known quantity of the active agent, by virtue of
the active
functional groups at the terminus on the dendrimers.
Another way is to produce polymer particles with: a) a relatively narrow size
distribution, and b) a relatively consistent amount of protected functional
groups, so that after
the polymers are produced, the protecting groups can be removed, and the
functional groups
used to conjugate the polymer particles to an active agent.
The active agent can be conjugated with the particle in such a way that the
portion of
the active agent that is known to be active (i.e., binds a receptor) is not
significantly sterically
hindered by its conjugation with the particle. In some embodiments, this will
involve
preparing an analogue of the active agent which includes a further functional
group which
can be attached to the particle.
In one embodiment, metallic particles, such as gold particles, are used.
Because these
particles scatter a significant amount of light, they can be conjugated with a
specific active
agent, and used to identify even small molecules that bind to the agent. That
is, the amount
of light that the particle scatters is sufficiently large that the binding of
the agent to the
-36-
CA 02733296 2011-02-04
WO 2010/017001 PCT/US2009/050570
molecule of interest can be measured, even though the molecule is not within
the size range
of biological particles that can be measured. Means for conjugating active
agents to metallic
particles are known to those of skill in the art.
Metallic particles, such as gold particles, can also be used. These can be
conjugated
with active agents using known methodology to form particles capable of
forming a complex
with a biological particle, including particles too small to detect using
focused light scattering
techniques. Because the particles are highly dense, they produce enough light
scattering to be
detected, despite their small size. Binding of even a small molecule to the
particles can be
detected because of the intense scattering from the metallic bead so that
enough light is
scattered for the complex formation to be measured.
IV. Methods for Detecting the Presence or Absence of Specific Particles in a
Solution
A sample medium can be evaluated for the presence or absence of specific
particles.
For example, a sample of blood, urine, spinal fluid, amniotic fluid, pleural
fluid, peritoneal
fluid and the like, can be evaluated for the presence or absence of specific
microbes (cells
(lymphocytes, B-cells, T-cells, neutrophils, monocytes, and the like),
bacteria, fungi, viruses,
and the like), and/or for the presence of relatively high concentrations of
white blood cells or
other biological particles indicative of a disease state. The methods also
permit one to
determine presence or absence of shed particles.
The particle (intact cell, microparticle, bacteria, virus, fungus, and the
like) can be
further identified and characterized by addition of probe particles that are
coated with a
specific agent that recognizes and binds to the specific surface epitope on
the unknown
particle surface. If the recognition and binding of the probe particle occurs,
a new particle
size will be created and appear, thus identifying the unknown particle. For
example if the
unknown particle was a stem cell and the probe particle was labled with an
anti-CD34
antibody, binding of the probe particle with the stem cell would occur and a
new sized
particle would appear that would identify the presence of CD34 positive stem
cells.
Once the particles are identified by size, one can confirm the identity of the
particles,
for example, by using a reference library correlating the particle size to a
given biological
species. Thus, in one embodiment, the method involves comparing information
obtained on a
-37-
CA 02733296 2011-02-04
WO 2010/017001 PCT/US2009/050570
biological particle using focused light scattering techniques, with a library
of data on
biological particles obtained using similar focused light scattering
techniques. The library
can include information on two or more biological particles, preferably, ten
or more particles,
more preferably, one hundred or more particles, and, most preferably, more
than a thousand
particles.
After a preliminary identification has been made on the type of biological
particle,
other biological techniques can optionally be used to confirm the identity of
the particle. For
example, an EQELS spectra of the particle can be taken, and compared to a
library of EQELS
spectra of known particles, to confirm the identity of the particle.
Antibodies or other molecules specific for the specific biological particle
can be
added to the solution, and if the particles bind to the antibodies, the method
will detect the
absence of the particles. Ideally, the molecules will be conjugated with a
microparticle or
nanoparticle, such as a latex particle. As the conjugate interacts with a
biological particle,
peaks representing the particle and the conjugate will decrease, and peaks
corresponding to
the complex of the particle and the conjugate will increase.
In one embodiment, the biological particle is a microbe. The technique can be
used to
identify the type of microbe (i.e., bacteria, fungi, or virus), and, ideally,
the specific class of
microbe (i.e., Pneumonia, Clostridia, and the like). In this embodiment, once
a preliminary
identification of the microbe is made, a confirmation assay can be conducted
by first taking
an EQELS spectra of the microbe in solution, subjecting the microbe to an
antibody specific
for the microbe, and taking a second EQELS spectra. If the EQELS spectra are
different, this
provides confirmation that the microbe was properly identified and was bound
by the
antibody. Further, once a microbe has been identified, a putative
antimicrobial compound
can be put in solution/suspension along with the microbe, to determine whether
it is able to
kill the microbe.
In one embodiment, the methods can be used to identify a potential therapeutic
agent
capable of interacting with a known cell, such as a cancer cell, bacteria,
fungi, or virus. In this
embodiment, one first uses focused light scattering techniques to generate a
spectrum
showing the particle size and distribution for the known cancer cell,
bacteria, fungi, or virus
in a sample medium. Then, a putative therapeutic agent conjugated to a
microparticle or
nanoparticle is added to the sample medium and allowed to incubate with the
known cell,
-38-
CA 02733296 2011-02-04
WO 2010/017001 PCT/US2009/050570
microbe or virus. A second spectrum is generated using focused light
scattering techniques.
If peaks corresponding to a complex of the microparticle-conjugated
therapeutic agent and
the known cell or microbe are observed, then the therapeutic agent has bound
to the cell.
This is indicative of the potential utility of the putative therapeutic agent
against the known
cell, microbe or virus.
In one aspect of this embodiment, spectra of a microbe in a sample medium are
compared with a reference database of spectra of known microbes, thus
providing a rapid
means for identifying a particular microbe. The spectra can also provide an
initial
determination of particle size and/or particle density in the medium.
Bacterial detection
In one example of identifying microbes, one can determine whether the microbes
are
mono-dispersed or poly-dispersed by their number and size. Since E. coli tend
to mono-
disperse and Streptococcus tend to poly-disperse, this embodiment can be used
to observe
particle size in a sample, where observation of clumping identifies presence
bacteria known
to clump (i.e. Streptococcus).
Detection of Particle Shedding:
In another embodiment, the method is used to detect particle shedding.
Representative biological particles which shed smaller particles include
tumors, red blood
cells, white blood cells, granulocytes, platelets, monocytes, neutrophils,
lymphocytes,
endothelial cells, cancer cells, stem cells, bacteria, viruses, and fungi.
Particle shedding may
result from cell interactions, a change of cellular state such as activation
or deactivation, as a
result of expression, cell death, etc. The methods described herein can be
used to identify
such particle shedding.
In one embodiment, a drug or ligand is added to a vessel with a cell. Where
the drug
or ligand reacts with the cell, the cell may shed membrane particles or other
particles. As
described in detail herein, the method can be used to detect the size, number
and/or type of
particles shed by the reaction. Therefore, where the cell is known, this
technique may be
used to detect efficacy of unknown drug agent; and where the drug is known,
the technique
may be used to identify the presence of a specific cell type.
-39-
CA 02733296 2011-02-04
WO 2010/017001 PCT/US2009/050570
The ejected particles can be observed using the methods described herein. The
ejected particles can similarly be characterized by comparing the size and/or
shape with a
library of data collected using focused light scattering techniques on known
ejected particles,
and/or by binding some or all of the ejected particles to an antibody or other
such molecule.
A schematic illustration of shed particles binding to an
antibody/microparticle
conjugate is shown in Figures 4-7. Figure 4 shows the situation at time zero,
before complex
formation, and figures 5-7 show the gradual formation of a complex, and the
corresponding
decrease in the peaks associated with the shed particles and the
microparticle/antibody
conjugate.
Detecting Individual Molecules
In one embodiment, the methods permit one to detect the presence of specific
molecules, where the molecules are of a size below the threshold limit of
detection for
focused light scattering techniques. In this embodiment, highly reflective
metallic particles,
such as gold particles, are covalently linked to a ligand that binds to the
molecules of interest.
Because the metallic particles are dense and highly efficient light scattering
particles, the
amount of light scattering when the ligand binds to a molecule of interest can
be measured
using the focused light scattering technique, thus confirming the presence or
absence of a
molecule of interest in the solution. In another embodiment, microparticles
conjugated to an
active agent known to bind in a specific manner to a particular secies of shed
particles are
used, rather than metallic particles. The complex of the shed particle and the
microparticle is
then measured. Representative agents include antibodies and small molecules
known to bind
to the particular shed particles.
Detection of Particle Afire a tion
In another embodiment, the method is used to determine particle aggregation
and
types of aggregation. Such aggregation may include, but is not limited to
aggregation of a
particle with other particles, or aggregation of a particle with a drug.
Particularly with respect to liposomal therapy, agglomeration of particles
(such as
liposomes) can result in significant mortality or morbidity when the
agglomerated particles
are administered. Accordingly, the method can be used to evaluate a sample of
liposomes
-40-
CA 02733296 2011-02-04
WO 2010/017001 PCT/US2009/050570
before administration to ensure that the particles have not agglomerated
before a patient is
treated.
IV. Methods for Detecting Binding of a Particle to a Known Molecule
In some embodiments, one knows the identity of a known molecule, for example,
a
drug molecule that is known to interact with the receptor on a biological
particle that may or
may not be present in the sample medium. By incubating the sample medium with
a
conjugate of the drug molecule and a microparticle, one can look for complex
formation
indicative of the binding of the drug molecule with biological particles in
the sample
medium. The complex formation can be observed over time, or simply after a
suitable
incubation period.
The methods can be performed by using, as a starting material, either a drug
or a
biological microparticle in a vessel, and then adding a known material (either
a known cell or
microbe, for example) to test for interaction with drug; or a known drug to
test for interaction
with microparticle). Then, focused light scattering techniques can be
performed to look for
change in particle size from size of starting material, where an increase or
decrease in particle
size is indicative of interaction and binding.
In order to preserve the ability of the known molecule to bind to the particle
of
interest, in those embodiments where a molecule is conjugated to a
microparticle, it is
conjugated in a way that does not adversely impact its ability to bind to the
particle of
interest. This may involve developing a modified molecule, wherein the
molecule is
modified to include a functional group capable of being conjugated to the
microparticle, such
that the molecule still maintains its ability to form a complex with the
particle of interest.
Such modifications are routine in the art.
By using a biological particle known to form a complex with the active agent,
one can
evaluate such modified compounds for their ability to maintain their binding
affinity for the
particle of interest by incubating the modified compound, or the conjugate of
the compound
with the microparticle with the particle. Those compounds which maintain the
ability to bind
the particle of interest can be identified using focused light scattering
techniques, because the
particle size of the complex is larger than the particle size of the non-
complexed particle and
non-complexed conjugate.
-41-
CA 02733296 2011-02-04
WO 2010/017001 PCT/US2009/050570
Column-Based Approaches to Removing Biological Particles
Rather than forming a complex of the biological particle and a conjugate of an
active
agent and a microparticle, one can optionally prepare a column including
microparticles
conjugated to agents that bind to the biological particle of interest, and
pass the sample
medium through a column including the microparticles. The sample, minus any
complexed
biological particles, will elute from the column. By performing the focused
light scattering
method on the eluted material, one can identify changes in particle
number/population
density, as compared to the starting material. A decrease in particle
number/population
density is indicative of interaction and binding in the column, and,
therefore, an indication
that the biological particle of interest was present in the sample.
Magnetic Bead-Based Approaches to Remove Biological Particles
Rather than forming a complex of the biological particle and a conjugate of an
active
agent and a microparticle, and using focused light scattering methods to
identify the presence
of the complex between the biological particle and the conjugate, one can
optionally use a
magnetic microparticle conjugated to the active agent. Thus, one can first
obtain a focused
light scattering spectra using the methods described herein, then use magnetic
particles to
complex with the biological particle of interest. The complex can be removed
from the
sample media using a magnet. Then, one can obtain a second focused light
scattering spectra,
and identify whether the number of biological particles of interest has been
reduced.
V. Methods for Determining Binding of a Known Particle to an Unknown Compound
In other embodiments, it is desired to learn whether a putative therapeutic
agent can
bind to known biological particles. In these embodiments, putative therapeutic
agents are
conjugated to a microparticle or metallic nanoparticle, such as a gold
nanoparticle, and
incubated with the known biological particles. Thus, one can determine whether
a compound
forms a complex with the biological particles.
In some aspects of this embodiment, it is desirable to know the minimum
inhibitory
concentration, or binding affinity, of an active agent. The agent can be
complexed with the
biological particle at differing concentrations, and this information can be
obtained. Some
degree of extrapolation may be required, since the agent is conjugated to a
microparticle, and
therefore may behave differently than the native drug.
-42-
CA 02733296 2011-02-04
WO 2010/017001 PCT/US2009/050570
In other aspects of this embodiment, it is desired to know the selectivity of
an active
agent for one receptor over another. In this aspect, the agent can be
complexed with a
plurality of biological particles expressing differing receptors, and binding
information can be
obtained for each of the receptors. Thus, selectivity can be determined.
Determining Therapeutic Activity/Efficacy/Selectivity
In another embodiment, the method is used to identify therapeutic agents.
While
small molecules, proteins and peptides are not likely to be large enough to
see, even with this
technique, they can either be coupled to a microparticle, such as a latex
particle or magnetic
bead, which can be incubated with the molecules, or placed on a column.
In one aspect of this embodiment, a biological particle with a target for the
therapeutic
agent (i.e., a receptor) is placed in suspension, and microparticles
conjugated to one or more
putative therapeutic agents are added to the suspension.
If the therapeutic agent binds to the biological particle, the binding can be
observed
because the size of the complex of the biological particle and the conjugate
is greater than
that of the conjugate or the biological particle.
This technique can be used, for example, to determine the efficacy of specific
antibacterial or other drug candidates for a particular infection, or to
identify agents useful for
treating specific types of cancer. In one aspect of this embodiment, the
techniques are useful
for personalized medicine, where a particular patient's bacterial infection,
platelet or cancer
cells, or erythrocytes, are analyzed for their ability to bind to and interact
with specific
therapeutic agents. In another aspect of this embodiment, one can generate a
plurality of
spectra and compare the results, to determine minimum inhibitory
concentrations and,
therefore, useful dosage ranges for a given drug (where the drug is an
inhibitor).
VI. Methods for Identifying Patients Likely to Benefit from Treatment
Certain patients respond to therapy due to an interaction of a cellular
receptor with a
drug molecule. However, certain other patients have genetic mutations which do
not permit
the patients cells to bind to the drug molecule, thus rendering the drug
ineffective. To
determine whether a patient will respond to a given therapy, a solution of the
patient's cells
can be combined with a drug molecule of interest, where the molecule is bound
to a probe
-43 -
CA 02733296 2011-02-04
WO 2010/017001 PCT/US2009/050570
particle. microparticle or nanoparticle. If the drug molecule of interest
binds to the patient's
cells, then the concentration of the conjugate, and/or the patient's cells
will be lower, and a
new peak corresponding to the complex of the cells and the conjugate will be
observed. The
absence of a new peak corresponding to the complex of the cells and the
conjugate is
indicative that the patient will not respond to the particular drug therapy.
Thus, the method
can confirm that the patient will or will not achieve a benefit using the
particular drug
therapy. This enables a personalized medicine approach using rapid and
inexpensive
methods.
In one aspect of this embodiment, the cells are cancer cells from an
individual patient,
and sample media containing the cancer cells are incubated with a series of
therapeutic agents
bound to a microparticle or nanoparticle. Those therapeutic agents that form a
complex with
the cancer cells are potential candidates for personalized treatment of the
patient, since they
bind to and interact with the cancer cells. This technique can provide a
relatively quick and
inexpensive method for identifying patients who have certain mutations, such
as HER2
positive patients, patients whose cancer cells have vitamin D receptors,
patients with
estrogen-responsive cancer cells, and the like.
In another aspect of this embodiment, the cells are blood cells from a patient
suffering
from atherosclerosis, and who is being evaluated to see if his blood cells
will respond to
treatment with clopridogrel bisulfate (Plavix ). The interaction with the
blood cells and
clopidogrel bisulfate is a surface interaction, but a small percentage of
patients have a
mutation in their blood cells that inhibits the surface interaction with this
compound. For
most of those patients, there is an alternative therapeutic agent, but it is
important to identify
those patients before the symptoms worsen, possibly leading to a heart attack.
In this aspect,
blood cells of a patient are incubated with microparticles conjugated to
clopidogrel bisulfate,
and a spectrum is obtained using focused light scattering techniques. For
example interaction
of the probe particle can be between the ADP receptor and Plavix target, P2Y12
or to the
activation of the of VASP pathway. The presence of a complex between the
clopidogrel
bisulfate and the blood cells can be observed. Further, if the patient is
responsive to Plavix,
no activation will occur when ADP or other specific agonists are added to the
patient's
platelets. Thus, no activation will occur and specific activation epitopes,
like CD62,
glycoprotein alpha2, beta3, etc., will be detected by specific probe
particles. Because the size
of blood cells and the microparticle/clopidogrel bisulfate conjugate are
known, only one
-44-
CA 02733296 2011-02-04
WO 2010/017001 PCT/US2009/050570
spectrum needs to be obtained, and the only peak of interest is the peak
corresponding to the
complex of the conjugate with the blood cells.
VII. Methods for Performing High Throughput Bioassays
Any and all of these assays can be optimized for high throughput screening
using
suitable robotics. Liquid handlers can transfer samples to a multi-tube or
multi-well plate,
and a "memory map" can be used to correlate the samples to their location on
the plate.
Information on each sample can then be stored, and used to provide information
about drug
candidates, patient diagnoses, and proposed patient treatment options.
Robotics systems are known in the art, and can be used to move samples taken
from
individual patients to known positions in a multi-tube or multi-well plate.
Once information
on the sample is obtained using the focused light scattering techniques
described herein, the
information can be correlated to the individual patient via the stored
information correlating
the location of the tube and the patient identification. Liquid handlers can
take portions of
the sample and evaluate a plurality (i.e., at least two) of different
screening assays, for
example, by incubating portions of the sample with different microparticles,
bound to
different active agents.
Automated processes using known robotics to pull and place samples (like high
throughput screening) with use of a "memory map". A user can then pick desired
screens to
be run and the robotic apparatus will implement desired processes.
In another aspect of the embodiments described herein, the methods can be
automated
using robotics to pull and place samples (analogous to conventional high
throughput
screening methods), optionally in conjunction with a "memory map". A user can
then pick
desired screens to be performed, and the robotic apparatus can implement the
desired
processes. In this embodiment, a laboratory can be set up to automatically
screen numerous
samples.
In a preferred embodiment, the personalized medicine processes described
herein are
automated, to provide relatively inexpensive, and relatively fast, high
throughput screening
methods to identify preferred therapies for patients suffering from disease.
VIII. Reference Libraries
-45 -
CA 02733296 2011-02-04
WO 2010/017001 PCT/US2009/050570
A reference database of information gained by performing focused light
scattering on
known compounds can be used. One can compare the sample to the reference
database in
order to identify or characterize the particles in the tested sample. A
reference database
includes at least two, preferably more than ten, more preferably greater than
a hundred, and
most preferably, greater than a thousand bits of information on particle size
that can be used
to correlate the particle size measured using the techniques described herein
with particle
sizes for known biological particles that are stored in the reference
database.
The present invention will be better described with reference to the following
non-
limiting examples.
-46-
CA 02733296 2011-02-04
WO 2010/017001 PCT/US2009/050570
General Examples:
Process steps: 1) obtain sample of pleural fluid with suspected bacteria
presence; 2)
utilize focused light scattering to identify the presence of a bacteria by its
particle size and/or
shape, compare bacterial spectra with known bacterial spectra, which allows
one to identify
bacteria present in fluid; 3) add an antibody agent specific for a unique
marker on the now
known bacteria to confirm bacterial identity; 4) observe characteristic swim
rate (for
example, using EQELS) of flagella on certain bacteria to confirm bacterial
identity. One can
determine the binding constant of a putative antimicrobial agent, which can
help determine
the minimum inhibitory concentration (MIC) for a potential drug candidate. Not
all of the
above steps have to be used together every time. The above process is equally
applicable for
identifying viruses or fungi in a biological sample.
The following examples are intended to illustrate, but not limit the
invention.
Example 1: Detection of Microparticle's (MP) present in a biological sample.
In this example, a specimen is subject to particle sizing and counting. After
an
appropriate dilution of the sample, the diluted specimen is introduced into
the device for
analysis. As counting proceeds, counts will accumulate in the size region less
that 1 micron.
The appearance of MP in this size region will indicate the presence of MP's.
Example 2: Microparticle Characterization
Once MP's are detected, as described in Example 1, it may be important to
determine
the source of the MP (from platelets neutrophils, tumor cell, etc.). This
Example provides
two different options for characterizing the MP.
The first option is to use MP sizing and counts. In this case, the specimen is
incubated with a second particle with a specific ligand conjugated to its
surface. The choice
of the ligand will depend on the specific MP be characterized. For example, if
the MP of
interest has coagulation tissue factor (TF) on its surface, the conjugated
particle can be
conjugated with an antibody against TF-particle or with coagulation factor
FVIL Either
ligand will specifically bind to MP's with TF on their surfaces.
When the conjugated particles are incubated with the anti-TF conjugated
particles, a
new size corresponding to the TF-MP+anti-TF-particles will appear when the MP
and the
-47-
CA 02733296 2011-02-04
WO 2010/017001 PCT/US2009/050570
probe particle are counted. In a like manner, other MP's can be characterized
by developing
probe particles with a conjugated ligand specific for the MP of interest.
The second option is to use an EQELS device to analyze the MP's. The basic
procedure is the same, except that differences in the particles
electrophoretic mobility can be
analyzed.
Specifically, a baseline electrophoretic mobility of the MP can be obtained.
The MP
will then be mixed with the probe particle that is conjugated with the
specific ligand for the
MP of interest, or just with the ligand without conjugation to a probe
particle. When the
probe particle binds to the MP of interest, a difference in the
electrophoretic mobility is
observed. These data will provide a specific identification of the MP. If the
ligand alone was
used to bind to the MP, the EQELS data, in addition to IP of the particle,
will also provide
binding constants for the ligand to the MP.
Example 3: Determination of Cellular Activation
In this Example, the cellular activation, such as platelet activation, is
determined. A
baseline resting platelet run on the sizing-counting device is determined. The
platelet or cell
is then activated using appropriate agonists. Once activation occurs, new
surface epitopes
appear on the surface. In the case of the platelet DC62, CD41, various
integrins, and the like,
begin to appear.
A probe particle with a ligand for the specific epitope of interest is then
added to the
activated platelets (or other cells). The ligand can be an antibody, or small
molecule, that
specifically binds to the activated epitope. When binding occurs, a particle
is created (the
activated cell + the probe particle) which has a larger size than either the
activated cell or the
probe particle. The appearance of these new particles represents the
appearance of the
activated platelet + the bound probe particle.
Example 4: Microbe identification.
In this Example, microbes are identified using the techniques described
herein. The
microbe may be bacterial, viral, fungal, or protozoa. A sample containing a
microbe is
analyzed using the counting/sizing device described herein. The sample can be
from a water
supply, from a patient (human or animal), or other source. The size
distribution will be
determined, and compared to a database, to determine whether one or more of
the particles in
the sample fall into any of the sizes typical for known microbes. If so, a
probe particle
conjugated with a ligand that specifically binds to certain microbes can be
added. The
-48 -
CA 02733296 2011-02-04
WO 2010/017001 PCT/US2009/050570
identity of the microbe is confirmed when a new size distribution is obtained
when the
sample is incubated with the probe particle.
Additional verification can be obtained if the specimen is examined by EQELS,
where a swim rate is determined for flagellated organisms using the
velocimetry mode of the
EQELS device. The EQELS device can also determine the microbe's
electrophoretic
mobility. This information can be compared with data in an EQELS database for
further
confirmation of the identity of the particle.
If indicated, EQELS will then be used to help determine the appropriate
antimicrobial
(antibiotic, antiviral, etc) agent. A know concentration of antimicrobial
agent will be added
to the specimen. Binding of the agent to the microbe will be determined by a
change in the
microbe's electrophoretic mobility. Further, if the drug kills the microbe,
its surface charge
density changes resulting in a rather large change in the killed microbe's
electrophoretic
mobility.
Example 5: Drug Efficacy: Effectiveness of Cell Inhibition.
Specific example of Aspirin or/and P2Y12 inhibition of platelet activation
Platelet inhibition in arterial thrombophilic diseases is considered the
standard of care.
Unfortunately, in some patients, conventional drugs do not inhibit the
patient's platelets.
Approximately 25% of ASA-treated and 29% of Plavix-treated patients do not
respond to
treatment. Currently, there is no accepted assay to identify the
resistant/refractory patients.
The assay described herein can use particle sizing, based on the following
concept, to
identify resistant/refractory patients. The goal of treatment with anti-
platelet drugs is to
inhibit activation. When the platelet is activated, new surface epitopes
appear. So, in this
embodiment, the patient's platelets are first obtained as platelet rich plasma
(PRP). A
baseline measurement of the particle size and/or distribution is then made.
Next, an aliquot
of the patient PRP can be mixed with a platelet activator (agonist). If the
drug works, no
activation occurs. If it does not work, the platelet will activate. The assay
can then probe the
platelet surface for the appearance of new epitopes like CD62, CD41 and the
like. The
surface can be probed with a ligand (antibody or otherwise) that is conjugated
to a particle. If
binding occurs, the probe particle will bind with the activated platelet, and
a particle with a
different (larger) particle size (i.e., the activated platelet+conjugated-
probe particle) will
appear. If the drug works, no change in the particle size distribution will
occur.
-49-
CA 02733296 2011-02-04
WO 2010/017001 PCT/US2009/050570
Example 6: Lipid Droplets as Drug Delivery Vehicles.
Certain sized particles do not perfuse capillaries well. Since a typical
capillary is
approximately 2-3 microns in diameter, particles larger that that size must
have a surface to
volume ratio that will permit the distortion of the particle so that is can
enter the capillary
system; similar to a red blood cell. In this Example, particle sizing is used
to identify
particles which fall into a range that will not be perfused, and result in
potential malaise or
death to the patient. Further, the surface characteristics of some particles
lead to instability,
that may cause particle aggregation or fragmentation. Similar problems are
well recognized
in colloidal chemistry.
In this embodiment, drugs like AmbisomeTm, DaunosomeTm, Doxilf, or other
liposomal drug delivery vehicles, can be screened for a safe particle size
distribution prior to
infusion. The screen can identify particles by particle size and distribution,
so if relatively
large particles, corresponding to agglomerated liposomal or other particles
are observed, then
the sample can be rejected before being infused. Alternatively, the sample can
be subjected
to conditions which de-agglomerate the particles (for example, ultrasound and
the like), and
the sample re-tested. These assays can also be used to optimize the solution,
and particle
surface optimization for identifying the best lead compound(s).
Example 7: Small Molecule Distribution Assays. Specific examples of vWF or
serum
plasma.
vWF is a polydispersed molecule with a molecular weight distribution range of
500,000 to 20 million or even higher. Thus, there is a substantial difference
in the molecular
size distribution. Current technology requires a minimum of several days to
complete an
analysis.
In this embodiment, gold beads are conjugated with an anti-vWF antibody in a
manner that would bind one bead to one vWF multimer. Since the mass density of
the gold
bead results in more efficient light scattering, vWF molecules bound to the
gold beads will be
visible to the focused scattering sizing and counting device. Thus, the
presence of, and in
some embodiments, the amount of, vWF can be determined.
-50-
CA 02733296 2011-02-04
WO 2010/017001 PCT/US2009/050570
Although the invention has been described with reference to the above
examples, it
will be understood that modifications and variations are encompassed within
the spirit and
scope of the invention. Accordingly, the invention is limited only by the
following claims.
-51-