Note: Descriptions are shown in the official language in which they were submitted.
CA 02754643 2011-09-06
Method for operating a wind turbine
The invention concerns a method of operating a wind power
installation and a wind power installation for carrying out the method.
As state of the art attention is directed in particular to 'Grid
Integration of Wind Energy Conversion Systems', Siegfried Heier, 1998,
therein in particular pages 263 ff as well as US No 7 345 373 and WO
01/86143.
The most relevant state of the art is document WO 01/86143.
That document discloses the teaching of reducing the power of a wind
power installation when the network frequency, that is to say the frequency
of the network into which the wind power installation feeds its electrical
power, exceeds a given value above the target frequency.
In the case of Central European networks the target frequency is
usually at 50 Hz whereas in the case of US networks it is at 60 Hz.
At the same time however there are also always slight network
frequency fluctuations which are dependent on how greatly the ratio of the
power produced by the energy producers connected to the electrical network
is balanced out in relation to the power taken by the consumers, that is to
say those who are connected to the electrical network and take electrical
energy in order therewith to operate any electrical equipment.
If for example the power supply from the generators is above that
which the consumers connected to the network are taking in terms of power
the network frequency rises and conversely the frequency can also fall below
the target frequency, for example 50 Hz, if the power supply offered is less
than that which is being taken by the electrical consumers connected to the
network.
Network management, that is to say the management of producers
and also large consumers, is usually implemented by the network operators.
In that case network management can provide quite different regulating
mechanisms, for example for automatically switching on certain generators
(for example gas fired power stations), automatic switch-off of given large
CA 02754643 2011-09-06
2
consumers or also the use of pumped storage plants and the like. In normal
operation even the network management of large supply networks
constantly succeeds in keeping the network frequency in the region of the
target frequency, in which respect minor deviations are certainly allowed.
Those minor deviations however should generally not exceed the region of
1%0. It will be appreciated that the network management can also involve
switching on further networks which are connected to the network in order
thereby to feed additional power into the network or to take it from the
network and feed it into other networks.
For wind power installations, document WO 01/086143 - as already
stated above - already teaches reducing the power below the currently
available power if a given network frequency value is exceeded, for example
a value which is 3%o above the target value of the network frequency (for
example. over 50 Hz).
The document further teaches that, if the frequency continues to rise,
the power is linearly further reduced, in dependence on the further rise in
the network frequency.
Now the object of the present invention is to improve the operation of
a wind power installation in comparison with the state of the art and overall
to improve the network support of the wind power installation with respect
to the network.
According to the invention that object is attained by a method having
the features of claim 1. Advantageous developments are described by the
appendant claims.
According to the invention the wind power installation is now no
longer switched off on the fall of a given frequency value below the target
value of the network frequency, but the wind power installation continues to
be operated, more specifically with an increased power, that is to say quickly
and for a short period the power is higher than the power which was
previously fed into the network. For that purpose for example the rotational
energy stored in the moment of inertia of the rotar/generator system is
used, that is to say more power is taken briefly from the entire
rotor/generator system so that an increased level of power is quickly
CA 02754643 2011-09-06
3
available immediately upon the network frequency falling below the
predetermined target value. That also occurs when the wind power
installation had previously fed in at rated power, that is to say it had
delivered its normal maximum amount, namely the power that it can take
from the wind.
The amount by which the power is quickly increased is in a range of
up to 10 to 30% of the rated power, preferably about 20% of the rated
power.
The predetermined frequency value can be established for example by
presetting a deadband frequency. As soon as the network frequency is below
that deadband frequency the currently prevailing power of the wind power
installation is raised and the power delivered by the wind power installation,
more specifically fed into the network, is also raised. In that case the
deadband frequency is below the desired target frequency of the network by
the predetermined frequency value.
The predetermined frequency value is preferably greater than 1%o,
2%o or 3%o of the network target frequency. In the case of a 50 Hz network
target frequency therefore the system detects when the value falls below the
frequency of 49.95, 49.90 and 49.85 respectively.
Alternatively or in addition a relative frequency change can also be
considered, that is to say a relative frequency drop also denoted by df/dt or
a frequency gradient. If the magnitude of such a network frequency change
in relation to time is excessively great and therefore the frequency falls
excessively quickly the power which is currently to be fed into the network
can be briefly increased to support the network. Detecting such a frequency
change in relation to time, that is to say df/dt, may make it possible to more
rapidly detect a network frequency drop and thus possibly permits faster
recognition of the need for network support. Detection of an absolute
frequency value, that is to say when the value falls below an absolute
predetermined frequency value, and also the change in relation to time, can
also be combined. Thus for example it is possible for a fast network
frequency drop to be assessed as less critical if the absolute value of the
network frequency is above the rated frequency.
CA 02754643 2011-09-06
4
If in addition or also as an alternative a frequency gradient is
detected, it has proven to be desirable to provide for a power increase as
from a gradient of 0.1 Hz/s. An amount of change, that is to say a gradient
of 0.2 - 7 Hz/s, in particular 0.5 - 2 Hz/s, has proven to be an advantageous
range for initiating a power increase. Thus for example 0.2 Hz/s, 0.5 Hz/s, 1
Hz/s, 2 Hz/s and 5 Hz/s are advantageous values. It is to be noted that the
detection of a frequency gradient of for example 1 Hz/s usually does not
presuppose any measurement over the period of an entire second. Rather,
measurement times of 20 ms and less, in particular 10 ms, are suitable
measurement times. Shorter measurement times of for example 5 ms or
even shorter are also preferred values. In addition both the measurement
time and also the underlying amount of change or the underlying frequency
gradient can depend on the network target frequency. The above-mentioned
values for the frequency gradient and the measurement times provided for
same relate to a 50 Hz target frequency. In the case of a 60 Hz target
frequency a somewhat greater gradient and/or a somewhat shorter
measurement time can possibly be provided.
It is also to be mentioned that the short-term power increase can also
be used to stabilise or smooth the network frequency or to damp frequency
fluctuations. In particular damping of frequency fluctuations can
advantageously take account of the frequency gradient.
Preferably the short-term power increase is effected, utilising the
rotational energy stored in the moment of inertia of the rotor/generator
system. That therefore concerns taking kinetic energy which is stored both in
the rotating rotor which has one or more rotor blades, and also in the
rotating rotor member of the generator. Taking a higher amount of power
can be implemented in particular by increasing the exciter current and thus
by increasing the generator counter-moment of the generator rotor member.
In particular gearless generators with rotor members of large diameter and
thus large masses and correspondingly large moments of inertia can store a
considerable amount of kinetic energy.
Preferably the frequency of the power fed into the network always
corresponds to the currently prevailing network frequency. If therefore the
CA 02754643 2011-09-06
network frequency drops, a power increase can be effected, in which
case however the frequency of the feed into the network is reduced, adapted
to the currently prevailing frequency.
Preferably there is proposed a method characterised in that the
5 increase in the power is effected above the currently prevailing power, that
is to say also above the rated power, when previously the feed into the
network was with rated power. Therefore, even when the wind power
installation is operated in the rated mode, a power increase is effected upon
a critical drop in frequency. In that respect, it was realised that a rated
power which can usually also represent a maximum power at any event for
ongoing operation can be exceeded for short-term network support without
damage to the wind power installation.
In an embodiment it is proposed that the method is characterised in
that within a period of 10 to 1000 ms, in particular 20 to 500 ms, preferably
50 to 100 ms, after the frequency value falls below the predetermined
frequency value of the network frequency or after the predetermined amount
of change is exceeded the power increase is effected and/or the feed is
effected with an increased power, that is to say a power which is above the
previously set power, for a further period of at least 0.5 sec, preferably at
least 1 sec to a maximum of 30 sec, preferably at a maximum about 3 to 6,
8, 10, 12 or 15 sec. In principle a reaction time which is as short as
possible,
of for example 10 ms, is to be viewed as an idealised value for implementing
an increase in power. In particular the time of 10 ms corresponds to a half-
wave at a network frequency of 50 Hz. A longer response time of up to 1 sec
is desirable to prevent an over-reacting or indeed unstable system. In
particular values of 50 to 100 ms have proven to be an advantageous
compromise.
The power increase is required in principle for a short period of time.
That period of time usually lasts for at least 0.5 sec but preferably 1 sec
and
goes up to 3, 6, 8, 10, 12, 15 and a maximum of 30 sec. If an increased
power feed of more or markedly more than 10 sec is required, that is no
longer generally to be viewed as an instantaneous support measure, but
CA 02754643 2011-09-06
6
rather an increased power requirement. An effective range for
the power increase has proven to be at 3 to 6, 8, 10, 12 or 15 sec.
Preferably there is provided a method of controlling a wind park in
which each wind power installation is controlled in accordance with a method
according to the invention. In particular each wind power installation is
adapted to deliver an increased level of power to the network in the case of
a frequency dip. In that respect a wind park includes at least two wind power
installations but usually markedly more installations like 10 wind power
installations. 50 wind power installations or even more. Among all wind
power installations in the wind park however only those which are also
involved in the described method are to be considered.
Preferably in this case too the increase in the power delivered to the
network from all wind power installations is effected in unitary and/or
central
relationship. On the one hand that prevents different installations of a wind
park responding at different times and possibly impeding each other. In
addition wind parks can be subject to certain conditions such as limit values
for coupling to the network if the wind park feeds the power of all wind
power installations into the network at a network connection location. Thus
for example upper limits for the power fed into the network on the part of
the connection line can however possibly also be preset when using a central
transformer for same. A central control can take account of such boundary
conditions. Sometimes a unitary control of the wind power installations can
be helpful, if that is possible with different wind power installations in a
wind
park. Thus it is possible to implement at least partially unitary control for
example in regard to the response times and/or periods of the power
increase. If for example in a situation where all or most wind power
installations of a wind park are in the rated mode of operation a power
increase of all wind power installations should be limited because of a power
feed upper limit for the wind park, the control can be effected in such a way
that firstly a part of the wind power installations contribute to a power
increase and thereafter another part of the wind power installations do so. In
addition the level of control and regulating complication and expenditure can
be reduced by a central control unit which only delivers the corresponding
CA 02754643 2011-09-06
7
power target values to each wind power installation in the wind park for
example for a power increase.
In addition there is proposed a wind power installation adapted to use
a method according to the invention. Furthermore there is proposed a wind
park which includes a plurality of wind power installations according to the
invention and preferably uses a central control method and/or in which the
increase in the power of the wind power installations, that is to be delivered
to the network, is at least partially unitarily controlled. Central control
for the
increase in the power to be delivered to the network from all wind power
installations can be implemented by a separate central control unit and/or a
wind power installation can function as a master so that the other wind
power installations depend on that installation. In principle it is also
possible
for a wind park to be divided into a plurality of park portions, in regard to
control procedures, in order for example to bundle together installations of
the same or a similar type in each case, in terms of control procedures.
To increase the power delivery, not only is utilisation of the rotational
energy of the moment of inertia considered, but also as a support or possibly
exclusively, it is possible to effect a change in the setting angle of the
rotor
blades - a change in the pitch angle, referred to as pitching - to increase
the
wind yield. That is effected in particular when the wind power installation is
running under rated load, that is to say is already delivering rated power,
and in particular the rotor blades have already been partially pitched to
regulate the rated rotary speed.
After a power increase the speed of rotation of the rotor can have
reduced because kinetic energy has been taken. Particularly in the event of a
power increase in the case of a rated load mode of operation, such a
reduction can however be less or may not occur at all. A reduction in rotary
speed is to be expected in particular in the part-load range and then
depends on the level and duration of the power increase, that is to say the
power which is additionally delivered.
The invention is described in greater detail hereinafter by means of
embodiments by way of example with reference to the accompanying
Figures.
CA 02754643 2011-09-06
8
Figure 1 diagrammatically shows a partly opened pod of a wind
power installation with a diagrammatic view of the hub and parts of the
generator,
Figure 2 diagrammatically shows an overview with a gearless
rotor/generator coupling arrangement with frequency measurement,
Figure 3 shows an embodiment by way of example of a
power/frequency characteristic of a wind power installation,
Figure 4 shows an alternative embodiment to Figure 3,
Figure 5 shows an example illustrating power configurations for a
constant power increase,
Figure 6 shows an example illustrating power configurations in the
event of a power increase which is effected in dependence on the rotary
speed of the rotor,
Figure 7 shows an example illustrating measurement of a power in the
case of a power increase dependent on the rotary speed of the rotor,
Figure 8 shows measurement of a power with a constant power
increase, and
Figure 9 shows possible variations in the power values by which a
power increase is to be implemented in dependence on the frequency and for
different adjustable maximum values in respect of the power increase.
Hereinafter identical references can denote identical components but
also components which are similar and not identical. Hereinafter, for the
sake of completeness, a wind power installation having a synchronous
generator and a gearless design with a full-wave converter is described.
Figure 1 diagrammatically shows a pod 1 of a gearless wind power
installation. The hub 2 can be seen by virtue of the housing (spinner) being
shown partly open. Three rotor blades 4 are fixed to the hub, the rotor
blades 4 being shown only in their region near the hub. The hub 2 with the
rotor blades 4 forms an aerodynamic rotor 7. The hub 2 is mechanically
fixedly connected to the generator rotor 6, which can also be referred to as
the rotor member 6 and is referred to hereinafter as the rotor member 6.
The rotor member 6 is mounted rotatably with respect to the stator 8.
CA 02754643 2011-09-06
9
During its rotation relative to the stator 8 the rotor member 6 is
supplied with current, usually a direct current, in order thereby to generate
a
magnetic field and build up a generator moment or generator counter-
moment which can also be suitably set by that exciter current and can be
altered. When the rotor member 6 is thus electrically excited its rotation
relative to the stator 8 produces an electrical field in the stator 8 and thus
an
electrical alternating current.
The alternating current produced in the generator 10 which is
substantially made up of the rotor member 6 and the stator 8 is rectified by
way of a rectifier 12, in accordance with the structure shown in Figure 2. The
rectified current or rectified voltage is then converted by means of an
inverter 14 into a 3-phase system at the desired frequency. The three-phase
current-voltage system produced in that way is stepped up in particular in
voltage by means of a transformer 16 to be fed into a connected power
network 18. Theoretically it would be possible to omit the transformer or to
replace it by a choke. Usually however the voltage requirements in the
network 18 are such that it is necessary to step it up by means of a
transformer.
Control is effected by using a main control 20 which can also be
referred to as the main control unit and which forms the highest-level
regulating and control unit of the wind power installation. The main control
20 acquires its information inter alia about the network frequency from the
subordinated network measuring unit 22. The main control 20 controls the
inverter 14 and the rectifier 12. It will be appreciated that in principle it
would also be possible to use an uncontrolled rectifier. In addition the main
control 20 controls a direct current setting member 24 for feeding the exciter
current into the rotor member 6 which is part of the generator 10. The main
control 20 modifies inter alia the feed into the network or the working point
of the generator when the network frequency falls below a predetermined
network frequency limit value. As the generator is operated in rotary speed-
variable fashion the feed into the network is effected as described with a
full-
wave converter formed substantially by the rectifier 12 and the inverter 14.
CA 02754643 2011-09-06
In operation the network voltage and the network frequency is
permanently subjected to three-phase measurement by the network
measuring unit 22. A new value for one of the three phase voltages is
afforded from the measurement operation every 3.3 ms - at any event in
5 the case of a network frequency of 50 Hz. The network frequency is thus
detected each voltage half-wave, filtered and compared to the preset limit
values. For a 60 Hz system, a value for one of the three phase voltages
would be available approximately for every 2.7 ms, more specifically
approximately at each zero crossing.
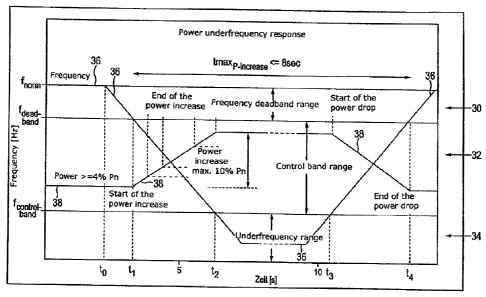
10 Figure 3 shows a diagrammatic example of a frequency configuration
and frequency ranges in relation to time, also showing an associated power
configuration.
It will be seen from Figure 3 that the main control distinguishes in
respect of frequency between three operating ranges, mainly the deadband
range 30, the control band range 32 and the underfrequency range 34. The
deadband range is the frequency range between the rated frequency fnorm or
fN and the deadband frequency fdeadband therebeneath. The rated frequency is
usually fixedly predetermined such as for example 50 Hz for the European
network system or 60 Hz in the US area. The deadband frequency fdeadband
can be adjusted whereby the deadband range can at any event be adjusted
in relation to that lower limit. No power increase is provided in the deadband
range.
The control band range 32 extends between the deadband frequency
fdeadband and the subjacent control band frequency fcontrolband. The control
band
range can be suitably set by predetermining both the deadband frequency
fdeadband and also the control band frequency fcontrolband= In the control
band
range, that is to say when the actual frequency assumes values in the
control band range, an increase in the effective power can be effected in
dependence on the frequency deviation, more specifically in particular the
actual frequency from the deadband frequency, by a power increase Pincrease=
In that case there is an effective power increase which is dependent in
particular proportionally on the frequency deviation. Thus the effective power
increase Pincrease is also a variable parameter of the control band range.
There
CA 02754643 2011-09-06
11
can thus be an increase in the effective power in dependence on the
frequency deviation by an additional power Pincrease of 0% to a preset value
Pincrease set= The maximum increase in the effective power can be preset by
means of Pincrease set, wherein Pincrease set can be increased from 0% to
Pincrease max in 1 % steps.
The underfrequency range 34 extends downwardly from the control
band frequency fcontrolband= When the actual frequency is below the control
band frequency fcontrolband then the maximum preset power increase is
implemented in the underfrequency range. The power increase Pincrease thus
assumes the maximum value which can be for example 10% of the rated
power.
Figure 3 shows in bold the configuration by way of example of the
actual frequency. The frequency initially has the value of the rated frequency
fnorm until it drops away at the time to. The configuration of the actual
frequency is identified by reference 36. A configuration by way of example of
a power to be set is also identified by reference 38. It is to be noted that
the
power must be at least 4% of the rated power for the control described
herein by way of example in order to be able to carry out the desired or at
least the desired maximum power increase.
The actual frequency 36 drops away at the time to, but is firstly in the
deadband range 30 so that no power increase takes place. The actual power
which is at least 4% of the rated power therefore initially remains constant.
At the time tl the actual frequency 36 reaches the deadband frequency
fdeadband and falls below same. In the illustrated example the power 38 rises
linearly with the further drop in the frequency 36. That is to say the power
increase Pincrease, namely the respective increase with respect to the initial
value PA, is here proportional to the difference between the actual frequency
36 and the deadband frequency fdeadband. The proportionality factor is so set
here that the power increase Pincrease reaches its maximum value of 10% of
the rated power Pn when the frequency reaches the control band frequency
fcontrolband. That is the case at the time t2. The power increase Pincrease
can thus
be specified in principle for the control band range with: Pincrease =
Pincrease set x
CA 02754643 2011-09-06
12
PN X (fdeadband - f) / (fdeadband - fcontrolband), insofar as further boundary
conditions like also maximum times are observed for a power increase.
If the frequency 36 falls further below the control band frequency
fcontrolband the power 38 cannot be further increased and thus from the time
t2
firstly remains at a maximum value, namely the initial value plus the
maximum value of Pincrease, namely + 10% of the rated power. If the
frequency now rises again and at time t3 exceeds the value of the control
band frequency fcontrolband, the power increase is thus also reduced again
until
the frequency 36 rises at the time t4 above the deadband frequency fdeadband.
At that time t4 the power has then reached the initial value PA again and
does not fall any further.
It is to be emphasised that Figure 3 shows an idealised configuration
and any regulating dynamics are initially disregarded. In addition, in the
stated example - contrary to the diagrammatic view - the maximum time
for which the power is increased should not exceed 8 sec. It is precisely in
the case of smaller power increases however that a prolongation of that time
can possibly be considered. It is to be observed that the linear frequency
drop and linear frequency rise were selected to illustrate the control diagram
and do not necessarily coincide with a frequency characteristic which is
usually to be expected in a power supply network.
Figure 3 shows a diagram illustrating the configuration of the network
frequency and as the reaction thereto the variation in the power feed from a
wind power installation.
It is moreover to be seen that, at a given time t1, the network
frequency dips and more specifically below a given frequency value below
the target frequency of about 50 Hz. If the frequency falls below a frequency
value of for example 1%o below the target value (and falls still further) the
power of the wind power installation is increased above its currently
prevailing value, for example by 20% of the currently prevailing power or by
up to 30% above the rated power, practically instantaneously, that is to say
in an extremely short time and for a short period, that is to say within a few
ms, for example 50 to 100 ms or also 500 to 1000 ms, to name a further
example. The example in Figure 3 is based on an increase by 10% in the
CA 02754643 2011-09-06
13
rated power. In the extreme case, when the power is just 4% of the
rated power and is increased by 10% of the rated power, at least
theoretically it would be possible to implement a power increase by 2.5
times the current power. That can be justified inter alia on the basis that,
even with a low power delivery, a comparatively high rotary speed and thus
a correspondingly large amount of rotational energy is already stored. Thus
for example at 4% rated power it is already possible to reach a rotary speed
of about 50% of the rated speed.
If many wind power installations behave as described hereinbefore
then a large amount of additional power is very quickly made available, with
the consequence that the producer/consumer inbalance is very quickly
compensated, with the further consequence that the network frequency rises
further very quickly and even quickly exceeds its target value.
In the illustrated embodiment the increased power feed into the
network is effected only for about 2 to 10 sec, preferably only about up to 3
sec, depending on how the frequency behaves.
If for example the frequency rises very quickly again then the
increased power feed can also be rather reduced again and concluded while
in contrast the increased power feed is effected for longer if the
underfrequency power feed remains for a longer period of time.
Figure 4 also shows the increased power feed for the situation in
which the power fluctuates, for example because the wind overall is
fluctuating. In addition Figure 4 also otherwise concerns a configuration
based on a behaviour which is really to be expected.
The frequency 36 is firstly at the rated frequency, namely 50 Hz. At a
time to* the frequency 36 then falls off very quickly and also, quite soon
falls
below the deadband frequency fdeadband. Figure 4 admittedly also involves the
situation where the frequency falls below the deadband frequency, but that
is detected only after the frequency has fallen below the selected deadband
frequency after a detection time Atdetect, wherein that detection time is at a
maximum 20 ms. The underfrequency is thus detected at time ti* as shown
in Figure 4 and the power 38 is thereupon increased. An increase time
Atincrease of < 800 ms elapses up to the maximum power increase of Pincrease
of
CA 02754643 2011-09-06
14
10% rated power above the power still prevailing at the time tl*. When
the frequency falls below the selected deadband frequency fdeadband the main
control, by virtue of internal control functions, provides for a power
increase
Pincrease of a maximum of 10% of the rated power of the wind power
installation from the generator for a preset time tmax. The recognition time
for the underfrequency is less than 20 ms. The level of the additional power
Pincrease is proportionally dependent on the set maximum permissible power
increase and the frequency deviation. The power is increased with a fixed
gradient of about 250 kW/s - insofar it is considered at any event on the
basis of the frequency deviation. In that way, in the case illustrated here, a
power increase to the maximum value of a maximum of 10% of the rated
power of the wind power installation is achieved in < 800 ms. The power
increase Pincrease is available over a time of a maximum of 8 sec. After at
the
latest 8 sec, the effective power of the wind power installation in the
illustrated example is restored at about 250 kW/s to the normal, in particular
previous working point.
Therefore, viewed from the time tl*, the maximum power increase is
thus achieved after about 800 ms at the time t2*. The maximum increased
power which is now set is held until the time t3* in order then to gradually
fall again until the time t4* to approximately the initial value or, in
dependence on wind, to a new value. The time from tl* to t4*, which can
also be referred to as tmaxP_increase, is a maximum of 8 sec for the
illustrated
example. It is to be noted that Figure 4 is also a diagrammatic view and
precise values including precise time values cannot be exactly read off
therein.
It is to be observed that the frequency 36 rises again during the
power increase, in particular after the time t2*, and this can also be
attributed to the power increase, that is to say to the power which is
additionally fed into the network. Nonetheless that crucially depends on the
respective network and the respective wind power installation, and in
particular on whether still further wind power installations implement such a
power feed into the network. Incidentally in the illustrated example however
the frequency does not rise to the rated frequency again within the power
CA 02754643 2011-09-06
increase range. Nonetheless, by virtue of the maximum time
achieved, the power increase is reduced and concluded.
For the increased power feed into the network, the wind power
installation according to the invention uses the rotational energy stored in
5 the rotating system comprising the rotor/generator, by virtue of the moment
of inertia. In other words, due to the additional amounts of power taken off,
above what is actually predetermined by the power characteristic of the wind
power installation, the overall rotor/generator system admittedly continues
to rotate, but it loses rotational energy and thus, after the increased power
10 feed into the network, rotates more slowly than previously because more
power was taken from the overall system than was delivered by the wind.
The behaviour according to the invention of the wind power
installation however in particular has the result that the critical
underfrequency situations are successfully managed or successfully bridged
15 over by existing wind power installations so that further network
management interventions can be initiated within the critical period of time
of for example 1 to 8 sec, in particular 1 to 3 sec, after the occurrence of
the
underfrequency situation, and such network management interventions,
after the wind power installation or installations (or entire wind park) has
or
have fed its or their additional power into the network, intervene in the
action thereof and successfully support the network.
The technical availability of the power increase P;ncrease in the case of a
network underfrequency is fundamentally given as from an instantaneous
power Pactual of 4% of the rated power. A power increase Pincrease by 10% with
respect to the rated power is then possible. A power increase of 200 kW for
a wind power installation by way of example is illustrated in principle
hereinafter in Figures 5 to 8. In this case 200 kW constitute 10% of the
rated power. In principle, it is possible to select between two options for
the
behaviour in respect of the power increase during frequency support, namely
between a frequency-dependent power increase as shown in Figure 5 and a
frequency-dependent and rotary speed-dependent power increase as shown
in Figure 6.
CA 02754643 2011-09-06
16
An embodiment which can also be described by reference to Figure 4
and the values of which are specified in Figure 4 can be described as follows.
In the case of frequency changes to below the deadband the required
power increase occurs with a fixed gradient of about 250 kW/s. A power
increase Pincrease of up to 10% of the rated power of the wind power
installation (WPI) is achieved after about 80 ms. In the case of small
frequency changes within the control band and in the power range below
500 kW the power gradient is slightly reduced by the generator-induced
behaviour upon power changes. The power increase Pincrease is available over
a time of a maximum of 6.4 s. After at the latest 7 s the effective power of
the WPI is set to the normal working point again at 250 kW/s. The control
stabilisation time is dependent on the wind conditions and the installation
rotary speed which is set during the implementation time. The transition to
the feed of power into the network in normal operation is concluded in about
1 s.
Figure 5 shows a target power Porder in relation to time for the situation
where no power increase would be implemented. That curve is also included
for the purposes of comparison. An underfrequency is detected at the time t8
in Figure 5 and a power increase of 200 kW is predetermined. That power
curve which is basically represented in an angular configuration is identified
by Pincrease. That power Pincrease rises at the time tB to that value
increased by
200 kW and keeps that value constant until the end time tE and then falls to
the value of the normal power target curve Porder. The normal power curve
Porder has in the meantime fallen away without that having an influence on
the curve Pincrease. The time between the initial time tB and the end time tE
is
about 8 sec. In addition, a power curve Pactuai is also shown, corresponding
to
the actually achieved value of the power fed into the network. As shown in
Figure 5 therefore the power increase Pincrease over the preset implementation
time tmax is proportional to the network frequency. That corresponds to a
power delivery independently of the rotary speed of the rotor of the wind
power installation, that occurs.
The following should also be additionally explained in relation to Figure
5: the power of the wind power installation only depends on the network
CA 02754643 2011-09-06
17
frequency during frequency support. In addition, the power increase
Pincrease which is required proportionally to the frequency deviation occurs
over the preset implementation time tmax. The total effective power delivery
Pactua is thus the total of the power in accordance with the rotary speed-
power characteristic at the moment in time of activation of inertia emulation
and required power increase Pincrease. The overall effective power delivery is
delimited by the maximum apparent power of the wind power installation.
Those limits of the wind power installation configurations are shown in the
power diagrams in illustrations 7 to 10.
In regard to the frequency-dependent and rotary speed-dependent
power increase as shown in Figure 6 the power increase achieved, in relation
to the preset implementation time, is proportional to the network frequency
and also varies in dependence on the rotary speed that is set in respect of
the rotor. In dependence on the wind speed and the rotor rotary speed, the
power increase is provided adapted to the rotary speed. The nomenclature
used in Figure 6 corresponds to that in Figure 5 and an underfrequency is
detected at the time tB and the power increase by about 200 kW is effected.
In the further variation up to the end time tE the rotary speed decreases and
therewith also the target power, without having regard to a power increase,
namely Porder. The power increase Pincrease maintains approximately a value of
200 kW above the respective current target power Porder= At the time tE the
power increase is then ended and the power Pactual falls to the value of the
target power Porder.
In addition as an explanation relating to Figure 6 attention is directed
to the following: the power of the wind power installation remains controlled
during frequency support with the predetermined rotary speed-power
characteristic in dependence on the wind speed. The overall effective power
delivery Pactua, over the preset implementation time tmax is thus the sum of
the currently prevailing rotary speed-dependent power P and the power
increase Pincrease required proportionally to the frequency deviation.
Figures 7 and 8 show measurements or recordings, corresponding to
Figures 6 and 5, of the power target value Pref and the actually set power
value Pactua,. In that respect the power target value Pref concerns the target
CA 02754643 2011-09-06
18
power, having regard to the power increase. The power configurations
shown in Figure 7 correspond in that respect to a frequency-dependent and
rotary speed-dependent power increase, similarly to that shown in Figure 6.
The power configurations shown in Figure 8 correspond to an only
frequency-dependent power increase, similarly to that shown in Figure 5. It
is to be observed that Figures 5 to 8 however each represent their own
specific configurations.
Figure 9 in relation to an embodiment shows various possible
frequency-dependent increases of Pincrease in dependence on the selected
value of Pincrease set= The three curves by way of example are identified by
Pincrease', Pincrease" and Pincrease"=
The additional power Pincrease is proportionally dependent on the
measured frequency deviation below the deadband frequency. The power
increase is increased linearly as from the deadband frequency fdeadband of 0%
to the preset power increase Pincrease-set upon reaching the control band
frequency fdeadband. In addition, when required by the network provider, the
preset power increase Pincrease-set can be predetermined in 1% steps of the
rated power to the maximum permissible power increase Pincrease max, from the
rated power. Pincrease-set is also not exceeded in the event of a major
frequency deviation. Frequency changes occurring during the implementation
time cause direct adaptations in respect of the power increase.
The ratio Pincrease / Prated in % can be illustrated, in dependence on the
actual frequency or measured frequency fineas and in dependence on the
value Pincrease set which is specified in %, with the following formula:
(Pincrease/Prated) ((fdeadband-fineas)/(fdeadband-fcontrolband))XPincrease_set
[%]
Table 1 specifies characteristic values or setting ranges for an
installation by way of example. In principle the deadband frequency can be
identified as fdeadband and the control band frequency as fcontrolband. The
power
increase can be identified as Pincrease or Pextra and the rated power as PN or
Prated- In the line 'maximum power increase' it is possible to select between
the use Pextra = constant or Pextra = variable, in dependence on whether a
CA 02754643 2011-09-06
19
frequency-dependent power increase or a frequency-dependent and rotary
speed-dependent power increase is to be used.
CA 02754643 2011-09-06
Table 1
Frequency measurement
Frequency resolution 0.01 Hz
Frequency accuracy 0.004 Hz
Frequency recognition t = 0.02 s
Frequency measurement 40 - 70 Hz
range
50 Hz network 60 Hz network
Maximum frequency fma = 57 Hz fm x = 67 Hz
Frequency range Rated frequency frated = 50 Hz frated = 60 Hz
Minimum frequency fm;n = 43 Hz fmin = 53 Hz
Inertia emulation at underfrequency
Maximum implementation 8 s
time of the increase
Detection time 0.02s
50 Hz network 60 Hz network
Deadband frequency 49 - 50 Hz 59 - 60 Hz
fdeadband
Control band frequency 47 - 50 Hz 57 - 60 Hz
fcontrolband
Power increase
Power increase Pin r 0 - 10% with respect to Prated
Max. power increase Pincrease 10% with respect to Prated
max
Setting option In steps of 1% with respect to Prated
Normal power Additional power
from 0% to 4% Prated Pextra 0
from 4% to 100% Prated Pextra = const Pextra 5 10%
Max. power increase Prated
from 4% to 100% Prated Pextra = Pextra 10%
variable Prated
Gradient of the power '-250 kW/s
change dP/dt
Recognition time 0.02 s
Rise time [for 200 kW] 0.8 s
Fall time or control < 1.0 s
stabilisation time s. above
Waiting time to next 2 x maximum duration of the increase
increase
5