Note: Descriptions are shown in the official language in which they were submitted.
CA 02761192 2011-12-07
26.0590
FILTERING ACOUSTIC WAVEFORMS IN DOWNHOLE
ENVIRONMENTS
Related Application
[0001] This patent claims the benefit of the filing date of United States
Provisional Patent
Application No. 61/420,778, filed on December 8, 2010, the entire disclosure
of which is
incorporated by reference herein.
Background of the Disclosure
[00021 In evaluating a subterranean formation, a downhole tool such as a
formation tester
may be lowered into a wellbore or borehole penetrating the formation and the
tool may be used
to measure one or more characteristics or parameters of the formation.
Acoustic testing is one
particularly useful manner of measuring formation parameters such as formation
slownesses,
which may be used to identify a formation of interest and evaluate the best
manner in which to
produce hydrocarbon fluids from the formation of interest.
[0003] A formation tester or formation testing tool may include an acoustic
transmitter and
an array of acoustic receivers distributed along a body of the tool. The
transmitter may emit
acoustic signals or waves, which then travel through the formation and may be
received by the
acoustic receivers. The times at which the acoustic receivers detect the
emitted acoustic waves
vary based on, among other things, the distances or spacing between the
receivers and the
slownesses of the materials through which the acoustic waves travel to reach
the receivers. As a
result, in general, an analysis of the manner in which acoustic signals are
received by an acoustic
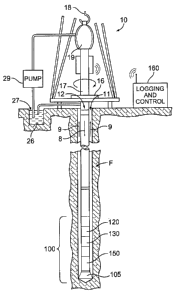
receiver array on a downhole tool can yield information about the properties
(e.g., slownesses) of
formation(s) adjacent to a borehole.
[0004] However, processing the acoustic signal information or data generated
as a result of
the acoustic signals or waves received by the acoustic receivers can present
certain difficulties.
For example, because of the various paths via which acoustic waves may reach
the receivers,
waves traveling via different paths and/or through different materials may
nevertheless overlap
in time and/or frequency when detected by the receivers. As a result,
analyzing a particular
signal of interest and/or removing or extracting a signal of interest from the
acoustic data may be
very difficult.
1
CA 02761192 2011-12-07
26.0590
Brief Description of the Drawings
[0005] The present disclosure is best understood from the following detailed
description
when read with the' accompanying figures. It is emphasized that, in accordance
with the standard
practice in the industry, various features are not drawn to scale. In fact,
the dimensions of the
various features may be arbitrarily increased or reduced for clarity of
discussion.
[0006] FIG. 1 is a wellsite system according to one or more aspects of the
present disclosure.
[0007] FIG. 2 is a logging-while-drilling system according to one or more
aspects of the
present disclosure.
[0008] FIG. 3 depicts an example wavelet casing arrival filter process
according to one or
more aspects of the present disclosure.
[0009] FIG. 4 depicts an example of wavelet transform applied to a monopole
waveform
recorded in a cased borehole.
[0010] FIG. 5 depicts an example of casing filtering according to one or more
aspects of the
present disclosure.
[0011] FIG. 6 depicts a Fast Fourier Transform of an acoustic signal.
[0012] FIG. 7 depicts a wavelet transform or map of the acoustic signal of
FIG. 6 according
to one or more aspects of the present disclosure.
[0013] FIG. 8 depicts an example method to obtain a coherence map and detect a
frequency/time range of a wave component of interest according to one or more
aspects of the
present disclosure.
[0014] FIG. 9 depicts stacking of wavelet maps at a reference receiver
according to one or
more aspects of the present disclosure.
[0015] FIG. 10 depicts an example coherence map for a known casing slowness
according to
one or more aspects of the present disclosure.
[0016] FIG. 11 depicts an example detected time/frequency range of the wave
component of
interest according to one or more aspects of the present disclosure.
[0017] FIG. 12 depicts an example method to find best frequency-slowness
relationships for
a casing according to one or more aspects of the present disclosure.
[0018] FIG. 13 depicts an example of frequency-slowness plane according to one
or more
aspects of the present disclosure.
[0019] FIG. 14 depicts an example method to extract a casing component
according to one or
more aspects of the present disclosure.
2
CA 02761192 2011-12-07
26.0590
[0020] FIGS. 15-17 depict the stacking of a subarray of wavelet maps from
input raw
waveforms containing only casing arrival according to one or more aspects of
the present
disclosure.
[0021] FIG. 18 depicts a comparison of slowness-time projections and slowness
logs of
cased-hole and open-hole data according to one or more aspects of the present
disclosure.
[0022] FIG. 19 is a flow diagram of an example method according to one or more
aspects of
the present disclosure.
Summary
[0023] According to one aspect of the present disclosure, an example method
comprises:
receiving acoustic waveform data representing acoustic signals traversing at
least a portion of a
borehole adjacent a subterranean formation; performing a direct transform
operation on the
acoustic waveform data to generate wavelet map data, the wavelet map data
comprising a time-
frequency representation of the acoustic waveform data; identifying a waveform
of interest via
the wavelet map data; extracting data associated with the waveform of interest
from the wavelet
map data; generating filtered wavelet map data based on the extracted data;
and performing an
inverse transform operation on the filtered wavelet map data to generate
filtered acoustic
waveform data.
[0024] In accordance with another aspect of the present disclosure, an example
method,
comprises: receiving acoustic data associated with a plurality of receivers
coupled to a downhole
tool; transforming at least some of the acoustic data to generate a respective
time-frequency data
set for each of the receivers; stacking the time-frequency data sets to form a
coherence data set;
identifying a portion of the coherence data set corresponding to arrival of a
particular type of
acoustic signal at the receivers; and filtering the received acoustic data
using the identified
portion of the coherence data set.
[0025] In accordance with another aspect of the present disclosure, an example
method
comprises performing a direct complex continuous wavelet transform on acoustic
data associated
with a plurality of receivers coupled to a downhole tool to form wavelet maps
corresponding to
each of the receivers; generating a coherence map based on the wavelet maps;
identifying a
casing arrival waveform via the coherence map; and removing the casing arrival
waveform from
the acoustic data to form filtered acoustic data.
3
CA 02761192 2011-12-07
26.0590
Detailed Description
[0026] It is to be understood that the following disclosure provides many
different
embodiments or examples for implementing different features of various
embodiments. Specific
examples of components and arrangements are described below to simplify the
present
disclosure. These are, of course, merely examples and are not intended to be
limiting. In
addition, the present disclosure may repeat reference numerals and/or letters
in the various
examples. This repetition is for the purpose of simplicity and clarity and
does not in itself dictate
a relationship between the various embodiments and/or configurations
discussed. Moreover, the
formation of a first feature over or on a second feature in the description
that follows may
include embodiments in which the first and second features are formed in
direct contact, and may
also include embodiments in which additional features may be formed
interposing the first and
second features such that the first and second features may not be in direct
contact.
[0027] One or more aspects of the present disclosure relate to filtering
acoustic waveforms in
downhole environments. More specifically, the methods and apparatus described
herein may be
used to extract and/or remove a wave component or signal of interest from an
acoustic waveform
' such as waveforms received via an array of acoustic receivers coupled to a
downhole tool. The
wave component pr signal of interest may, for example, be a casing arrival
waveform, which
may be extracted and/or removed (i.e., filtered) from the acoustic signals
received by the array of
= receivers. Removing such waveforms (e.g., a casing arrival waveform) from
the acoustic signals
or waveforms received by an acoustic receiver array coupled to a downhole tool
may enable
improved analysis of formation slownesses and/or other parameters or
characteristics of
subterranean formations.
[0028] In the examples described herein, a wave component or signal of
interest may be
extracted in time, frequency and slowness domains on a frame-by-frame basis.
Thus, the
processing speed of the examples described herein enables substantially real-
time processing of
acoustic signals or waves received by acoustic receiver arrays in a downhole
environment such
as wireline logging and/or logging while drilling operations. Further, the
examples described
herein employ direct and inverse wavelet transforms that enable independent
manipulation of
signals generated by acoustic receiver arrays at different frequencies (e.g.,
at each frequency of
interest). Thus, the examples described herein may be used to process
dispersive and non-
dispersive waves and may be applicable to any acoustic waveforms or signals
for which
slowness can vary with frequency.
4
CA 02761192 2011-12-07
26.0590
[0029] The example methods and apparatus described herein may receive acoustic
waveform
data representing acoustic signals traversing at least a portion of a borehole
adjacent a
subterranean formation and then perform a direct transform operation on the
acoustic waveform
data to generate wavelet map data. The acoustic waveform data may be received
via an array of
acoustic receivers coupled to a downhole tool in the borehole adjacent to the
subterranean
formation, and the direct transform operation may be a complex continuous
wavelet transform.
Thus, the wavelet map data comprises a two-dimensional time-frequency
representation or data
set of the acoustic waveform data (e.g., for each of the receivers of a
receiver array).
[0030] The examples described herein may then identify a signal or waveform of
interest via
the wavelet map data. The signal or waveform of interest may correspond to
particular type of
acoustic signal such as a signal moving along or through a casing of the
borehole such as a
casing arrival or, more generally, a shear wave or a compressional wave. To
identify the signal
or waveform of interest, the examples described herein may calculate coherence
data or
coherence data sets based on the wavelet map data and may use the coherence
data or data sets to
identify the waveform of interest. The coherence data may be calculated based
on the wavelet
map data by stacking wavelet map data or a data set for each of a plurality of
the acoustic signals
corresponding to respective acoustic receivers in the array of receivers to
generate coherence
map data or a coherence data set. To identify the waveform of interest a peak
coherence in the
coherence map data may be found or a pattern in the coherence map data may be
recognized
(e.g., via a person and/or machine).
[0031] Once the signal or waveform of interest has been identified, the
example methods and
apparatus may extract data associated with the waveform of interest from the
wavelet map data.
Such extraction may be performed by identifying a high coherence area in the
coherence map
data and identifying peak coherence values corresponding to a plurality of
frequencies and
slownesses to generate frequency-slowness data. The frequency-slowness data
may then be used
to extract the data associated with the waveform of interest by, for example,
generating wavelet
maps associated with the waveform of interest based on the frequency-slowness
data.
[0032] The examples may then generate filtered wavelet maps or map data based
on the
extracted data. The filtered wavelet map data may be either the extracted
signal itself or the
original signal or acoustic waveform minus the extracted signal (i.e., the
extracted signal may be
removed or subtracted from the original acoustic waveform). In one example
where the
downhole tool is lowered into a cased borehole, the waveform or signal of
interest may be an
CA 02761192 2011-12-07
26.0590
arrival at the acoustic array associate with the casing. In that example, the
casing arrival wave or
signal may be removed from the original acoustic waveforms or signals received
by the acoustic
array to generate filtered wavelet map data that better correspond to or
represent a slowness of
the subterranean formation.
[0033] The examples may then perform an inverse transform operation such as an
inverse
complex continuous wavelet transform on the filtered wavelet map data (e.g.,
stacked filtered
wavelet maps) to generate filtered acoustic waveform data. Additionally, in
accordance with the
example described herein, semblance processing may be performed on the
filtered acoustic
waveform data and, as noted above, the operations associated with the examples
described herein
may be performed on a real-time basis during a logging operation in the
borehole, for example.
[0034] In one example described herein, slowness information in a time-spacing
plane at
each frequency is used by processing array waveforms, for example, acquired at
receivers
attached or coupled to an acoustic measurement tool. This better enables or
facilitates the
separation of a wave component of interest from other wave components. The
time shift
property of the continuous wavelet transform allows time shifting of the
transformed or two-
dimensional signal and, as a result, coherent signals or coherences of the
array waveforms in the
time, frequency and slowness domains can be obtained using slowness and
receiver spacing(s).
In other words, to detect coherent signals of interest in time, frequency and
space domains, an
array of the converted two-dimensional complex signals can be stacked at a
reference receiver
position using time-shifting calculated from slowness and inter-receiver
spacing. This stacking
can be done using a full-array or a subarray (e.g., a subset) of the
receivers. Furthermore,
coherences may be calculated from the coherent signals, the number of
receivers and total signal
energy of every receiver used. The wave component of interest can be
identified in the three-
dimensional coherence data using peak finding, pattern recognition method
and/or by human
intervention.
[0035] The coherence data or value(s) may be used to identify a target wave in
the three-
dimensional domain and/or to extract/remove it from an array of two-
dimensional signals. Due
to the admissibility condition of the continuous wavelet transform, namely
that energy of the
time domain waveform is conserved in the two-dimensional signal (e.g., time-
frequency
domain), a reconstruction formula to reconstruct a temporal signal from its
wavelet transform
representation exists as set forth in more detail below.
6
CA 02761192 2011-12-07
26.0590
[0036] Generally, because the coherent signal may be averaged by the number of
receivers
used for the stacking, the target wave or waveform of interest in the detected
area may remain a
dominant component, thereby enabling extraction of substantially only the
coherent signal and/or
enabling removal of the signal from an array of original two-dimensional
signals using time
shifting calculated from the frequency-slowness relationships of the target
wave and inter-
receiver spacing. Finally, the extracted or filtered array waveforms may be
reconstructed by
inverse complex continuous wavelet transform. Additionally, to obtain
formation slowness in
cased borehole, zoning of the casing arrival time and application of the
existing band-pass filter
techniques may be used to facilitate the examples described herein.
[0037] FIG. 1 depicts a wellsite system including downhole tool(s) according
to one or more
aspects of the present disclosure. The wellsite drilling system of FIG. 1 can
be employed
onshore and/or offshore. In the example wellsite system of FIG. 1, a borehole
11 is formed in
one or more subsurface formations by rotary and/or directional drilling.
[0038] As illustrated in FIG. 1, a drill string 12 is suspended in the
borehole 11 and includes
a bottom hole assembly (BHA) 100 having a drill bit 105 at its lower end. The
BHA 100 may
incorporate a formation tester or sampling tool embodying aspects of the
example acoustic
filtering apparatus and methods described herein. A surface system includes a
platform and
derrick assembly 10 positioned over the borehole 11. The derrick assembly 10
includes a rotary
table 16, a kelly 17, a hook 18 and a rotary swivel 19. The drill string 12 is
rotated by the rotary
table 16, energized by means not shown, which engages the kelly 17 at an upper
end of the drill
string 12. The example drill string 12 is suspended from the hook 18, which is
attached to a
traveling block (not shown), and through the kelly 17 and the rotary swivel
19, which permits
rotation of the drill string 12 relative to the hook 18. A top drive system
may also be used.
[00391 In the example depicted in FIG. 1, the surface system further includes
drilling fluid
26, which is commonly referred to in the industry as mud, and which is stored
in a pit 27 formed
at the well site. A pump 29 delivers the drilling fluid 26 to the interior of
the drill string 12 via a
port in the rotary swivel 19, causing the drilling fluid 26 to flow downwardly
through the drill
string 12 as indicated by the directional arrow 8. The drilling fluid 26 exits
the drill string 12 via
ports in the drill bit 105, and then circulates upwardly through the annulus
region between the
outside of the drill string 12 and the wall of the borehole 11, as indicated
by the directional
arrows 9. The drilling fluid 26 lubricates the drill bit 105, carries
formation cuttings up to the
7
CA 02761192 2011-12-07
26.0590
surface as it is returned to the pit 27 for recirculation, and creates a
mudcake layer (not shown)
on the walls of the borehole 11.
[0040] The example bottom hole assembly 100 of FIG. 1 includes, among other
things, any
number and/or type(s) of logging-while-drilling (LWD) modules or tools (one of
which is
designated by reference numeral 120) and/or measuring-while-drilling (MWD)
modules (one of
which is designated by reference numeral 130), a rotary-steerable system or
mud motor 150 and
the example drill bit 105. The MWD module 130 measures the azimuth and
inclination of the
BHA 100 to enable monitoring of the borehole trajectory.
[0041] The example LWD tool 120 and/or the example MWD module 130 of FIG. 1
may be
housed in a special type of drill collar, as it is known in the art, and
contains any number of
logging tools and/or fluid sampling devices. The example LWD tool 120 includes
capabilities
for measuring, processing and/or storing information, as well as for
communicating with the
MWD module 130 and/or directly with the surface equipment, such as, for
example, a logging
and control computer 160.
[0042] The logging and control computer 160 may include a user interface that
enables
parameters to be input and or outputs to be displayed that may be associated
with the drilling
operation and/or a formation F traversed by the borehole 11. While the logging
and control
computer 160 is depicted uphole and adjacent the wellsite system, a portion or
all of the logging
and control computer 160 may be positioned in the bottom hole assembly 100
and/or in a remote
location.
[0043] FIG. 2 illustrates a sonic logging-while-drilling tool 208 that can be
the LWD tool
120, or can be a part of an LWD tool suite 120A of the type described in U.S.
Patent No.
6,308,137, incorporated herein by reference. Any suitable type of uphole or
downhole source or
transmitter can be provided. An uphole processor controls the firing of a
transmitter 214. The
uphole equipment can also include acoustic receivers and a recorder for
capturing reference
signals near the source. The uphole equipment further includes telemetry
equipment for
receiving MWD signals from the downhole equipment. The telemetry equipment and
the
recorder are typically coupled to a processor so that recordings may be
synchronized using
uphole and downhole clocks. The downhole LWD module 208 includes at least
acoustic
receivers 231 and 232, which are coupled to a signal processor so that
recordings may be made
of signals detected by the receivers in synchronization with the firing of the
signal source.
8
CA 02761192 2011-12-07
26.0590
[0044] One or more modules or tools of the example drill string 12 shown in
FIG. I and/or
the example tool 208 of FIG. 2 may employ the example apparatus described
herein. While the
example apparatus described herein are described in the context of drill
strings and/or wireline
tools, they are also applicable to any number and/or type(s) of additional
and/or alternative
downhole tools such as coiled tubing deployed tools.
[00451 A more detailed description of the use of a complex continuous wavelet
transform
(CWT) and reproducing kernel are now described. The wavelet filtering method
used in
conjunction with the examples described herein may be divided into two parts,
which are a
wavelet transform computation or operation and a waveform reconstruction
operation. The
wavelet transform operation transforms a time domain waveform into a two-
dimensional time-
frequency map or wavelet map. More specifically, as shown in Equations 1 and 2
below, the
wavelet transform S of a signal s (t) at a point (b, a) is the scalar product
of the signal by the
dilated and translated wavelet family g (t).
S(b,a)=<TbD [g(t)],s(t) >= I f s(t)g`(t ab)dt.
(1)
1
a
g(b, a)(t) = T bD'[g(t )] = 1 g(t- b ).
(2)
[0046] In Equations 1 and 2, b corresponds to the temporal localization
parameter, 1 /a
corresponds to the frequency with a being the scale parameter, which is
strictly positive, and g*
is the conjugate of g dilated in time of a (a > 0) and translated in time of
b. The choice of the
mother wavelet is free provided it respects the admissibility condition set
forth in Equation 3
below.
(Ig(~)IZ dw < w
0 w (3)
[0047] In Equation 3, g"' is the Fourier transform of g and co is the dual
variable of the time t.
The square of the modulus of the wavelet transform can be seen as an energy
density
concentrated in the time-frequency plane as set forth in Equations 4 and 5
below.
I s(tJ' dt = Cg-' f f I S(b, a)I2 dadb
a2 (4)
Cg = 27r f Ig(~)I2 dc o. IWI (5)
9
CA 02761192 2011-12-07
26.0590
[0048] In addition, due to the admissibility condition, a reconstruction
formula enables the
reconstruction of a time domain or temporal signal from its wavelet transform
representation
(Saracco, G., 1989, Acoustic propagation in harmonic and transient regime
through an
inhomogeneous medium: Asymptotic methods and Wavelet transforms, PhD thesis:
Acoustics &
Dynamic of vibrations, CNRS-UPR 7051-LMA & UER II, Campus de Luminy,
Marseille,
France), the entirety of which is incorporate by reference herein. Equation 6
below demonstrates
such a reconstruction.
s(t) _ ~i Cg' j JS(b, a)a'~zg t - b dadb
Z
a J a (6)
C
[0049] The CWT is non-orthogonal, <g (b, a), g (b', a')> # 0. As a result,
there exists a
reproducing kernel N. defined from Equations (1) and (5) as defined in
Equation 7 below.
Ng(b,a,v,u)=C91 < g(b, a), g(v, u) >. (7)
[0050] In addition, all wavelet coefficients verify the reproducing equation
as depicted in
Equation 8 below.
S(v,u)= f S(b,a)Ng(v,u,b,a) db2
a (8)
[0051] Wavelet filtering involves extracting from the time-scale half-plane, a
signal
component fi(t) from a signal s(t) composed by the sum of m waves fi (i = 1,
..., m) by using the
reproducing equation (Equation 8) and the properties of the reproducing kernel
and the CWT. A
mask Mfi (b, a) enables definition of a polygon function h associated with
each wave in the half-
plane (b, a) as depicted in Equation 9 below.
Mr (b, a) = 0, Esf(b,a) < x.
M f, (b, a) =1, ES f (b, a)
(9)
[0052] In Equation 9, Sf, is the wavelet coefficient of the signal component
fi (t) and x is the
energy threshold. Let Dh be the domain defined by the polygon function h, and
then the energy
pattern E related to a component f (t) can be expressed as shown in Equations
10 and 1 I below.
Esh = M f (b, a)Es, 1 nh = (10)
= f f 1 S f, a)I2 dadb < ~,_, f f IS (b a)12 dadb
ri ` a2 g Dh S ' a2 (11)
CA 02761192 2011-12-07
26.0590
[00531 In Equation 11, Ss is the total wavelet coefficient. Esfi is therefore
a function of finite
energy. Ss (b, a) and Sf, (b, a) verify the reproducing Equation (8). The
result is Equation 12
below.
f f S (v, u)(v, u, b, a) dude = ifs t, (v, u)N(v, u; b, a) dude = Sf (b, a)
(12)
[00541 The foregoing equations demonstrate that the inverse continuous
transform can be
used as set forth more generally above. The use of a progressive and modulated
Gaussian
function as analyzing wavelet (progressive Morlet type wavelet) enables
development of an
explicit formula of the reproducing kernel (Grossmann, A., Kronland-Martinet,
R., Morlet, J.,
1989, Reading and understanding continuous wavelet transform, Wavelet, Time-
frequency
Methods and Phase Space, Ed. JM Combes, A. Grossmann, P. Tchamitchian,
Springer-verlag,
Berlin), the entirety of which is incorporated by reference herein. This
analyzing wavelet is a
function well localized in the time-frequency domain. As a result, the
associated kernel is well
localized in the plane of the transform. Thus, in first approximation, the
reproducing kernel N
(bo, ao; b, a) can be considered as a delta function for the couples {ao, bo}.
[00551 This result demonstrates that by using a Morlet's wavelet, the form of
the mask is not
critical but, rather, it mainly facilitates considering all the energy
patterns of the signal to be
filtered. If the mask includes some information far from the energy pattern of
the signal, the
contribution coming from this far information will not affect the results of
the filtering.
Therefore it is possible to filter the component i of the signal s (t) using
the inverse continuous
wavelet transform based on the reconstruction formula set forth as Equation 13
below.
fi (t) = 9Cg 1 f f S1(b, a)a'l'gt - b ( a ) da adb
JJ (13)
[00561 The examples described herein may be applied to filter casing arrival
due to the
properties of the CWT and its reconstruction formula or any other signal of
interest for any time
of time series (seismic, borehole seismic, etc.). This processing enables
filtering of signals that
are close in time and frequency such as compressional and casing arrival
signals in a fast
formation.
[00571 Now turning in detail to FIGS. 3-5, the casing filtering example
described herein may
be composed of three main parts. First, the array waveforms are transformed
into time-
frequency domain. In practice it means that each waveform of the array is to
be mapped into the
time-frequency domain. Second, the casing arrival is identified in the maps
and then removed
11
CA 02761192 2011-12-07
26.0590
from the time frequency map. Third, the reconstruction formula is applied to
wavelet maps to
reconstruct time signals prior applying semblance processing to these filtered
waveforms where
the casing arrival has been removed. FIG. 3 shows the processing flow of the
wavelet casing
arrival filter. However, this workflow can be applied to remove other arrivals
of interest such as
compressional and shear waves. FIG. 4 shows how the different arrivals may
overlap in time
and frequency in the waveform., and FIG. 5 shows the filtered waveform
superimposed on the
extracted casing arrival waveform.
[0058] FIGS. 6 and 7 provide a comparison between an acoustic waveform that
has
undergone a Fast Fourier Transform (FIG. 6) and that same waveform having
instead undergone
a wavelet transform (e.g., transformed into a wavelet map or maps) (FIG. 7) as
described herein.
As can be seen in FIG. 7, the wavelet map enables the separation of components
overlapping in
frequency domain.
[0059] FIGS. 8-17 depict operations that may be performed in accordance with
the examples
described herein. In particular, FIGS. 8-11 show an example of casing arrival
detection in which
an estimate of casing slowness is known. For the casing arrival detection, as
set forth in Equation
14 below, coherence p can be computed to find the position of the casing in
time, frequency and
slowness plane due to the time shift property of the CWT.
f+Tx M' z
S;(a,t+s(i- j)S) dt
Pa(ts)
+rx
M f IS,(a,t+s(i-j)S)Izdt
(14)
[0060] Where Si is wavelet transformed waveform at i-th receiver, a
corresponds to the
frequency, t is the time, s is the slowness, 8 and j are respectively the
receiver spacing and
reference receiver number. M is the number of receivers and Tw at scale a is
the time width used
to compute the coherence. A high coherence area corresponds to a signal
propagating with a
slowness s across the array waveforms. The time range of casing can also be
estimated by zoning
the casing arrival time using the method described in U.S. Patent No.
6,868,341, the entirety of
which is incorporated by reference herein.
[0061] In real data, casing slowness may not be constant and may vary slightly
with
frequency. To find the best frequency-slowness relationship for the casing
signal, the highest
coherences are searched in the coherence map within detected time/frequency
and slowness
12
CA 02761192 2011-12-07
26.0590
range around known casing slowness. FIG. 13 shows an example of the frequency-
slowness
plane.
[0062] FIGS. 14-17 show example operations to extract the casing component
from input
array waveforms. Subarrays for each receiver may be prepared to compensate
amplitude
variations along the array. All subarrays are selected from one full-array of
receivers. Then,
wavelet maps of each subarray are stacked at center receiver position of each
subarray using time
shifting calculated from the best frequency-slowness and receiver spacing.
Finally, stacked map
at each receiver position is averaged by the number of receivers in the
subarray to obtain
coherent signal of a casing component. In performing casing component
subtraction, wavelet
maps containing only casing arrival are subtracted from array of wavelet maps
of raw
waveforms. As a result, wavelet maps keeping residual components other than
casing component
are obtained. The filtered waveforms may then be reconstructed from these maps
using the
reconstruction formula based on the inverse wavelet transform.
[0063] FIG. 18 shows an example of semblance processing applied to cased-hole
and open-
hole data recorded in the same section. The leftmost track presents the
processing results
obtained on cased hole data while middle track shows the semblance processing
result applied on
cased hole data after filtering of casing signal using the examples described
herein. The
rightmost track presents the processing results of the data recorded in the
openhole section prior
the casing was set. As can be seen in FIG. 18, the open hole processing
results are substantially
similar to the results obtained after performing the filtering operation as
set forth herein.
[0064] FIG. 19 depicts an example process or method 1900 that may be used to
implement
the teachings of this disclosure. Initially, the example method 1900 receives
acoustic waveform
data representing acoustic signals traversing at least a portion of a borehole
adjacent a
subterranean formation (block 1902). A direct transform operation (e.g., a
complex continuous
wavelet transform) is then performed on the acoustic waveform data to generate
wavelet map
data (block 1904). The examples described herein may then identify a signal or
waveform of
interest via the wavelet map data (block 1906). The signal or waveform of
interest may
correspond to particular type of acoustic signal such as a signal moving along
or through a casing
of the borehole such as a casing arrival or, more generally, a shear wave or a
compressional
wave. To identify the signal or waveform of interest, the examples described
herein may
calculate coherence data or coherence data sets based on the wavelet map data
and may use the
coherence data or data sets to identify the waveform of interest. The
coherence data may be
13
CA 02761192 2011-12-07
26.0590
calculated based on the wavelet map data by stacking wavelet map data or a
data set for each of a
plurality of the acoustic signals corresponding to respective acoustic
receivers in the array of
receivers to generate coherence map data or a coherence data set. To identify
the waveform of
interest a peak coherence in the coherence map data may be found or a pattern
in the coherence
map data may be recognized (e.g., via a person and/or machine).
[0065] The example method 1900 may then extract data associated with the
waveform of
interest from the wavelet map data (block 1908). Such extraction may be
performed by
identifying a high coherence area in the coherence map data and identifying
peak coherence
values corresponding to a plurality of frequencies and slownesses to generate
frequency-
slowness data. The frequency-slowness data may then be used to extract the
data associated with
the waveform of interest by, for example, generating wavelet maps associated
with the waveform
of interest based on the frequency-slowness data.
[0066] The example method 1900 may then generate filtered wavelet map or map
data based
on the extracted data (block 1910). The filtered wavelet map data may be
either the extracted
signal itself or the original signal or acoustic waveform minus the extracted
signal (i.e., the
extracted signal may be removed or subtracted from the original acoustic
waveform. In one
example where the downhole tool is lowered into a cased borehole, the waveform
or signal of
interest may be an arrival at the acoustic array associated with the casing.
In that example, the
casing arrival wave or signal may be removed from the original acoustic
waveforms or signals
received by the acoustic array to generate filtered wavelet map data that
better correspond to or
represent a slowness of the subterranean formation.
[0067] The example method 1900 may then perform an inverse transform operation
such as
an inverse complex continuous wavelet transform on the filtered wavelet map
data (e.g., stacked
filtered wavelet maps) to generate filtered acoustic waveform data (block
1912). Additionally,
semblance processing may be performed on the filtered acoustic waveform data
(block 1914)
and, as noted above, the operations associated with the examples described
herein may be
performed on a real-time basis during a logging operation in the borehole, for
example.
[0068] Although only a few example embodiments have been described in detail
above,
those skilled in the art will readily appreciate that many modifications are
possible in the
example embodiments without materially departing from this disclosure.
Accordingly, all such
modifications are intended to be included within the scope of this disclosure
as defined in the
following claims. In the claims, means-plus-function clauses are intended to
cover the structures
14
CA 02761192 2011-12-07
26.0590
described herein as performing the recited function and not only as structural
equivalents, but
also equivalent structures. Thus, although a nail and a screw may be not
structural equivalents in
that a nail employs a cylindrical surface to secured wooden parts together,
whereas a screw
employs a helical surface, in the environment of fastening wooden parts, a
nail and a screw may
be equivalent structures. It is the express intent of the applicant not to
invoke 35 U.S.C. 112,
paragraph 6 for any limitations of any of the claims herein, except for those
in which the claim
expressly uses the words "means for" together with an associated function.
[00691 The Abstract at the end of this disclosure is provided to comply with
37 C.F.R.
1.72(b) to allow the reader to quickly ascertain the nature of the technical
disclosure. It is
submitted with the understanding that it will not be used to interpret or
limit the scope or
meaning of the claims.