Note: Descriptions are shown in the official language in which they were submitted.
CA 02764637 2012-02-16
1
NON-INVASIVE MONITORING OF BLOOD METABOLITE LEVELS
BACKGROUND
[0002] The present disclosure relates to non-invasive monitoring of blood
metabolite levels of a patient. More specifically, the present disclosure
relates to
solutions for non-invasively monitoring blood metabolite levels of a patient
using a
sensor array and electromagnetic impedance tomography.
[0003] Blood metabolite levels, including glucose, lactic acid and hydration
levels,
are important indicators of health and the physical condition of a patient. In
non-
invasive blood-metabolite monitoring systerns, measurements of biological data
are
taken at the surface (epidermis) of a patient's body. These surface
measurements
are more sensitive to changes in the body than those invasive measurements
taken
at the layers below (e.g., dermis or subcutaneous layers). Fluctuations in
temperature, perspiration, moisture level, etc., can cause rapid and dramatic
variations in a patient's biological data. When attempting to determine
biological
data (i.e., blood metabolite levels) through the epidermis layer (using
sensors on the
skin), difficulties arise in compensating for these variations.
2
SUMMARY
[0004] Solutions are disclosed that enable non-invasive monitoring of blood
metabolite levels of a patient. In one embodiment, a method includes
repeatedly
measuring a plurality of electromagnetic impedance readings with a sensor
array from:
an epidermis layer of a patient and one of a dermis layer or a subcutaneous
layer of the
patient, until a difference between the readings exceeds a threshold;
calculating an
impedance value representing the difference using an equivalent circuit model
and
individual adjustment factor data representative of a physiological
characteristic of the
patient; and determining a blood metabolite level of the patient from the
impedance
value and a blood metabolite level algorithm, the blood metabolite level
algorithm
including blood metabolite level data versus electromagnetic impedance data
value
correspondence of the patient.
[0004.1] According to one aspect of the present invention, there is provided a
method of determining a blood metabolite level of a patient, the method
comprising:
repeatedly transmitting, using a sensor array, a plurality of electromagnetic
signals into
an epidermis layer of the patient and one of a dermis layer of the patient, or
the dermis
layer and a subcutaneous layer of the patient; repeatedly obtaining a
plurality of return
electromagnetic impedance readings, using the sensor array, from: the
epidermis layer
of the patient and the one of the dermis layer or the dermis layer and the
subcutaneous
layer of the patient, until a difference between the transmitted
electromagnetic signals
and the return electromagnetic impedance readings exceeds a threshold, wherein
the
threshold is equal to approximately a ten percent difference between the
transmitted
electromagnetic signals and the return electromagnetic impedance readings, and
exceeding the threshold indicates that the transmitted electromagnetic signals
penetrated at least one of the dermis layer, or the dermis layer and the
subcutaneous
layer; calculating an impedance value representing the difference between the
transmitted electromagnetic signals and the return electromagnetic impedance
readings
using an equivalent circuit model and individual adjustment factor data
representative of
a physiological characteristic of the patient; and determining the blood
metabolite level
CA 2764637 2017-06-14
2a
of the patient from the impedance value and a blood metabolite level
algorithm, the
blood metabolite level algorithm including blood metabolite level data versus
electromagnetic impedance data value correspondence of the patient.
[0004.2] According to another aspect of the present invention, there is
provided a
monitoring system for a blood metabolite level, the monitoring system
comprising: a
sensor array for repeatedly transmitting a plurality of electromagnetic
signals into an
epidermis layer of a patient and one of a dermis layer of the patient, or the
dermis layer
and a subcutaneous layer of the patient; a comparator for repeatedly obtaining
a
plurality of return electromagnetic impedance readings from: the epidermis
layer of the
patient and one of the dermis layer, or the dermis layer and the subcutaneous
layer of
the patient, from the sensor array, until a difference between the transmitted
electromagnetic signals and the return electromagnetic impedance readings
exceeds a
threshold, wherein the threshold is equal to approximately a ten percent
difference
between the transmitted electromagnetic signals and the return electromagnetic
impedance readings, and exceeding the threshold indicates that the transmitted
electromagnetic signals penetrated at least one of the dermis layer, or the
dermis layer
and subcutaneous layer; a calculator for calculating an impedance value
representing
the difference between the transmitted electromagnetic signals and the return
electromagnetic impedance readings using an equivalent circuit model and
individual
adjustment factor data representative of a physiological characteristic of the
patient; and
a determinator for determining the blood metabolite level of the patient from
the
impedance value and a blood metabolite algorithm.
[0004.3] According to another aspect of the present invention, there is
provided a
computer program product comprising a computer readable memory storing
computer
executable instructions thereon that when executed by a computer, performs the
following steps: instructs a sensor array to repeatedly transmit a plurality
of
electromagnetic signals into an epidermis layer of a patient and one of a
dermis layer
of the patient, or the dermis layer and a subcutaneous layer of the patient;
and
determines a blood metabolite level of the patient based on a plurality of
repeatedly
obtained return electromagnetic impedance readings collected from the
epidermis
CA 2764637 2017-07-18
2b
layer of the patient and one of the dermis layer, or the dermis layer and the
subcutaneous layer of the patient, the plurality of electromagnetic signals
being
repeatedly transmitted and the plurality of return electromagnetic impedance
readings
being repeatedly obtained until a difference between the plurality of
transmitted
electromagnetic signals and the plurality of obtained return electromagnetic
readings
exceeds a threshold, wherein the threshold is equal to approximately a ten
percent
difference between the transmitted electromagnetic signals and the return
electromagnetic impedance readings, and exceeding the threshold indicates that
the
transmitted electromagnetic signals penetrated at least one of the dermis
layer, or the
dermis layer and the subcutaneous layer, wherein the plurality of return
electromagnetic impedance readings are non-invasively collected from the
patient
using the sensor array.
[0004.4] The individual adjustment factor data may include information about
at least
one of: a weight of the patient, a sex of the patient, a body fat percentage
of the patient,
a heart rate of the patient, an age of a patient, and a race of a patient.
[0005] A first aspect of the invention provides a method comprising:
repeatedly
measuring a plurality of electromagnetic impedance readings with a sensor
array from:
an epidermis layer of a patient and one of a dermis layer or a subcutaneous
layer of the
patient, until a difference between the readings exceeds a threshold;
calculating an
impedance value representing the difference using an equivalent circuit model
and
individual adjustment factor data representative of a physiological
characteristic of the
patient; and determining a blood metabolite level of the patient from the
impedance
value and a blood metabolite level algorithm, the blood metabolite level
algorithm
including blood metabolite level data versus electromagnetic impedance data
value
correspondence of the patient.
CA 2764637 2017-07-18
CA 02764637 2016-07-19
2c
[0006] A second aspect of the invention provides a blood metabolite level
monitoring
system comprising: a sensor array for repeatedly measuring a plurality of
=
CA 02764637 2011-12-06
WO 2010/144313 PCT/US2010/037361
3
electromagnetic impedance readings from: an epidermis layer of a patient and
one of
a dermis layer or a subcutaneous layer of the patient, until a difference
between the
readings exceeds a threshold; a calculator for calculating an impedance value
representing the difference, the calculator including an equivalent circuit
model and
individual adjustment factor data representative of a physiological
characteristic of
the patient; and a determinator for determining a blood metabolite level of
the patient
from the impedance value and a blood metabolite level algorithm.
[0007] A third aspect of the invention provides a program product stored on a
computer readable medium, which when executed, performs the following: obtains
a
plurality of electromagnetic impedance readings about: an epidermis layer of a
patient and one of a dermis layer or a subcutaneous layer of the patient;
analyzes
the electromagnetic impedance readings to determine a difference; calculates
an
impedance value representing the difference using an equivalent circuit model
and
individual adjustment factor data representative of a physiological
characteristic of
the patient; and determines a blood metabolite level of the patient from the
impedance value and a blood metabolite level algorithm, the blood metabolite
level
algorithm including blood metabolite level data versus electromagnetic
impedance
data value correspondence of the patient.
[0008] A fourth aspect of the invention provides a blood metabolite monitoring
system comprising: a device that determines a blood metabolite level of a
patient
based on a plurality of electromagnetic impedance readings measured from the
patient within a single blood metabolite cycle of the patient.
[0009] A fifth aspect of the invention provides a method for monitoring a
blood
metabolite level of a patient, the method comprising: determining a blood
metabolite
CA 02764637 2011-12-06
WO 2010/144313
PCT/US2010/037361
4
level of a patient based on a plurality of electromagnetic impedance readings
measured from the patient within a single blood metabolite cycle of the
patient.
[0010] A sixth aspect of the invention provides a program product stored on a
computer readable medium, which when executed, performs the following:
determines a blood metabolite level of a patient based on a plurality of
electromagnetic impedance readings collected from the patient within a single
blood
metabolite cycle of the patient.
[0011] A seventh aspect of the invention provides a blood metabolite
monitoring
system comprising: a signal generator for transmitting an electromagnetic
signal; a
sensor array for: receiving the electromagnetic signal from the signal
generator and
applying the electromagnetic signal to a patient; and non-invasively measuring
a
plurality of electromagnetic impedance readings from: an epidermis layer of
the
patient and one of a dernnis layer or a subcutaneous layer of the patient; a
comparator for comparing a difference between the plurality of electromagnetic
impedance readings to a threshold; and a controller for controlling the signal
generator and the comparator, the controller providing instructions for
repeating the
transmitting, non-invasively measuring, and comparing in response to the
difference
being less than the threshold.
[0012] An eight aspect of the invention provides a program product stored on a
computer readable medium, which when executed, performs the following:
transmits
an electromagnetic signal to a sensor array; receives a plurality of
electromagnetic
impedance readings from the sensor array, the electromagnetic impedance
readings
being collected from: an epidermis layer of the patient and one of a dermis
layer or a
subcutaneous layer of the patient; compares a difference between the plurality
of
CA 02764637 2011-12-06
WO 2010/144313 PCT/US2010/037361
electromagnetic impedance readings to a threshold; and provides instructions
for
repeating the transmitting, receiving, and comparing in response to the
difference
being less than the threshold.
[0013] A ninth aspect of the invention provides a method for monitoring a
blood
metabolite level of a patient, the method comprising: transmitting an
electromagnetic
signal to a sensor array; receiving a plurality of electromagnetic impedance
readings
from the sensor array, the electromagnetic impedance readings collected from:
an
epidermis layer of the patient and one of a dermis layer or a subcutaneous
layer of
the patient; comparing a difference between the plurality of electromagnetic
impedance readings to a threshold; and repeating the transmitting, receiving,
and
comparing in response to the difference being less than the threshold.
BRIEF DESCRIPTION OF THE DRAWINGS
[0014] These and other features of this invention will be more readily
understood
from the following detailed description of the various aspects of the
invention taken in
conjunction with the accompanying drawings that depict various embodiments of
the
invention, in which:
[0015] FIG. 1 shows a block diagram of an illustrative environment and
computer
infrastructure for implementing one embodiment of the invention.
[0016] FIG. 2 shows a flow diagram of steps in monitoring a glucose level of a
patient according to embodiments of the invention.
[0017] FIG. 3 shows an underside view of a glucose monitor according to one
embodiment of the invention.
CA 02764637 2011-12-06
WO 2010/144313 PCT/US2010/037361
6
[0018] FIG. 4 shows an underside view of a glucose monitor according to
another
embodiment of the invention.
[0019] FIG. 5 shows a schematic diagram of a glucose monitor according to
embodiments of the invention.
[0020] FIG. 6 shows an underside view of a glucose monitor according to an
alternative embodiment of the invention.
[0021] FIG. 7 shows an equivalent circuit model diagram according to
embodiments of the invention.
[0022] FIG. 8 shows a top view of a glucose monitor according to an embodiment
of the invention.
[0023] FIG. 9 shows a block diagram of an illustrative environment and
computer
infrastructure for implementing one embodiment of the invention.
[0024] FIG. 10 shows a schematic side view of a sensor array according to an
embodiment of the invention.
[0025] FIG. 11 shows a table including test patterns used according to
embodiments of the invention.
[0026] FIG. 12 shows schematic side views of a sensor array corresponding to
the
test patterns of FIG. 11.
[0027] FIG. 13 shows a table including electromagnetic impedance values
obtained during testing according to embodiments of the invention.
CA 02764637 2011-12-06
WO 2010/144313 PCT/US2010/037361
7
[0028] FIG. 14 shows an equivalent circuit model used during testing according
to
embodiments of the invention.
[0029] It is noted that the drawings of the invention are not to scale. The
drawings
are intended to depict only typical aspects of the invention, and therefore
should not
be considered as limiting the scope of the invention. In the drawings, like
numbering
represents like elements between the drawings.
DETAILED DESCRIPTION
[0030] Shown and described herein are solutions for non-invasively monitoring
blood metabolite levels of a patient. It is understood that blood metabolite
level
information may be used to determine a plurality of physical conditions of a
patient.
While other blood metabolite levels such as hydration levels and lactic acid
levels
may be monitored using the solutions described herein, glucose levels are used
as
the primary illustrative example. It is understood that these solutions may be
easily
adapted, with undue experimentation, to monitor hydration levels, lactic acid
levels,
etc. of a patient. For example, the glucose monitoring system 106, glucose
determinator 126 and glucose monitor 140 shown in FIG. 1 and described herein,
may alternatively be configured to monitor, i.e., hydration and/or lactic acid
levels of
a patient.
[0031] Turning to the drawings, FIG. 1 shows an illustrative environment 100
for
monitoring a glucose level of a patient. To this extent, environment 100
includes a
computer infrastructure 102 that can perform the various processes described
herein. In particular, computer infrastructure 102 is shown including a
computing
device 104 that comprises a glucose monitoring system 106, which enables
CA 02764637 2011-12-06
WO 2010/144313 PCT/US2010/037361
8
computing device 104 to enable monitoring a glucose level of a patient by
performing
the steps of the disclosure.
[0032] Computing device 104 is shown including a memory 112, a processor unit
(PU) 114, an input/output (I/O) interface 116, and a bus 118. Further,
computing
device 104 is shown in communication with a glucose monitor 140 and a storage
system 122. In general, processor unit 114 executes computer program code,
such
as glucose monitoring system 106, which is stored in memory 112 and/or storage
system 122. While executing computer program code, processor unit 114 can read
and/or write data, such as electromagnetic impedance readings 144, to/from
memory
112, storage system 122, and/or I/O interface 116. Bus 118 provides a
communications link between each of the components in computing device 104.
[0033] In any event, computing device 104 can comprise any general purpose
computing article of manufacture capable of executing computer program code
installed by a user (e.g., a personal computer, server, handheld device,
etc.).
However, it is understood that computing device 104 and glucose monitoring
system
106 are only representative of various possible equivalent computing devices
that
may perform the various process steps of the invention. To this extent, in
other
embodiments, computing device 104 can comprise any specific purpose computing
article of manufacture comprising hardware and/or computer program code for
performing specific functions, any computing article of manufacture that
comprises a
combination of specific purpose and general purpose hardware/software, or the
like.
In each case, the program code and/or hardware can be created using standard
programming and engineering techniques, respectively.
CA 02764637 2011-12-06
WO 2010/144313 PCT/US2010/037361
9
[0034] Similarly, computer infrastructure 102 is only illustrative of
various types of
computer infrastructures for implementing the invention. For example, in one
embodiment, computer infrastructure 102 comprises two or more computing
devices
(e.g., a server cluster) that communicate over any type of wired and/or
wireless
communications link, such as a network, a shared memory, or the like, to
perform
the various process steps of the invention. When the communications link
comprises a network, the network can comprise any combination of one or more
types of networks (e.g., the Internet, a wide area network, a local area
network, a
virtual private network, etc.). Regardless, communications between the
computing
devices may utilize any combination of various types of transmission
techniques.
[0035] As previously mentioned and discussed further below, glucose monitoring
system 106 enables computing infrastructure 102 to determine a glucose level
of a
patient. To this extent, glucose monitoring system 106 is shown including a
comparator 110, a calculator 124, a determinator 126 and optionally, a
calibrator
128. Also shown in FIG. 1 is glucose monitor 140, which may include a sensor
array
142. Sensor array 142 may obtain electromagnetic impedance readings 144 from a
patient, which may be, for example, a human being. Glucose monitor 140 may
transmit electromagnetic impedance readings 144 to glucose monitoring system
106
and/or storage system 122. Operation of each of these components is discussed
further herein. However, it is understood that some of the various functions
shown in
FIG. 1 can be implemented independently, combined, and/or stored in memory for
one or more separate computing devices that are included in computer
infrastructure
102. Further, it is understood that some of the systems and/or functionality
may not
be implemented, or additional systems and/or functionality may be included as
part
of environment 100.
CA 02764637 2011-12-06
WO 2010/144313 PCT/US2010/037361
[0036] Turning to FIG. 2, and with continuing reference to FIG. 1, embodiments
of
a method for monitoring a glucose level of a patient will now be described. In
step
S1, sensor array 142 repeatedly measures a plurality of electromagnetic
impedance
readings 144 from an epidermis layer and one of a dermis or a subcutaneous
layer
of a patient until a difference between the readings exceeds a threshold.
Electromagnetic impedance readings 144 may include data gathered by measuring
the impedance (or "complex" impedance) of a body part of a patient to an
electromagnetic signal, such as, for example, an alternating current signal.
Electromagnetic impedance readings 144 may include impedance spectral data,
which may be obtained by measuring the impedance of a body part of a patient
across a range of frequencies. The range of frequencies may, for example be
between 100 Hz and 10 MHz. In one embodiment, the range of frequencies may be
between 100 kHz and 10 MHz. It is understood that frequency ranges may be
controlled by, for example, a signal generator which may send electromagnetic
signals to sensor array 142. In this case, signal generator may be a component
in
glucose monitoring system 106, glucose monitor 140, or a separate component
altogether. It is further understood that electromagnetic impedance readings
144
(e.g., potential differences) may be measured by a signal analyzer. For
example,
electromagnetic impedance readings may be measured by an impedance analyzer,
which may be a component in glucose monitoring system 106, glucose monitor
140,
or a separate component altogether.
[0037] Returning to FIG. 2, step Si may include two parts: 1) measuring a
plurality
of electromagnetic impedance readings 144 from an epidermis layer of a patient
with
sensor array 142; and 2) measuring a plurality of electromagnetic impedance
readings 144 from one of a dermis layer or a subcutaneous layer of the patient
with
CA 02764637 2011-12-06
WO 2010/144313 PCT/US2010/037361
11
sensor array 142. It is understood that plurality of electromagnetic impedance
readings 144 from one of a dermis layer or a subcutaneous layer of the patient
necessarily include data about the epidermis layer of the patient. As all
readings 144
described herein are obtained at the surface (epidermis layer) of a patient's
skin,
such readings will always include some data about the epidermis layer. For
example, a reading 144 "from" or "about" the subcutaneous layer of a patient
includes electromagnetic impedance data about the subcutaneous layer, the
dermis
layer (above the subcutaneous), and the epidermis layer (above the dermis
layer).
[0038] Sensor array 142 will now be explained with reference to FIGS. 3-6,
which
show examples of sensor array 142, 143, 144 having a plurality of sensors 240,
242,
250. As shown in FIG. 3, sensor array 142 may include current transmitting
sensors
240, 242, current receiving sensors 240, 242, and voltage sensors 250.
Operation of
each of these elements is discussed herein. While shown and described in
several
configurations, arrangements of sensor array 142 and sensors 240, 242, 250 are
merely illustrative. Current transmitting sensors 240, 242, current receiving
sensors
240, 242, and voltage sensors 250 may be positioned in sensor array 142 in
other
arrangements than those shown in FIG. 3. For example, voltage sensors 250 may,
for example, be positioned between current transmitting sensors 240, 242 and
current receiving sensors 240, 242 in a linear arrangement (FIGS. 4-5).
However,
current transmitting sensors 240, 242 and current receiving sensors 240, 242
may,
for example, be positioned between voltage sensors 250 in a linear
arrangement.
Further, sensor array 142 and sensors 240, 242, 250 may, for example, be
configured in other arrangements such as circular or arced arrangements. FIGS.
4-6
show alternative embodiments of sensor array 142. As shown in FIG. 3, sensor
array 142 includes sixteen sensors. However, sensor array 142 may contain
fewer
CA 02764637 2011-12-06
WO 2010/144313 PCT/US2010/037361
12
or greater numbers of sensors 240, 242, 250 than those shown. For example,
sensor array 143 of FIG. 4 includes eight sensors 240, 242, 250, while sensor
array
144 of FIG. 6 includes ten sensors 240, 242, 250. Sensor array 142 and sensors
240, 242, 250 may be formed of conductive materials including, for example,
silver/silver chloride, platinum or carbon. However, sensor array 142 and
sensors
240, 242, 250 may be formed of other conductive materials now known or later
developed. In one embodiment, sensors 240, 242, 250 may be conventional
electrodes capable of performing the functions described herein.
[0039] In any case, sensors 240, 242, 250 may be functionally interchanged on
sensor array 142. Interchanging of sensors 240, 242, 250 may not require
physical
removal and replacement of sensors, but may be performed through reprogramming
of sensor array 142 by glucose monitoring system 106. For example, sensor
array
142 may be reprogrammed by a user via glucose monitoring system 106, to change
sensor 242 from a current transmitting sensor into a current receiving sensor.
Further, sensor array 142 may be reprogrammed by a user to change sensor 242
from a current transmitting sensor into a voltage sensor. This
interchangeability will
be further explained with reference to FIGS. 4-6.
[0040] Turning back to FIG. 2, and step Si, sensor array 142 may repeatedly
measure plurality of electromagnetic impedance readings 144 from the epidermis
layer and one of the dermis layer or subcutaneous layer of a patient until a
difference
between the readings exceeds a threshold. Plurality of electromagnetic
impedance
readings 144 from the epidermis layer may be measured substantially
simultaneously with respect to one another, or may be measured consecutively.
Further, plurality of electromagnetic impedance readings 144 from one of the
dermis
CA 02764637 2011-12-06
WO 2010/144313 PCT/US2010/037361
13
layer or subcutaneous layer may be measured substantially simultaneously with
respect to one another, or may be measured consecutively. Additionally,
plurality of
electromagnetic impedance readings 144 from the epidermis and the dermis or
subcutaneous may be measured substantially simultaneously with respect to one
another. In one embodiment, plurality of electromagnetic impedance readings
144
from the epidermis and one of the dermis or subcutaneous layers may be
measured
within less than approximately six minutes of one another to ensure an
accurate
measure of the patient's glucose level. As is known in the art, the typical
glucose
cycle (cellular oscillations of glucose metabolism) of a human patient is
approximately two to six minutes long. In some patients, this glucose cycle
may be
as long as ten minutes. In this case, plurality of electromagnetic impedance
readings 144 may be measured within approximately ten minutes of one another.
Measuring plurality of electromagnetic impedance readings 144 within one
glucose
cycle of a patient provides an accurate measure of a glucose level of that
patient.
[0041] It is further understood that electromagnetic impedance readings 144
from
the epidermis layer and one of the dermis or subcutaneous layer are used as
"shallow" and "deep" readings, respectively. As used herein, the epidermis
layer
refers to the outer layer of the skin covering the exterior body surface of
the patient.
The dermis layer refers to a layer of skin below the epidermis that includes
the
papillary dermis and reticular dermis. The dermis layer also includes small
blood
vessels (capillary bad) and specialized cells, including eccrine (sweat)
glands and
sebaceous (oil) glands. The subcutaneous layer refers to a layer of skin
beneath the
epidermis and dermis layer that includes fatty tissue and large blood vessels.
While
the dermis and subcutaneous layers are described herein with reference to
"deep"
CA 02764637 2011-12-06
WO 2010/144313 PCT/US2010/037361
14
readings, it is understood that other layers of tissue below the epidermis may
provide
sufficiently "deep" readings as well.
[0042] As described with reference to FIG. 4, sensor array 143 may pass a
plurality of alternating current signals through different layers of the
patient. In one
embodiment, a signal generator (not shown) may generate an electromagnetic
signal
and transmit that signal to sensor array 143. In this case, signal generator
may be
any conventional signal generator known in the art. In another embodiment,
sensor
array 143 may include a signal generator which produces an electromagnetic
signal.
In another embodiment, current transmitting sensor 240 may include, or be
electrically coupled to, a conventional signal generator capable of producing
an
electromagnetic signal. In any case, current transmitting sensor 240 and
current
receiving sensor 242 create an electromagnetic circuit which uses the layer(s)
of the
patient as a conducting medium. As described herein, current transmitting
sensor
240 may produce an alternating current signal which is transmitted through the
layer(s) of the patient, and received by current receiving sensor 242. The
alternating-current signal may be within a frequency range that maximizes
extraction
of a glucose reading from the patient. This frequency may range from about 100
Hz
to about 10 MHz. When a signal is transmitted through a layer of the patient,
a
voltage differential may be measured within that layer. Voltage sensors 250
determine this voltage differential within the layer of the patient, and
glucose monitor
140 is capable of transmitting this voltage differential to glucose monitoring
system
106. It is understood that the number of voltage sensors 250 is merely
illustrative,
and that as many as 12 voltage sensors may be located in sensor array 143 or
other
sensor arrays 142, 144.
CA 02764637 2011-12-06
WO 2010/144313 PCT/US2010/037361
[0043] Turning to FIG. 5, a circuit diagram of glucose monitor 140 having
sensor
array 143 of FIG. 4 is shown. FIG. 5 includes current transmitting sensor 240,
current receiving sensor 242, and six (6) voltage sensors 250 (some labels
omitted).
The alternating current signal transmitted between current transmitting sensor
240
and current receiving sensor 242 is indicated by current distribution lines
270.
Equipotential surface lines 272 are also shown, indicating surfaces of
constant scalar
potential (voltage). Further, current measurement line ("I") and voltage
measurement lines "V1", "V2" and "V3" are shown, illustrating that current and
voltages may be measured across sensors 240, 242, 250, respectively. As shown
in
FIG. 4, voltage sensors 250 are located between current transmitting sensors
240,
242 and current receiving sensors 240, 242 in a linear arrangement. Three
"sets" of
voltage sensors 250 are illustrated by voltage measurements V1, V2 and V3. The
relationship between locations of sensors 240, 242, 250, along with properties
of the
underlying tissue (or, "material under test"), dictate the depth at which a
voltage may
be measured. In this illustrative example, intersections 280 may demonstrate
the
different depths at which a voltage can be measured by showing where
equipotential
surface lines 272 intersect current distribution lines 270. Intersections 280
indicate
that voltage sensors 250 farthest from current transmitting sensor 240 and
current
sensing sensor 242 are able to read voltage levels in the deepest tissue
layers. In
this case, V1 may represent a voltage reading across the epidermis layer of a
patient. V2 represents a deeper reading than V1, and may measure data about
the
dermis layer of the patient. V3 represents a deeper reading than V2, and may
measure data about the subcutaneous layers of the patient. As is understood
from
FIG. 5, interchangeability of sensors 240, 242, 250 may allow for measurements
of
different tissue layers through manipulation of sensor types.
CA 02764637 2011-12-06
WO 2010/144313 PCT/US2010/037361
16
[0044] FIG. 6 shows another alternative embodiment of glucose monitor 140
having sensor array 144. In this embodiment, two columns, each containing 5
sensors 240, 242, 250 are shown. Each column may include current transmitting
sensor 240, 242, current receiving sensor 240, 242, and three voltage sensors
250.
Voltage sensors 250 may be located between current transmitting sensor 240,
242
and current receiving sensor 240, 242 in a linear arrangement. Glucose monitor
140
may measure electromagnetic impedance readings 144 at different layers (i.e.,
epidermis, dermis, subcutaneous) using different combinations of voltage
sensors
250 within a row or between columns. As similarly described with reference to
FIGS.
3-5, types of sensors 240, 242, 250 in sensor array 144 may be interchanged
within
or between columns to allow for measurements of different tissue layers.
[0045] Returning to FIG. 2, in step S2, comparator 110 compares the difference
between the electromagnetic impedance readings to a threshold difference. The
threshold difference may be, for example, a single impedance value or an
impedance range which establishes that the difference (in impedance value)
contains enough information about the deep reading to determine a glucose
level of
the patient. The threshold difference may be determined by the location of
sensors
240, 242, 250 used to measure electromagnetic impedance readings, by the
signal-
to-noise ratio of the electronic components (not shown) within glucose monitor
140,
and by the characteristics of the material under test (patient tissue). In
order to
compensate for fluctuations in electromagnetic impedance readings 144 from the
epidermis layer, the difference must be great enough to provide sufficient
information
about the glucose level at one of the dermis layer or the subcutaneous layer.
CA 02764637 2011-12-06
WO 2010/144313 PCT/US2010/037361
17
[0046] In step S3A, in response to the difference being less than the
threshold
difference, the measuring and comparing steps are repeated until the
difference is
greater than the threshold difference. While described herein as a
"difference", this
value may be a complex mathematical value and/or a complex equation. The
difference may be calculated using an iterative process of measuring readings
144
from different layers of a patient and adjusting subsequent readings 144 based
upon
known relationships between layers. For example, in one embodiment, it is
unknown
if an initial alternating-current signal will penetrate beyond the epidermis
layer of a
patient. In this case, by adjusting locations of sensors 240, 242, 250 and
frequency
ranges, different electromagnetic impedance readings 144 may be obtained. From
those different electromagnetic impedance readings 144 and the known
relationships
between a patient's skin layers, penetration of different layers may be
determined.
In another embodiment, the difference may be calculated using one or more
mathematical evaluation techniques such as Nyquist or Neural Networks
techniques.
However, it is understood that any other known mathematical technique may be
used as well.
[0047] In step S3, in response to the difference being at least equal to the
threshold difference, calculator 124 calculates an impedance value
representing the
difference using an equivalent circuit model and individual adjustment factor
data.
The equivalent circuit model may resemble a traditional alternating current
(AC)
bridge circuit equation, whereby impedances of four elements of a circuit are
balanced when a "zero" or null reading is measured at the output. In this
case, the
equivalent circuit model uses plurality of impedance readings 144 from the
epidermis
layer and plurality of impedance readings 144 from one of the dermis layer or
subcutaneous layer as "elements" of the AC bridge. FIG. 7 shows an example of
an
CA 02764637 2011-12-06
WO 2010/144313 PCT/US2010/037361
18
AC circuit model 300 according to one embodiment of the invention. In this
case, the
balancing equation for the equivalent circuit model may be:
D = ((ZK / (ZJ + ZK)) - (ZM / (ZL + ZM))
[0048] In the example of FIG. 7, ZJ is a first electromagnetic impedance
reading
from the epidermis layer, ZK is a first electromagnetic impedance reading from
the
one of the dermis layer or the subcutaneous layer, ZM is a second
electromagnetic
impedance reading from the epidermis layer, ZL is a second electromagnetic
impedance reading from the one of the dermis layer or the subcutaneous layer,
and
D is the impedance value representing the difference. Particular sensors 240,
242,
250 within sensor array 140 used to obtain readings ZJ, ZM, ZK and ZL are
chosen
by comparator 110. Using this equation, calculator 124 may calculate the
impedance value representing the difference. It is understood that the
impedance
value representing the difference between readings from the epidermis and one
of
the dermis or subcutaneous layers is an impedance value representing one of
the
dermis or subcutaneous layers. Therefore, the impedance value D includes
information about the dermis or subcutaneous layer of the patient, and may be
used
to determine a glucose level of that patient, as described herein.
[0049] In step S4, determinator 126 determines a glucose level of the patient
from
the impedance value representing the difference and a glucose algorithm. The
glucose algorithm may include electromagnetic impedance versus glucose level
correlation information. For example, the glucose algorithm may be derived
from
empirical data gathered from patients and corresponding electromagnetic
impedance
values assigned to that empirical data. In this case, a plurality of patients
may be
tested via conventional glucose-testing techniques, such as the classic finger-
stick
CA 02764637 2011-12-06
WO 2010/144313 PCT/US2010/037361
19
approach (further described herein). The glucose-level determinations made
through the conventional test may then be paired with electromagnetic
impedance
values and further testing may be performed to evaluate these pairings.
Through
this iterative process, a range of electromagnetic impedances may be
correlated to a
range of glucose levels for a particular patient profile. For example, a
patient profile
may be established for a group of patients, with one such example profile
being:
Caucasian women, between the ages of 45-50, weighing 120-130 pounds, with 15-
18% body fat, etc. Where a patient falls within this profile, a glucose level
of the
patient may be determined using an impedance value representing the difference
between readings (epidermis and dermis/subcutaneous) measured from the
patient,
and a glucose algorithm tailored to the patient's profile. In another
embodiment, the
glucose algorithm may be specifically tailored to one patient. In this case,
the
glucose algorithm may be derived from empirical data gathered only from the
patient.
In contrast to the plurality of electromagnetic impedance readings gathered in
determining a glucose level of the patient, this empirical data (glucose-level
data and
electromagnetic impedance data) may be gathered over a period lasting longer
than
one glucose cycle of the patient. This patient-specific glucose algorithm may
provide
more accurate results in determining the patient's glucose level than a
glucose
algorithm for a general patient profile. In any case, determinator 126
determines a
glucose level of the patient from the impedance value representing the
difference
and a glucose algorithm.
[0050] In optional step S5, calibrator 128 may calibrate sensor array 142 by
comparing the glucose level of the patient to a known glucose level of the
patient.
The known glucose level of the patient may be obtained, for example, by a
classic
finger-stick approach. In this case, the patient's blood is taken by
puncturing the skin
CA 02764637 2011-12-06
WO 2010/144313 PCT/US2010/037361
of his/her fingertip, and collecting the blood, for example, in a vial. That
blood may
then be analyzed using traditional glucose measuring techniques to determine a
glucose level. A finger-stick is only one example of a traditional method in
which a
known glucose level of the patient may be obtained. A known glucose level of
the
patient may be obtained in a variety of other manners known in the art. In any
case,
the known glucose level may then be compared to the glucose level determined
by
the glucose determinator 126. In the case that the known glucose level and the
determined glucose level are not the same, calibrator 128 may calibrate
glucose
monitor 140 by making adjustments to sensor activity states and types. For
example, in sensor array 143 of FIG. 4, calibrator 128 may provide
instructions to
glucose monitor 140 to convert a pair of voltage sensors 250 into a current
transmitting sensor 240 and a current receiving sensor 242, respectively.
Calibrator
128 may further provide instructions to glucose monitor 140 to use a distinct
pair of
voltage sensors 250 for obtaining electromagnetic impedance data about the
patient.
Calibration may be performed without a restart of glucose monitoring system
106,
and a calibration queue or wait time may be indicated on a portion of display
342
(FIG. 8).
[0051] It is understood that calibrating of sensor array 142 may be performed
separately from the steps described herein. For example, calibrating of sensor
array
142 may be performed before the measuring step Si, and may be based on a
patient profile (which may include data representative of a physiological
characteristic of the patient). This patient profile may include information
such as the
patient's body weight, body fat percentage, age, sex, etc. The patient profile
may
further include patient-specific information such as, for example, skin
thickness
information and testing location information (e.g., forearm area, wrist, back,
etc.).
CA 02764637 2011-12-06
WO 2010/144313 PCT/US2010/037361
21
Using a patient profile, calibrator 128 may provide instructions to glucose
monitor
140 to use one or more voltage sensors and one or more sets of current
transmitting
sensors 240 and current receiving sensors 242 for obtaining electromagnetic
impedance data about the patient.
[0052] Turning to FIG. 8, a top view of glucose monitor 140 is shown. Glucose
monitor 140 may include a display 342, and a plurality of controls 344.
Display 342
may provide a glucose reading 346 ("Glucose Level: 500 ring/dL"), which is
visible to
the patient and others observing display 342. Glucose reading 346 may be
provided
in response to actuation of controls 344. In some cases, glucose reading 346
may
include historical glucose data, which allows a patient to view glucose data
over a
plurality of time intervals. Further, glucose reading 346 may provide
graphical
representations of glucose data in response to actuation of controls 344.
Additionally, glucose data may be stored and/or transferred to storage system
122
and/or computer device 104. It should also be understood that glucose monitor
140
and sensor arrays 142, 143, 144 may be at separate locations. For example,
sensor
arrays 142, 143, 144 may gather electromagnetic impedance readings 144 from
the
wrist, back, thigh, etc., of a patient and transmit electromagnetic impedance
readings
144 to glucose monitor 140. Glucose monitor 140 may transmit electromagnetic
impedance readings 144 to, for example, glucose monitoring system 106 using a
hard-wired or wireless connection.
[0053] FIG. 9 shows an illustrative environment 500 for monitoring a glucose
level
of a patient according to another embodiment of the invention. To this extent,
environment 500 includes a computer infrastructure 502 that can perform the
various
processes described herein. In particular, computer infrastructure 502 is
shown
CA 02764637 2011-12-06
WO 2010/144313 PCT/US2010/037361
22
including a computing device 504 that comprises a glucose monitoring system
506,
which enables computing device 504 to enable monitoring a glucose level of a
patient by performing the steps described herein. It is understood that as
compared
with illustrative environment 100 of FIG. 1, commonly named components (e.g.,
memory, calculator, storage system, etc.) may function similarly as described
herein
and referenced in FIG. 1.
[0054] As shown in FIG. 9, glucose monitoring system 506 may include a
comparator 510 (optionally), a calculator 524, a glucose determinator 526 and
a
calibrator 528 (optionally). Glucose monitoring system 506 is shown in
communication with storage system 522, and/or Glucose monitor 540, via
computing
device 504. Glucose monitor 540 may include comparator 510 (optionally), a
controller 541, a signal generator 543 and a transmitter 546. Glucose monitor
540 is
shown in communication with sensor array 542, which may obtain electromagnetic
impedance readings 544 from a patient (not shown).
[0055] In this embodiment, sensor array 542 may be a separate component from
glucose monitor 540 and glucose monitoring system 506. For example, sensor
array
542 may be a disposable array of electrodes, arranged in any configuration
described herein. As described herein, sensor array 542 may non-invasively
obtain
electromagnetic impedance readings 544 from a body part of a patient. Sensor
array 542 may be connected to glucose monitor 540 via hard-wired or wireless
means. In any case, sensor array 542 is capable of exchanging signals with
glucose
monitor 540 and/or a patient. In one embodiment, controller 541 may instruct
signal
generator 543 to generate an electrical signal (e.g., an alternating current
signal) and
transmitter 546 to transmit the electrical signal to sensor array 542. Signal
generator
CA 02764637 2011-12-06
WO 2010/144313 PCT/US2010/037361
23
543 and transmitter 546 may be any conventional signal generator and
transmitter
known in the art. In any case, after sensor array 542 receives the electrical
signal
from transmitter 546, sensor array 542 may measure a plurality of
electromagnetic
impedance readings 544 from a patient. Measuring of electromagnetic impedance
readings 544 may be performed in any manner described herein or known in the
art.
Sensor array 542 may return electromagnetic impedance readings 544 to glucose
monitor 540 via any conventional means (e.g., separate transmitter located on
sensor array 542). However, in the case that sensor array 542 and glucose
monitor
540 are hard-wired to one another, transmitter 546 and the transmitter located
on
sensor array 542 may not be necessary for exchanging electrical signals. In
any
case, sensor array 542 may transmit electromagnetic impedance readings 544 to
glucose monitor 540.
[0056] In one embodiment, comparator 510 is a component within glucose monitor
540. In this case, comparator 510 may function substantially similarly to
comparator
110 of FIG. 1. Upon instruction from controller 541, comparator 510 compares
the
electromagnetic impedance readings 544 to determine if a difference between
the
readings 544 exceeds a threshold. If the difference exceeds the threshold,
controller
541 may instruct transmitter 546 to transmit the electromagnetic impedance
readings
544 representing the difference to glucose monitoring system 506. If the
difference
does not exceed the threshold, controller 541 may instruct signal generator
543 and
transmitter 546 (optionally) to send additional electrical signals to sensor
array 542
for measuring additional electromagnetic impedance readings 544. Controller
541
and comparator 510 may repeat this process until a difference between the
readings
544 exceeds a threshold difference.
CA 02764637 2011-12-06
WO 2010/144313
PCT/US2010/037361
24
[0057] Glucose monitor 540 and glucose monitoring system 506 may be
connected by hard-wired or wireless means. In one embodiment, where glucose
monitor 540 is wirelessly connected to glucose monitoring system 506,
transmitter
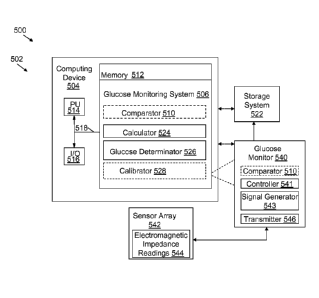
546 may transmit electromagnetic impedance readings 544 to glucose monitoring
system 506 using radio frequency (RF) wireless transmission. In any case,
glucose
monitor 540 transmits electromagnetic impedance readings 544 to glucose
monitoring system 506, which may function substantially similarly to glucose
monitoring system 106 of FIG. 1.
[0058] In an alternative embodiment, comparator 510 may be a component in
glucose monitoring system 506 (similarly shown and described with respect to
glucose monitoring system 106 of FIG. 1). In this case, comparator 510 may
communicate with glucose monitor 540, and specifically, with controller 541,
in order
to obtain electromagnetic impedance readings 544 that represent a threshold
difference. Once obtained, these readings 544 may be processed as described
with
reference to FIG. 1 (e.g., using calculator 524, glucose determinator 526,
etc.).
[0059] In another alternative embodiment (shown in phantom), glucose monitor
540 and its components may be incorporated into glucose monitoring system 506
(and/or computing device 504). In this case, illustrative environment 500
includes
two components: computing device 504 and sensor array 542. Here, computing
device 504 may be either hard-wired or wirelessly connected to sensor array
542,
and the functions of glucose monitor 540 may all be performed by glucose
monitoring system 506. In any case, glucose monitoring system 506, glucose
monitor 540 and sensor array 542 provide for non-invasive monitoring of a
patient's
blood metabolite (e.g., glucose) level.
CA 02764637 2011-12-06
WO 2010/144313 PCT/US2010/037361
[0060] EXAMPLES
[0061] The following provides particular examples of embodiments described
herein.
[0062] Example 1: Identification of Tissue Layers
[0063] The following is an illustrative example of experimental results
obtained
through the use of glucose monitor 140 having sensor array 143 of FIG. 4. All
sensors used in this experiment were disposable BIOPAC electrodes (BIOPAC
is a registered trademark of BIOPAC Systems Inc., Goleta, Ca), each electrode
having a diameter of 10.5 mm. FIG. 10 shows a schematic side-view of sensor
array
143, as used in this experiment. As described herein, each electrode in sensor
array
143 was assigned a number (1-8). Sensor array 143 was configured such that the
distance between electrodes (center-to-center) was X and the distance from the
center of electrode 1 to the center of electrode 8 was 7X (equal spacing
between
electrodes). In this example, measurements were obtained using sets of four
electrodes, including one current transmitting electrode, one current
receiving
electrode and two voltage sensing electrodes. FIG. 11 shows a table
illustrating nine
test patterns (A through I), used during the experiment. As illustrated in
FIG. 11,
entry "A" denotes a current transmitting electrode, entry "B" denotes a
current
receiving electrode, and entries "M" and "N" denote voltage sensing
electrodes. It is
understood that current transmitting electrode "A" may be interchanged with
current
receiving electrode "B" in all configurations. As such, for the purposes of
this
explanation, both current transmitting electrode "A" and current receiving
electrode
"B" will be referred to as "current carrying electrodes A and B."
CA 02764637 2011-12-06
WO 2010/144313 PCT/US2010/037361
26
[0064] This experiment was performed on a layer of animal skin tissue and a
plurality of layers of animal muscle tissue. Initially, the animal skin tissue
was placed
over the plurality of layers of animal muscle tissue and subjected to an
electrical
current. At differing points during this experiment, the animal skin tissue
was placed
between animal muscle tissue layers to determine depth of measurement. An
Agilent HP 4192A Impedance Analyzer ("impedance analyzer") was used to
measure the potential difference between the two voltage sensing electrodes (M
and
N) while the electrical current was transmitted between current carrying
electrodes A
and B. For the purposes of this experiment, a limited number of electrode
patterns
were selected. As such, two conditions were set: 1) current carrying
electrodes A
and B were to be outside voltage detecting electrodes M and N; and 2) the
distance
between electrodes A and M were to be equal to the distance between electrodes
N
and B in every configuration. Given these conditions nine possible patterns (A
through I) were used (FIG. 11). Using the impedance analyzer at a frequency of
100
kHz, electromagnetic impedance data was collected with each electrode pattern
(A
through l) for each configuration of skin tissue and muscle tissue. These
tests
indicated that the depth at which a measurement may be obtained depends on the
resistivity (i.e., 1/conductivity) of the material under test (i.e., skin
tissue) as well as
the configuration of the four active electrodes used to complete the
measurement. It
is known that when the distance between all electrodes (A, B, M, and N) is
equal, the
depth of measurement is equal to the distance between electrodes. Using the
sensor array 143 of FIG. 4, there are two instances when D(A-M)=D(N-B)=D(M-N).
This occurs in patterns A and E of FIG. 10. In pattern A, D(A-M)= D(N-B)=D(M-
N)=11.75 mm and in pattern E, D(A-M)= D(N-B)=D(M-N)=23.5 mm. Using this
theory, electrode pattern A would determine characteristics of tissue at a
depth of
CA 02764637 2011-12-06
WO 2010/144313
PCT/US2010/037361
27
11.75 mm and electrode pattern E would determine characteristics of tissue at
a
depth of 23.5 mm. However, conducting this experiment using patterns A and E
obtained slightly different results. Electrode pattern A was able to measure a
depth
of 9.5 mm, while electrode pattern E was able to measure a depth of 18.75 mm.
These are 19% and 20% deviations, respectively. These deviations were later
used
to calibrate sensor array 143 and determine different measurement depths based
upon the material under test and the electrodes used in sensor array 143.
[0065] Example 2: Tissue Volume Removal
[0066] Figure 12 shows a conceptual model of the measured tissue volumes and
their measured impedances. In this model, ZA represents the impedance
measurement and volume measured of pattern A and ZE represents the impedance
measurement and volume measured of pattern E. In this test, the distance
between
electrodes in pattern E is twice that the distance between electrodes in
pattern A (2X
versus X). Therefore, when removing the effect of ZA from ZE (determining the
difference between ZA and ZE), Z1 is equal to ZA in series with ZA, thus Z1 =
ZA ZA
(Equation 1 below). ZE is the parallel combination of Z1 and Z2, whereby the
parallel
combination equation is, ZE = (Z172) / (71 + Z2). Substituting for Z1 results
in, ZE =
(ZA ZA) * Z2
/ ((ZA + ZA) + Z2), where Z1 is the impedance value of the tissue from
the surface to a depth of X and Z2 is the impedance value of the tissue from a
depth
of X to a depth of 2X. In one test, X was equal to approximately 11.75
millimeters
(mm)., As the goal of the tissue volume removal was to remove the effect of 71
from
ZE, Equation 2 was derived from the equation for ZE (above), solving for Z2.
[0067] Zi = + (Equation 1)
CA 02764637 2011-12-06
WO 2010/144313 PCT/US2010/037361
28
Z1ZE
[0068] Z2 ¨ (Equation 2)
¨ZE
[0069] To confirm the model, a second test was performed, this time
concentrating
on patterns A and E and using only animal muscle tissue having an average
thickness of 24.61 mm. ZA and ZE were measured and Z1 and Z2 were calculated
using Equations 1 and 2 described above. These magnitude and phase values are
displayed in the table of FIG. 13. These magnitude and phase values help
characterize results when only measuring muscle tissue. As shown in Fig. 13,
the
muscle tissue limits are: Z1 = 1800 and 0.03 , Z2 = 4370 and -1.03 .
Therefore,
when Z1 and Z2 are greater than 1800 and 4370, respectively, a combination of
skin and muscle are being measured. As Z1 and Z2 approached these limits, it
was
understood that Z1 and Z2 were not able to differentiate between muscle and
skin
tissue.
[0070] Example 3: Tissue Volume Differentiation
[0071] Further tests were performed to determine differences between readings
from the epidermis layer and one of a dermis or subcutaneous layer of a
patient.
Using sensor array 143, electromagnetic impedance readings were measured from
a
standard sodium chloride solution of 140 mrnol/L. Given a homogenous volume of
sodium chloride solution, the relationships between the volumes measured by
various electrode pairs (FIG. 11) at a single frequency were empirically
derived,
whereby:
[0072] Z, = ki,ZG=kicZc (Equation 3)
[0073] ZG =kGcZc (Equation 4)
CA 02764637 2011-12-06
WO 2010/144313 PCT/US2010/037361
29
[0074] Where Z is the impedance of the patterns measured (I, G, C) and k,G,
kic
and kGc were calculated using the standard sodium chloride solution of 140
mmol/L.
To test whether these empirically derived relationships hold true for animal
tissues,
two tests were completed. Test A was conducted on animal muscle tissue having
a
thickness of 35 mm, where the k values of the homogenous muscle tissue were
consistent with the sodium chloride test (above). Test B was conducted with
the a
1.35 mm thick piece of animal skin tissue placed over the same animal muscle
tissue
as Test A. Using Equation 3, the impedance Z, was "distinct" from impedances
ZG
and Z. Using Equation 4, the impedance ZG was not "distinct" from impedance
Zc.
Electromagnetic impedances (Z) were considered "distinct" if the difference in
measured electromagnetic impedances was greater than 10%. The measured
electromagnetic impedance magnitude differences in Test B were:
[0075] 1) Percent difference between Z, and ZG 29%,
[0076] 2) Percent difference between Z, and Zc ¨ 37%, and
[0077] 3) Percent difference between ZG and Zc ¨ 7%.
[0078] Example 4: Tissue Volume Differentiation and Removal (VDR)
[0079] After determining that tissue volume differentiation and tissue volume
removal were separately possible, it is possible to conduct volume
differentiation and
removal (VDR). This approach included measuring four electromagnetic impedance
readings for each VDR approach. Specifically, two electromagnetic impedance
readings may be measured from the upper volume (i.e., epidermis), while two
electromagnetic impedance readings may be measured from the lower volume
(i.e.,
dermis or subcutaneous). After identification of different tissue volumes,
detailed
CA 02764637 2011-12-06
WO 2010/144313 PCT/US2010/037361
above, four measurements may be used in an equivalent circuit model to
calculate
electromagnetic impedance values representing the difference between the
volumes.
In one embodiment, two of the four measurements are from the shallow volume
(animal skin tissue), and another two are from the deep volume (animal skin
tissue &
animal muscle tissue). The equivalent circuit model is shown in FIG. 14, and
resembles a traditional alternating current (AC) bridge model, whereby
impedances
are "balanced" across a zero or null reading (D). In FIG. 14, according to one
embodiment, the electromagnetic impedances Z, Zm represent the shallow volume
(animal skin tissue) and the electromagnetic impedances ZK, ZL represent the
total
volume (i.e., shallow/deep volumes). From the AC bridge model, the following
equivalent circuit model equation was derived:
Zk Zm
[0080] D - (Equation 5)
j-FZk Zl + Z111
[0081] Where "D" is the electromagnetic impedance value representing the
difference between the shallow volume and the deep volume. By setting D to a
zero
value and measuring the electromagnetic impedance of the shallow volume and
deep volume, ratios between the impedance values were determined. In another
embodiment, ZJ, ZK, ZL and ZM may each represent electromagnetic impedances
from more than one volume. For example, ZJ may represent electromagnetic
impedance data about an epidermis layer and a dermis layer of a patient, while
ZK
may represent electromagnetic impedance data about the dermis layer and the
epidermis layer of the patient. In this case, further differentiation between
impedance readings (ZJ, ZK) is necessary to determine the difference D. In
this
case, impedance values ZJ and ZK can be divided into component parts (i.e.,
real
and imaginary parts) and differentiation may be performed.
CA 02764637 2011-12-06
WO 2010/144313 PCT/US2010/037361
31
[0082] In another case, assumptions may be made about impedance values and
their relationships to one another in order to facilitate determining the
difference D.
Looking at FIGS. 12-13, assumptions may be made about Z2, ZJ, and ZK in order
to
simplify determining the difference D. In this case, Z2 represents the
difference D,
while ZJ and ZK each represent some algebraic combination of ZA and ZE.
Mathematically, these assumptions are as follows: D = Z2 (FIG. 11); ZJ = ZM;
and
ZK = ZL. Using these assumptions and substituting into Equation 5 results in:
[0083] Z2 = ((Z1 * ZE) / (Z1 ¨ ZE)); and
[0084] ZK = ZJ * (Z1 * ZE + Z1 ¨ ZE) / (Z1 ¨ ZE ¨ Z1 * ZE).
[0085] While further modifications (assumptions and/or substitutions) are
necessary in order to solve for ZK in the preceding equation, those
modifications are
within the level of skill of one in the art.
[0086] While shown and described herein as a method and system for monitoring
blood metabolite levels (and more specifically, glucose levels) of a patient,
it is
understood that the disclosure further provides various alternative
embodiments.
That is, the disclosure can take the form of an entirely hardware embodiment,
an
entirely software embodiment or an embodiment containing both hardware and
software elements. In a preferred embodiment, the disclosure is implemented in
software, which includes but is not limited to firmware, resident software,
microcode,
etc. In one embodiment, the disclosure can take the form of a computer program
product accessible from a computer-usable or computer-readable medium
providing
program code for use by or in connection with a computer or any instruction
execution system, which when executed, enables a computer infrastructure to
determine a glucose level of a patient. For the purposes of this description,
a
CA 02764637 2011-12-06
WO 2010/144313 PCT/US2010/037361
32
computer-usable or computer readable medium can be any apparatus that can
contain, store or transport the program for use by or in connection with the
instruction execution system, apparatus, or device. The medium can be an
electronic, magnetic, optical, electromagnetic, infrared, or semiconductor
system (or
apparatus or device). Examples of a computer-readable medium include a
semiconductor or solid state memory, such as storage system 122, magnetic
tape, a
removable computer diskette, a random access memory (RAM), a read-only memory
(ROM), a tape, a rigid magnetic disk and an optical disk. Current examples of
optical
disks include compact disk ¨ read only memory (CD-ROM), compact disk ¨
read/write (CD-R/VV) and DVD.
[0087] A data processing system suitable for storing and/or executing program
code will include at least one processing unit 114 coupled directly or
indirectly to
memory elements through a system bus 118. The memory elements can include
local memory, e.g., memory 112, employed during actual execution of the
program
code, bulk storage (e.g., storage system 122), and cache memories which
provide
temporary storage of at least some program code in order to reduce the number
of
times code must be retrieved from bulk storage during execution.
[0088] In another embodiment, the disclosure provides a method of generating a
system for monitoring a glucose level of a patient. In this case, a computer
infrastructure, such as computer infrastructure 102, 502 (FIGS. 1, 9), can be
obtained (e.g., created, maintained, having made available to, etc.) and one
or more
systems for performing the process described herein can be obtained (e.g.,
created,
purchased, used, modified, etc.) and deployed to the computer infrastructure.
To
this extent, the deployment of each system can comprise one or more of: (1)
CA 02764637 2011-12-06
WO 2010/144313 PCT/US2010/037361
33
installing program code on a computing device, such as computing device 104,
504
(FIGS. 1, 9), from a computer-readable medium; (2) adding one or more
computing
devices to the computer infrastructure; and (3) incorporating and/or modifying
one or
more existing systems of the computer infrastructure, to enable the computer
infrastructure to perform the process steps of the disclosure.
[0089] In still another embodiment, the disclosure provides a business method
that
performs the process described herein on a subscription, advertising, and/or
fee
basis. That is, a service provider, such as an application service provider,
could
offer to determine a glucose level of an animal as described herein. In this
case, the
service provider can manage (e.g., create, maintain, support, etc.) a computer
infrastructure, such as computer infrastructure 102, 502 (FIGS. 1, 9), that
performs
the process described herein for one or more customers. In return, the service
provider can receive payment from the customer(s) under a subscription and/or
fee
agreement, receive payment from the sale of advertising to one or more third
parties,
and/or the like.
[0090] As used herein, it is understood that the terms "program code" and
"computer program code" are synonymous and mean any expression, in any
language, code or notation, of a set of instructions that cause a computing
device
having an information processing capability to perform a particular function
either
directly or after any combination of the following: (a) conversion to another
language,
code or notation; (b) reproduction in a different material form; and/or (c)
decompression. To this extent, program code can be embodied as one or more
types of program products, such as an application/software program, component
CA 02764637 2011-12-06
WO 2010/144313
PCT/US2010/037361
34
software/a library of functions, an operating system, a basic I/O
system/driver for a
particular computing and/or I/O device, and the like.
[0091] The foregoing description of various aspects of the invention has been
presented for purposes of illustration and description. It is not intended to
be
exhaustive or to limit the invention to the precise form disclosed, and
obviously,
many modifications and variations are possible. Such modifications and
variations
that may be apparent to a person skilled in the art are intended to be
included within
the scope of the invention as defined by the accompanying claims.