Note: Descriptions are shown in the official language in which they were submitted.
CA 02769462 2012-01-27
WO 2011/014349 PCT/US2010/041714
SERUM MARKERS PREDICTING CLINICAL RESPONSE TO
ANTI-TNFa ANTIBODIES IN PATIENTS WITH PSORIATIC ARTHRITIS
Priority
The instant application claims priority to US Provisional Application No.
61/228,994, which is incorporated by reference in its entirety.
BACKGROUND OF THE INVENTION
Field of the Invention
The present invention relates to methods and procedures for the use of serum
biomarkers to predict the response of patients diagnosed with psoriatic
arthritis to
treatment with anti-tumor necrosis factor alpha (TNFa) biologic therapeutics.
Description of the Related Art
The treatment of patients with psoriatic arthritis (PsA) with biologic
therapies such as golimumab (a human anti-human TNFa monoclonal antibody)
presents a number of challenges. The effectiveness of treatment and clinical
study
design is impacted by the ability to predict the PsA patients who will respond
and
which PsA patients will lose response following treatment with golimumab.
Surrogate markers or biomarkers may be useful in answering these questions.
Biomarkers are defined as "a characteristic that is objectively measured and
evaluated as an indicator of normal biologic processes, pathogenic processes,
or
pharmacologic responses to a therapeutic intervention." Biomarker Working
Group,
2001. Clin. Pharm. and Therap. 69: 89-95. The definition of a biomarker has
recently been further defined as proteins in which the change of expression
may
correlate with an increased risk of disease or progression, or which may be
predictive of a response to a given treatment.
Neutralization of TNFa through the addition of an anti-TNFa antibody or
biologic to in vitro or in vivo systems, can modify the expression of
inflammatory
cytokines and a number of other serum protein and non-protein components. An
anti-TNFa antibody added to cultured synovial fibroblasts reduced the
expression of
1
CA 02769462 2012-01-27
WO 2011/014349 PCT/US2010/041714
the cytokines IL-1, IL-6, IL-8, and GM-CSF (Feldmann & Maini (2001) Annu Rev
Immunol 19:163-196). Rheumatoid arthritis (RA) patients who were treated with
infliximab had decreased serum levels of TNFR1, TNFR2, IL-1R antagonist, IL-6,
serum amyloid A, haptoglobin, and fibrinogen (Charles 1999 J Immunol 163:1521-
1528). Other studies have shown that RA patients who are treated with
infliximab
had decreased serum levels of soluble (s)ICAM-3 and sP-selectin (Gonzalez-Gay,
2006 Clin Exp Rheumatol 24: 373-379), as well as a reduction in the levels of
the
cytokine IL-18 (Pittoni, 2002 Ann Rheum Dis 61:723-725; van Oosterhout, 2005
Ann Rheum Dis 64:537-543).
Elevated levels of C-reactive protein (CRP) have been observed in patients
with various immune-mediated inflammatory diseases. These observations
indicate
that CRP may have potential value as a marker for anti-TNFa treatment. St
Clair,
2004 Arthritis Rheum 50:3432-3443, showed that infliximab returned CRP to
normal levels in patients with early RA. In refractory psoriatic arthritis
(Feletar,
2004 Ann Rheum Dis 63:156-161), treatment with infliximab also returned CRP to
normal levels. CRP levels have also been shown to be associated with joint
damage
progression in early RA patients treated only with methotrexate (Smolen, 2006
Arthritis Rheum 54:702-710). When infliximab treatment was added to the
methotrexate treatment, the CRP levels were no longer associated with the
progression of joint damage.
Strunk demonstrated that infliximab treatment in RA patients reduced the
expression of inflammation-related cytokines such as IL-6, as well as
angiogenesis
related cytokines such as VEGF (vascular endothelial growth factor) (2006
Rheumatol Int.26:252-256). Ulfgren (2000 Arthritis Rheum 43:2391-2396) showed
that infliximab treatment reduced the synthesis of TNF, IL-i, and IL-Ibeta in
the
synovium within 2 weeks of treatment. Mastroianni (2005 Br J Dermatol 153:53 1-
536) showed that reductions in VEGF, FGF, and MMP-2 were associated with
significant improvement in the area and severity of psoriasis following
treatment
with infliximab. Visvanathan (Ann Rheum Dis 2008, 67:511-517;) showed that
infliximab treatment reduced the levels of IL-6, VEGF, and CRP in the serum of
2
CA 02769462 2012-01-27
WO 2011/014349 PCT/US2010/041714
PsA patients, and that the reductions reflected improved disease activity
measures.
Adipocytokines, leptin, and adiponectin have identified roles in T-cell
mediated
inflammatory processes have also been recently been examined in relationship
to
RA and response to anti-TNF therapy (Popa, et al. 2009, J. Rheumatol. 35: 274-
30).
Pre-treatment serum marker concentrations have also been associated with
response to anti-TNFa treatment. A low baseline serum level of IL-2R was found
to
be associated with the clinical response to infliximab in patients with
refractory RA
(Kuuliala 2006). Visvanathan (2007a) showed that the treatment of RA patients
with infliximab plus MTX induced a decrease in a number of inflammation-
related
markers, including MMP-3. The study data showed that baseline levels of MMP-3
correlated significantly with measures of clinical improvement one year post-
treatment.
Few markers have been examined with specific reference to psoriatic
arthritis. For example Fink (2007 Clin Experiment Rheum 25:305-308) compared
VEGF in patients with active or inactive PsA and healthy controls noting that
the
levels were significantly higher in patients with active disease as compare to
the
other two groups and correlated with patients' clinical monitoring scores such
as
VAS and PASI.
Therefore, while a number of serum protein and non-protein markers of
inflammation and systemic disease have been demonstrated to be modified during
anti-TNFa treatment, a unique set of markers and a predictive algorithm have
not,
thus far, been discovered which is predictive of response or non-response for
either
all inflammatory diseases so treated or for specific diseases, such as
psoriatic
arthritis.
SUMMARY OF THE INVENTION
The invention relates the use of multiple biomarkers to predict the response
of a patient to treatment with anti-TNFa therapy, and more specifically, to
determine
if a patient will or will not respond to treatment. In addition, the invention
can be
3
CA 02769462 2012-01-27
WO 2011/014349 PCT/US2010/041714
used to determine if a patient has responded to treatment, and if the response
will be
sustained. In one aspect, the invention encompasses the use of a multi-
component
screen using patient serum samples to predict the response as well as non-
response
of patients with PsA to treatment with a TNFa neutralizing monoclonal
antibody.
In one embodiment, specific marker sets identified in datasets from patients
with PsA prior to the initiation of anti-TNFa therapy, having been correlated
to
actual clinical response assessment, are used to predict clinical response of
PsA
patients tested prior to treatment with anti-TNFa therapy. In a specific
embodiment
the marker set is two or more markers selected from the group consisting of
adiponectin, MDC, PAP, SGOT, VEGF, lipoprotein A, and beta-2-microglobulin.
In another embodiment, specific marker sets identified in datasets from
patients with PsA prior to and following the initiation of anti-TNFa therapy,
having
been correlated to actual clinical response assessment, are used to predict
clinical
response of PsA patients prior to treatment with anti-TNFa therapy. In a
specific
embodiment the marker set is two or more markers selected from the group
consisting of adiponectin, MDC, PAP, SGOT, VEGF, lipoprotein A, and beta-2-
microglobulin.
The invention also provides a computer-based system for predicting the
response of a PsA patient to anti-TNFa therapy wherein the computer uses
values
from a patient's dataset to compare to a predictive algorithm, such as a
decision tree,
wherein the dataset includes the serum concentrations of one or more markers
selected from the group consisting of adiponectin, MDC, PAP, SGOT, VEGF,
lipoprotein A, and beta-2-microglobulin. In one embodiment, the computer-based
system is a trained neural network for processing a patient dataset and
produces an
output wherein the dataset includes one or more serum marker concentrations
selected from the group consisting of adiponectin, MDC, PAP, SGOT, VEGF,
lipoprotein A, and beta-2-microglobulin.
4
CA 02769462 2012-01-27
WO 2011/014349 PCT/US2010/041714
The invention further provides a device capable of processing and detecting
serum markers in a specimen or sample obtained from an PsA patient wherein the
serum marker concentrations selected from the group consisting of adiponectin,
MDC, PAP, SGOT, VEGF, lipoprotein A, and beta-2-microglobulin. In one
embodiment, the device compares the information produced by detection of one
of
adiponectin, MDC, PAP, SGOT, VEGF, lipoprotein A, and beta-2-microglobul into
an algorithm for predicting response or non-response to anti-TNFa therapy.
The invention also provides a kit comprising a device capable of processing
and/or detecting serum markers in a specimen or sample obtained from an PsA
patient wherein the serum marker concentrations selected from the group
consisting
of adiponectin, MDC, PAP, SGOT, VEGF, lipoprotein A, and beta-2-microglobulin
whereby the processed and/or detected serum marker level may be compared to an
algorithm for predicting response or non-response to anti-TNFa therapy.
BRIEF DESCRIPTION OF THE FIGURES
Figures 1-2 are PsA response prediction models shown in the form of a
decision tree based on the use of serum biomarkers and correlated to patient
clinical
responses assessed by ACRS20. The non-responder or "No" node means subjects in
that node are predicted by the model to be non-responders, while a "Yes" node
means subjects in that node are predicted by the model to be responders.
Within the
node, the number of actual non-responders and the number of actual responders
in
that node are shown separated by a "/" symbol.
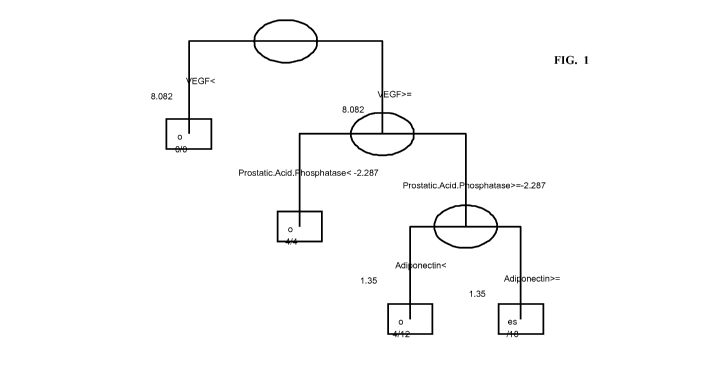
Figure 1 is a predictive model developed from baseline (Week 0) marker
data analyzed by multiplexed method from study patients receiving golimumab
using the ACR20 at Week14, where the initial classifier for a non-responder is
based
on VEGF (cutoff value < 8.08, log scale) and the secondary classifier for a
responder is based on VEGF (a cutoff value >= 8.08, log scale), a PAP a cutoff
value >= -2.29, log scale), and a tertiary classifier which is adiponectin (a
cutoff
value >= 1.35, log scale). A patient is also predicted to be a non-responder
based on
VEGF (cutoff value >= 8.08, log scale) and PAP < -2.29 or VEGF (cutoff value
>=
CA 02769462 2012-01-27
WO 2011/014349 PCT/US2010/041714
8.08, log scale), PAP >= -2.29 and adiponectin (cutoff value < 1.35, log
scale).
Figure 2 is a predictive model developed from the change from baseline
(Week 0) to Week 4 in marker level data analyzed by multiplexed method from
study patients receiving golimumab and in ACR20 at Week14 where the initial
responder criteria is the change in MDC (cutoff value >= -0.12, log scale) and
the
secondary classifier is the change in lipoprotein A (cutoff value < -0.23);
when the
change in lipoprotein A is greater than or equal to the cutoff value and the
change in
MDC is greater than or equal to the cutoff value, the patient is predicted to
be a
responder. Patients having a change in MDC < -0.12 are further classified
based on
the change in beta2-microglobulin (cutoff >= -0.11, log value) as responders
and if
the change in beta2-microglobulin is less than the cutoff value, as non-
responders.
DETAILED DESCRIPTION OF THE INVENTION
Abbreviations
ACR, American College of Rheumatology score
CART, classification and regression tree model
CRP, C-reactive protein
DAS28, Disease Activity Index Score using 28 joints
DIP, distal interphalangeal
EIA, Enzyme Immunoassay
ELISA, Enzyme Linked Immunoassay
G-CSF = granulocyte colony stimulating factor
HAQ, health assessment questionnaire
MAP, multi-analyte profile
MDC, Macrophage-Derived Chemokine
NAPSI, nail psoriasis severity index
PAP, prostatic acid phosphatase
6
CA 02769462 2012-01-27
WO 2011/014349 PCT/US2010/041714
PASI, psoriatic arthritis severity index
PsA, psoriatic arthritis
SELDI, Surface Enhanced Laser Desorption and Ionization
SAP, serum amyloid P component
SGOT
TNFa/TNFa, Tumor Necrosis Factor alpha
TNFR, Tumor Necrosis Factor receptor
VEGF, Vascular Endothelial Growth Factor
IL, Interleukin
IL-1 R, IL-1 receptor
VAS, visual analog score
Definitions
A "biomarker" is defined as `a characteristic that is objectively measured and
evaluated as an objective indicator of normal biological processes, pathogenic
processes, or pharmacologic responses to a therapeutic intervention' by the
Biomarkers Definitions Working Group (Atkinson et al. 2001 Clin Pharm Therap
69(3):89-95). Thus, an anatomic or physiologic process can serve as a
biomarker,
for example, range of motion, as can levels of proteins, gene expression
(mRNA),
small molecules, metabolites or minerals, provided there is a validated link
between
the biomarker and a relevant physiologic, toxicologic, pharmacologic, or
clinical
outcome.
By "serum level" of a marker is meant the concentration of the marker
measured by one or more methods, such as an immunoassay, typically ex vivo on
a
sample prepared from a specimen such as blood. The immunoassay uses
immunospecific reagents, typically antibodies, for each marker and the assay
may be
performed in a variety of formats including enzyme-coupled reactions, e.g.,
EIA,
ELISA, RIA, or other direct or indirect probe. Other methods of quantifying
the
7
CA 02769462 2012-01-27
WO 2011/014349 PCT/US2010/041714
marker in the sample such as electrochemical, fluorescence probe-linked
detection,
are also possible. The assay may also be "multiplexed" wherein multiple
markers
are detected and quantitated during a single sample interrogation.
Observational studies usually report their results as odds ratios (OR) or
relative risks. Both are measures of the size of an association between an
exposure
(e.g., smoking, use of a medication, etc.) and a disease or death. A relative
risk of
1.0 indicates that the exposure does not change the risk of disease. A
relative risk of
1.75 indicates that patients with the exposure are 1.75 times more likely to
develop
the disease or have a 75 percent higher risk of disease. A relative risk of
less than 1
indicates that the exposure decreases risk. Odds ratios are a way to estimate
relative
risks in case-control studies, when the relative risks cannot be calculated
specifically. Although it is accurate when the disease is rare, the
approximation is
not as reliable when the disease is common.
Predictive values help interpret the results of tests in the clinical setting.
The
diagnostic value of a procedure is defined by its sensitivity, specificity,
predictive
value and efficiency. Any test method will produce True Positive (TP), False
Negative (FN), False Positive (FP), and True Negative (TN). The "sensitivity"
of a
test is the percentage of all patients with disease present or that do respond
who have
a positive test or (TP/ TP + FN) x 100%. The "specificity" of a test is the
percentage of all patients without disease or who do not respond, who have a
negative test or (TN/ FP + TN) x 100%. The "predictive value" or "PV" of a
test is
a measure (%) of the times that the value (positive or negative) is the true
value, i.e.,
the percent of all positive tests that are true positives is the Positive
Predictive Value
(PV+) or (TP/ TP + FP) x100%. The "negative predictive value" (PV-) is the
percentage of patients with a negative test who will not respond or (TN/ FN +
TN) x
100%. The "accuracy" or "efficiency" of a test is the percentage of the times
that
the test give the correct answer compared to the total number of tests or (TP
+ TN/
TP + TN + FP + FN) x 100%. The "error rate" calculates from those patients
predicted to respond who did not and those patients who responded that were
not
predicted to respond or (FP + FN/ TP + TN + FP + FN) x 100%. The overall test
8
CA 02769462 2012-01-27
WO 2011/014349 PCT/US2010/041714
"specificity" is a measure of the accuracy of the sensitivity and specificity
of a test
do not change as the overall likelihood of disease changes in a population,
the
predictive value does change. The PV changes with a physician's clinical
assessment of the presence or absence of disease or presence or absence of
clinical
response in a given patient.
A "decreased level" or "lower level" of a biomarker refers to a level that is
quantifiably less than a predetermined value called the "cutoff value" and
above the
lower limit of quantitation (LLOQ). This determined "cutoff value" is specific
for
the algorithm and parameters related to patient sampling and treatment
conditions.
A "higher level" or "elevated level" of a biomarker refers to a level that is
quantifiably elevated relative to a predetermined value called the "cutoff
value."
This "cutoff value" is specific for the algorithm and parameters related to
patient
sampling and treatment conditions.
The term "human TNFa" (abbreviated herein as hTNFa. or simply TNF), as
used herein, is intended to refer to a human cytokine that exists as a 17 kD
secreted
form and a 26 kD membrane associated form, the biologically active form of
which
is composed of a trimer of noncovalently bound 17 kD molecules. The term human
TNFa is intended to include recombinant human TNFa. (rhTNFa), which can be
prepared by standard recombinant expression methods or purchased commercially
(R & D Systems, Catalog No. 210-TA, Minneapolis, Minn.).
By "anti-TNFa" or simply "anti-TNF" therapy or treatment is meant the
administration of a biologic molecule (biopharmaceutical) to a patient,
capable of
blocking, inhibiting, neutralizing, preventing receptor binding, or preventing
TNFR
activation by TNFa. Examples of such biopharmaceuticals are neutralizing MAbs
to
TNFa including but not limited those antibodies sold under the generic names
of
infliximab, adalimumab, and golimumab, and antibodies in clinical development.
Also included are non-antibody constructs capable of binding TNFa such as the
TNFR-immunoglobulin chimera known as Etanercept. The term includes each of
the anti-TNFa human antibodies and antibody portions described herein as well
as
9
CA 02769462 2012-01-27
WO 2011/014349 PCT/US2010/041714
those described in U.S. Pat. Nos. 6,090,382; 6,258,562; 6,509,015, and in U.S.
patent application Ser. Nos. 09/801185 and 10/302356. In one embodiment, the
TNFa inhibitor used in the invention is an anti-TNFa antibody, or a fragment
thereof, including infliximab (Remicade , Johnson and Johnson; described in
U.S.
Pat. No. 5,656,272, incorporated by reference herein), CDP571 (a humanized
monoclonal anti-TNF-alpha IgG4 antibody), CDP 870 (a humanized monoclonal
anti-TNF-alpha antibody fragment), an anti-TNF dAb (Peptech), CNTO 148
(golimumab, WO 02/12502 and US7,250,165), and adalimumab (Humira Abbott
Laboratories, a human anti-TNF mAb, described in U.S. Pat. No. 6,090,382 as
D2E7). Additional TNF antibodies which may be used in the invention are
described in U.S. Pat. Nos. 6,593,458; 6,498,237; 6,451,983; and 6,448,380,
each
of which is incorporated by reference herein. In another embodiment, the TNFa
inhibitor is a TNF fusion protein, e.g., etanercept (Enbrel , Amgen; described
in
WO 91/03553 and WO 09/406476, incorporated by reference herein). In another
embodiment, the TNFa inhibitor is a recombinant TNF binding protein (r-TBP-I)
(Serono).
By "sample" or "patient's sample" is meant a specimen which is a cell,
tissue, or fluid or portion thereof extracted, produced, collected, or
otherwise
obtained from a patient suspected to having or having presented with symptoms
associated with a TNFa-related disease.
Overview
Recent advances in technologies such as proteomics present pathologists
with the challenge of integrating the new information generated with high-
throughput methods with current diagnostic models based on clinicopathologic
correlations and often with the inclusion of histopathological findings.
Parallel
developments in the field of medical informatics and bioinformatics provide
the
technical and mathematical methods to approach these problems in a rational
manner providing new tools to the practitioner and pathologist or other
medical
specialists in the form multivariate and multidisciplinary diagnostic and
prognostic
models that are hoped to provide more accurate, individualized patient-based
CA 02769462 2012-01-27
WO 2011/014349 PCT/US2010/041714
information. Evidence-based medicine (EBM) and medical decision analysis
(MDA) are among the disciplines that use quantitative methods to assess the
value
of information and integrate so-called best evidence into multivariate models
for the
assessment of prognosis, response to therapy, and selection of laboratory
tests that
can influence individual patient care.
The subject matter disclosed and claimed herein includes several aspects
such as:
1. The use of serum or other sample types to identify biomarkers associated
with the response or non-response to anti-TNF, such as golimumab,
treatment in patients with PsA;
2. The ability to predict a response or non-response to an anti-TNFa Mab, such
as golimumab, treatment using biomarkers present in serum or other sample
types from a diagnosed PsA patient prior to initiating anti-TNF therapy;
3. An algorithm to predict outcome in patients with PsA treated with anti-TNF
therapy;
a. The clinical response or non-response of PsA patients to anti-TNFa at
Week 14 or later visits may be predicted at the time of assessment
(Week 0) using biomarkers present in a diagnosed PsA patient's
serum or other sample types prior to the initiation of anti-TNF
therapy.
b. The clinical response or non-response of PsA patients to anti-TNFa
treatment at Week 14 or later visits may be predicted using the
change in biomarkers from a baseline value obtained prior to the
initiation of therapy (Week 0) and at Week 4 after initiation of
therapy.
c. The clinical response or non-response of PsA patients to anti-TNFa
treatment at Week 14 or later visits may be predicted using the
change in biomarkers from a baseline value obtained prior to the
11
CA 02769462 2012-01-27
WO 2011/014349 PCT/US2010/041714
initiation of therapy (Week 0) in combination with the change in
biomarkers at Week 4 after initiation of therapy; and
4. Devices, systems, and kits comprising means for using the markers of the
invention to predict response or non-response of a PsA patient to anti-TNFa.
therapy.
In order to define the markers useful in developing a predictive algorithm
based on the concentrations of markers, serum was obtained from patients who
had
been treated with golimumab. Serum can be obtained at baseline (Week 0), Week
4,
and Week 14 of treatment or other intermediate or longer time points. A number
of
biomarkers in the serum samples are analyzed, and the baseline concentration
as
well as the change in the concentration of biomarkers after treatment is
determined.
The baseline and change in biomarker expression is then used to determine if
the
biomarker expression correlates with the treatment outcome at Week 14 or other
defined time point after the initiation of treatment as assessed by the ACR20
or
another measure of clinical response. In one embodiment, the process for
defining
the markers associated with the clinical response of a patient with PsA to
anti-TNFa
therapy and developing an algorithm for predicting response or non-response
involving the serum concentrations of those markers uses a stepwise analysis
wherein the initial correlations are done by logistic regression analysis
relating the
value for each biomarker for each patient at Week 0, 4, and 14 to the clinical
assessment for that patient at Week 14 and 24 and once the ability of a marker
to
significantly correlate to response to therapy at multiple clinical endpoints
is
determined, a unique algorithm based on defined serum values of a marker or
marker set is developed using CART or other suitable analytic method as
described
herein or known in the art.
In addition to the other markers disclosed herein, the dataset markers may be
selected from one or more clinical indicia, examples of which are age, race,
gender,
blood pressure, height and weight, body mass index, CRP concentration, tobacco
use, heart rate, fasting insulin concentration, fasting glucose concentration,
diabetes
12
CA 02769462 2012-01-27
WO 2011/014349 PCT/US2010/041714
status, use of other medications, and specific functional or behavioral
assessments,
and/or radiological or other image-based assessments wherein a numerical
values
are applied to individual measures or an overall numerical score is generated.
Clinical variables will typically be assessed and the resulting data combined
in an
algorithm with the above described markers.
Prior to input into the analytical process, the data in each dataset is
collected
by measuring the values for each marker, usually in triplicate or in multiple
triplicates. The data may be manipulated, for example, raw data may be
transformed
using standard curves, and the average of triplicate measurements used to
calculate
the average and standard deviation for each patient. These values may be
transformed before being used in the models, e.g., log- transformed, Box-Cox
transformed (see Box and Cox (1964) J. Royal Stat. Soc, Series B, 26:211-212;
1964), or other transformations known and practiced in the art. This data can
then
be input into the analytical process with defined parameters.
The quantitative data thus obtained related to the protein markers and other
dataset components is then subjected to an analytic process with parameters
previously determined using a learning algorithm, i.e., inputted into a
predictive
model, as in the examples provided herein (Examples 1-3). The parameters of
the
analytic process may be those disclosed herein or those derived using the
guidelines
described herein. Learning algorithms such as linear discriminant analysis,
recursive feature elimination, a prediction analysis of microarray, logistic
regression,
CART, FlexTree, LART, random forest, MART, or another machine learning
algorithm are applied to the appropriate reference or training data to
determine the
parameters for analytical processes suitable for a PsA response or non-
response
classification.
The analytic process may set a threshold for determining the probability that
a sample belongs to a given class. The probability preferably is at least 50%,
or at
least 60% or at least 70% or at least 80% or higher.
13
CA 02769462 2012-01-27
WO 2011/014349 PCT/US2010/041714
In other embodiments, the analytic process determines whether a comparison
between an obtained dataset and a reference dataset yields a statistically
significant
difference. If so, then the sample from which the dataset was obtained is
classified
as not belonging to the reference dataset class. Conversely, if such a
comparison is
not statistically significantly different from the reference dataset, then the
sample
from which the dataset was obtained is classified as belonging to the
reference
dataset class.
In general, the analytical process will be in the form of a model generated by
a statistical analytical method such as a linear algorithm, a quadratic
algorithm, a
polynomial algorithm, a decision tree algorithm, a voting algorithm.
Use of Reference/Training Datasets to Determine Parameters of Analytical
Process
Using any suitable learning algorithm, an appropriate reference or training
dataset is used to determine the parameters of the analytical process to be
used for
classification, i.e., develop a predictive model.
The reference, or training dataset, to be used will depend on the desired PsA
classification to be determined, e.g., responder or non-responder. The dataset
may
include data from two, three, four, or more classes.
For example, to use a supervised learning algorithm to determine the
parameters for an analytic process used to predict response to anti-TNFa
therapy, a
dataset comprising control and diseased samples is used as a training set.
Alternatively, a supervised learning algorithm is to be used to develop a
predictive
model for PsA disease therapy.
Statistical Analysis
The following are examples of the types of statistical analysis methods that
are available to one of skill in the art to aid in the practice of the
disclosed methods.
The statistical analysis may be applied for one or both of two tasks. First,
these and
other statistical methods may be used to identify preferred subsets of the
markers
and other indicia that will form a preferred dataset. In addition, these and
other
14
CA 02769462 2012-01-27
WO 2011/014349 PCT/US2010/041714
statistical methods may be used to generate the analytical process that will
be used
with the dataset to generate the result. Several of statistical methods
presented
herein or otherwise available in the art will perform both of these tasks and
yield a
model that is suitable for use as an analytical process for the practice of
the methods
disclosed herein.
In a specific embodiment, biomarkers and their corresponding features (e.g.,
expression levels or serum levels) are used to develop an analytical process,
or
plurality of analytical processes, that discriminate between classes of
patients, e.g.,
responder and non-responder to anti-TNFa therapy. Once an analytical process
has
been built using these exemplary data analysis algorithms or other techniques
known
in the art, the analytical process can be used to classify a test subject into
one of the
two or more phenotypic classes (e.g., a patient predicted to respond to anti-
TNFa
therapy or a patient who will not respond). This is accomplished by applying
the
analytical process to a marker profile obtained from the test subject. Such
analytical
processes, therefore, have value as diagnostic indicators.
In one aspect, the disclosed methods provide for the evaluation of a marker
profile from a test subject to marker profiles obtained from a training
population. In
some embodiments, each marker profile obtained from subjects in the training
population, as well as the test subject, comprises a feature for each of a
plurality of
different markers. In further embodiments, this comparison is accomplished by
(i)
developing an analytical process using the marker profiles from the training
population and (ii) applying the analytical process to the marker profile from
the test
subject. As such, the analytical process applied in some embodiments of the
methods disclosed herein is used to determine whether a test PsA patient is
predicted
to respond to anti-TNFa therapy or a patient who will not respond.
Thus, in some embodiments, the result in the above-described binary
decision situation has four possible outcomes: (i) a true responder, where the
analytical process indicates that the subject will be a responder to anti-TNFa
therapy
and the subject responds to anti-TNFa therapy during the definite time period
(true
CA 02769462 2012-01-27
WO 2011/014349 PCT/US2010/041714
positive, TP); (ii) false responder, where the analytical process indicates
that the
subject will be a responder to anti-TNFa therapy and the subject does not
respond to
anti-TNFa therapy during the definite time period (false positive, FP); (iii)
true non-
responder, where the analytical process indicates that the subject will not be
a
responder to anti-TNFa therapy and the subject does not respond to anti-TNFa
therapy during the definite time period (true negative, TN); or (iv) false non-
responder, where the analytical process indicates that the patient will not be
a
responder to anti-TNFa therapy and the subject does in fact respond to anti-
TNFa
therapy during the definite time period (false negative, FN).
Relevant data analysis algorithms for developing an analytical process
include, but are not limited to, discriminant analysis including linear,
logistic, and
more flexible discrimination techniques (see, e.g., Gnanadesikan, 1977,
Methods for
Statistical Data Analysis of Multivariate Observations, New York: Wiley 1977,
which is hereby incorporated by reference herein in its entirety); tree-based
algorithms such as classification and regression trees (CART) and variants
(see, e.g.,
Breiman, 1984, Classification and Regression Trees, Belmont, Calif.; Wadsworth
International Group); generalized additive models (see, e.g., Tibshirani,
1990,
Generalized Additive Models, London: Chapman and Hall); and neural networks
(see, e.g., Neal, 1996, Bayesian Learning for Neural Networks, New York:
Springer-
Verlag; and Insua, 1998, Feedforward neural networks for nonparametric
regression
In: Practical Nonparametric and Semiparametric Bayesian Statistics, pp. 181-
194,
New York: Springer. These references are hereby incorporated by reference in
their
entirety.
In a specific embodiment, a data analysis algorithm of the invention
comprises Classification and Regression Tree (CART), Multiple Additive
Regression Tree (MART), Prediction Analysis for Microarrays (PAM) or Random
Forest analysis. Such algorithms classify complex spectra from biological
materials,
such as a blood sample, to distinguish subjects as normal or as possessing
biomarker
expression levels characteristic of a particular disease state. In other
embodiments, a
data analysis algorithm of the invention comprises ANOVA and nonparametric
16
CA 02769462 2012-01-27
WO 2011/014349 PCT/US2010/041714
equivalents, linear discriminant analysis, logistic regression analysis,
nearest
neighbor classifier analysis, neural networks, principal component analysis,
quadratic discriminant analysis, regression classifiers and support vector
machines.
While such algorithms may be used to construct an analytical process and/or
increase the speed and efficiency of the application of the analytical process
and to
avoid investigator bias, one of ordinary skill in the art will realize that a
computer-
based device is not required to carry out the methods of using the predictive
models
of the present invention.
Results of the CART Analysis
In one aspect of the present invention, the analyses of serum markers in
patients diagnosed with PsA was focused on significant relationships between
biomarker baseline values and response to anti-TNFa therapy. In another aspect
of
the present invention, the analyses of the change in serum markers from
baseline
(prior to anti-TNFa. therapy) to Week 4 after therapy in serum markers in
patients
diagnosed with PsA was related to the clinical response or non-response of the
patient at a later time (Week 14).
In a specific embodiment of the invention, it was found that the baseline
concentration of VEGF could be an initial classifier for predicting the Week
14
outcome assessed as ACR20 for the patients treated with golimumab. In an
alternate
embodiment, other baseline markers such as adiponectin, PAP and SGOT may be
used as an initial classifier for predicting the Week 14 or Week 24 or outcome
at
other timepoints assessed as ACR20, DAS28, or PCS, PASI, or other methods of
scoring active disease for the patients treated with golimumab. This
information can
be used by physicians to determine who is benefiting from golimumab treatment,
and just as important, to identify those patients are not benefiting from such
treatment.
Alternatively, DAS28 was used as the clinical outcome component of the
model and VEGF at baseline, adiponectin at baseline, PAP at baseline, or SGOT
at
baseline or the change in was the initial marker for classification. Other
baseline
17
CA 02769462 2012-01-27
WO 2011/014349 PCT/US2010/041714
marker levels shown to be correlative to at least one Week 14 or Week 24
clinical
response include IL-8, deoxypyridinoline, S-100 (acute phase proteins produced
by
monocytes and elevated in serum and SF from RA and PsA patients), hyaluronic
acid, bone alkaline phosphatase, IL-6 (serum), and VEGF (serum).
Baseline Biomarkers Prediction of Response to anti-TNFa therapy.
When a predictive algorithm was built from datasets comprising only the
baseline biomarkers serum concentration values and correlated with clinical
response of a PsA patient treated with an anti-TNFa therapeutic in more than
one
method of assessing clinical response, such as ACR20 and DAS28, the markers
included VEGF, PAP, and adiponectin.
The CART model in Figure 1 uses 3 markers to classify patients as
responders or non-responders. For each marker, a single threshold is used
(e.g., for
VEGF, the threshold is 8.082). Patients are classified in such a model by
using their
biomarker values to proceed from the top of the decision tree to the bottom.
Once a
node at the bottom of the tree is reached, the classification for that patient
is
determined by the node label (either Yes or No to denote responders and non-
responders, respectively). As an example, consider a patient with the
following
values:
VEGF = 9.00
Prostatic Acid Phosphatase (PAP) = 1.00
Adiponectin = 1.00
At the top of the tree, the first marker is VEGF, and the threshold is 8.082.
Since the VEGF value is 9.00 in this example, the right branch of the tree is
followed. The next marker is PAP, the value 1.00 is greater than -2.287, so
again
the right branch is taken. Finally, the value of Adiponectin is 1.00, less
than the
threshold of 1.35, so the left branch is taken. The end result is the
patient's values
put them in a "No" bin, and the subject is classified as a non-responder. Note
that in
some cases, due to the hierarchical nature of the CART model, a patient may be
18
CA 02769462 2012-01-27
WO 2011/014349 PCT/US2010/041714
classified on the basis of the top level marker only (e.g., if VEGF < 8.082,
the
subject is classified as a non-responder regardless of the values of the other
two
markers in the model).
As demonstrated herein, analysis of biomarkers in serum obtained from PsA
patients at baseline (Week 0, prior to treatment), quantitated by a
multiplexed assay,
the best CART model included VEGF as the initial classifier (Fig. 1) and PAP
as
the secondary classifier with adiponectin as a tertiary classifier when PAP
was
greater than or equal to a threshold level in patients having VEGF greater
than or
equal to a threshold level. The model sensitivity was 53%, and model
specificity
was 95%.
These results suggest that baseline levels of biomarkers can be measured
prior to treatment by a physician to identify which of the patients treated
with
golimumab will respond or not respond to the treatment.
Biomarker Change as Early Predictor of Outcome
When comparing the change in baseline serum levels at Week4 in PsA
patients, golimumab-treated patient groups demonstrated significantly
different
serum biomarker levels compared to the placebo-treated group. The biomarkers
that
changed included: alpha- l-Antitrypsin, CRP, ENRAGE, haptoglobin, ICAM-1, IL-
16, IL-18, IL-Ira, IL-8, MCP-1, MIP-lbeta, MMP-3, myeloperoxidase, serum
amyloid P, thyroxine binding globulin, TNFRII, and VEGF.
For analysis of biomarkers in serum obtained from PsA patients at baseline
and Week 4 correlated to the primary clinical endpoint at Week 14 (ACR20), the
biomarker model uses the change in MDC as the initial classifier followed by
two
subclassifications using change in lipoprotein A and in beta2-microglobulin
(Fig.
2).
The specific examples described herein for generating an algorithm useful
for predicting the response or non-response of a PsA patient to anti-TNFa.
therapy
indicate that multiple markers are correlative of PsA processes and the
quantitative
interpretation of each particular biomarker in diagnosing or predicting
response to
19
CA 02769462 2012-01-27
WO 2011/014349 PCT/US2010/041714
therapy has not been heretofore well established. The applicants demonstrated
that
an algorithm can be generated using a sampling of patient data based on
specific
markers defined. In one method of using the markers of the invention, a
computer
assisted device is used to capture patient data and perform the necessary
analysis. In
another aspect, the computer assisted device or system may use the data
presented
herein as a "training data set" in order to generate the classifier
information required
to apply the predictive analysis.
Instruments, Reagents and Kits for Performing the Analysis
The measurement of serum biomarkers for predicting response of a
diagnosed PsA patient to anti-TNF therapy may be performed in a clinical or
research laboratory or a centralized laboratory in a hospital or non-hospital
location
using standard immunochemical and biophysical methods as described herein. The
marker quantitation may be performed at the same time as e.g., other standard
measures such as WBC count, platelets, and ESR. The analysis may be performed
individually or in batches using commercial kits, or using multiplexed
analysis on
individual patient samples.
In one aspect of the invention, individual and sets of reagents are used in
one
or more steps to determine relative or absolute amounts of a biomarker, or
panel or
biomarkers, in a patient's sample. The reagents may be used to capture the
biomarker, such as an antibody immunospecific for a biomarker, which forms a
ligand biomarker pair detectable by an indirect measurement such as enzyme-
linked
immunospecific assay. Either single analyte EIA or multiplexed analysis can be
performed. Multiplexed analysis is a technique by which multiple, simultaneous
EIA-based assays can be performed using a single serum sample. One platform
useful to quantify large numbers of biomarkers in a very small sample volume
is the
xMAP technology used by Rules Based Medicine in Austin, Texas (owned by the
Luminex Corporation), which performs up to 100 multiplexed, microsphere-based
assays in a single reaction vessel by combining optical classification
schemes,
biochemical assays, flow cytometry and advanced digital signal processing
hardware
CA 02769462 2012-01-27
WO 2011/014349 PCT/US2010/041714
and software. In the technology, multiplexing is accomplished by assigning
each
analyte-specific assay a microsphere set labeled with a unique fluorescence
signature. Multiplexed assays are analyzed in a flow device that interrogates
each
microsphere individually as it passes through a red and green laser.
Alternatively,
methods and reagents are used to process the sample for detection and possible
quantitation using a direct physical measurement such as mass, charge, or a
combination such as by SELDI. Quantitative mass spectrometric multiple
reaction
monitoring assays have also been developed such as those offered by NextGen
Sciences (Ann Arbor, MI).
According to one aspect of the invention, therefore, the detection of
biomarkers for evaluation of PsA status entails contacting a sample from a
subject
with a substrate, e.g., a probe, having capture reagent thereon, under
conditions that
allow binding between the biomarker and the reagent, and then detecting the
biomarker bound to the adsorbent by a suitable method. One method for
detecting
the marker is gas phase ion spectrometry, for example, mass spectrometry.
Other
detection paradigms that can be employed to this end include optical methods,
electrochemical methods (voltometry, amperometry or electrochemiluminescent
techniques), atomic force microscopy, and radio frequency methods, e.g.,
multipolar
resonance spectroscopy. Illustrative of optical methods, in addition to
microscopy,
both confocal and non-confocal, are detection of fluorescence, luminescence,
chemiluminescence, absorbance, reflectance, transmittance, and birefringence
or
refractive index (e.g., surface plasmon resonance, ellipsometry, a resonant
mirror
method, a grating coupler waveguide method or interferometry), and enzyme-
coupled colorimetric or fluorescent methods.
Specimens from patients may require processing prior to applying the
detecting method to the processed specimen or sample such as but not limited
to
methods to concentrate, purify, or separate the marker from other components
of the
specimen. For example a blood sample is typically allowed to clot followed by
centrifugation to produce serum or treated with an anticoagulant and the
cellular
components and platelets removed prior to being subjected to methods of
detecting
21
CA 02769462 2012-01-27
WO 2011/014349 PCT/US2010/041714
analyte concentration. Alternatively, the detecting may be accomplished by a
continuous processing system which may incorporate materials or reagents to
accomplish such concentrating, separating or purifying steps. In one
embodiment
the processing system includes the use of a capture reagent. One type of
capture
reagent is a "chromatographic adsorbent," which is a material typically used
in
chromatography. Chromatographic adsorbents include, for example, ion exchange
materials, metal chelators, immobilized metal chelates, hydrophobic
interaction
adsorbents, hydrophilic interaction adsorbents, dyes, simple biomolecules
(e.g.,
nucleotides, amino acids, simple sugars and fatty acids), mixed mode
adsorbents
(e.g., hydrophobic attraction/electrostatic repulsion adsorbents). A
"biospecific"
capture reagent is a capture reagent that is a biomolecule, e.g., a
nucleotide, a
nucleic acid molecule, an amino acid, a polypeptide, a polysaccharide, a
lipid, a
steroid or a conjugate of these (e.g., a glycoprotein, a lipoprotein, a
glycolipid). In
certain instances the biospecific adsorbent can be a macromolecular structure
such
as a multiprotein complex, a biological membrane or a virus. Illustrative
biospecific
adsorbents are antibodies, receptor proteins, and nucleic acids. A biospecific
adsorbent typically has higher specificity for a target analyte than a
chromatographic
adsorbent.
The detection and quantitation of the biomarkers according to the invention
can thus be enhanced by using certain selectivity conditions, e.g., adsorbents
or
washing solutions. A wash solution refers to an agent, typically a solution,
which is
used to affect or modify adsorption of an analyte to an adsorbent surface
and/or to
remove unbound materials from the surface. The elution characteristics of a
wash
solution can depend, for example, on pH, ionic strength, hydrophobicity,
degree of
chaotropism, detergent strength, and temperature.
In one aspect of the present invention, a sample is analyzed in a multiplexed
manner meaning that the processing of markers from a patient samples occurs
nearly
simultaneously. In one aspect, the sample is contacted by a substrate
comprising
multiple capture reagents representing unique specificity. The capture
reagents are
commonly immunospecific antibodies or fragments thereof. The substrate may be
a
22
CA 02769462 2012-01-27
WO 2011/014349 PCT/US2010/041714
single component such as a "biochip," a term that denotes a solid substrate,
having a
generally planar surface, to which a capture reagent(s) is attached, or the
capture
reagents may be segregated among a number of substrates, as for example bound
to
individual spherical substrates (beads). Frequently, the surface of a biochip
comprises a plurality of addressable locations, each of which has the capture
reagent
bound there. A biochip can be adapted to engage a probe interface and, hence,
function as a probe in gas phase ion spectrometry preferably mass
spectrometry.
Alternatively, a biochip of the invention can be mounted onto another
substrate to
form a probe that can be inserted into the spectrometer. In the case of the
beads, the
individual beads may be partitioned or sorted after exposure to the sample for
detection.
A variety of biochips are available for the capture and detection of
biomarkers, in accordance with the present invention, from commercial sources
such
as Ciphergen Biosystems (Fremont, CA), Perkin Elmer (Packard BioScience
Company (Meriden CT), Zyomyx (Hayward, CA), and Phylos (Lexington, MA), GE
Healthcare, Corp. (Sunnyvale, CA). Exemplary of these biochips are those
described in U.S. patents No. 6,225,047, supra, and No. 6,329,209 (Wagner et
al.),
and in WO 99/51773 (Kuimelis and Wagner) WO 00/56934 (Englert et al.) and
particularly those which use electrochemical and electrochemiluminescence
methods
of detecting the presence or amount of an analyte marker in a sample such as
those
multi-specific, multi-array taught in Wohlstadter et al., W098/12539 and U.S.
Pat.
No. 6,066,448.
A substrate with biospecific capture and/or detection reagents is contacted
with the sample, containing e.g., serum, for a period of time sufficient to
allow the
biomarker that may be present to bind to the reagent. In one embodiment of the
invention, more than one type of substrate with biospecific capture or
detection
reagents thereon is contacted with the biological sample. After the incubation
period, the substrate is washed to remove unbound material. Any suitable
washing
solutions can be used; preferably, aqueous solutions are employed.
23
CA 02769462 2012-01-27
WO 2011/014349 PCT/US2010/041714
Biomarkers bound to the substrates are to be detected after desorption
directly by using a gas phase ion spectrometer such as a time-of-flight mass
spectrometer. The biomarkers are ionized by an ionization source such as a
laser,
the generated ions are collected by an ion optic assembly, and then a mass
analyzer
disperses and analyzes the passing ions. The detector then translates
information of
the detected ions into mass-to-charge ratios. Detection of a biomarker
typically will
involve detection of signal intensity. Thus, both the quantity and mass of the
biomarker can be determined. Such methods may be used to discovery biomarkers
and, in some instances for quantitation of biomarkers.
In another embodiment, the method of the invention is a microfluidic device
capable of miniaturized liquid sample handling and analysis device for liquid
phase
analysis as taught in, for example, US 5,571,410 and US RE36350, useful for
detecting and analyzing small and/or macromolecular solutes in the liquid
phase,
optionally, employing chromatographic separation means, electrophoretic
separation
means, electrochromatographic separation means, or combinations thereof. The
microfluidic device or "microdevice" may comprise multiple channels arranged
so
that analyte fluid can be separated, such that biomarkers may be captured,
and,
optionally, detected at addressable locations within the device (US5,637,469,
US6,046,056 and US6,576,478).
Data generated by detection of biomarkers can be analyzed with the use of a
programmable digital computer. The computer program analyzes the data to
indicate the number of markers detected and the strength of the signal. Data
analysis
can include steps of determining signal strength of a biomarker and removing
data
deviating from a predetermined statistical distribution. For example, the data
can be
normalized relative to some reference. The computer can transform the
resulting
data into various formats for display, if desired, or further analysis.
Artificial Neural Network
In some embodiments, a neural network is used. A neural network can be
constructed for a selected set of markers. A neural network is a two-stage
regression
24
CA 02769462 2012-01-27
WO 2011/014349 PCT/US2010/041714
or classification model. A neural network has a layered structure that
includes a
layer of input units (and the bias) connected by a layer of weights to a layer
of
output units. For regression, the layer of output units typically includes
just one
output unit. However, neural networks can handle multiple quantitative
responses in
a seamless fashion.
In multilayer neural networks, there are input units (input layer), hidden
units
(hidden layer), and output units (output layer). There is, furthermore, a
single bias
unit that is connected to each unit other than the input units. Neural
networks are
described in Duda et al., 2001, Pattern Classification, Second Edition, John
Wiley
& Sons, Inc., New York; and Hastie et al., 2001, The Elements of
Statistical
Learning, Springer-Verlag, New York.
The basic approach to the use of neural networks is to start with an untrained
network, present a training pattern, e.g., marker profiles from patients in
the training
data set, to the input layer, and to pass signals through the net and
determine the
output, e.g., the prognosis of the patients in the training data set, at the
output layer.
These outputs are then compared to the target values, e.g., actual outcomes of
the
patients in the training data set; and a difference corresponds to an error.
This error
or criterion function is some scalar function of the weights and is minimized
when
the network outputs match the desired outputs. Thus, the weights are adjusted
to
reduce this measure of error. For regression, this error can be sum-of-
squared
errors. For classification, this error can be either squared error or cross-
entropy
(deviation). See, e.g., Hastie et al., 2001, The Elements of Statistical
Learning,
Springer-Verlag, New York.
Three commonly used training protocols are stochastic, batch, and on-line.
In stochastic training, patterns are chosen randomly from the training set and
the
network weights are updated for each pattern presentation. Multilayer
nonlinear
networks trained by gradient descent methods such as stochastic back-
propagation
perform a maximum-likelihood estimation of the weight values in the model
defined
by the network topology. In batch training, all patterns are presented to the
network
CA 02769462 2012-01-27
WO 2011/014349 PCT/US2010/041714
before learning takes place. Typically, in batch training, several passes are
made
through the training data. In online training, each pattern is presented once
and only
once to the net.
In some embodiments, consideration is given to starting values for weights.
If the weights are near zero, then the operative part of the sigmoid commonly
used
in the hidden layer of a neural network (see, e.g., Hastie et al., 2001, The
Elements
of Statistical Learning, Springer-Verlag, New York) is roughly linear, and
hence the
neural network collapses into an approximately linear model. In some
embodiments, starting values for weights are chosen to be random values near
zero.
Hence the model starts out nearly linear, and becomes nonlinear as the weights
increase. Individual units localize to directions and introduce nonlinearities
where
needed. Use of exact zero weights leads to zero derivatives and perfect
symmetry,
and the algorithm never moves. Alternatively, starting with large weights
often
leads to poor solutions.
Since the scaling of inputs determines the effective scaling of weights in the
bottom layer, it can have a large effect on the quality of the final solution.
Thus, in
some embodiments, at the outset all expression values are standardized to have
mean
zero and a standard deviation of one. This ensures all inputs are treated
equally in
the regularization process, and allows one to choose a meaningful range for
the
random starting weights. With standardization inputs, it is typical to take
random
uniform weights over the range sigma -0.7, +0.7 sigma
A recurrent problem in the use of networks having a hidden layer is the
optimal number of hidden units to use in the network. The number of inputs and
outputs of a network are determined by the problem to be solved. For the
methods
disclosed herein, the number of inputs for a given neural network can be the
number
of markers in the selected set of markers.
The number of outputs for the neural network will typically be just one: yes
or no. However, in some embodiment more than one output is used so that more
than two states can be defined by the network.
26
CA 02769462 2012-01-27
WO 2011/014349 PCT/US2010/041714
Software used to analyze the data can include code that applies an algorithm
to the analysis of the signal to determine whether the signal represents a
peak in a
signal that corresponds to a biomarker according to the present invention. The
software also can subject the data regarding observed biomarker signals to
classification tree or ANN analysis, to determine whether a biomarker or
combination of biomarker signals is present that indicates patient's disease
diagnosis
or status.
Thus, the process can be divided into the learning phase and the
classification phase. In the learning phase, a learning algorithm is applied
to a data
set that includes members of the different classes that are meant to be
classified, for
example, data from a plurality of samples from patients diagnosed as PsA and
who
respond to anti-TNFa therapy and data from a plurality of samples from
patients
with a negative outcome, PsA patients who did not respond to anti-TNFa
therapy.
The methods used to analyze the data include, but are not limited to,
artificial neural
network, support vector machines, genetic algorithm and self-organizing maps,
and
classification and regression tree (CART) analysis. These methods are
described,
for example, in WOO 1/31579, May 3, 2001 (Barnhill et al.); WO02/06829,
January
24, 2002 (Hitt et al.) and WO02/42733, May 30, 2002 (Paulse et al.). The
learning
algorithm produces a classifying algorithm keyed to elements of the data, such
as
particular markers and specific concentrations of markers, usually in
combination,
that can classify an unknown sample into one of the two classes, e.g.,
responder on
non-responder. The classifying algorithm is ultimately used for predictive
testing.
Software, both freeware and proprietary software, is readily available to
analyze patterns in data, and to devise additional patterns with any
predetermined
criteria for success.
Kits
In another aspect, the present invention provides kits for determining which
PsA patients will respond or not respond to treatment with an anti-TNFa agent,
such
as golimumab, which kits are used to detect serum markers according to the
27
CA 02769462 2012-01-27
WO 2011/014349 PCT/US2010/041714
invention. The kits screen for the presence of serum markers and combinations
of
markers that are differentially present in PsA patients.
In one aspect, the kit contains a means for collecting a sample, such as a
lance or piercing tool for causing a "stick" through the skin. The kit may,
optionally, also contain a probe, such as a capillary tube, or blood
collection tube for
collecting blood from the stick.
In one embodiment, the kit comprises a substrate having one or more
biospecific capture reagents for binding a marker according to the invention.
The kit
may include more than type of biospecific capture reagents, each present on
the
same or a different substrate.
In a further embodiment, such a kit can comprise instructions for suitable
operational parameters in the form of a label or separate insert. For example,
the
instructions may inform a consumer how to collect the sample or how to empty
or
wash the probe. In yet another embodiment the kit can comprise one or more
containers with biomarker samples, to be used as standard(s) for calibration.
In the method of using the algorithm of the invention for predicting the
response of a PsA patient to anti-TNF therapy, blood or other fluid is
acquired from
the patient prior to anti-TNF therapy and at specified periods after therapy
is
initiated. The blood may be processed to extract a serum or plasma fraction or
may
be used whole. The blood or serum samples may be diluted, for example 1:2,
1:5,
1:10, 1:20, 1:50, or 1:100, or used undiluted. In one format, the serum or
blood
sample is applied to a prefabricated test strip or stick and incubated at room
temperature for a specified period of time, such as 1 min, 5 min, 10 min, 15,
min, 1
hour, or longer. After the specified period of time for the assay; the samples
and the
result are readable directly from the strip. For example, the results appear
as varying
shades of colored or gray bands, indicating a concentration range of one or
more
markers. The test strip kit will provide instructions for interpreting the
results based
on the relative concentrations of the one or more markers. Alternatively, a
device
capable of detecting the color saturation of the marker detection system on
the strip
28
CA 02769462 2012-01-27
WO 2011/014349 PCT/US2010/041714
can be provided, which device may optionally provide the results of the test
interpretation based on the appropriate diagnostic algorithm for that series
of
markers.
Methods of Using the Invention
The invention provides a method of predicting responsiveness to therapy
with an anti-TNFa agent, such as golimumab, by analyzing detected biomarkers
in a
patient diagnosed with PsA. In the method of the invention, a patient is first
diagnosed with PsA by an experienced professional using subjective and
objective
criteria.
Psoriatic arthritis is a chronic, inflammatory, usually rheumatoid factor (RF)-
negative arthritis that is associated with psoriasis. The prevalence of
psoriasis in the
general Caucasian population is approximately 2% (Boumpas et al., 2001).
Approximately 6% to 39% of psoriasis patients develop PsA (Shbeeb et al.,
2000;
Leonard et al., 1978). Affecting men and women equally, PsA peaks between the
ages of 30 and 55 years (Boumpas, et al., 2001). Psoriatic arthritis involves
peripheral joints, axial skeleton, sacroiliac joints, nails, and entheses, and
is
associated with psoriatic skin lesions (Gladman et al., 1987, Boumpas, et al.,
2001).
The presentation of PsA can be categorized into 5 overlapping clinical
patterns,
which include oligoarthritis in approximately 22% to 37% of patients;
polyarthritis
in 36% to 41% of patients; arthritis of distal interphalangeal (DIP) joints in
up to
20% of patients; spondylitis affecting approximately 7% to 23% of patients;
and
arthritis mutilans in approximately 4% of patients (Gladman et al., 1987;
Torre
Alonso et al., 1991). Over one-third of patients with PsA also develop
dactylitis and
enthesitis (Gladman et al., 1987; Sokoll and Helliwell, 2001). Dactylitis is a
painful
swelling of the whole digit caused by inflammation of the digital joints and
tenosynovitis.
Enthesitis is an inflammation of the tendon, ligament or joint capsule
insertion into the bone. More than one-half of the patients with PsA may have
evidence of erosions on x-rays, and up to 40% of the patients develop severe,
29
CA 02769462 2012-01-27
WO 2011/014349 PCT/US2010/041714
erosive arthropathy (Torre Alonso et al., 1991; Gladman et al., 1987).
Psoriatic
arthritis leads to functional impairment, reduced quality of life, and
increased
mortality (Torre Alonso et al., 1991; Sokoll and Helliwell, 2001; Wong et al.,
1997;
Gladman et al., 1998).
Most of the treatments currently used for PsA were adapted from experience
in the rheumatoid arthritis (RA) patient population. Despite the progressive
and
potentially disabling nature of PsA, and in contrast with RA, only a few,
randomized, controlled trials have examined the role of traditional disease
modifying antirheumatic drugs (DMARDs) in the treatment of PsA (Dougados et
al., 1995; Jones et al., 1997; Salvarani et al., 2001; Kaltwasser et al.,
2004). In
these studies, methotrexate (MTX), cyclosporine, sulfasalazine, and
leflunomide
demonstrated efficacy in the treatment of this condition, although the
treatments
were associated with a time lag of several weeks between treatment initiation
and a
clinically significant response in either arthritis or psoriasis (MTX,
cyclosporine), or
only had modest efficacy on the skin (sulfasalazine, leflunomide).
Corticosteroids
are rarely used to treat PsA as severe psoriasis flares occur upon withdrawal.
Clinical assessment methods
Psoriatic arthritis is a rheumatic condition (a disease of the joints) and is
often seen in combination with skin that is red, dry, and scaly (psoriatic
skin
lesions). Psoriatic arthritis is a systemic rheumatic disease that can also
cause
inflammation in body tissues away from the joints other than the skin, such as
in the
eyes, heart, lungs, and kidneys. Psoriatic arthritis shares many features with
several
other arthritic conditions, such as ankylosing spondylitis, reactive arthritis
(formerly
Reiter's syndrome), and arthritis associated with Crohn's disease and
ulcerative
colitis. All of these conditions can cause inflammation in the spine and other
joints,
and the eyes, skin, mouth, and various organs. In view of their similarities
and
tendency to cause inflammation of the spine, these conditions are collectively
referred to as "spondyloarthropathies."
CA 02769462 2012-01-27
WO 2011/014349 PCT/US2010/041714
The diagnosis of PsA is most often made by assessing swollen and painful
joints and certain serum markers as detailed below.
Once the diagnosis of PsA is established, the physician generally monitors
clinical outcomes longitudinally in order to identify patients at risk of
worsening
disease.
ACR responses are presented as the numerical improvement in multiple
disease assessment criteria. For example, an ACR 20 response (Felson et al.,
Arthr
Rheum 38(6):727-735,1995) is defined as >_20% improvement in:
1. Swollen joint count (66 joints) and tender joint count (68 joints); and
2. a >_20% improvement in 3 of the following 5 assessments
a. Patient's assessment of pain (VAS)
b. Patient's global assessment of disease activity (VAS)
c. Physician's global assessment of disease activity (VAS)
d. Patient's assessment of physical function as measured by the HAQ
e. CRP
ACR 50 and ACR 70 are similarly defined, but with a >_50% or >_70%
improvements, respectively in these criteria.
The ACR-N Index of Improvement (Schiff et al., 1999 Arthritis Rheum.
42(Suppl 9):S81; Bathon et al., 2000 N Engl J Med. 343(22):1586-1593; Siegel
and
Zhen, 2005 Arthritis Rheum 52(6):1637-1641) is defined as the minimum of the
following 3 items:
1. The percent improvement from baseline in tender joint counts
2. The percent improvement from baseline in swollen joint counts
3. The median percent improvement from baseline for the following 5
assessments:
31
CA 02769462 2012-01-27
WO 2011/014349 PCT/US2010/041714
a. Patient's assessment of pain (VAS)
b. Patient's global assessment of disease activity (VAS)
c. Physician's global assessment of disease activity (VAS)
d. Patient's assessment of physical function as measured by the HAQ
e. CRP
The Disease Activity Index Score 28 (DAS28) is a statistically derived index
combining tender joints (28 joints), swollen joints (28 joints), CRP, and
Global
Health (GH) (van der Linden, 2004 available on the internet). The DAS28 is a
continuous parameter and is defined as follows:
DAS28 = 0.56* SQRT(TEN28) + 0.28*SQRT(SW28) + 0.36* Ln (CRP+1)
+ 0.014*GH + 0.96
TEN28 is 28 joint count for tenderness.
SW28 is 28 joint count for swelling. The set of 28 joint count is based on
left and right shoulder, elbow, wrist, metacarpo-phalangeal (MCP)1, MCP2,
MCP3,
MCP4, MCPS, proximal interphalangeal (PIP)1, PIP2, PIP3, PIP4, PIPS joints of
upper extremities and left and right knee joints of lower extremities.
Ln (CRP+1) is natural logarithm of (CRP value + 1)
GH is Patient's Global Assessment of Disease Activity evaluated using VAS
of 100 mm.
To be classified as DAS28 responder, subjects should have a good or
moderate response. The DAS28 response criteria are defined in Table 1 below
(van
Riel, van Gestel, and Scott, 2000 EULAR Handbook of Clinical Assessments in
Rheumatoid Arthritis. Alphen Aan Den Rijn, The Netherlands: Van Zuiden
Communications B.V.; Ch. 40).
32
CA 02769462 2012-01-27
WO 2011/014349 PCT/US2010/041714
TABLE 1
Improvement in DAS28 score
Present DAS28 score > 1.2 > 0.6 to <1.2 <0.6
<3.2 Good response Moderate response No response
> 3.2 to <5.1 Moderate response Moderate response No response
> 5.1 Moderate response No response No response
Subjects are considered to achieve Psoriatic Arthritis Response Criteria
(PsARC) if they have improvement in at least 2 (1 of which must be tender or
swollen joint score) and worsening in none of the following assessments (Clegg
et
al., 1996 Arthritis Rheum. 39(12):2013-2020):
= Patient global assessment of the disease on a 1 to 5 Likert scale
(improvement = decrease by > 1 category; worsening = increase by > 1
category).
= Physician global assessment of the disease on a 1 to 5 Likert scale
(improvement = decrease by > 1 category; worsening = increase by > 1
category).
= Tender joint score (improvement = decrease by > 30%; worsening =
increase by > 30%).
= Swollen joint score (improvement = decrease by > 30%; worsening =
increase by > 30%).
The modified van der Heijde-Sharp score is the original vdH-S score (van
der Heijde et al., 1992 Arthritis Rheum 35(1):26-34) modified for the purpose
of
PsA radiological damage assessment by also assessing the DIP joints of the
hands.
The joint erosion score is a summary of erosion severity in 40 joints of the
hands
and 12 joints in the feet. Each hand joint is scored, according to surface
area
involved, from 0 indicating no erosion and 5 indicating extensive loss of bone
from
33
CA 02769462 2012-01-27
WO 2011/014349 PCT/US2010/041714
more than one half of the articulating bone. Because each side of the foot
joint is
graded on this scale, the maximum erosion score for a foot joint is 10. Thus,
the
maximal erosion score is 320. The joint space narrowing (JSN) score summarizes
the severity of JSN in 40 joints in the hands and 12 joints of the feet.
Assessment of
JSN is scored from 0 to 4, with 0 indicating no JSN and with 4 indicating
complete
loss of joint space, bony ankylosis, or complete luxation. Thus, the maximal
JSN
score is 208, and 528 is the worst possible modified vdH-S score.
The PASI is a system used for assessing and grading the severity of psoriatic
lesions and their response to therapy (Fredriksson and Pettersson, 1978
Dermatologica 157(4):238-244). The PASI produces a numeric score that can
range
from 0 to 72. The severity of disease is calculated using a system where the
body is
divided in to four regions: the head (h), trunk (t), upper extremities (u),
and lower
extremities (1), which account for 10%, 30%, 20%, and 40% of total body
surface
area (BSA), respectively. Each of these areas is assessed separately for
erythema,
induration, and scaling, which are each rated on a scale of 0 to 4.
The scoring system of the signs of the disease (erythema, induration, and
scaling) are: 0 = none, 1 = slight, 2 = moderate, 3 = severe, and 4 = very
severe.
The scale for estimating the area of involvement of psoriatic lesions is 0 =
no
involvement, 1 = 1% to 9% involvement, 2 = 10% to 29% involvement, 3 = 30% to
49% involvement, 4 = 50% to 69% involvement, 5 = 70% to 89% involvement, and
6 = 90% to 100% involvement.
The PASI formula is:
PASI=0.1 (Eh + Ih + Sh) Ah + 0.3 (Et+It+ St) At+0.2(Eu+Iu+Su)Au
+ 0.4 (El + Il + Sl) Al, where E = erythema, I = induration, S = scaling, and
A =
area.
A prospectively identified target psoriatic lesion is evaluated for plaque
induration, scaling, and erythema using the following scoring system: were
erythema, 0 = none, 1 = light red, 2 = red, but not deep red, 3 = very red, 4
=
extremely red. Plaque induration 0 = none, 1 = mild (0.25 mm), 2 = moderate
(0.5
34
CA 02769462 2012-01-27
WO 2011/014349 PCT/US2010/041714
mm), 3 = severe (1 mm), 4 = very severe (1.25 mm). Scaling 0 = none; 1 =
mainly
fine scale, some of lesion covered; 2 = coarser thin scale, most of lesion
covered; 3 =
coarse thick scale, most of lesion covered, rough; 4 = very thick scale, all
of lesion
covered, very rough.
Nail Psoriasis Severity Index (NAPSI) is based on a target fingernail
representing the worst nail psoriasis, divided into quadrants and graded for
nail
matrix psoriasis and nail bed psoriasis (Rich and Scher, 2003 JAm Acad
Dermatol.
49(2):206-212). The sum of these 2 scores is the total NAPSI score (0-8).
Nail matrix psoriasis is the presence or absence of any of the following:
pitting, leukonychia, red spots in the lunula, and nail plate crumbling.
Scoring for
nail matrix psoriasis: 0 = none, 1 = present in 1/4 nail, 2 = present in 2/4
nail; 3 =
present in 3/4 nail, 4 = present in 4/4 nail.
Nail bed psoriasis is the presence or absence of any of the following:
onycholysis, splinter hemorrhages, oil drop discoloration, and nail bed
hyperkeratosis. The score for nail bed psoriasis is the same as for nail
matrix
psoriasis.
Patients may be scored using a generalized health related quality of life
survey form such as the short form 36 (SF-36) (Ware JE, Jr., Snow KS, Kosinski
M,
Gandek B. The SF-36 health survey manual and interpretation guide. Boston: The
Health Institute, New England Medical Center, 1993) which includes physical
functions as well as mental aspects and can be subcategorized into a physical
components score (PCS) and a mental components score (MCS).
It will be recognized that the clinical indices described herein are part of
the
patient data set and can be assigned a numerical score.
Suitability for TNFa therapy
Anti-TNFa agents have been commercially available, such as golimumab
and infliximab, and used to treat PsA for several years. The efficacy and
safety
CA 02769462 2012-01-27
WO 2011/014349 PCT/US2010/041714
profile of anti-TNF therapy for a variety of indications, including PsA, has
been well
characterized.
Patient Management
In the method of the invention for predicting or assessing early
responsiveness to anti-TNF therapy, prior to initiation of anti-TNF therapy,
at a
"baseline visit", a baseline or "Week 0" sample is acquired from the patient
to be
treated with anti-TNF therapy. The sample may be any tissue which can be
evaluated for the biomarkers associated with the method of the invention. In
one
embodiment the sample is a fluid selected from the group consisting of a fluid
selected from the group consisting of blood, serum, plasma, urine, semen and
stool.
In a particular embodiment, the sample is a serum sample which is obtained
from
patient's blood drawn by a standard method of direct venipuncture or via an
intravenous catheter.
In addition, at the baseline visit, information on patient's demographics and
history of disease with PsA will be recorded on a standardized form or case
report
form. Data such as time since patient's diagnosis, previous treatment history,
concomitant medications, C -reactive protein (CRP) level and an assessment of
disease activity (i.e., ACR or DAS28) will be recorded.
The patient receives the first dose of anti-TNF therapy at the time of the
baseline visit or within 24 - 48 hours. At the time of the baseline visit, the
patient is
scheduled for a Week 4 visit.
At the 2-week visit or 4-week visit, approximately 14 or 28 days after initial
administration of anti-TNFa therapy, a second patient sample is acquired,
preferably
using the same protocol and route as for the baseline sample. The patient is
examined and other indices, imaging, or information may be performed or
monitored as proscribed by the health care professional or study design as
indicated.
The patient is scheduled for subsequent visits, such as a Week 8, Week 12,
Week 14,
Week 28, etc. visit for the purposes of performing assessment of disease using
the
such criteria as set forth by the ACR and PsARC and for the acquisition of
patient
36
CA 02769462 2012-01-27
WO 2011/014349 PCT/US2010/041714
samples for biomarker evaluation.
At any or the above times prior to, during, or following treatment, other
parameters and markers may be assessed in the patient's sample or other fluid
or
tissue samples acquired from the patient. These may include standard
hematological
parameters such as hemoglobin content, hematocrit, red cell volume, mean red
cell
diameter, erythrocyte sedimentation rate (ESR), and the like. Other markers
may
which have been determined useful in assessing the presence of PsA may be
quantitated in some or all of the patient's sample(s), such as, CRP
(Spoorenberg A et
al., 1999. J Rheumatol 26: 980-984) and IL-6, and markers of cartilage
degradation
such as serum Type 1 N-telopeptides (NTX), urinary type II collagen C-
telopeptides
(urinary CTX-II) and serum matrix metalloptrotease 3 (MMP3, stromelysin 1)(See
US20070172897).
The medical professional's clinical judgment of response should not be
negated by the test result. However, the test could aid in making the decision
to
continue or discontinue treatment with golimumab. In a test in which the
prediction
model (algorithm) has 90% sensitivity and 60% specificity, where 50% of the
patients display a clinical response and 50% do not display assessment scores
or
evaluations consistent with a clinical response. This would mean: of the
responders,
45% would be identified correctly as responders (5 would be reported as likely
non-
responders) and 30% or non-responders would be identified correctly as non-
responders (20% would be classified as likely responders). Thus, overall
benefit is
that 60% of all true non-responders could be spared an unnecessary therapy or
discontinued from therapy at an early time point (Week 4). The 5% false-
negative
"responders" (identified as likely non-responders) would have been treated,
and as
with all patients, their response would be judged clinically before making the
decision to continue or discontinue treatment at Week 14 or later. The 20%
false-
negative "non-responders" (identified as possible responders) would have to be
judged clinically, and would take the usual time to make the decision to
discontinue
treatment.
37
CA 02769462 2012-01-27
WO 2011/014349 PCT/US2010/041714
EXAMPLE 1: SAMPLE COLLECTION AND ANALYSIS
Serum samples were obtained and evaluated from patients enrolled in a
multicenter, randomized, double-blind, placebo-controlled, 3-arm study (with
early
escape at Week 16) of placebo, golimumab 50 mg, or golimumab 100 mg
administered as SC injections every 4 weeks in subjects with active PsA.
Subjects
were to be assessed for routine efficacy and safety assessments through Week
52,
with long term follow-up through 5 years of treatment. Primary efficacy
assessments were made at week 14 and week 24. The study was conducted at 57
global investigational sites and enrolled 405 subjects. Subjects may also be
receiving methotrexate (MTX), NSAIDS, or oral or low potency (2.5% or less)
topical corticosteroids. If receiving MTX, treatment should have started at
least 3
months prior to receiving golimumab, not exceed 25 mg/week, be stable and not
exhibit serious side effects attributable to MTX. Other treatments are
discontinued
prior to entry into the study.
At selected study sites, 100 subjects had serum samples collected for
biomarker profiling and certain single analyte ELISAs. The biomarker sampling
occurred at baseline and at weeks 4 and 14 on study. One of the objectives of
the
serum biomarker component of the study was to identify whether a biomarker (or
set
of biomarkers) could be used to prospectively predict a subject's response or
non-
response to golimumab.
Biomarker data was collected at three timepoints for each subject in the
substudy: baseline, week 4, and week 14. At each time point, 92 protein
biomarkers
were assayed. A complete list of the biomarkers is shown in Table 2.
The sera were analyzed for biomarkers using commercially available assays
employing either a multiplex analysis performed by Rules Based Medicine
(Austin,
TX) or single analyte ELISA. All samples were stored at -80 C until tested.
The
samples were thawed at room temperature, vortexed, spun at 13,000 x g for 5
minutes for clarification and 150 uL was removed for antigen analysis into a
master
microtiter plate. Using automated pipetting, an aliquot of each sample was
38
CA 02769462 2012-01-27
WO 2011/014349 PCT/US2010/041714
introduced into one of the capture microsphere multiplexes of the analytes.
These
mixtures of sample and capture microspheres were thoroughly mixed and
incubated
at room temperature for 1 hour. Multiplexed cocktails of biotinylated,
reporter
antibodies for each multiplex were used and detected using streptavidin-
phycoerythrin. Analysis was performed in a Luminex 100 instrument and the
resulting data stream was interpreted using proprietary data analysis software
developed at Rules-Based Medicine and licensed to Qiagen Instruments. For each
multiplex, both calibrators and controls were run. Testing results were
determined
first for the high, medium and low controls for each multiplex to ensure
proper assay
performance. Unknown values for each of the analytes localized in a specific
multiplex were determined using 4 and 5 parameter, weighted and non-weighted
curve fitting algorithms included in the data analysis package.
TABLE 2
Protein Biomarker Units Swiss-Prot Accession #
Adiponectin ug/mL Q15848
Alpha-1 Antitypsin mg/mL P07758
Alpha-2 Macroglobulin mg/mL P01023
Alpha-Fetoprotein ng/mL P02771
Apolipoprotein A-1 mg/mL P02647
Apolipoprotein CIII ug/mL P02656
Apolipoprotein H ug/mL P02749
Beta 2-Microglobulin ug/mL P01884
Brain-Derived Neurotrophic Factor ng/mL P23560
(BDNF)
39
CA 02769462 2012-01-27
WO 2011/014349 PCT/US2010/041714
TABLE 2
Protein Biomarker Units Swiss-Prot Accession #
Calcitonin pg/mL P01258
Cancer Antigen 125 U/mL Q14596
Cancer Antigen 19-9 U/mL Q9BXJ9
Carcinoembryonic Antigen ng/mL P78448
CD40 ng/mL P25942
CD40 Ligand ng/mL P29965
Complement component 3 mg/mL P01024
C-Reactive Protein ug/mL P02741
Creatine Kinase MB - Brain ng/mL P12277
ENA-78 ng/mL P42830
(Epithelial Neutrophil Activating Peptide
78)
Endothelin pg/mL P05305
ENRAGE ng/mL P80511
Eotaxin pg/mL P51671
Epidermal Growth Factor pg/mL P01133
Erythropoietin pg/mL P01588
Factor VII ng/mL P08709
Fatty Acid Binding Protein ng/mL P05413
Ferritin - Heavy ng/mL P02794
CA 02769462 2012-01-27
WO 2011/014349 PCT/US2010/041714
TABLE 2
Protein Biomarker Units Swiss-Prot Accession #
FGF-basic pg/mL P0903 8
Fibrinogen alpha chain mg/mL P02671
G-CSF pg/mL P09919
Glutathione S-Transferase alpha ng/mL P08263
GM-CSF pg/mL P04141
Growth Hormone ng/mL P01241
Haptoglobin mg/mL P00738
ICAM-1 (Intercellular Adhesion ng/mL P05362
Molecule 1)
IFN gamma pg/mL P01579
IgA mg/mL na
IgE ng/mL na
IGF-1 ng/mL P05019
IgM mg/mL na
IL-1 receptor antagonist pg/mL Q9UBHO
IL-10 pg/mL P22301
IL-12 p40 ng/mL P29460
IL-12 p70 pg/mL P29459
IL-13 pg/mL P35225
IL-15 ng/mL P40933
41
CA 02769462 2012-01-27
WO 2011/014349 PCT/US2010/041714
TABLE 2
Protein Biomarker Units Swiss-Prot Accession #
IL-16 pg/mL Q14005
IL-17 (IL17A) pg/mL Q16552
IL-18 pg/mL Q14116
IL-1 alpha ng/mL P01583
IL-lbeta pg/mL P01584
IL-2 pg/mL P01585
IL-23 p 19 ng/mL Q9NPF7
IL-3 ng/mL P08700
IL-4 pg/mL P05112
IL-5 pg/mL P05113
IL-6 pg/mL P05231
IL-7 pg/mL P13232
IL-8 pg/mL P10145
Insulin uIU/mL P01308
Leptin ng/mL P41159
Lipoprotein (a) ug/mL P08519
Lymphotactin ng/mL P47992
MCP-1 (Monocyte Chemotactic Protein pg/mL P13500
1)
MDC (Macrophage-Derived Chemokine) pg/mL 000626
42
CA 02769462 2012-01-27
WO 2011/014349 PCT/US2010/041714
TABLE 2
Protein Biomarker Units Swiss-Prot Accession #
MIP-1 alpha (Macrophage Inflammatory pg/mL P10147
Protein 1 alpha)
MIP-1 beta (Macrophage Inflammatory pg/mL P13236
Protein 1 beta)
MMP-2 (Matrix Metalloproteinase 2) ng/mL P08253
MMP-3 (Matrix Metalloproteinase 3) ng/mL P08254
MMP-9 (Matrix Metalloproteinase 9) ng/mL P14780
Myeloperoxidase ng/mL P05164
Myoglobin ng/mL P02144
PAI-1 ng/mL P05121
PAPPA mIU/mL Q13219
Prostate-Specific Antigen (PSA), Free ng/mL P07288
Prostatic Acid Phosphatase (PAP) ng/mL P15309
RANTES ng/mL P13501
serum amyloid P component, (SA) ug/mL P02743
SGOT (Serum Glutamic Oxaloacetic ug/mL P17174
Transaminase)
SHBG nmol/L P04278
Stem Cell Factor pg/mL P21583
Thrombopoietin (TPO) ng/mL P40225
Thyroid Stimulating Hormone (TSH) - uIU/mL P01215
43
CA 02769462 2012-01-27
WO 2011/014349 PCT/US2010/041714
TABLE 2
Protein Biomarker Units Swiss-Prot Accession #
alpha
Thyroxine Binding Globulin (TBG) ug/mL P05543
TIMP-1 (Tissue Inhibitor of ng/mL P01033
Metalloproteinase 1)
Tissue factor (coagulation factor III, ng/mL P13726
thromboplastin)
TNF RII (Tumor Necrosis Factor ng/mL Q92956
Receptor 2)
TNF-alpha (Tumor Necrosis Factor pg/mL P01375
alpha)
TNF-beta (Tumor Necrosis Factor beta) pg/mL P01374
VCAM-1 ng/mL P 19320
VEGF pg/mL P 15692
vWF (von Willebrand Factor) ug/mL P04275
All 100 subjects enrolled in the sub-study had complete protein biomarker
data collected for all three timepoints (baseline, week 4, and week 14), for a
total of
300 subject samples.
Each of the 92 biomarkers has an established lower limit of quantification
(LLOQ). The Biomarker statistical analysis plan (SAP) prospectively defined a
criterion for using a biomarker in the analysis that required the biomarker to
be
above the limit of quantification in at least 20% of baseline samples. Of the
92
biomarkers, 62 (67%) met that criterion for inclusion in the subsequent
analysis.
44
CA 02769462 2012-01-27
WO 2011/014349 PCT/US2010/041714
The distribution of the number of samples at the lower limit of detection
across
biomarkers was plotted. Table 3 identifies the biomarkers that were included
in the
final analysis. An assessment of the distributions of each biomarker was made
to
determine whether a log transformation of that biomarker was warranted. This
assessment was made without regard to treatment group. Overall, 59 of the 62
biomarkers in the analysis set were log2 transformed (Table 3).
TABLE 3
#Samples at
LOQ (300 Log
Marker Units LOQ Total) Transform
Adiponectin ug/mL 0.2 0 TRUE
mg/m
Alpha-1 Antitrypsin L 0.011 0 TRUE
mg/m
Alpha-2 Macroglobulin L 0.061 0 TRUE
Alpha-Fetoprotein ng/mL 0.43 6 TRUE
mg/m 0.006
Apolipoprotein Al L 6 0 TRUE
Apolipoprotein CIII ug/mL 2.7 0 TRUE
Apolipoprotein H ug/mL 8.8 0 TRUE
Beta-2 Microglobulin ug/mL 0.013 0 TRUE
Brain-Derived Neurotrophic
Factor ng/mL 0.029 0 TRUE
0.001
C Reactive Protein ug/mL 5 0 TRUE
CA 02769462 2012-01-27
WO 2011/014349 PCT/US2010/041714
TABLE 3
#Samples at
LOQ (300 Log
Marker Units LOQ Total) Transform
Cancer Antigen 125 U/mL 4.2 0 TRUE
Cancer Antigen 19-9 U/mL 0.25 27 TRUE
Carcinoembryonic Antigen ng/mL 0.84 127 TRUE
CD40 ng/mL 0.021 0 TRUE
CD40 Ligand ng/mL 0.02 0 FALSE
mg/m 0.005
Complement 3 L 3 0 TRUE
EGF pg/mL 7.4 13 TRUE
EN-RAGE ng/mL 0.25 0 TRUE
ENA-78 ng/mL 0.076 0 TRUE
Eotaxin pg/mL 41 17 TRUE
Factor VII ng/mL 1 0 TRUE
Ferritin ng/mL 1.4 0 TRUE
mg/m 0.009
Fibrinogen L 8 120 TRUE
G-CSF pg/mL 5 117 TRUE
Glutathione S-Transferase ng/mL 0.4 0 TRUE
Growth Hormone ng/mL 0.13 159 TRUE
Haptoglobin mg/m 0.025 1 TRUE
46
CA 02769462 2012-01-27
WO 2011/014349 PCT/US2010/041714
TABLE 3
#Samples at
LOQ (300 Log
Marker Units LOQ Total) Transform
L
ICAM-1 ng/mL 3.2 0 TRUE
mg/m 0.008
IgA L 4 5 FALSE
IgE ng/mL 14 213 TRUE
IGF-1 ng/mL 4 180 TRUE
mg/m
IgM L 0.015 0 TRUE
IL-16 pg/mL 66 0 TRUE
IL-18 pg/mL 54 1 TRUE
IL-lra pg/mL 15 10 TRUE
IL-8 pg/mL 3.5 3 TRUE
uIU/m
Insulin L 0.86 24 TRUE
Leptin ng/mL 0.1 0 TRUE
Lipoprotein (a) ug/mL 3.7 0 TRUE
MCP-1 pg/mL 52 2 TRUE
MDC pg/mL 14 0 TRUE
MIP-lalpha pg/mL 13 183 TRUE
47
CA 02769462 2012-01-27
WO 2011/014349 PCT/US2010/041714
TABLE 3
#Samples at
LOQ (300 Log
Marker Units LOQ Total) Transform
MIP-lbeta pg/mL 38 4 TRUE
MMP-3 ng/mL 0.2 0 TRUE
Myeloperoxidase ng/mL 68 14 TRUE
Myoglobin ng/mL 1.1 0 TRUE
PAI-1 ng/mL 0.9 0 TRUE
Prostate Specific Antigen, Free ng/mL 0.023 117 TRUE
Prostatic Acid Phosphatase ng/mL 0.034 0 TRUE
RANTES ng/mL 0.048 0 TRUE
Serum Amyloid P (SAP) ug/mL 0.058 0 TRUE
SGOT ug/mL 3.7 58 TRUE
nmol/
SHBG L 1.3 0 TRUE
Stem Cell Factor pg/mL 56 0 TRUE
uIU/m
Thyroid Stimulating Hormone L 0.028 3 FALSE
Thyroxine Binding Globulin ug/mL 0.34 0 TRUE
TIMP-1 ng/mL 8.4 0 TRUE
TNF-alpha pg/mL 4 242 TRUE
TNF RII ng/mL 0.13 0 TRUE
48
CA 02769462 2012-01-27
WO 2011/014349 PCT/US2010/041714
TABLE 3
#Samples at
LOQ (300 Log
Marker Units LOQ Total) Transform
VCAM-1 ng/mL 2.6 0 TRUE
VEGF pg/mL 7.5 0 TRUE
von Willebrand Factor ug/mL 0.4 0 TRUE
A clustered correlation (heatmap) was used as an overall assessment of data
quality. No sample outliers were seen in that analysis. The average pairwise
correlation from the sample correlation matrix was also assessed and all
samples
showed at least an average of 89% correlation to other samples, indicating the
biomarker data was consistent across subject samples.
Thus, the quality of the data was assessed as very high for the biomarker
protein profiling analysis. No samples were excluded and 62 of the 92
biomarkers
measured had detectable (20% of samples above the LLOQ) data available for
inclusion in the analysis.
EXAMPLE 2: CLINICAL ENDPOINT AND DATA VALIDATION
The data from 100 patients representing a subgroup of a 405 patient clinical
study of golimumab in the treatment of psoriatic arthritis were analyzed using
biometric, clinical assessment measurements and the 62 biomarker values.
Baseline clinical characteristics for subjects in the substudy were well
balanced across the three treatment groups (Table 4) where continuous
variables are
represented as the Mean SD (Min-Max) and categorical variables as
percentages.
Note that this CRP measurement was obtained separately from the CRP generated
on the protein array. All subjects in the substudy were followed through weeks
14
and 24 and had each of the protocol-specified biomarker assessments at three
time
49
CA 02769462 2012-01-27
WO 2011/014349 PCT/US2010/041714
points (baseline, Week 4, and Week 14). While some subjects qualified for the
early
escape phase of the trial (had less than 10% improvement in tender and swollen
joint
count at week 16), all subjects had clinical endpoint data at 14 and 24 weeks
(Table
5).
Table 4.
Placebo Gol 50 mg Gol 100mg Total
N 26 39 35 100
Age (yrs) 44.3 10.7 46.9 10.0 50.7 9.8 47.5 10.3
(29-66) (29-68) (29-77) (29-77)
Weight (kg) 87.2 19.6 91.3 16.6 92.9 20.6 90.8 18.8
(59-136) (55-126) (61-144) (55-144)
Sex (% Male) 54% 67% 60% 61%
Race 96% 92% 94% 94%
(% Caucasian)
CRP1 1.19 1.40 1.03 1.26 1.63 1.94 1.28 1.57
(ug/mL) (0.3-5.1) (0.3-6.9) (0.3-9.2) (0.30-9.20)
MTX Usage 38% 33% 37% 36%
(%Yes)
Swollen Joint 11.8 8.7 13.0 7.4 10.3 4.9 11.7 7.0
Count (3-43) (3-43) (3-22) (3-43)
Tender Joint 20.7 12.5 21.1 13.0 21.0 10.5 21.0 12.0
Count (6-55) (3-50) (3-52) (3-55)
CA 02769462 2012-01-27
WO 2011/014349 PCT/US2010/041714
TABLE 5
Treatment Enrolled Baseline Week 4 Week 14 Qualified Clinical
Group in Data Data Data for Early Endpoint
Protein Collected Collected Collected Escape at Data
Study Week 16 Available
at Weeks
14/24
Placebo 26 26/26 26/26 26/26 11/26 26/26
(100%) (100%) (100%) (42%) (100%)
Gol 50mg 39 39/39 39/39 39/39 6/39 39/39
(100%) (100%) (100%) (15%) (100%)
Gol 100mg 35 35/35 35/35 35/35 7/35 35/35
(100%) (100%) (100%) (20%) (100%)
Total 100 100/100 100/100 100/100 24/100 100/100
(100%) (100%) (100%) (24%) (100%)
The treatment effect on clinical endpoints within this cohort, is shown in
Table 6 (responder/total in each group). The golimumab groups had
significantly
higher response rates compared to placebo across the range of clinical
endpoints
assessed, with the exception of HAQ.
51
CA 02769462 2012-01-27
WO 2011/014349 PCT/US2010/041714
TABLE 6
Endpoint Gol 100m2 Gol 50m2 Placebo Overall Gol vs
Placebo P
ACR20 Wk14 13/35 (37%) 21/39 (54%) 2/26 (8%) 36/100 (36%) 0.0003
ACR20 Wk24 24/35 (69%) 19/39 (49%) 6/26 (23%) 49/100 (49%) 0.003
DAS28 Wk14 24/35 (69%) 26/39(67%) 6/26 (23%) 56/100 (56%) 0.0002
DAS28 Wk24 29/35 (83%) 26/39 (67%) 7/26 (27%) 62/100 (62%) 0.00004
PASI75 Wk14 14/35 (40%) 11/39 (28%) 3/26 (12%) 28/100 (28%) 0.041
APCS Wk14 23/35 (66%) 22/39 (56%) 6/26 (23%) 51/100 (51%) 0.001
HAQ Wk14 22/35 (63%) 23/39 (59%) 10/26 (38%) 55/100 (55%) 0.067
HAQ Wk24 23/35 (66%) 19/39 (49%) 11/26(42%) 53/100 (53%) 0.256
After the initial analysis of changes in markers levels by treatment group it
was clear that there was no dose response effect. Thus it was decided to
combine
the golimumab treatment groups.
EXAMPLE 3: MODEL BUILDING
At baseline, there were multiple significant associations between biomarker
levels and biometric or clinical characteristics of sex, weight, age, baseline
CRP,
baseline swollen joint count (SJC.bl), and tender joint count at baseline
(TJC.bl)
found by robust linear regression analysis. For example, leptin correlated
with sex,
weight, and age with a p-value of less than 0.01.
Markers that changed between baseline and Week 4, where the change was
significantly (p < 0.01) different between the placebo group and golimumab
treated
group include: alpha- l-Antitrypsin, CRP, ENRAGE, haptoglobin, ICAM-1, IL-16,
IL-18, IL-Ira, IL-8, MCP-1, MIP-lbeta, MMP-3, myeloperoxidase, serum amyloid
P, thyroxine binding globulin, TNFRII, and VEGF.
52
CA 02769462 2012-01-27
WO 2011/014349 PCT/US2010/041714
The clinical study demonstrated that golimumab treatment was significantly
superior to placebo across the range of clinical endpoints assessed for
subjects with
PsA, with the exception of HAQ. Robust logistic regression models were used to
test for the association of biomarkers with clinical endpoints. Predictive
models
were developed using a classification and regression tree (CART) approach with
cross validation.
A series of statistical analyses was performed to determine if there was an
association between biomarker expression and the primary clinical endpoints,
within
the combined golimumab treated group.
All analysis was performed using R (R: A Language and Environment for
Statistical Computing, 2008, Author: R Development Core Team, R Foundation for
Statistical Computing, Vienna, Austria, ISBN 3-900051-07-0). Change from
baseline was tested using one-sample t-tests. Association of clinical factors
with
baseline biomarkers was evaluated using robust linear regression models.
Robust
logistic regression models were used to test for the association of biomarkers
with
clinical endpoints. Clinical endpoint variables that were Yes/No used a 1/0
coding.
Clinical endpoints that were continuous were converted into 1/0 variables for
this
analysis by applying a threshold at the median value of all subjects.
Generally, the identification of markers associated with the different
clinical
endpoints varied across endpoints. This result is most likely due to the
differences
in the clinical endpoint measures, i.e., ACR measures arthritis related signs
and
symptoms whereas PASI measures changes in the skin. The endpoint with the
strongest set of biomarker associations was DAS28, at both week 14 and week
24.
DAS28 was also the endpoint with the most significant treatment effect.
Since many comparisons were made in this analysis (62 markers at baseline,
wk 4, wk14, as well as change in marker from baseline to week 4, and change
from
baseline to week 14 times the 9 clinical endpoints), using a p value of <0.05
for a
marker association (odds ratio) with a single endpoint at a single time point
was not
considered to be sufficiently strong evidence for an association. To increase
the
53
CA 02769462 2012-01-27
WO 2011/014349 PCT/US2010/041714
reliability of the results, the focus was put on identifying markers that
showed
significant association with multiple clinical endpoints at multiple
timepoints. The
baseline markers identified consistently across timepoints and clinical
endpoints
were: adiponectin, prostatic acid phosphatase (PAP), MDC (also described as
macrophage-derived chemokine, MDC(1-69), MGC34554, CCL22, SCYA22, small
inducible cytokine A22 precursor, STCP-1, stimulated T-cell chemotactic
protein 1),
SGOT (aspartate aminotransferase), and VEGF. Each of these five markers was
significant for at least four clinical endpoints, was significant for at least
three
timepoints, and had an odds ratio (OR) of greater than 2.0 for at least one
endpoint.
For these markers, Table 7 shows the odds ratios and p-values for biomarker
association with the clinical endpoint DAS28 for all golimumab treated
subjects. In
this table, the OR represents the increased odds of a clinical response for a
1 unit
change on the log2 scale, or a doubling on the linear scale. Numbers less than
1
represent an inverse association.
TABLE 7
Marker Week 0 A Week 4 Week 4 A Week 14 Week 14
OR p OR p OR p OR p OR p
Adiponectin 2.26 0.025 8.99 0.061 2.82 0.009 2.39 0.456 2.56 0.015
MDC 0.59 0.274 0.34 0.165 0.34 0.041 0.49 0.339 0.29 0.036
PAP 2.99 0.017 0.15 0.005 0.80 0.644 0.25 0.015 0.89 0.788
SGOT 0.28 0.002 2.69 0.023 0.69 0.269 2.10 0.046 0.66 0.277
VEGF 2.21 0.014 0.21 0.014 1.42 0.160 0.28 0.053 1.64 0.072
Table 8 shows the statistical association of these five markers across at
least
two endpoints either based on Week 4 or Week 14 biomarker data where
1=ACR2OWk14; 2=ACR2OWk24; 3=Early Escape; 4=DAS28 Wk14;
5=DAS28Wk24; 6=PCSWk14; 7=PASI75Wk14; 8=HAQWk14; 9=HAQWk24. In
54
CA 02769462 2012-01-27
WO 2011/014349 PCT/US2010/041714
general the Week 4 and Week 14 markers were similar, and showed significant
association to multiple clinical endpoints.
TABLE 8.
Marker Week 0 A Week 4 Week 4 A Week 14 Week 14
Adiponectin 3, 4, 7 8 4, 7 4, 7
MDC 3, 5, 7 1, 4, 9 1, 3, 7 4
PAP 1,2,4,5 1,4,5 1,4,5
SGOT 2,4,5,6 4,5 2 4,7 2
VEGF 4 4,5,9 5,8,9
In contrast to the biomarker/clinical endpoint associations observed within
the golimumab treated group, there was no association of biomarker values to
clinical endpoint responses within the placebo group. This result serves as an
internal control or benchmark for the more significant biomarker results seen
in the
golimumab biomarker analyses.
A method using statistical analyses was developed to determine which
biomarkers could be used to predict the response of the patients to treatment.
All
markers were eligible for inclusion in the model, not just those displaying
individual
(univariant) statistical significance. The rationale for this approach is that
certain
markers may not be strongly predictive on their own, but may add predictive
strength to the model after accounting for the effects of other markers.
All prediction models herein were developed using classification and
regression trees (CART) and employed cross validation. The CART models are
displayed in the form of a decision tree. The end nodes of the tree are
labeled with a
class prediction (Yes for a predicted clinical endpoint responder, No for a
predicted
non-responder) and two numbers (x/y, where x is the actual number of non-
responders in the study who would fall into that node and y is the actual
number of
responders who would fall into that node). The overall accuracy of the model
is the
number of x's across the `No' end nodes plus the number of y's across the
`Yes' end
CA 02769462 2012-01-27
WO 2011/014349 PCT/US2010/041714
nodes. Models were developed for the primary clinical endpoint, ACR20, at
Week14.
First, a clinical-only model was developed, where only clinical factors (no
protein biomarkers) were used to build and validate the model. The clinical
model
serves as a benchmark against which the various biomarker prediction models
can
be evaluated. Second, a model was built based on only baseline biomarker data.
A
third model incorporated both baseline clinical factors and baseline biomarker
data.
The fourth model used biomarker data at baseline and at week4 (change from
baseline). The last model used biomarker data at baseline and at week4 (change
from baseline) as well as clinical factors. All markers were eligible for
inclusion in
the model, not just markers with univariate significance.
Clinical Only
The accuracy of the clinical-only model was 49/74 (66%) for prediction of
clinical response (ACR20 at Weekl4). The model is displayed in Fig. 1. The
clinical model uses age as the initial predictor: subjects above 50.5 years
are
predicted to be non-responders; subjects below 37.5 years are predicted to be
responders, and subjects with intermediate age are classified based on the
secondary
predictor of baseline CRP (baseline CRP above .55 predicted as responders,
baseline
CRP below 0.55 predicted as non-responders). This model sensitivity was 50%,
and
the model specificity was 80%.
Baseline Biomarker Prediction Models
The statistical method was applied to determine which biomarkers at
baseline could be used to predict the response of the patients to treatment
using
ACR20 measured at Week 14. A diagram of the model is given in Figure 2 showing
that the decision tree uses VEGF analyzed by the present protein profiling
method as
the initial classifier: that is, patients with VEGF less than 8.082 (log
scale) are
predicted to be non-responders. Subjects with VEGF levels greater than or
equal to
8.082 are further classified using the baseline PAP and adiponectin levels.
Patients
are classified as non-responders if PAP is less than or equal to 2.287 (log
scale);
56
CA 02769462 2012-01-27
WO 2011/014349 PCT/US2010/041714
those with baseline PAP levels greater than 2.287 are then further classified
based
on the use of a secondary predictor of baseline adiponectin. The patients with
an
adiponectin result greater than or equal to 1.35 (log scale) are predicted to
be
responders, while patients with adiponectin below 1.35 predicted to be non-
responders. The accuracy (percentage True Positives + True Negatives) of the
model overall was 76% and for predicting responders was 53% vs predicting non-
responders at 95%. The sensitivity of the model was 53% and specificity 95%.
Thus, using this model, the patient's clinical outcome (ACR20) at Week 14 was
accurately predicted for 76% of the patients. This is considered a weak model
due
to the low sensitivity.
Change from Baseline at Week 4
A prediction model using the biomarker data was developed to determine if
the change in a biomarker concentration at Week 4 of treatment could predict
the
clinical outcome at Week 14. The model is displayed in Figure 3. The biomarker
model uses the change from baseline in MDC levels as the initial classifier:
patients
with MDC decreases greater than or equal to -0.1206 (log scale) fall into
branch 1
of the model; patients with an MDC decrease which is less than -0.1206 fall
into
branch 2 of the model. The patients on branch Tare further classified based on
the
change in lipoprotein A. Subjects on branch 1 with change in Lipoprotein A
concentration greater than or equal to -0.2275 are classified as non-
responders, and
those with a change < -0.2275 are responders. For those subjects in branch 2,
subjects with a decrease from baseline in beta-2 microglobulin levels greater
than or
equal to -0.1112 are classified as responders; those with beta-2 microglobulin
change less than -0.1112 are classified as non-responders. The accuracy of the
model for responders was 79%, and the accuracy for non-responders was 90%
(combined accuracy was 63/74 (85%) for predicting clinical outcome (ACR20) at
Week 14. Sensitivity was 73% and specificity was 90%.
When the CART analysis method was performed using the baseline or
change from baseline to week 4 biomarker data plus the clinical factors (sex,
weight,
57
CA 02769462 2012-01-27
WO 2011/014349 PCT/US2010/041714
age, baseline CRP, SJC.bl, and TJC.bl) the sensitivity and specificity of the
model
produced was identical to the baseline and week4 biomarker model, indicating
that
the clinical factors at baseline did not enhance the predictive power of the
algorithm
over that relying on serum markers only.
Summary
The results of the protein biomarker study showed that multiple biomarkers
changed significantly as a consequence of golimumab therapy. In contrast, few
biomarker changes were observed in the placebo control arm. Two novel
biomarker-based clinical response prediction models were developed, one that
used
baseline biomarker values to predict a patients clinical response, another
that used
early (Week 4) changes in biomarker values to predict longer term (for
example,
Week 14) clinical responses. The models suggest that a subset of the markers
have
changes associated with clinical response to golimumab, as opposed to simply
being
non-specific effects of treatment, which provide a sensitive and specific
predictive
model (Table 9). Importantly, the biomarker values (either at baseline or the
week 4
changes) preceded the longer term clinical outcomes.
TABLE 9.
Model Accuracy Sensitivity Specificity
Clinical Only 66% 50% 80%
Baseline 76% 53% 95%
Week 4 change 85% 73% 90%
from Baseline
Adiponectin is important for homeostasis of glucose metabolism and levels
are elevated in RA patients with active disease (Popa et al., 2009). VEGF is
an
endothelial growth factor and plays a role in angiogenesis, a hallmark of the
inflamed skin and joints of patients with active PsA (Fink et al., 2007). MDC
or
CCL22 is a chemokine that is elevated in patients with juvenile inflammatory
58
CA 02769462 2012-01-27
WO 2011/014349 PCT/US2010/041714
arthritis (Jager et al., 2007). Elevated levels of liver enzymes (including
SGOT)
have been shown in rheumatoid arthritis and psoriatic arthritis patients
(Curtis et al.,
2009). Thus, the markers identified in the predictive algorithm may be
representative of disease associated processes.
59