Note: Descriptions are shown in the official language in which they were submitted.
CA 02769798 2012-02-24
NONINVASIVE CHARACTERIZATION OF A FLOWING MULTIPHASE
FLUID USING ULTRASONIC INTERFEROMETRY
This application is a divisional application of Canadian Patent File No.
2,490,871 filed June 10th, 2003.
FIELD OF THE INVENTION
1.0 The present invention relates generally to swept frequency acoustic
interferometric (SFAI) determination of sound velocity and absorption in
fluids
and, more particularly, to the use of SFAI to noninvasively determine flow
velocity
and composition for flowing fluids.
BACKGROUND OF THE INVENTION
Swept frequency acoustic interferometry (SFAI) [1] is an adaptation of the =
techniques of ultrasonic interferometry developed several decades ago for
determining sound velocity and absorption in liquids and gases. In the
original
technique, and also in more recent modifications of the technique [2], the
transducers (sensors) were placed in direct contact with the fluid being
tested.
This restricted the use of this technique to highly specialized laboratory
characterization of fluids. By contrast, the SFAI technique extends the
capabilities of the ultrasonic interferometry techhique significantly and
allows the
noninvasive determination of velocity and attenuation of sound in a fluid
(liquid,
gas, mixtures, emulsions, etc.,) inside sealed containers (pipes, tanks,
chemical
reactors, etc.) over a wide frequency range. In addition, if the container
material
properties (density and sound velocity) are known, the liquid density can be
determined using the SFAI technique. It has also been shown that it is
possible
to uniquely identify various chemical compounds and their most significant
precursors based on the physical parameters of sound: velocity, attenuation,
frequency dependence of sound attenuation, and density [3].
CA 02769798 2012-02-24
2
Oil companies have recently shown interest in noninvasive techniques for
characterizing oil flow in pipes from oil fields.
U.S. Patent No. 5,606,130 [4] states that it is anticipated that the SFAI
measurements described therein can be performed on flowing samples in pipes.
However, no mention is made therein of how to perform such measurements.
Accordingly, the present invention seeks to provide an apparatus and
method for determining the composition of flowing fluids.
Further, the invention seeks to provide an apparatus and method for
determining the flow rate of a fluid.
Additional aspects, advantages and novel features of the invention will be
set forth in part in the description which follows, and in part will become
apparent
to those skilled in the art upon examination of the following or may be
learned
by practice of the invention. The aspects and advantages of the invention may
be
realized and attained by means of the instrumentalities and combinations
particularly pointed out in the appended claims.
SUMMARY OF THE INVENTION
To achieve the foregoing and other aspects, and in accordance with the
purposes of the present invention, as embodied and broadly described herein,
the
method for monitoring the composition of a fluid flowing through a vessel
hereof
includes the steps of: applying a continuous periodic acoustical signal to the
outside of the vessel such that the acoustical signal is transferred to the
flowing
fluid, thereby generating vibrational resonance features having a plurality of
maxima and minima therein; detecting the vibrational features generated in the
flowing liquid; sweeping the continuous periodic acoustical signal through a
chosen frequency range which includes two chosen consecutive maxima among
the vibrational resonance features; and measuring the frequency difference -
between the two chosen consecutive maxima of the flowing fluid, whereby
changes in the composition of the fluid are identified.
CA 02769798 2012-02-24
2a
=
Another aspect of the invention comprehends an apparatus for
monitoring the composition of a fluid flowing through a vessel which comprises
in combination a first transducer in acoustic contact with the outside surface
of the
vessel for applying a continuous periodic acoustical signal to the outside of
the
vessel such that the acoustical signal is transferred to the flowing fluid,
thereby
generating vibrational resonance features having a plurality of maxima and
minima
therein, and a second transducer in acoustic contact with the outside of the
vessel
and located on the same side thereof as the first transducer and in the
vicinity
thereof, for detecting the vibrational resonance features generated in the
flowing
liquid. A sweep generator is provided for sweeping the first transducer
through
a chosen frequency range which includes two chosen consecutive maxima among
the vibrational resonance features. A data processor determines the frequency
difference between the two chosen consecutive maxima of the flowing fluid.
Another aspect of the invention pertains to a method for monitoring the
composition of a fluid flowing at a flow rate through a vessel which comprises
the
steps of applying a continuous periodic acoustical signal to the outside of
the
vessel such that the acoustical signal is transferred to the flowing fluid,
thereby
generating vibrational resonance features having a plurality of maxima and
minima
therein, detecting the vibrational features generated in the flowing liquid,
sweeping
the continuous periodic acoustical signal through a chosen frequency range
which
includes one maximum among the vibrational resonance features, measuring the
frequency of the maximum of the flowing fluid, measuring the flow rate of the
fluid, and correcting the frequency of the maximum for the rate of flow.
Further still the invention comprehends an apparatus for monitoring the
composition of a fluid flowing at a flow rate through a vessel which comprises
in
combination, a first transducer in acoustic contact with the outside surface
of the
vessel for applying a continuous periodic acoustical signal to the outside of
the
vessel such that the acoustical signal is transferred to the flowing fluid,
thereby
CA 02769798 2012-02-24
2b
generating vibrational resonance features having a plurality of maxima and
minima
therein, and a second transducer in acoustic contact with the outside of the
vessel
and located on the side thereof opposite to the first transducer for detecting
the
vibrational resonance features generated in the flowing liquid. A sweep
generator
is provided for sweeping the first transducer through a chosen frequency range
which includes a chosen maximum among the vibrational resonance features, and
a flow meter measures the flow rate of the fluid. A data processor is provided
for
determining the frequency of the chosen maximum and for correcting the
frequency for the flow rate of the flowing fluid.
=
CA 02769798 2012-02-24
3
In another aspect of the present invention, in accordance with its objects
and purposes, the method for monitoring the flow rate of a fluid through a
vessel
hereof includes the steps of: applying a continuous periodic acoustical signal
to
the outside of the vessel such that the acoustical signal is transferred to
the
flowing fluid, thereby generating vibrational resonance features having a
plurality
of maxima and minima therein; detecting the vibrational resonance features
generated in the flowing liquid; sweeping the continuous periodic signal
through a
chosen frequency range which includes two chosen consecutive maxima in the
standing-wave vibrational pattern; recording the frequency difference between
the two chosen consecutive maxima to determine whether the composition of the
fluid has changed; correcting the location of the resonance peaks in response
thereto; and determining the frequency of one chosen resonance peak, whereby
the flow rate of the fluid is determined.
In yet another aspect of the present invention, in accordance with its
objects and purposes, the method for monitoring the composition of a fluid
flowing at a flow rate through a vessel hereof includes the steps of: applying
a
continuous periodic acoustical signal to the outside of the vessel such that
the
acoustical signal is transferred to the flowing fluid, thereby generating
vibrational
resonance features having a plurality of maxima and minima therein; detecting
the vibrational features generated in the flowing liquid; sweeping the
continuous
periodic acoustical signal through a chosen frequency range which includes one
maximum among the vibrational resonance features; measuring the flow rate of
the fluid; measuring the frequency of the maximum of the flowing fluid; and
correcting the frequency of the maximum for the flow rate of the fluid,
whereby
changes in the composition of the fluid are identified.
In still another aspect of the present invention, in accordance with its
objects and purposes, the method for monitoring the flow rate of a fluid
having a
composition and flowing through a vessel hereof includes the steps of:
applying a
continuous periodic acoustical signal to the outside of the vessel such that
the
CA 02769798 2012-02-24
4
acoustical signal is transferred to the flowing fluid, thereby generating
vibrational
resonance features having a plurality of maxima and minima therein; detecting
the vibrational features generated in the flowing liquid; sweeping the
continuous
periodic acoustical signal through a chosen frequency range which includes one
maximum among the vibrational resonance features; measuring the frequency of
the maximum of the flowing fluid; determining the composition of the fluid;
and
correcting the frequency of the maximum for the composition of the fluid,
whereby the flow rate of the fluid is determined.
Benefits and advantages of the present invention include the noninvasive
measurement of flow rate and changes in composition of a flowing fluid.
BRIEF DESCRIPTION OF THE DRAWINGS
The accompanying drawings, which are incorporated in and form a part of
the specification, illustrate an embodiment of the present invention and,
together
with the description, serve to explain the principles of the invention. In the
drawings:
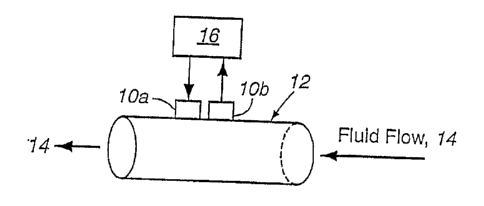
FIGURE la is a schematic representation of one embodiment of the
apparatus of the present invention showing a dual-element transducer located
on
one side of the pipe or tube through which the liquid flows, FIG. lb shows a
second embodiment of the apparatus of the present invention showing the
transmitting transducer on one side of the pipe or tube and the receiving
transducer on the other side thereof, and FIG_ lc shows a third embodiment of
the present invention, wherein a single piezoelectric transducer is used for
both
generating an oscillatory signal in the sample and for responding to the
resonances produced thereby.
FIGURE 2 shows an example of an electronic circuit suitable for observing
the resonance response of the fluid flowing through the tube or pipe as a
function
of frequency; a similar apparatus would be suitable for observing changes in
the
phase of the fluid from that of the initial ultrasound signal impressed upon
the
CA 02769798 2012-02-24
tube or pipe by the transmitting transducer as a function of changes in fluid
composition or flow rate.
FIGURE 3 is a composite resonance spectrum for a noninvasive
measurement using a swept frequency apparatus and method of the present
5 invention,
and illustrates that liquid peaks can be studied independently of the
resonances induced in the wall of the container if an appropriate frequency
region is selected.
FIGURE 4 is a graph of the physical properties of several liquids
measured in a static container.
o FIGURE 5
shows swept frequency acoustic interferometry measurements
made under flowing conditions, showing that the sound speed which is related
to
the spacing between the peaks for consecutive resonance does not change as a
result of the flow, nor does the sound attenuation which is related to the
width of
the resonance peaks.
FIGURE 6 shows swept frequency acoustic interferometry measurements
made in a liquid which contains bubbles; again, the spacing between the peaks
does not change.
FIGURE 7 is a graph of the measured differential phase magnitude as a
function of mass flow for water.
FIGURE 8 shows the resonance patterns for water and oil as a function of
frequency and illustrates that at an appropriate frequency the resonance peak
characteristics are sensitive to the acoustic properties of the liquid.
DETAILED DESCRIPTION
Briefly, the present invention includes apparatus and method for
noninvasively monitoring both the flow and/or the composition of a flowing
fluid
using ultrasound. In what follows, fluid will be defined as a liquid,
including
liquids with more than one constituent, liquids with some particulates and
those
containing gas bubbles. As will be described in detail hereinbelow, it was
found
that the position of the resonance peaks for a fluid excited by a swept-
frequency
CA 02769798 2012-02-24
6
ultrasonic signal change frequency both in response to a change in composition
and in response to a change in the flow velocity thereof. Additionally, the
_frequency difference -between successive resonance peaks does not change as
a function of flow, but rather in response to a change in composition_ Thus, a
measurement of both parameters (resonance position and resonance spacing),
once calibrated, permits the simultaneous determination of flow rate and
composition using the apparatus and method of the present invention.
Additional
parameters useful for determining the fluid composition include the full-width-
at-
half-maximum of a resonance feature, the amplitude ratio and the acoustic
impedance of the liquid. None of these parameters was found to change
significantly as a function of flow rate. The apparatus was tested using
decane,
dodecane, water, and brine solutions to determine whether these compositions
readily distinguishable using the swept frequency acoustic interferometry
(SFAI)
technique that has been described in detail for static fluids in U.S. Patent
No.
5,767,407 [11 and U.S. Patent No. 5,886,262 [5], the teachings of both
references
which may be referred to for further details.
Reference will now be made in detail to the present preferred
embodiments of the invention, examples of which are illustrated in the
accompanying drawings. Similar or identical structure are labeled using
identical
callout. Turning now to FIG. la, a schematic representation of one embodiment
of the apparatus of the present invention is shown illustrating a dual-element
transducer or two, single-element transducers 10a and 10b, located on one side
of the pipe or tube, 12, through which fluid, 14, flows, and electronics, 16,
provide
the fixed or variable acoustic driving frequency, 18, and receive the
resonance
signal, 20, generated in fluid 14. FIGURE lb shows a second embodiment of the
apparatus of the present invention showing transmitting transducer 10a powered
by swept sine-wave generator, 20, on one side of pipe or tube 12 and receiving
transducer 10b in electrical connection with receiving and analyzing
electronics,
22, on the other side thereof. Examples of the circuitry and principles of
CA 02769798 2013-12-19
7
operation are found in the description for the '262 patent, supra. For single-
frequency excitation of resonances within the fluid 14, the change in phase
can
be monitored by the apparatus. As will be demonstrated hereinbelow, tube or
pipe 12 can be fabricated from metals, plastics or glass. FIGURE 1c shows a
third embodiment of the present invention, wherein a single piezoelectric
transducer, 24, is used for both generating an oscillatory signal in the
sample and
for responding to the resonances produced thereby. As is also described in the
description for the '262 patent, supra, bridge circuit, 26, is employed to
derive a
differential signal and includes one arm which contains transducer 24, a
balancing arm which contains a matching or equivalent circuit for the
transducer,
and a swept sine-wave generator. When the transducer is not attached to the
pipe, the output is zero; however, when attached to the pipe, a changing pipe
impedance due to standing waves generated therein generates a signal of one
arm relative to that of the other arm and the output is the difference between
these values.
For measurement of the flow rate, it is necessary to correct for changes in
the composition of the fluid, or at least have the knowledge that the
composition
is not changing. There are numerous commercially available composition
monitoring devices including real-time, on-line devices such as infrared
spectrometers, and uv/vis spectrometers, as examples, and sampling devices
such as liquid chromatographs and mass spectrometers as examples. One
might take a sample for analysis using a syringe introduced through a septum
for
off-site analysis. Another procedure would be to stop the flow and utilize the
SFAI procedure detailed in Reference I. Due to the number and variety of these
methods, FIGS. la-1c do not show any devices for monitoring the composition of
the flowing fluid; except for those taught by the present claimed invention.
Similarly, for monitoring the composition of the fluid; certain embodiments of
the
present invention require that a correction to the resonance peak location for
the
fluid flow rate be made, or at least knowledge that the flow rate is constant.
CA 02769798 2012-02-24
8
There are numerous and varied commercially available flow measuring devices,
some disposed in the interior of a pipe through which the fluid is flowing,
and
others disposed on the exterior of the pipe. Again, no flow measuring devices
are illustrated in FIGS. la-1c except for those taught by the present claimed
s invention, for the same reason as the fluid composition monitoring
apparatus is
not displayed.
FIGURE 2 shows an example of an electronic circuit suitable for observing
the resonance response of the fluid flowing 14 through the tube or pipe 12 as
a
function of frequency; a similar apparatus would be suitable for observing
changes in the phase of the fluid from that of the initial ultrasound signal
impressed upon the tube or pipe by the transmitting transducer as a function
of
changes in composition of the fluid and/or changes in fluid flow rate. The
electronic circuit comprises a direct digital synthesizer (DDS) IC, 28, for
generating frequencies up to 10 MHz; amplifier, 30, for amplifying the output
is signal of transducer 10b; phase detector, 32, for providing a voltage
output
proportional to the difference in phase between two sine-waves; analog-to-
digital
(ND) converter, 34, having a minimum of two-channel multiplexing capability,
36
MUX (multiplexer); microcontroller, 38 having floating point calculation and
fast
Fourier transform (FFT) capability; and display unit, 40, for displaying the
results.
The two transducers utilized were commercial, off-the-shelf piezoelectric
transducers (Panametric Videoscan 5 MHz center frequency, 0.5 in. diameter
transducers). The actual brand is not critical to the measurements and almost
any transducer can be employed.
Microcontroller 38 is software programmable and controls DDS 28 to
generate sine-waves having a chosen frequency within the frequency range of
the device. The frequency output of DDS 28 can either be fixed or varied with
time (that is, swept). The frequency resolution of the apparatus used to
demonstrate the present invention was better than 0.1 Hz. The frequency could
be swept over a chosen frequency range in a fraction of a second.
CA 02769798 2012-02-24
9
The output of the DDS is used to excite the transmitter transducer 10a
placed in physical contact with pipe 10 through which liquid 14 can be
flowing.
Second transducer 10b is used as the receiver. It is also possible to use a
single
transducer and measure the impedance change thereof (FIG. lc hereof) to make
the same type of measurement. However, for the present description, it is
simpler to discuss the two separated transducer embodiment which are placed in
physical contact with pipe 12 either on the same side thereof in the vicinity
of one
another or on opposite sides of pipe 12. Receiver transducer 10b receives the
signal response of the fluid/pipe to the excitation signal from transducer 10a
which is amplified by amplifier 30 with a gain of up to 60 dB. The amplified
signal
is processed using multiplexing input 36 of A-D converter 34. Microcontroller
38
controls the switching of multiplexer 36 input and the data output from A-D
converter 34.
For phase measurements, phase detector 32 circuit is employed having
as its output the phase difference between the signal to transmitter
transducer
10a and the amplified signal of receiver transducer 106: Typically, phase
measurements are made at a fixed frequency that corresponds to a resonance
peak when there is no liquid flow through the pipe_ When the liquid is allowed
to
flow, the phase detector output is related to the magnitude of the flow. There
is
no simple relationship to describe the phase difference as a function of flow
and
a calibration is required. The observed phase difference is an approximately
linear function of the flow (see FIG. 7 hereof). Microcontroller 38 can
continuously monitor the phase output and convert this to a flow value and
display the results using display 40.
For fluid composition monitoring, the circuit switches to the channel that
directs the amplified receiver transducer signal output to ND converter 34.
For
this measurement, the frequency applied to the transmitter transducer is
rapidly
swept through a chosen frequency range. This range depends on the
dimensions of the pipe (see FIG. 3 hereof). Although any convenient frequency
CA 02769798 2012-02-24
range may be employed, it is preferred that a frequency range between two
successive wall resonances (see FIG. 3 hereof) be used. This produces a flat
baseline and the results can be fitted to a theory involving simple equations.
A
brief description of the relationships follows.
As stated hereinabove, in order to readily obtain the acoustical properties
of a fluid, it is convenient to select a measurement frequency range to avoid
resonance contributions from the walls (approximately 4, 6, and 8 MHz in FIG.
3
as examples). To first order, this reduces the analysis essentially to that of
sound transmission through a one-layer model making the calculations more
10 straightforward without introducing substantial errors in the measurement
of
sound speed and sound attenuation. This is similar to avoiding the transducer
crystal resonance frequency region in traditional interferometry. The
intensity
transmission coefficient, T, for the case of a single fluid layer having path-
length.
L, attenuation coefficient, ocL (aLL<<l), and sound speed, CL, between two
identical wall boundaries can be expressed as
1
T = (1)
(1+-1a aL 1_,) 2 + a2- 4 Sin2(/,)
2 4
where, a = zilzw,
co = 27d, is the angular frequency, and zwand ZL are the
acoustic impedance of the wall and fluid, respectively. For most liquids
inside a
metal container, a zwlzb Tin Eq. (1) is a periodic function of colict. and
reaches
a maximum (peak) value whenever the condition 27rfnUct_ = arc is satisfied,
where
fn is the frequency of the n-th peak. From this condition, the sound speed CL
( CL
= 2 L ) can
be determined if the frequency difference between successive
peaks is measured.
As stated, the sound speed in the fluid is determined from the frequency
spacing between any two consecutive peaks. Therefore, one needs to sweep
the frequency over a range that encompasses any two successive resonance
peaks. The digitized data of two resonance peaks can then be used to extract
CA 02769798 2012-02-24
11
the sound speed since the liquid path length (the diameter of the pipe) is
known.
This is the most expedient manner for determining the sound speed in the
fluid,
and the measurement can be made in a fraction of a second. If either greater
accuracy or resolution is required, a second approach may be used. In this
s approach, a much larger frequency range is covered such that multiple
resonance peaks (say, 10) are observed. The microcontroller is used to perform
a FFT of the data which determines the periodicity of the resonance peaks
which
is directly related to the peak spacing. This is equivalent to averaging the
sound
speed measurement over multiple peak spacings.
io Sound attenuation and liquid density are related to the frequency
spectrum. The ratio of transmission coefficient minima, Ta,/,,, and maxima,
Ta.,
can be expressed in terms of a and aL as:
T . 2
________________________ =+Laa2). (2)
Tniax
Equation (2) illustrates that both aL and cy can be determined from a linear
fit of
15 the data of the transmission ratio factor as a function of f2. The
intercept at zero
frequency is related to the acoustic impedance ratio cy. If the impedance of
the
wall material is known, the liquid density can be determined since the sound
speed of the fluid is independently determined as discussed hereinabove.
Another for determining the sound attenuation coefficient is to utilize the
20 half-power bandwidth of observed resonance peaks. From Eq. (1), an
inverse
solution for the half-power bandwidth, Sf, can be derived in terms of acoustic
properties of the fluid according to
by'2 cL cL oti(f2)
= ________________________ u L+ (3)
71"
Similar to Eq. (2), the second term is the contribution from liquid sound
25 absorption and is identical to the solution obtained from resonator
theory of
transducers in direct contact with the liquid. The first term, the width
extrapolated
CA 02769798 2012-02-24
12
to zero frequency .5.10, is independent of frequency and depends on cy, CL,
and L.
This term results from the reflection loss at the wall-liquid interface due to
acoustic impedance mismatch and can be used to determine liquid density if the
acoustic impedance of the wall is known. This analysis can be used to extract
the absolute value of the sound absorption of the liquid. More often,
monitoring
the peak width for the resonance peaks for say oil and water (see FIG. 8
hereof)
to obtain qualitative discrimination is sufficient. The resonance width is the
full-
width-at-half-maximum of the peak, and the microcontroller can rapidly
calculate
this quantity by fitting the top part of any peak with a Lorentzian line
shape. The
Lorentzian can be linearized by inverting (taking the reciprocal of the
amplitude at
each frequency) the data and then a simple parabolic fit is all that is
necessary
instead of a nonlinear least-squares fitting. The width indicated for crude
oil in
FIG. 8 is meant only for qualitative description.
Thus, the spectrum contains all the information related to the liquid, any
desired parameter can be extracted through simple calculations.
The above description covers the behavior of sound transmission through
a fluid path as a function of frequency and Eq. (1) described the frequency
spectrum. It is possible to least-squares curve-fit this equation to observed
experimental data to extract various parameters of the fluid, such as sound
speed, sound absorption, and density. However, it is also possible to derive
the
same information with good accuracy even by monitoring a single resonance
peak. In practice, one often requires to monitor the change in the quality of
the
fluid, in terms of sound speed, sound absorption and density variation,
flowing
through a pipe and not absolute values of these quantities. In such a
situation, an
electronic circuit simply selects and tracks a single resonance peak and
measures the peak width, peak position, and the minimum value (the baseline)
of
the resonance curve.
If the sound speed of the fluid changes, the selected resonance peak
position will change in frequency. This frequency shift (Afs) is related to
the
CA 02769798 2012-02-24
13
sound speed variation (Ac) simply as A = (n/2L) Ac. Here n, is the order
number
of the particular resonance peak. Similarly, if the sound absorption of the
liquid
changes then the observed difference in full-width at half-maximum (6f) value
of
the resonance peak for a selected resonance peak A(5f) provides the change in
sound absorption as A (5f) (Acht)Act. Another method for determining the
change in sound absorption is to measure the ratio of the resonance peak
minimum, Tmia to the peak maximum, Tmax for a single resonance feature. The
change in absorption Aa = A(TminfTmax)/L (see Eq. (2) and FIG. 8 hereof). This
approach provides a more rapid procedure for determining Ac and does not
require curve fitting.
Finally, the variation in the minimum (Trnin) of the resonance curve can
provide a measure of the variation in the change in acoustic impedance of the
liquid. The relationship between the two parameters can be expressed as ATrnin
(2/Zw) AZ, where AZ is the change in acoustic impedance of the liquid. All
these relationships are derived from Eq. (1), and are shown graphically in
FIG. 8
hereof for description purposes. For qualitative monitoring of variation in
sound
absorption, for example, for simple discrimination between oil and water, it
is
expedient to simply determine the width of the resonance peak between the
maximum and minimum of the resonance as shown in FIG. 8. For accurate =
determination of sound absorption, it is better to fit the resonance spectrum
with
several peaks using Eq. (1).
By employing a phase-locked-loop circuit that simultaneously monitors
both the resonance peak position of a single peak and the peak width in the
most
sensitive frequency region, both sound speed and sound attenuation are
provided continuously. These values are then used to characterize the fluid as
in
the case of the SFAI. With an additional circuit, the density of the liquid
can be
monitored. The phase-locking is accomplished by using a saw-tooth wave signal
to vary the frequency of the excitation transducer around the desired
resonance
CA 02769798 2012-02-24
14
frequency Of a single resonance peak. The resonance peak is monitored as a
function of time and provides a measure of the sound speed because the pipe
diameter is known. In this case, it is not necessary to determine the
frequency
spacing between any two consecutive peaks because the resonance spectrum is
determined by the path length (pipe or tube diameter) and the sound speed of
the liquid. Therefore, the position of a single known peak determines the
sound
speed. The output of the frequency modulation is a signal that is amplitude
modulated as it is swept through a resonance peak. If the resonance is sharp
then the amplitude modulation over the short frequency sweep region is of high
o amplitude with a high median amplitude value. For low amplitude or wide
resonance peaks, the output signal is of lower median value with lower
amplitude
excursions. Therefore, by measuring the RMS value of the signal and AC
coupling it so that the DC median value is filtered out, it is possible to
derive the
resonance peak width. The median DC value provides a measure of the liquid
density.
FIGURE 3 is a composite resonance spectrum for a noninvasive
measurement using the swept frequency apparatus and method of the present
invention on a container having a finite wall thickness, and illustrates that
liquid
peaks can be studied independently of the resonances induced in the wall of
the
container if an appropriate frequency region is selected. The following graph
shows what a typical spectrum looks like when a swept frequency measurement
is made from outside a container with a finite wall thickness.
FIGURE 4 is a graph of the physical properties of several liquids
measured in a static container. Decane and dodecane were investigated since
both of these liquids are known to have similar properties to those for oil.
Acoustically, these liquids are far apart. The sound speed and attenuation
values are summarized in the TABLE.
CA 02769798 2012-02-24
TABLE
Liquid Sound Density Attenuatio
speed g/cm3
m/s Npm1s2x
1014
Decane 1263 0_73 5.7
Dodecane 1300 0.75 6.3
Water 1483 1.00 2.5
Water+18% 1550 1.01 6.0
(NaCI) 1585 1.02 30.0
Water+26%
(NaCI)
The resolution for sound speed for the SFAI technique of the present
invention is approximately 2m/s; this can be improved to 0.1 m/s, if
necessary.
5 This difference between decane and dodecane permits them to be
identified.
Differentiating between water, brine and decane (or dodecane) is straight
forward. The same data are presented in a 3-dimensional graph in FIG. 3 for
clarity.
Recent studies on the sound speed in pure hydrocarbons and mixtures
10 using the traditional pulse-echo technique by Wang and Nur [5] show that
sound
speed in 13 n-alkanes, 10 1-alkenes, and 3 napthene hydrocarbon samples
show that the sound speed decreases linearly with temperature with slopes
ranging from -3.43 to -4.85 [m/s]/ C in a temperature range between -12 to
132 C. Therefore, if the temperature is known, the sound speed can be
is corrected for temperature. In a separate study [6] it is shown that the
sound
speed c for hydrocarbons can be expressed as a function of temperature T and
molecular weight M in atomic mass units as:
7 6
c co -(0.306 -HT where, c0 is a constant.
This shows that it should be possible to identify various hydrocarbons using
sound speed if this quantity can be measured accurately.
CA 02769798 2012-02-24
16
In addition to sound speed, the SFAI technique can also determine sound
absorption in the fluids, which provides an additional physical parameter for
oil
characterization. Hydrocarbons also show pronounced frequency dependent
sound absorption. The SFAI technique of the present invention is capable of
this
type of measurement as well.
A flow loop was employed to perform SFAI measurements under flowing
conditions. A 4.5-in, diameter plastic tube was used in the flow loop. Water
was
used for the liquid because it is easier to work with than crude oil. The
measurement was also performed with vegetable oil. FIGURE 5 shows the
io measurements under flowing conditions between 0 and 20 gal./min. of water.
The spacing between consecutive resonance peaks is seen to be the same for
flowing and non-flowing water. This indicates that the sound speed does not
change when the liquid is flowing. The width of the resonance peaks are also
observed to be the same, indicating that sound attenuation also remains
invariable under flowing conditions. The difference between the two spectra is
a
slight shift of the entire pattern in frequency.
It is believed by the present inventor that the frequency shift is due to a
slight variation in the acoustical properties of the fluid due to the flow
boundary
layer formed adjacent to the inner surface of the wall. This boundary layer
tends
to introduce a phase shift of the sound waves reflecting from the wall which
can
affect the standing-wave pattern formed inside the total fluid path length.
The
baseline drift to higher amplitude toward the higher frequency side of the
figure is
a result of the fact that the data presented are somewhat close to a wall
resonance peak (see FIG. 3 hereof). It has been observed that the constancy of
the sound speed is observed from the FFT of the data.
FIGURE 6 shows that SFAI measurements required for determining sound
speed can be made with fluids containing bubbles of gas. For this measurement,
nitrogen gas was bubbled through the bottom of a Plexiglas tube about 2-in, in
diameter, and the measurements were made by attaching two transducers on the
CA 02769798 2012-02-24
17
outside of the tube. To be noted is that that the frequency spacing between
consecutive resonance peaks does not significantly change, and that the
spectra
can- be clearly observed (the measurements were made with little (¨ 1 ms)
integration time); moreover, the periodicity can still be determined at
relatively
s high bubbling rates. This indicates that the sound speed does not change
appreciably until the volume fraction of bubbles is large when the bubbling
rate is
too high. If the integration of the measurement is increased by a factor of
10, the
signal-to-noise ratio of the data was found to improve considerably, and the
observed pattern for the bubbling liquid was found to be similar to the same
liquid
0 without introduced bubbles. This is because all the fluctuations due to the
bubbles in the measurements are averaged out, and up to a certain bubble rate,
the SFA1 measurements are still quite reliable.
FIGURE 7 is a plot of the shift in phase angle as a function of mass flow,
demonstrating that the apparatus of the present invention is useful as a
15 noninvasive flow meter; that is, by attaching transducers to the outside
of an
existing pipe, the flow of the fluid therein can be monitored.
For real-time (continuous) monitoring, it has been found to be most useful
to select a single resonance peak at an appropriate frequency. Figure 8 is a
plot
of resonance amplitude as a function of frequency for crude oil (upper trace)
and
20 for water (lower trace) in a 2-inch diameter glass pipe. In the
frequency range
between 3.78 and 3.8 MHz (enclosed by the rectangle), the particular resonator
cavity (the inside of the pipe) reaches its maximum sensitivity in terms of
monitoring changes in sound speed. There are Many such frequencies
dispersed in a regular manner. A frequency shift of 5 kHz is observed between
25 the data for crude oil and water. The SFAI technique of the present
invention
can easily resolve 1 Hz, therefore, allowing a sound speed resolution of 1
part in
5000. Besides the shift in frequency, the resonance width also changes
dramatically which indicates a large variation in sound absorption. In
addition,
the minimum of the resonance also changes due to a change in acoustic
CA 02769798 2012-02-24
18
impedance mismatch and can be related to liquid density. Electronic circuitry
has been developed that can monitor all three parameters in a continuous
manner. - The shift in the baseline for the two plots (water and crude oil) is
due to
the fact that the acoustic impedance is different for the two fluids. The
minimum
value of the resonance provides a measure of the fluid density that can be
derived from the acoustic impedance mismatch between the pipe wall and the
fluid inside.
Thus, it is seen that frequency location of the resonance peaks varies as a
function of both the composition of the fluid and its flow rate. If a flow
meter is
desired, the composition must be determined to be constant; this can be
achieved by monitoring the peak spacing to determine that the sound speed of
the fluid remains relatively constant for in-situ calibration. The calibration
can
also be performed using a small section of the same pipe and a known liquid
elsewhere in any flowing system to derive the calibration information. In the
flow
calibration, any resonance peak in a desired frequency range (preferably in
the
frequency range in the middle of two wall resonance peaks) is monitored as a
function of the liquid flow. The wall resonance peak positions are determined
by
the wall thickness. The present apparatus can be calibrated for both high and
low sensitivity measurements as follows: For low frequencies (approximately 1
MHz), the shift of the resonance peaks is smaller than the shift observed at
much
higher frequency (approximately 10 MHz). By observing multiple frequency
ranges, it is possible to obtain different levels of sensitivity. This
calibration
process is no different than for other transit-time ultrasonic flow meters
where the
fluid sound speed is to be determined. Once the apparatus is calibrated for
flow,
then both sound speed (and sound absorption) and fluid flow can be
simultaneously monitored if great accuracy in the measurement is not desired.
For many practical applications, such as flow and composition monitoring in
the
oil (petroleum products) industry, an oil flow calibration provides adequate
accuracy. It is also possible, in principle, to extend the flow calibration
from one
CA 02769798 2012-02-24
19
liquid, for example, water to oil. FIGURE 8 illustrates the difference in the
resonance peaks for oil and water. The widths of the resonance peaks are
different for the two liquids, and -each liquid can be identified based on the
resonance characteristics of just a single resonance peak. Therefore, once the
calibration for flow is completed for oil and separately for water, it is
possible to
extrapolate the flow rate when the flowing fluid is a combination of the two
liquids
because this quantity is intermediate between the two calibrations. This is
possible because the composition can be monitored from a measurement of the
peak spacing or by FFT of the resonance data, whereas the flow is measured by
tracking the position of a single resonance peak. These two measurements are
independent of each other to a large extent in practice.
The present invention provides information at both low and high flow rates.
Since the frequency shift of the peaks due to flow increases with frequency,
for
low flow rates it is convenient to use a higher frequency range 5 MHz) where a
small flow rate produces a measurable shift in peak frequency or phase shift
of
any selected resonance peak. By contrast, for higher flow rates, the resonance
peak shift can be large and one may lose track of the selected peak which is
equivalent to exceeding a 360-degree phase shift. In this case, it is
appropriate
to observe the data at a lower frequency region
1 MHz). The appropriate
frequency ranges depend on the particular pipe geometry and may be
determined during the initial calibration process where a wide-band frequency
scan is employed to determine the characteristics Of the pipe (see FIG. 3
hereof).
As mentioned hereinabove, it is preferable to use the frequency regions
between
two wall resonance frequencies for both flow and composition monitoring.
For a calibration of the system for flow, measurements (receiver signal
amplitude and phase difference) are made with a flowing liquid for several
flow
values and the entire frequency spectrum is monitored. Once this is done, the
calibration information for the low and high frequency ranges are extracted
from
=
CA 02769798 2012-02-24
these spectra and stored in the microcontroller as terms of simple equations.
From this any value can then be interpolated for actual measurement.
Once the apparatus is calibrated for flow, both sound speed (and sound
absorption) and fluid flow can be simultaneously monitored if great accuracy
in
5 the measurement is not desired. For flow and composition monitoring of
petroleum products, a simple flow calibration with oil can provide adequate
monitoring. It is also possible, in principle, to extend the flow calibration
from one
liquid, for example, water to oil. FIGURE 8 shows the difference in the
resonance peaks for oil and water, and the liquid can be readily identified
from
10 the resonance characteristics of a single peak. Once the calibration for
flow is
performed with oil and then with water, it is possible to correct the flow
when the
flowing fluid is a combination of any two because the measured results will be
between those for either liquid. This is possible because the composition is
monitored by measuring the peak spacing or FFT of the resonance data,
15 whereas the flow is measured by tracking the position of a single resonance
peak. These two measurements are independent of each other.
The foregoing description of the invention has been presented for
purposes of illustration and description and is not intended to be exhaustive
or to
limit the invention to the precise form disclosed, and obviously many
20 modifications and variations are possible in light of the above
teaching. The
embodiments were chosen and described in order to best explain the principles
of the invention and its practical application to thereby enable others
skilled in the
art to best utilize the invention in various embodiments and with various
modifications as are suited to the particular use contemplated. It is intended
that
the scope of the invention be defined by the claims appended hereto.
REFERENCES
1. U.S. Patent No. 5,767,407 for "Noninvasive Identification Of Fluids By
Swept-
Frequency Acoustic Interferometry," which issued to Dipen N. Sinha on June
16, 1998.
CA 02769798 2012-02-24
21
2. F. Eggers and Th. Funck, "Ultrasonic relaxation spectroscopy in liquids",
Naturwissenschaften 63, 280 (1976).
3. Dipen N. Sinha and Greg Kaduchak, "Noninvasive Determination of Sound
Speed and Attenuation in Liquids," Experimental Methods in the Physical
Sciences, Volume 39, Academic Press (September 2001).
4. U.S. Patent No. 5,606,130 for "Method For Determining The Octane Rating Of
Gasoline Samples By Observing Corresponding Acoustic Resonances
Therein" which issued to Dipen N. Sinha and Brian W. Anthony on February
25, 1997
3.0 5. U.S. Patent No. 5,886,262 for "Apparatus And Method For Comparing
Corresponding Acoustic Resonances in Liquids" which issued to Dipen N.
Sinha on March 23, 1999.
6. Zhijing Wang and Amos Nur, J. Acoust. Soc. Am. 89, 2725 (1991).
7. Z. Wang and A. Nur, Geophysics 55, 723 (1990).