Note: Descriptions are shown in the official language in which they were submitted.
CA 02769881 2012-02-01
WO 2011/018206 P07EP2010/004882
ANTENNA CHARACTERISATION IN A WAVEGUIDE
The invention relates to a method for determining at least one characteristic
of an antenna in
accordance with claim 1 and an advantageous measuring device for this purpose
in
accordance with claim 16.
A characteristic of an antenna is understood to mean any kind of
characteristic of the
antenna, for example individual parameters, time curves of parameters or
direction- and
frequency-dependent characteristics, for example radiation diagrams. With
known methods,
such characteristic data of antennas are usually determined within the
frequency domain. A
test signal is thereby generated by a frequency generator, such that a so-
called frequency
sweep is performed over a particular frequency range which is to be examined.
Each
frequency is thereby held constant for a short period of time, until the
antenna achieves a
steady-state condition. A measurement is then carried out on the antenna in
order to
determine the characteristic data,
One known method is, for example, the reference antenna method, which requires
an
absolutely defined radiating antenna, for example an open waveguide probe or a
horn
antenna, as reference. A disadvantage of this method is that measuring is
relatively time-
consuming and/or costly, since several reference antennas often need to be
provided and
measured in succession, as such reference antennas display a limited,
relatively narrow
effective bandwidth. In order also to provide a high purity of polarisation,
precisely
manufactured and absolutely characterised reference antennas are necessary,
which are
therefore relatively expensive. In many cases, therefore, such expenditure is
not justified.
Also known is the 2-antenna method, in which two antennas of exactly identical
design must
be placed opposite one another at a defined distance in a reflection-free
space. This method
CA 02769881 2012-02-01
WO 2011/018206 PC /EP2O10/004882
2
,gives rise to the problem of obtaining two antennas of exactly identical
design, which can be
difficult in individual cases. Also known is the 3-antenna method which, while
delivering good
results, is relatively time-consuming and labour-intensive.
The invention is therefore based on the problem of providing a more rational
method for
determining at least one characteristic of an antenna and a measuring device
for this
purpose.
This problem is solved through the invention described in claims 1 and 16. The
dependent
claims describe advantageous further developments of the invention.
The invention can, advantageously, be realised using simple means. It is
advantageous that
use can be made of widely-used measuring devices, for example a waveguide.
Fundamentally, all types of waveguide which offer sufficient space for the
placement of the
antenna and which, at least at times, provide a TEM field at the location of
the antenna can
be considered as suitable for application of the invention. A TEM field is the
term used to
describe a transverse electromagnetic field in which the field vector of the
electric field and
the field vector of the magnetic field are perpendicular to one another and
both field vectors
are perpendicular to the direction of propagation.
Accordingly, various arrangements can be considered as waveguides which can be
used
advantageously in performing the invented method, for example a parallel plate
line,
consisting of an upper and a lower metal plate which enclose a particular
space within which
the antenna which is to be measured can be placed. In order to perform the
invented
method, the space enclosed by the waveguide need not necessarily be an
enclosed space;
a space which is partially open at the sides is also conceivable, in which
case less shielding
against external interference is provided than with an enclosed waveguide, for
example a
coaxial waveguide of constant width or one which widens in a longitudinal
direction.
A TEM waveguide in particular is advantageous for application of the
invention, since this
favours a propagation of the TEM field at the location of the antenna which is
advantageous
for the invented method. In particular, the use of a TEM cell is advantageous,
i.e. a cell
which, for example, is widely used in the field of EMC measurements (EMC =
electromagnetic compatibility). A Crawford cell, for example, can be used as
TEM cell. Due
to its expanded useful frequency range, a GTEM cell (GTEM = Gigahertz
Transverse
Electromagnetic Mode) can also be used particularly advantageously, This is a
closed and
CA 02769881 2012-02-01
WO 2011/018206 PCT/GP20101004582
metallically shielded measuring device in the form of a widening coaxial
waveguide. GTEM
cells are also widely used, in various construction sizes, for example for EMC
measurements, and are therefore readily available for an application of the
invention.
With the present invention, the scope of applications for TEM cells, in
particular GTEM cells,
is expanded to include the possibility of the characterisation of antennas.
The invention
suggests a completely different approach in comparison with the known means
described in
the prior art. According to the invention, an electric excitation signal is
fed into a feed
connection of the waveguide. An electric response signal emitted by the
antenna as a result
of the excitation signal is recorded, for example with an oscilloscope or a
signal analyser,
such as, for example, a spectrum or network analyser (NWA). The excitation
signal can
fundamentally be of any kind, for example an individual excitation pulse, a
plurality of
excitation pulses or a sequence of frequencies, as in the frequency sweep
mentioned above.
According to the invention, at least a portion of the response signal and a
corresponding
portion of the excitation signal is used for the determination of the at least
one characteristic
of the antenna. A particular portion of the response signal is used for this
purpose, namely a
time segment evaluated in the time domain which fulfils the following
conditions:
i) only one, or several, waves of the electromagnetic field caused by the
excitation signal
and running from the feed connection towards the antenna exist at the location
of the
antenna (also referred to in the following as propagating waves),
ii) the electromagnetic field at the location of the antenna is a TEM field.
The TEM field can propagate along flat and/or spherically curved phase fronts.
It is thus suggested that a time segment evaluated in the time domain be used
in which the
aforementioned conditions i) and ii) are fulfilled, which can, for example, be
realised through
the use of a suitable waveguide, for example a GTEM cell, and, for example,
through the
experimental determination of a suitable time segment of the response signal.
Through the aforementioned condition i) it is ensured that the analysed
portion of the
response signal does not contain any distorting superimpositions caused
through reflected
waves, for example through reflections from the rear wall of the GTEM cell.
Instead, a time
segment is used in which only propagating waves of the electromagnetic field
exist at the
location of the antenna. This allows a high accuracy of measurement and
reproducibility of
the antenna characterisation to be achieved.
CA 02769881 2012-02-01
WO 2011/018206 PCT/EP2010/004882
4
Moreover, according to the condition ii) a time segment is used in which the
electromagnetic
field at the location of the antenna is a TEM field. Measuring distortions
which occur through
intermittent deviations of the field from the TEM characteristic can be
eliminated from the
measurement result, and thus a distortion of the measuring result avoided,
through the
definition of the time segment. The fact that the field has a TEM
characteristic has the
advantage that the measurement creates equivalent field conditions which
correspond to
those of conventional reference antenna measurements, in which the antenna
which is to be
examined is usually located in the far field of a reference antenna. At the
location of the
antenna which is to be examined, this reference antenna far field is a
slightly spherically
curved TEM field and therefore largely identical to the virtually flat
conditions of a free space
measurement. The phase fronts of the TEM field within a GTEM cell are also
slightly
spherically curved due to the angle of rise of the septum.
Due to its special characteristics, the use of a GTEM cell has the advantage
that the analysis
of the measuring results is simplified. A GTEM cell has a Dirac function as
the first
component of the pulse response (see IEEE publication "Pulse Propagation in
Gigahertz
Transverse Electromagnetic Cells", Thye, Armbrecht, Koch). The GTEM cell
therefore does
not distort the response signal of the antenna through its own
characteristics. In particular,
the influence of a convolution of the GTEM characteristics with the response
signal need not
be taken into account. The transformation of the response signal into the
signal at the
location of the antenna thus takes place without distortion (without
dispersion).
The use of GTEM cells for antenna measurements has already been considered and
investigated in the past. However, no sufficiently exact correlation could be
established
between the measuring results obtained with a GTEM cell and the measuring
results
obtained in free space. The reason for this was, on the one hand, that the
examined antenna
was used as a transmission antenna, which led to an excitation, and thus to
parasitic
resonances due to higher field modes in the GTEM cell, which was transformed
in an
undefined manner into a voltage at the coaxial connection of the GTEM cell. On
the other
hand, where used for reception, again due to these multimode resonance
phenomena, the
occurrence of which is encouraged through non-ideal absorption properties of
the cell
connection located on the rear wall of the GTEM cell, it was also not possible
to provide a
field strength at the location of the antenna which is to be examined which
remains constant
over the greater part of the examined frequency range. It was therefore only
possible, at
best, to obtain rough estimates of simple parameters.
CA 02769881 2012-02-01
WO 2011/018206 PC'I'/EP2010/004882
By means of this invention, a GTEM cell can now be used for more precise
antenna
characterisations.
Fundamentally, the electric excitation signal, like the response signal, is a
time-dependent
signal.
5 According to an advantageous further development of the invention, a
frequency domain
signal can be used as excitation signal. A frequency domain signal is a signal
in which a test
signal is generated by a frequency generator such that a so-called frequency
sweep is
performed over a particular frequency range which is to be examined, i.e.
discrete
frequencies are set in succession, whereby each frequency is held constant for
a brief period
of time until the antenna achieves a steady-state condition.
Advantageously, a brief pause is provided between the setting of two frequency
values of
the excitation signal, the length of which is so dimensioned that the
electromagnetic waves
within the waveguide can decay so far that they have no relevance for the
further
measurement. The next frequency is then set.
Where the frequency domain signal is used as excitation signal, the full
voltage response of
the antenna during application of the excitation signal is recorded as the
response signal.
The response signal which is now obtained, which contains the plurality of fed-
in
frequencies, is transformed from the frequency domain into the time domain,
for example
through an inverse Fourier transformation. Of the response information which
now exists in
the time domain, a time segment is now used for the further determination of
the
characteristic in which only propagating waves of the electromagnetic field
are present and
these waves exist as a TEM field at the location of the antenna. For example,
a section of
the response information at the beginning of the timeline in the time domain
is used for this
purpose, whereby the duration is to be determined experimentally such that the
aforementioned conditions are fulfilled. For example, the anticipated timing
of reflected
waves can be estimated on the basis of the distance of the antenna from a
reflective rear
wall of the waveguide and the speed of propagation of the electromagnetic
field and,
accordingly, the analysed time segment cut out of the response information in
such a way
that it precedes the arrival of reflected waves.
According to an advantageous further development of the invention it is
suggested that an
electric excitation pulse, in particular an excitation pulse with high
frequency bandwidth, is
CA 02769881 2012-02-01
WO 2011/018206 PCT/EP2010/004882
6
fed as excitation signal, and that the response signal of the antenna be
recorded as a time
curve. This allows a characteristic of an antenna to be determined directly in
the time
domain, i.e. the information required for an analysis of the response signal
is already present
in the time domain, so that no transformation in the time domain is necessary.
This means
that the invented method is particularly simple to perform.
The use of an excitation pulse with high frequency bandwidth has the advantage
that with a
single pulse - or possibly several pulses - the antenna can be examined over a
wide
frequency range, for example over the entire desired reception range of an
antenna.
Through the use of an excitation pulse, a plurality of frequencies is
transmitted to the
antenna simultaneously, i.e. the frequencies which are contained in the
spectrum of the
excitation pulse. Through the invented method, the characterisation of a
single antenna is
significantly faster than known methods of antenna characterisation which
require a plurality
of reference antennas. Advantageously, through the multiple transmission of
pulses of the
same pulse form an increase in the achievable measuring dynamics can be
achieved, for
example through the elimination of noise influences through an averaging
across these
results of such multiple measurements.
According to an advantageous further development of the invention, a Gaussian
pulse is fed
in as excitation pulse. A Gaussian pulse is a pulse form in which the
amplitude curve over
time corresponds to, or at least resembles, a Gaussian normal distribution
curve. Such a
Gaussian pulse has the advantage of making possible an excitation with high
frequency
bandwidth.
According to an advantageous further development of the invention, the leading
edge of the
excitation pulse is relatively steep. At the leading edge of the excitation
pulse, 80% of the
amplitude of the excitation pulse is passed through in less than 1 ns
(nanoseconds). The
steepness of the leading edge allows a high frequency bandwidth of the
excitation pulse to
be achieved. In this way, even an ultra-wideband antenna (UWB antenna) with at
least 500
MHz bandwidth over its entire frequency domain can be measured with a single
excitation
pulse. This means that the invented method is particularly time-saving.
In effect, the invented method allows rapid, reliable antenna measurements
which can be
carried out economically using waveguides which are already in use, in
particular in
industrial applications, for example GTEM cells. A storage oscilloscope, for
example, can be
used to record the measurement data. Also, only a single example of an antenna
with
CA 02769881 2012-02-01
WO 201 1/018206 PCT/EP2010/004882
7
unknown characteristic data which is to be examined is necessary, i.e.
additional precisely.
calibrated reference antennas are no longer required. In the case of more
complex
prototypes of antennas, in particular, this avoids the cost-intensive
installation of several
examples.
A further advantage of the invented method involves an inherent increase in
the accuracy of
measurement resulting from the analysis of a portion of the response signal as
a time
segment analysed in the time domain. As studies of the propagation of waves
within a
GTEM cell have shown, despite the presence of a high-frequency absorber a not
insignificant reflection from the rear wall of the cell occurs which leads to
a reflected wave
(see IEEE publication "Pulse Propagation in Gigahertz Transverse
Electromagnetic Cells",
Thye, Armbrecht, Koch), In the case of measurements in the frequency domain in
which
each individual measuring frequency has to be kept constant for at least a
short period of
time, a superimposition between propagating and reflected waves necessarily
takes place at
the antenna which distorts the measurement result. Through the analysis in the
time domain
suggested with the present invention, measuring data can be recorded on the
antenna
before the reflected wave reaches the antenna. In this way, undesired
interfering influences
through reflections can be avoided, even if a frequency domain signal is used
as excitation
signal.
According to an advantageous further development of the invention, the
response signal is
recorded in the time domain. The recording can, for example, be carried out
using a storage
oscilloscope. Recording directly in the time domain has the advantage of
simplifying analysis
of the signal and the determination of the characteristic of the antenna. For
example, the
response signal can directly represent the characteristic of the antenna. In
this case the
response signal is a two-dimensional curve, for example a voltage over time,
from which the
skilled person in the field of antennas can derive the characteristics of the
antenna which is
to be examined. A further advantage is that the suggested measurements in the
time domain
make it possible to use electro-optical converters to transmit the response
signal from the
antenna to the measuring device, since only amplitude values, in the form of a
time curve,
need to be transmitted as the response signal from the antenna, and no
reference to the
phase position is necessary. In turn, the possibility of using electro-optical
converters in
combination with optical fibres has the advantage that parasitic field
distortions in the vicinity
of the antenna are reduced in comparison with conventional metallic cables.
According to an advantageous further development of the invention, a frequency
domain
CA 02769881 2012-02-01
WO 2011/018206 PCr/1sP2010/004882
8
signal is used as excitation signal. This has the advantage that existing
vectorial network
analysers previously used for antenna measurement can continue to be used.
According to an advantageous further development of the invention, a network
analyser is
used to perform the invented method, i.e. in order to generate the excitation
signal and for
the recording and analysis of the response signal. The network analyser can,
for example,
be set up specifically to perform the invented method through expansion in
terms of
software.
According to an advantageous further development of the invention, the
response signal is
recorded in phase within the frequency domain. In this way, advantageously,
the amplitude
and phase position of the complex response variable can be recorded directly
in the base of
the antenna (vectorial measurement). The response signal recorded in the
frequency
domain can then be transformed into the time domain via an inverse Fourier
transformation
and further analysed in sections.
According to an advantageous further development of the invention, the
response signal can
be further analysed in order to determine the characteristic. For example,
frequency domain
characteristics of the antenna can be determined from the response signal. For
this purpose,
the time segment of the antenna response analysed in the time domain can be
transformed
into the frequency domain. Characteristics such as the gain, directional
characteristic and/or
efficiency of the antenna, for example, can be determined in this way. In
comparison with
known antenna characterisation methods in the frequency domain, according to
the
invention these characteristics can already be determined over an extremely
wide band, i.e.
for a very wide frequency range, with one measurement, in particular if the
antenna was
already simultaneously excited with high frequency bandwidth as a result of
the electric
excitation pulse.
According to an advantageous further development of the invention,
transmission properties
of the antenna are determined from the response signal from the antenna, The
response
signal in itself characterises the reception properties of the antenna, since
this involves the
reception of a wave triggered by the excitation pulse. However, applying the
Lorentz
reciprocity theorem, the transmission signal, in particular the transmission
pulse response
htx(t, (pi, 8;), can also be derived from the response signal from the
antenna, in particular the
reception pulse response h,(t, (pi, 8;). This obviates the necessity for
complex additional
measurements to determine the transmission behaviour of an antenna. The
transmission
CA 02769881 2012-02-01
WO 2011/018206 PCT/P' P2010/004882
9
pulse response can be determined from the reception pulse response as follows:
htX(t, (Pi, ei) = 27- at hrx(t, (Pi, Oi)
(1)
where (pi and 6; are the respective coordinates for the orientation of the
antenna in relation to
the field in a spherical coordinate system. (pi is the azimuthal coordinate,
A; the elevation
coordinate, co is the speed of light.
Frequency range characteristics can also be derived from the reception-side
pulse response.
For this purpose it is necessary to transform the time domain signal h (t)
into the frequency
domain signal H, (w) by means of Fourier transformation, where w refers to the
angular
frequency. The following relationship exists with the effective gain (also
known as "absolute
gain") of an antenna:
z
G(co) = 44 (2n0) ca J k (o)y2
= 4rrJH. (0))2 .
(2)
A further typical characteristic in antenna technology is the effective
antenna area. This is
directly linked to the effective gain of an antenna:
I
A {a~}= 4n (2n~ CO
GW
=(2,r c0 JH4o1)
(3)
The above equations illustrate the relationship between the typical time
domain (reception-
and transmission-side pulse response) and frequency domain characteristics
(effective gain
and antenna area). These make it clear that the reception-side pulse response
is directly
CA 02769881 2012-02-01
WO 2011/018206 PCT/EP2010/004882
linked to the effective antenna area, whereas the transmission-side pulse
response is
directly linked to the effective gain. The relationship between effective
antenna area and
effective gain is established via the frequency.
"Reception-side" (index "rx") means that the antenna is used to receive
signals;
5 "transmission-side" (index "tx") means that the antenna is used to transmit
signals,
Starting out from the aforementioned characteristics, further characteristics
such as
directivity, efficiency, IEEE gain and group delay can be derived.
According to an advantageous further development of the invention, the
frequency
bandwidth of the excitation signal is equal to or greater than the frequency
bandwidth of the
10 antenna which is to be measured. Advantageously, this makes it possible to
measure the
antenna which is to be examined, over its entire frequency spectrum with a
single excitation
signal, in particular with a single excitation pulse.
According to an advantageous further development of the invention, the antenna
which is to
be examined is an ultra-wideband antenna, in particular an antenna with at
least 500 MHz
frequency bandwidth. It has been found that the invented method is
particularly
advantageous for the measurement of very broadband antennas.
According to an advantageous further development of the invention, the antenna
is arranged
in the waveguide so as to be movable in at least one spatial dimension or at
least one axis of
rotation. For example, the antenna can, by means of a corresponding electric
drive, be
rotatable around all three spatial coordinate axes. According to the further
development, a
first value of a characteristic of the antenna is determined in a first
antenna position and at
least a second value of the characteristic in a second antenna position. This
allows a series
of characteristics to be determined rapidly and simply in a plurality of
antenna positions. In
effect, this allows two- and/or three-dimensional radiation characteristics of
the antenna to
be determined quickly. In particular, if a GTEM cell is used, with a purely 2-
component TEM
field, an independent, i.e. coupling-free characterisation of the co- and
cross-polar antenna
components is possible through rotation of the antenna by 90 in relation to
the direction of
propagation.
According to an advantageous further development of the invention, the
dimensions of the
waveguide and/or the positioning of the antenna in the waveguide in the
longitudinal
direction of the waveguide are chosen depending on the duration of the
response signal
CA 02769881 2012-02-01
WO 2011/018206 PCT/1112010/004882
II
necessary for a determination of the desired characteristic and/or the size of
the antenna.
For example, in the case of a GTEM cell, where a relatively long duration of
the response
signal is anticipated, the antenna is positioned somewhat further away from
its rear wall than
if short response signals are expected in order, in this way, to rule out the
influence of
reflected waves. If positioning at a greater distance from the rear wall of
the GTEM cell does
not appear possible, for example because the distance from the side walls of
the GTEM cell
is too small for an undistorted measurement, a larger GTEM cell should be
chosen
accordingly.
According to an advantageous further development of the invention, the antenna
is arranged
in a position in the waveguide in which the ratio between relatively
orthogonal components of
the electric field strength and the magnetic field strength of a Cartesian 2-
component TEM
field - wherein both components are orthogonal to the main direction of
propagation of the
electromagnetic field in the waveguide - comes as close as possible to the
free space
intrinsic impedance, This prevents distortions of the measuring signal through
undesired
cross-polarisation coupling.
According to an advantageous further development of the invention, the method
according to
claim 1 is given the added step that characteristic data of the waveguide are
determined
through measurement. The determination of this data can, for example, take
place through
positioning of a field sensor with known, defined characteristic data in the
waveguide and
through feeding of an excitation pulse, as described for the GTEM cell in the
IEEE
publication "Pulse Propagation in Gigahertz Transverse Electromagnetic Cells",
Thye,
Armbrecht, Koch. In contrast to the placement of an antenna with unknown
properties which
is to be measured, a measurement of the unknown properties of the specific
GTEM cell or of
the waveguide by means of a field sensor serving as reference thus takes place
in this step.
Finally, the characteristic of the antenna is determined from the response
signal of the
antenna, which is determined in accordance with claim 1, in combination with
the measured
characteristic data of the waveguide, in that the response signal is corrected
mathematically
by the characteristic data of the waveguide. This further increases the
accuracy of
measurement of the invented method. Undesired distortions through the
waveguide can be
eliminated mathematically.
The invention also relates to a measuring device for determining at least one
characteristic
of an antenna, wherein the measuring device is set up to perform a method of
the kind
described above. For this purpose, the measuring device can, for example,
contain a signal
CA 02769881 2012-02-01
WO 2011/018206 PCT/EP2010/004882
12
generating device for generating the excitation signal and a signal recording
device for
recording the response signal as well as an integrated analysis of the
response signal. The
invention also comprises a separate expansion device which is adapted
accordingly in order
to determine at least one characteristic of an antenna according to a method
of the kind
explained above.
The adaptation of the measuring device or of the expansion device can, for
example, be
effected through a modification or expansion of the software for the device in
question. An
advantageous embodiment of the invention relates to a network analyser
specially adapted
in order to perform a method of the kind described above.
The invention is described in greater detail in the following with reference
to an embodiment,
using drawings, in which:
Figure 1 shows a perspective view of the fundamental structure of a GTEM cell
and
Figure 2 shows a perspective view of an example of an antenna which is to be
examined and
Figure 3 shows a side view of a measuring arrangement for performing the
invented
method with a GTEM cell
Figure 4 shows a diagrammatic representation of the influencing factors of the
invented
method and
Figure 5 shows the main field components of a TEM field within a GTEM cell in
diagrammatic form and
Figure 6 shows a top view of a GTEM cell and
Figure 7 shows the curve of the intrinsic impedances in a transverse direction
of the
GTEM cell, specifically as quotient of the main field components and
Figure 8 shows an exemplary excitation pulse and
Figure 9 shows exemplary pulse responses of the antenna and
Figure 10 shows a side view of a further embodiment of a measuring arrangement
for
performing the invented method with a GTEM cell and
CA 02769881 2012-02-01
WO 2011/018206 PCT/EP2010/004882
13
Figure 11 shows a measurement result for measurement of the effective gain of
a
standard gain horn.
In the figures, the same reference numbers are used for corresponding
elements.
A GTEM cell is described in the following as an example of a waveguide. As can
be seen in
Figure 1, a GTEM cell 1 has a pyramid-like form. The GTEM cell 1 possesses a
metallic
outer housing 2 with rectangular cross section. The outer housing 2 is
terminated on the side
facing away from the point of the pyramid by a rear wall 3. A high frequency
absorber 7 is
provided in the vicinity of the rear wall 3 which possesses a plurality of
absorber elements in
pyramidal form. A flat inner conductor 5 in plate form is arranged decentrally
in the interior of
the GTEM cell 1. The inner conductor 5 is also referred to as a septum. An
impedance
region 6 is provided in the region of the septum 5 adjacent to the rear wall
3. Through the
combination of the impedance region 6 with the high frequency absorber 7, the
GTEM cell 1
is terminated essentially free of reflection with the desired characteristic
impedance.
The septum 5 is arranged within the GTEM cell 1 in such a way that a
characteristic
impedance of 50 0 is achieved which is constant over the length of the GTEM
cell 1. The
GTEM cell 1 possesses an electric coaxial connection 4 for a coaxial feed line
for feeding in
signals. The inner conductor of the coaxial connection 4 passes continuously
from the
connection point into the septum 5 of the GTEM cell 1. The outer conductor of
the coaxial
connection 4 passes continuously from the connection point into the outer
conductor of the
GTEM cell 1, i.e. into the metallic outer housing 2.
Figure 2 shows an example of an ultra-wideband antenna in the form of a
conical antenna 8.
The conical antenna 8 possesses a metallic antenna body 9, 10 which has an
upper roughly
hemispherical region 9 and a lower roughly conical region 10. The antenna body
9, 10 is
held by a base 11 (drawn in broken lines), which consists, for example, of
perspex. The
conical region 10 of the antenna 8 ends in an antenna connection 12, which is
passed out of
the base 11. The antenna body 9, together with a metallic base plate 16, forms
a monopole
antenna structure.
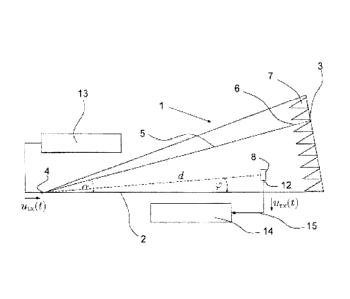
Figure 3 shows a measuring arrangement for performing the invented method. The
GTEM
cell 1 is shown from the side in Figure 3. A pulse generator 13 is connected
to the coaxial
connection 4. An antenna 8 which is to be examined is arranged within the GTEM
cell 1. The
antenna 8 is connected with a signal detection device 14 via a cable 15. The
signal detection
CA 02769881 2012-02-01
WO 20111018206 PCT/EP2010/004882
14
device 14 can for, example, be designed as a storage oscilloscope or transient
recorder.
Advantageously, the cable 15 can be in the form of an optical cable, i.e. an
optical
waveguide. In this case an electro-optical converter, which converts the
signals received
from the antenna 8 directly into optical signals, is connected directly to the
antenna
connection 12. The optical signals are then in turn converted into electric
signals by an opto-
electrical converter in the vicinity of the signal detection device 14.
In order to perform the invented method, an excitation pulse Ut,(t) is fed
from the pulse
generator 13 into the GTEM cell 1. The electromagnetic wave which is formed
and which
propagates in the direction of the antenna 8 reaches the antenna 8 at a point
in time and
generates a response signal Urx(t), which is recorded by the signal detection
device 14.
Figure 4 shows the conflicting influencing factors which need to be taken into
consideration
in determining a characteristic of an antenna. The first influencing factor is
the pulse pause
duration at the respective position of the antenna within the GTEM cell. The
pulse pause
duration is the time which elapses between the full reception of the
propagating wave sent to
the antenna triggered by the excitation pulse and the beginning of the
reception of a
reflected wave. In this time interval of the pulse pause duration, it can be
assumed that no
distortion of the measuring result takes place through reflections off the
rear wall of the
GTEM cell.
The second influencing factor is the anticipated length of the response pulse
from the
antenna. The anticipated length must be consistent with the pulse pause
duration, so that no
interference is superimposed on the propagating wave of this response signal
through
reflected waves, for example towards the end of the response signal.
The third influencing factor is the excitation pulse width, i.e. the duration
of the excitation
signal. This should be significantly shorter than the pulse pause duration,
which is, for
example, possible through use of an ultra-wideband pulse of the kind described
below.
A fourth influencing factor which needs to be taken into consideration is the
size of the
antenna, which should bear a sensible relationship to the cross section of the
GTEM cell , so
that field distortions caused through the size of the antenna become
negligible. As a rule of
thumb, for the example of the conical antenna, the cross sectional area of the
GTEM cell in
the vicinity of the position of the antenna which is to be examined should be
at least 25 times
as great, or approx. 5 % of the cross sectional area, as the cross section of
the antenna in
CA 02769881 2012-02-01
WO 2011/018206 PCT/EP2010/004882
the same cross sectional plane.
Figure 5 shows, in diagrammatic form, the theoretical curve of the main field
components of
a TEM field in relation to a Cartesian coordinate system. The coordinate
system is defined in
relation to the GTEM cell 1 in such a way that the x-axis runs transversely to
the GTEM cell,
5 the y-axis runs in a vertical direction and the z-axis in a longitudinal
direction. In Figure 5 it
can be seen that the field line Hx of the magnetic field runs around the
septum 5 which in
Figure 5 is, like the z-axis, perpendicular to the plane of the paper. The
field lines Ey of the
electric field run in a negative y-direction. The TEM field propagates in the
direction of the t-
axis.
10 Figure 6 shows the alignment of a ground-related coordinate system in a top
view of the
GTEM cell 1, including two cross sections (cross section 1 and 2) along which
the intrinsic
impedance is calculated.
Figure 7 shows the calculated intrinsic impedance rl,;n specifically as a
quotient of the main
field components for two cross sections (cross section 1 and 2) along the x'-
coordinate
15 which are chosen by way of example. As can be seen, with central
positioning of the
antenna which is to be examined in relation to the transverse direction of the
GTEM cell (x' =
0) an impedance of no = 377 0 is achieved, which corresponds to the measuring
conditions
in free space, whereby, in addition, the TEM field is, advantageously, only
present in this
position as a Cartesian 2-component TEM field (Ey, Hx). At this point, the
separate
characterisation of the antenna 8 in terms of its orthogonally polarised
antenna properties is
particularly simple, since by rotating the antenna by 90 the copolar field
components can be
measured without containing distortions caused through the cross-polar field
components.
Figure 8 shows an example of an excitation pulse u,x(t). As can be seen, the
excitation pulse
is relatively steep, in particular on its leading, falling signal edge. In the
example shown, the
time T1, in which the instantaneous value of the amplitude of the excitation
pulse passes
through the range between 10% and 90% of the maximal attained amplitude, is
only around
20 ps. Accordingly, in the example shown this results in a signal edge
steepness of 48 V/ns.
This corresponds to a frequency bandwidth of around 20 GHz.
The response signal of the antenna is recorded as a voltage curve urx(t). The
reception pulse
response h"UT ,(t) generally links the response signal of the antenna u),(t),
which exists as a
voltage value, with the three electric field components (Ex, Ey, Ez) which
strike the antenna in
CA 02769881 2012-02-01
WO 2011/018206 PCT/E P2010/004882
I.
reception mode. The unit of such a pulse response is therefore usually stated
in [m]. The
response signal urx(t) fundamentally contains a superimposition of the
components of a
pulse response vector oriented in the different coordinate directions of the
coordinate system
hAUTrx(t) = (hx(t), hy(t), hz(t)) (AUT = antenna under test). As a result of
the propagation of the
wave as a purely 2-component TEM field in Cartesian coordinates, as it exists,
as described,
along the centre axis of the GTEM cell, the x- and z- components can be
disregarded, so
that the pulse response hAUTrx,y (t) which needs to be determined in order to
determine the
antenna characteristic is derived, free of polarisation, from the y-
component, as follows:
h x TG,y(t) ` (uTG,rx(t) * -1 Utx(t)) al
PL
where the operator -' represents an inverse convolution operation. The value
aPL is a typical
damping constant for the GTEM cell used. The index "TG" indicates that this
involves a time
portion of the response signal, namely the time segment of u,x(t) analysed in
order to
determine the characteristic of the antenna, during which the response signal
only contains
propagating waves and no interfering influences caused through reflections
and, moreover,
the electromagnetic field at the location of the antenna is a TEM field.
Figure 9 shows time curves for the pulse response hAUTrx(t) of the antenna.
Three curves are
shown in the same diagram here. The curve hAUTrx, REF(t) (with the least
ripple) was
determined in order to check the plausibility of the measuring results using
the 2-antenna
reference method. The two other curves (with the greater ripple) show the
pulse responses
of the two conical antennas 8 of identical construction which were examined
and which were
used for the 2-antenna reference method, as achieved through the invented
method. As can
be seen, the measured curves closely follow the curve of the reference
measurement. If
necessary, further characteristics of the antenna can be derived from the
pulse response
shown in Figure 9. For this purpose, the time curve of the reception pulse
response h"' ,(t)
can, on the one hand, be transformed into the transmission pulse response
hAUTt'(t) or, on
the other hand, either the reception pulse response or the transmission pulse
response can
be transformed into the frequency domain, for example through Fourier
transformation,
whereupon the corresponding frequency domain characteristics of the antenna
such as gain,
CA 02769881 2012-02-01
WO 2011/018206 PCT/EP2010/004882
17
directional characteristic or efficiency can then be determined.
Figure 10 shows a similar measuring arrangement to that shown in Figure 3. In
contrast to
Figure 3, instead of the pulse generator 13 and the separate signal detection
device 14, a
combined device 20 in the form of a network analyser is provided. The network
analyser 20
is particularly suitable for generating a typical frequency domain signal as
excitation signal
as well as for recording the reception values, i.e. of the response signal, in
the frequency
domain. The measuring arrangement according to Figure 10 is fundamentally
comparable
with the measuring arrangement shown in Figure 3, although the measuring
arrangement
according to Figure 10 allows improved measurements in the frequency domain as
a result
of a higher dynamic range of the network analyser 20 used as measuring device.
Both possibilities for recording signals, i.e. the measuring arrangement
according to Figure 3
and the measuring arrangement according to Figure 10, are linked together via
the Fourier
transformation. The finite nature of the respective measuring ranges can lead
to deviations
in the transformation. It is therefore recommended that windowing be carried
out in the
respective range, i.e. that the measurements be carried out separately in
different frequency
ranges. Windows are to be preferred which display a low processing loss within
the relevant
range (also referred to in the technical literature as "processing gain" or
"coherent gain").
The relevant range is identified in the frequency domain through the working
range of the
antenna, and in the time domain through the time interval T1 explained with
reference to
Figure 8. Particularly suitable in terms of achieving a low processing loss
are a rectangular
window or the so-called "Tukey window", which is described in the publication
by F. Harris,
"On the use of windows for harmonic analysis with a discrete Fourier
transform",
Proceedings of the IEEE, Vol. 66, No. 1, pages 51 to 83, January 1978. Due to
its
parameterisation, the Tukey window offers increased flexibility.
Figure 11 shows an example of a measurement carried out using the invented
method on a
"standard gain horn". A N5230A network analyser manufactured by Agilent was
used to
generate and record signals. A "standard gain horn" of the type SGA-50L
manufactured by
Seavey Engineering Associates, Inc. was used as antenna. The antenna was
placed within
a GTEM cell of the type GTEM 5305 manufactured by ENCO. The transition from
the horn to
the waveguide of the antenna takes place in the centre of the GTEM cell at a
distance of
1.51 m from the feed point 4 of the GTEM cell.
The continuous line in Figure 11 shows the result of the measurement, wherein
the effective
CA 02769881 2012-02-01
WO 2011/018206 PCT/BP2010/004882
18
gain in relation to a loss-free isotropic reference radiator in the unit dBi
is shown over the
frequency in GHz, The broken line shows the reference stated by the
manufacturer of the
antenna. As can be seen, there is a slight deviation between the measuring
results and the
reference specified by the manufacturer, whereby, however, the deviations lie
within the
range < 0,5 dBi. These deviations can be attributed to the finite nature of
the time interval
Ti. A closer convergence of the measuring results with the manufacturer's
specifications
can, for example, be achieved through determination of a smoothing function
through the
measuring results.