Note: Descriptions are shown in the official language in which they were submitted.
CA 02771585 2014-01-22
WO 2011/029033 PCT/US2010/047866
METHODS OF AGING ALUMINUM ALLOYS TO ACHIEVE IMPROVED
BALLISTICS PERFORMANCE
[0001] Blank.
Background
[0002] Aluminum alloys are generally lightweight, inexpensive and
relatively strong.
However, the use of aluminum alloys in military applications has been limited
due to, for
example, unsuitable ballistics performance.
Summary of the Disclosure
[0003] Broadly, the present disclosure relates to improved methods of aging
aluminum
alloys to achieve an improved combination of properties. These new methods may
produce
aluminum alloy products having improved ballistics performance. In one
embodiment, the
new methods may produce aluminum alloy products that realize improved fragment
simulation projectile (FSP) resistance. In one embodiment, the new methbds may
produce
aluminum alloy products that realize an improved combination of FSP resistance
and armor
piercing (AP) resistance.
[0004] In one embodiment, and with reference now to FIG. 1, a method includes
the steps
of selecting ballistics performance criteria for an aluminum alloy product
(100) and
producing the aluminum alloy product (200) having a ballistics performance.
The ballistics
performance is at least as good as the ballistics performance criteria.
[0005] The producing step (200) comprises preparing the aluminum alloy product
for
aging (220), and aging the aluminum alloy product (240), where the aging step
comprises
underaging (250) the aluminum alloy product an amount sufficient to achieve
the ballistics
performance. It has been found that underaging (250) of aluminum alloy
products may
substantially improve the ballistics performance of such aluminum alloy
products. In some
embodiments, the ballistics performance is better than that of a peak strength
aged version of
1
CA 02771585 2015-01-07
WO 2011/029033 PCT/US2010/047866
the aluminum alloy product. After the aging step (240), the product may be
subjected to
optional treatments (255), disclosed below, and provided to the customer
(300).
[0006] The selecting ballistics performance criteria step (100) may include
selecting at
least one of FSP resistance criteria and AP resistance criteria. In one
embodiment, the
selected ballistics performance criteria is FSP resistance criteria.
Underaging the aluminum
alloy products may facilitate improved FSP resistance. That is, FSP resistance
may be a
function of the amount of aging of the aluminum alloy product.
[0007] As known to those skilled in the art, underaging and the like means
that the
aluminum alloy product is aged at a temperature and/or for a duration that is
less than that
required to achieve peak strength. Peak strength and the like means the
highest strength
achieved by a specific aluminum alloy product as determined via aging curves.
Different
product forms (e.g., extrusions, rolled products, forgings), or similar
product forms of
different dimensions, may have a different peak strength, and thus each
product form and/or
similar product forms having different dimensions may require their own aging
curve to
determine the peak strength of the aluminum alloy product. The definition of
aging, in
general, is described below.
[0008] Relative to FSP resistance, aging curves may be used for various
particular
aluminum alloy product forms. Those aging curves may be used to underage those
aluminum alloy products, and the FSP resistance of those underaged aluminum
alloy
products may be determined. The determined FSP resistance may be correlated to
the
amount of underaging for the aluminum alloy product forms. Consequently, FSP
resistance
criteria may be selected in advance, and subsequent aluminum alloy products of
that product
form may be underaged a predetermined amount to achieve the selected FSP
resistance
criteria based on the correlation.
[0009] As noted, the aluminum alloy product may be underaged an amount
sufficient to
achieve the selected FSP resistance criteria. For example, the aluminum alloy
product may
be underaged a predetermined amount to achieved the selected FSP resistance
criteria (e.g.,
underage the aluminum alloy product by at least about 3% to achieve a targeted
V50 FSP
performance). In one embodiment, the aluminum alloy product is underaged by at
least 1%
relative to peak strength to achieve the selected FSP resistance criteria. For
example, if the
peak strength of the aluminum alloy product is about 50 ksi, a 1% underaged
aluminum
alloy product would be underaged and have a strength of not greater than about
49.5 ksi. In
other embodiments, the aluminum alloy product is underaged by at least about
2%, or at
2
CA 02771585 2012-02-17
WO 2011/029033 PCT/US2010/047866
least about 3%, or at least about 4%, or at least about 5%, or at least about
6%, or at least
about 7%, or at least about 8%, or at least about 9%, or at least about 10%,
or at least about
11%, or least about 12%, or at least about 13%, or at least about 14%, or at
least about 15%,
or at least about 16%, or at least about 17%, or at least about 18%, or at
least about 19%, or
at least about 20%, or at least about 21%, or least about 22%, or at least
about 23%, or at
least about 24%, or at least about 25%, or more, relative to peak strength to
achieve the
selected FSP resistance criteria.
[0010] By underaging, the aluminum alloy products may realize improved FSP
resistance
relative to a peak strength aged version of the aluminum alloy product. The
FSP resistance
is at least as good as the selected FSP resistance criteria. In one
embodiment, the aluminum
alloy products realize an FSP resistance that it at least about 1% better than
that of the peak
strength aged version of the aluminum alloy product. In other embodiments, the
aluminum
alloy products realize an FSP resistance that it at least about 2% better, or
at least about 3%
better, or at least about 4% better, or at least about 5% better, or at least
about 6% better, or
at least about 7% better, or at least about 8% better, or at least about 9%
better, or at least
about 10% better, or at least about 11% better, or at least about 12% better,
or at least about
13% better, or at least about 14% better, or at least about 15% better, or
more, than that of a
peak strength aged version of the aluminum alloy product.
[0011] In one embodiment, the selected ballistics performance criteria
relates to the V50
performance of the aluminum alloy product at a given areal density. V50 is a
measure of
ballistics resistance of a material. A V50 value represents the velocity at
which there is a
50% probability that a projectile (e.g., a FSP or an AP projectile) will
completely penetrate
the plate for a given areal density. V50 FSP resistance and AP resistance
testing may be
conducted in accordance with MIL-STD-662F(1997). In one embodiment, the FSP
resistance criteria comprises a minimum V50 performance level, and the minimum
V50
performance level is at least about 1% better than the minimum V50 performance
level of
the peak strength aged version of the aluminum alloy product. In other
embodiments, the
minimum V50 performance level is at least about 2% better, or at least about
3% better, or at
least about 4% better, or at least about 5% better, or at least about 6%
better, or at least about
7% better, or at least about 8% better, or at least about 9% better, or at
least about 10%
better, or at least about 11% better, or at least about 12% better, or at
least about 13% better,
or at least about 14% better, or at least about 15% better, or more, than that
of a peak
strength aged version of the aluminum alloy product at a given areal density.
3
CA 02771585 2012-02-17
WO 2011/029033 PCT/US2010/047866
[0012] In one embodiment, an underaged aluminum alloy product realizes a V50
FSP
resistance that is at least about 1% better than that of a peak strength aged
version of the
aluminum alloy product at a given areal density. In other embodiments, an
underaged
aluminum alloy product realizes a V50 FSP resistance that is at least about 2%
better, or at
least about 3% better, or at least about 4% better, or at least about 5%
better, or at least about
6% better, or at least about 7% better, or at least about 8% better, or at
least about 9% better,
or at least about 10% better, or at least about 11% better, or at least about
12% better, or at
least about 13% better, or at least about 14% better, or at least about 15%
better, or more,
than that of a peak strength aged version of the aluminum alloy product at a
given areal
density.
[0013] A peak strength aged version of the aluminum alloy product is a product
that has a
similar composition and processing history, is of similar product form
(rolled, extruded,
forged), and is of similar and comparable dimensions as the underaged product,
except that
the peak strength aged version of the product is peak aged, whereas the
underaged product is
underaged.
[0014] In one embodiment, the aluminum alloy product may be underaged to
achieve a
targeted spall performance. Generally, there are two spall modes of failure
relative to FSP:
= Mode 1: Spall ¨ penetration with detachment.
= Mode 2: Spall ¨ prior to penetration.
Of these, Mode 1 is generally preferred. By underaging the aluminum alloy
product, FSP
resistance relative to spall can be tailored.
[0015] Ballistics performance criteria and ballistics performance also
includes resistance
to armor piecing (AP) projectiles. In some instances, underaging of the
aluminum alloy
product may result in decreased AP resistance. Thus, in some embodiments, the
selecting
step (100) comprises selecting one or both of FSP resistance criteria and AP
resistance
criteria. In turn, the underaging amount may be selected so as to achieve a
predetermined
balance between FSP resistance and AP resistance. In one embodiment, the
aluminum alloy
product is underaged an amount sufficient to achieve a minimum FSP resistance
criteria
while simultaneously achieving a minimum AP resistance criteria. In turn, the
aluminum
alloy products may realize FSP resistance and AP resistance that at is at
least as good as the
selected minimum FSP resistance criteria and selected minimum AP resistance
criteria.
Thus, aluminum alloy products having tailored FSP resistance and AP resistance
properties
may be produced. In one embodiment, the FSP resistance of the underaged
aluminum alloy
4
CA 02771585 2012-02-17
WO 2011/029033 PCT/US2010/047866
product is at least 1% better than that of the peak strength aged version of
the aluminum
alloy product, and while the AP resistance is at least as good as that of the
peak strength
aged version of the aluminum alloy product. In one embodiment, the FSP
resistance of the
underaged aluminum alloy product is at least 1% better than that of the peak
strength aged
version of the aluminum alloy product, and while the AP resistance is at least
as good as that
of the peak strength aged version of the aluminum alloy product. In other
embodiments, the
AP resistance is less than that of the peak strength aged version of the
aluminum alloy
product. In one embodiment, the AP resistance is decreases at a rate slower
than the rate that
the FSP resistance increases. In one embodiment, the AP resistance decreases
(relative to
peak strength) by not greater than about 90% of the increase in FSP
resistance. For example,
if the FSP resistance increases by 5% relative to a peak strength aged version
of the product,
the AP resistance would decrease by not more than 4.5% relative to the peak
strength aged
version of the product. In other embodiments, the AP resistance is decreased
by not greater
than about 80%, or not greater than about 70%, or not greater than about 60%,
or not greater
than about 50%, or not greater than about 40%, or not greater than about 30%,
or not greater
than about 20%, or not greater than about 10%, or less, than the increase in
FSP resistance.
AP and FSP resistance criteria can be selected based in this known trade-off,
e.g., using FSP
and AP testing results relative to a known amount of underaging for an
aluminum alloy
product form. Thus, aluminum alloy product having tailored ballistics
performance may be
produced.
[0016] Referring now to FIG. 2, the preparing the aluminum alloy product for
aging step
(220) may include one or more of the steps of casting (222) the aluminum alloy
product
(e.g., direct chill casting), scalping the cast aluminum alloy product (224),
homogenizing the
aluminum alloy product (226), working the aluminum alloy product (228) (e.g.,
hot working
to form a wrought product), solution heat treating the aluminum alloy product
(230),
optional quenching the aluminum alloy product (232), and optional cold working
the
aluminum alloy product (234) (e.g., stretching, rolling). The working the
aluminum alloy
product steps (228 or 234) may include one or more of rolling, extruding
and/or forging the
aluminum alloy product, and before or after the solution heat treatment step.
[0017] Aluminum alloys useful in conjunction with the present methods include
those
aluminum alloys that exhibit an aging response, such as any of the 2XXX,
2XXX+Li and
7XXX series alloys. These alloys are known as heat treatable alloys. These
heat treatable
alloys contain amounts of soluble alloying elements that exceed the
equilibrium solid
CA 02771585 2014-01-22
WO 2011/029033 PCT/US2010/047866
solubility limit at room and moderately higher temperatures. The amount
present may be
less or more than the maximum that is soluble at the eutectic temperature.
[0018] Solution heat treatment (230) is achieved by heating aluminum alloy
products to a
suitable temperature, holding at that temperature long enough to allow
constituents to enter
into solid solution, and cooling rapidly enough to hold the constituents in
solution. The solid
solution formed at high temperature may be retained in a supersaturated state
by cooling
with sufficient rapidity to restrict the precipitation of the solute atoms as
coarse, incoherent
particles. Controlled precipitation of fine particles after the solution heat
treatment (230) and
quench (232) operations, called "aging", has been traditionally used to
develop mechanical
properties of heat treatable alloys.
[0019] As it relates to the present invention, and with reference now to FIGS.
2 and 3, the
aging step (240) may be utilized to age the aluminum alloy product to a
predetermined
underaged condition to achieve the selected ballistics performance criteria.
After solution
heat treatment (230) and quench (232), most heat treatable alloys (e.g., 2XXX,
2XXX+Li,
7XXX) exhibit property changes at room.temperature. This is called "natural
aging" (242)
and may start immediately after solution heat treatment (230) and the quench
(232), or after
an incubation period. The rate of property changes during natural aging varies
from one
alloy to another over a wide range, so that the approach to a stable condition
may require
only a few days or several years. Precipitation can be accelerated in these
alloys, and their
strengths further increased by heating above room temperature; this operation
is referred to
as "artificial aging" (244) and is also known to those skilled in the art as
"precipitation heat
treating."
j0020] The underaged aluminum alloy products described herein may be naturally
aged
(242), artificially aged (244) or both (246). If artificial aging (244) is
completed, natural
aging (242) may occur before and/or after artificial aging (244). Natural
aging (242) may
occur for a predetermined period of time prior to (244) artificial aging
(e.g., from a few
hours to a few weeks, or more). A period of natural aging at room temperature
may occur
between or after any of the solution heat treatment (230), quenching (232),
optional cold
work (234) and optional artificial aging (244) steps noted above. (see,
American National
Standard Alloy and Temper Designation Systems for Aluminum, ANSI H35.1.
[0021] In some embodiments, no artificial aging step (244) is completed prior
to
supplying the product to the customer (300). That is, the aging step (240)
consists of
6
CA 02771585 2014-01-22
WO 2011/029033 PCT/US2010/047866
naturally aging (242). In these embodiments, the amount of natural aging (242)
may be
controlled to achieve an underaged condition (250) and the selected ballistics
performance
criteria. Concomitant to or after the natural aging step (242), the product
may be subjected to
various optional treatments (255), such as additional cold work after the
aging step (240) or
finishing operations (e.g., flattening, straightening, machining, anodizing,
painting, polishing,
buffing), after which the product may be supplied to the customer (300).
[0022] In some embodiments, the aging (240) comprises artificially aging
(244). In these
embodiments, the aging step (240) may include artificially heating the
aluminum alloy
product for a time and temperature that underages the product and achieves a
strength below
peak strength. In one embodiment, the artificial aging step (244) includes
underaging the
aluminum alloy product a predetermined amount to achieve the selected
ballistics
performance criteria (250), as described above. After artificial aging (244),
the aluminum
alloy product may be subjected to various optional post-age treatments (255),
described
above, after which the product may be supplied to the customer (300).
[0023] The new aluminum alloy products may realize at least equivalent
performance to
prior art products made from aluminum alloy 5083 in the H131 temper in terms
of at least
= one property, while realizing an improved performance in at least one
other property. This
improved performance may be due to the unique processing of the new alloy, as
provided
above. The new alloys may achieve an improved combination of properties, such
as an
improved combination of density and ballistics performance, relative to a
comparable 5083-
= H131 product.
[0024] The new underaged alloys may be utilized in any armor component where
blasts
may pose a threat, such as in armored vehicles, personal armor, and the like.
In one
embodiment, an armor component produced from the underaged alloy is spall
resistant. A
material is spall resistant if, during ballistics testing conducted in
accordance with MIL-
STD-662F(1997)), no substantial detachment or delamination of a layer of
material in the
area surrounding the location of impact occurs, as visually confirmed by those
skilled in the
art, which detachment or delamination may occur on either the front or rear
surfaces of the
test product.
[0025] As noted above, aluminum alloys suitable for use with the present
method include
the 2XXX, 2XXX+Li and 7XXX aluminum alloys. 2300C aluminum alloys are aluminum
alloys that contain copper (Cu) as the main alloying ingredient. 2XXX
generally include
from about 0.7 wt. % to about 6.8 wt. % Cu. 2XXX aluminum alloys may include
other
7
CA 02771585 2012-02-17
WO 2011/029033 PCT/US2010/047866
ingredients, such as magnesium (Mg) (e.g., from about 0.1 wt. % to about 2.0
wt. % Mg).
Examples of some 2XXX aluminum alloys that may be useful in accordance with
the
underaging practice described herein include Aluminum Association alloys 2001,
2002,
2004, 2005, 2006, 2007, 2007A, 2007B, 2008, 2009, 2010, 2011, 2011A, 2111,
2111A,
2111B, 2012, 2013, 2014, 2014A, 2214, 2015, 2016, 2017, 2017A, 2117, 2018,
2218, 2618,
2618A, 2219, 2319, 2419, 2519, 2021, 2022, 2023, 2024, 2024A, 2124, 2224,
2224A, 2324,
2424, 2524, 2025, 2026, 2027, 2028, 2028A, 2028B, 2028C, 2030, 2031, 2032,
2034, 2036,
2037, 2038, 2039, 2139, 2040, 2041, 2044, 2045, and 2056, among other 2XXX
aluminum
alloys.
[0026] 2XXX+Li aluminum alloys are 2XXX aluminum alloys that include
purposeful
additions of lithium (Li). 2XXX+Li alloys may contain up to about 2.6 wt. % Li
(e.g., 0.1 to
2.6 wt. % Li). Examples of some suitable 2XXX+Li alloys that may be useful in
accordance
with the underaging practice described herein include Aluminum Association
alloys 2050,
2090, 2091, 2094, 2095, 2195, 2196, 2097, 2197, 2297, 2397, 2098, 2198, 2099,
and 2199,
among other 2XXX+Li aluminum alloys. 2XXX+Li alloys generally contain at least
about
0.5 wt. % Li.
[0027] Both the 2XXX and 2XXX+Li alloys may contain up to 1.0 wt. % Ag (e.g.
0.1 -
1.0 wt. % Ag). Silver (Ag) is known to enhance strength in such alloys. When
used, Ag is
usually present in amounts of at least about 0.10 wt. %.
[0028] Ballistics products made from 2XXX and 2XXX+ Li aluminum alloys may
achieve suitable ballistics performance properties by either natural aging
alone, or by
artificial aging. Thus, the 2XXX and 2XXX+Li aluminum alloy products may be
supplied,
for example, in the T3, T4, T6 or T8 tempers, among others.
[0029] 7XXX aluminum alloys are aluminum alloys that contain zinc (Zn) as the
main
alloying ingredient. 7XXX generally include from about 3.0 wt. % to 12.0 wt. %
Zn. 7XXX
alloys may include other ingredients, such as Cu (0.1 - 3.5 wt. %) and Mg (0.1
- 3.5 wt. %).
Examples of some 7XXX alloys that may be useful in accordance with the
underaging
practice described herein include Aluminum Association alloys 7003, 7004,
7204, 7005,
7108, 7108A, 7009, 7010, 7012, 7014, 7015, 7016, 7116, 7017, 7018, 7019,
7019A, 7020,
7021, 7022, 7122, 7023, 7024, 7025, 7026, 7028, 7029, 7129, 7229, 7030, 7032,
7033, 7034,
7035, 7035A, 7036, 7136, 7037, 7039, 7040, 7140, 7041, 7046, 7046A, 7049,
7049A, 7149,
7249, 7349, 7449, 7050, 7050A, 7150, 7250, 7055, 7155, 7255, 7056, 7060, 7064,
7068,
8
CA 02771585 2012-02-17
WO 2011/029033 PCT/US2010/047866
7168, 7075, 7175, 7475, 7076, 7178, 7278, 7278A, 7081, 7085, 7090, 7093, and
7095,
among other 7XXX alloys.
[0030] 7XXX generally achieve suitable ballistics performance properties by
artificial
aging, although natural aging alone could be utilized in some circumstances.
Thus, the
7XXX aluminum alloy products may be supplied, for example, in the T6 or T8
tempers,
among others.
[0031] It is anticipated that the underaging principles outlined herein may
also be useful
with some other precipitation hardening style alloys (e.g., one or more of the
6XXX
aluminum alloys and/or one or more of the 8XXX aluminum alloys).
[0032] The aluminum alloy products generally comprise (and in some
instances consists
essentially of) the above identified ingredients, the balance being aluminum,
optional
additives (e.g., up to about 2.5 wt. %), and unavoidable impurities.
Generally, the amount of
ingredients, optional additives, and unavoidable impurities employed in the
alloy should not
exceed the solubility limit of the alloy. Optional additives include grain
structure control
materials (sometimes called dispersoids), grain refiners, and/or deoxidizers,
among others, as
described in further detail below. Some of the optional additives used in the
aluminum alloy
products may assist the alloy in more ways than described below. For example,
additions of
Mn can help with grain structure control, but Mn can also act as a
strengthening agent.
Thus, the below description of the optional additives is for illustration
purposes only, and is
not intended to limit any one additive to the functionality described.
[0033] The optional additives may be present in an amount of up to about 2.5
wt. % in
total. For example, Mn (1.5 wt. % max), Zr (0.5 wt. % max), and Ti (0.10 wt. %
max) could
be included in the alloy for a total of 2.1 wt. %. In this situation, the
remaining other
additives, if any, could not total more than 0.4 wt. %. In one embodiment, the
optional
additives are present in an amount of up to about 2.0 wt. % in total. In other
embodiments,
the optional additives are present in an amount of up to about 1.5 wt. %, or
up to about 1.25
wt. %, or up to about 1.0 wt. % in total.
[0034] Grain structure control materials are elements or compounds that are
deliberate
alloying additions with the goal of forming second phase particles, usually in
the solid state,
to control solid state grain structure changes during thermal processes, such
as recovery and
recrystallization. For the aluminum alloys disclosed herein, Zr and Mn are
useful grain
structure control elements. Substitutes from Zr and/or Mn (in whole or in
part) include Sc,
V, Cr, and Hf, to name a few. The amount of grain structure control material
utilized in an
9
CA 02771585 2012-02-17
WO 2011/029033 PCT/US2010/047866
alloy is generally dependent on the type of material utilized for grain
structure control and
the alloy production process.
[0035] The aluminum alloy products may optionally include manganese (Mn).
Manganese may serve to facilitate increases in strength and/or a facilitate a
refined grain
structure, among other things, especially the 2XXX or 2XXX+Li aluminum alloys.
When
manganese is included in the aluminum alloy product, it is generally present
in amounts of at
least about 0.05 wt. %. In one embodiment, the new aluminum alloy product
includes at
least about 0.10 wt. % Mn. In one embodiment, the new aluminum alloy product
includes
not greater than about 1.5 wt. % Mn. In other embodiments, the new aluminum
alloy
product includes not greater than about 1.0 wt. % Mn.
[0036] When zirconium (Zr) is included in the aluminum alloy product, it may
be
included in an amount up to about 0.5 wt. %, or up to about 0.4 wt. %, or up
to about 0.3 wt.
%, or up to about 0.2 wt. %. In some embodiments, Zr is included in the alloy
in an amount
of 0.05 - 0.25 wt. %. In one embodiment, Zr is included in the alloy in an
amount of 0.05 -
0.15 wt. %. In another embodiment, Zr is included in the alloy in an amount of
0.08 - 0.12
wt. %. 7XXX alloys generally use Zr as an optional additive.
[0037] Grain refiners are inoculants or nuclei to seed new grains during
solidification of
the alloy. An example of a grain refiner is a 3/8 inch rod comprising 96%
aluminum, 3%
titanium (Ti) and 1% boron (B), where virtually all boron is present as finely
dispersed TiB2
particles. During casting, the grain refining rod is fed in-line into the
molten alloy flowing
into the casting pit at a controlled rate. The amount of grain refiner
included in the alloy is
generally dependent on the type of material utilized for grain refining and
the alloy
production process. Examples of grain refiners include Ti combined with B
(e.g., TiB2) or
carbon (TiC), although other grain refiners, such as Al-Ti master alloys may
be utilized.
Generally, grain refiners are added in an amount of ranging from 0.0003 wt. %
to 0.005 wt.
% to the alloy, depending on the desired as-cast grain size. In addition, Ti
may be separately
added to the alloy in an amount up to 0.03 wt. % to increase the effectiveness
of grain
refiner. When Ti is included in the alloy, it is generally present in an
amount of up to about
0.10 or 0.20 wt. %.
[0038] Some alloying elements, generally referred to herein as deoxidizers
(irrespective
of whether the actually deoxidize), may be added to the alloy during casting
to reduce or
restrict (and is some instances eliminate) cracking of the ingot resulting
from, for example,
oxide fold, pit and oxide patches. Examples of deoxidizers include Ca, Sr, Be,
and Bi.
CA 02771585 2012-02-17
WO 2011/029033 PCT/US2010/047866
When calcium (Ca) is included in the alloy, it is generally present in an
amount of up to
about 0.05 wt. %, or up to about 0.03 wt. %. In some embodiments, Ca is
included in the
alloy in an amount of 0.001 to about 0.03 wt. % or to about 0.05 wt. %, such
as in the range
of 0.001-0.008 wt. % (i.e., 10 to 80 ppm). Strontium (Sr) and/or bismuth (Bi)
may be
included in the alloy in addition to or as a substitute for Ca (in whole or in
part), and may be
included in the alloy in the same or similar amounts as Ca. Traditionally,
beryllium (Be)
additions have helped to reduce the tendency of ingot cracking, though for
environmental,
health and safety reasons, some embodiments of the alloy are substantially Be-
free. When
Be is included in the alloy, it is generally present in an amount of up to
about 500 ppm, such
as less than about 250 ppm, or less than about 20 ppm.
[0039] The optional additives may be present in minor amounts, or may be
present in
significant amounts, and may add desirable or other characteristics on their
own without
departing from the alloy described herein, so long as the alloy retains the
desirable
characteristics described herein. It is to be understood, however, that the
scope of this
disclosure should not/cannot be avoided through the mere addition of an
element or elements
in quantities that would not otherwise impact on the combinations of
properties desired and
attained herein.
[0040] As used herein, unavoidable impurities are those materials that may
be present in
the alloy in minor amounts due to, for example, the inherent properties of
aluminum and/or
leaching from contact with manufacturing equipment, among others. Iron (Fe)
and silicon
(Si) are examples of unavoidable impurities generally present in aluminum
alloys. The Fe
content of the alloy should generally not exceed about 0.25 wt. %. In some
embodiments,
the Fe content of the alloy is not greater than about 0.15 wt. %, or not
greater than about 0.10
wt. %, or not greater than about 0.08 wt. %, or not greater than about 0.05 or
0.04 wt. %.
Likewise, the Si content of the alloy should generally not exceed about 0.25
wt. %, and is
generally less than the Fe content. In some embodiments, the Si content of the
alloy is not
greater than about 0.12 wt. %, or not greater than about 0.10 wt. %, or not
greater than about
0.06 wt. %, or not greater than about 0.03 or 0.02 wt. %. In some embodiments,
zinc (Zn)
may be included in the alloy as an unavoidable impurity (e.g., for 2XXX+Li
alloys). In
these embodiments, the amount of Zn in the alloy generally does not exceed
0.25 wt. %,
such as not greater than 0.15 wt. %, or even not greater than about 0.05 wt.
%. When not an
impurity, up to 1.5 wt. % Zn may be used in the 2XXX or 2XXX+Li alloys (e.g.,
0.3-1.5
wt. % Zn). Aside from iron, silicon, and zinc, the alloy generally contains no
more than 0.05
wt. % of any one other unavoidable impurity, and with the total amount of
these other
11
CA 02771585 2012-02-17
WO 2011/029033 PCT/US2010/047866
unavoidable impurities not exceeding 0.15 wt. % (commonly referred to as
others each <
0.05 wt. %, and others total < 0.15 wt. %, as reflected in the Aluminum
Association wrought
alloy registration sheets, called the Teal Sheets).
[0041] Except where stated otherwise, the expression "up to" when referring to
the
amount of an element means that that elemental composition is optional and
includes a zero
amount of that particular compositional component.
Unless stated otherwise, all
compositional percentages are in weight percent (wt. %).
[0042] While the above properties have generally been described relative to
wrought
alloys, it is expected that the underaging of cast aluminum alloy products
would realize the
same benefit, and thus underaging of cast aluminum alloy products is also
included in the
scope of the present invention.
Brief Description of the Drawings
[0043] FIG. 1 is a flow chart illustrating one embodiment of producing an
aluminum
alloy product.
[0044] FIG. 2 is a flow chart illustrating the producing step (200) of FIG.
1.
[0045] FIG. 3 is a flow chart illustrating the aging step (240) of FIG. 2.
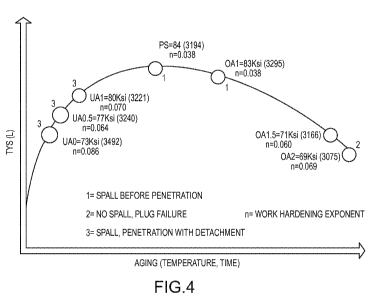
[0046] FIG. 4 is a schematic view illustrating the ballistics performance
of AA alloy 7085
as a function of yield strength (TYS-L) and artificial aging conditions.
[0047] FIG. 5 is a photograph of projectiles that may be used for
ballistics testing.
[0048] FIG. 6a is a graph illustrating the FSP resistance of various 2-inch
thick aluminum
alloy plates as a function of strength using a 0.50 caliber round as described
in Example 1.
[0049] FIG. 6b is a graph illustrating the FSP resistance of various 2-inch
thick aluminum
alloy plates as a function of strength using 20 mm round as described in
Example 1.
[0050] FIG. 6c is a graph illustrating the AP resistance of various 2-inch
thick aluminum
alloy plates as a function of strength as described in Example 1.
[0051] FIGS. 7a-7f are photographs (top view) illustrating the FSP
penetration results of
Example 1 relating to AA7085.
[0052] FIG. 8a is a photograph (top view) illustrating the FSP penetration
results of
Example 1 relating to prior art alloy AA5083.
[0053] FIG. 8b is a photograph (cross-sectional view) illustrating the
microstructure of
prior art alloy AA5083 after FSP testing.
12
CA 02771585 2012-02-17
WO 2011/029033 PCT/US2010/047866
[0054] FIG. 9 is a schematic view illustrating one proposed embodiment of the
method of
crack formation in AA5083 as it relates to FSP testing.
[0055] FIG. 10a is an SEM photograph illustrating cracking in AA5083 after
FSP testing.
[0056] FIG. 10b is a close-up of a portion of FIG. 10a.
[0057] FIG. 1 la is a photograph (cross-sectional view) illustrating the
microstructure of
alloy AA7085-UAO after FSP testing.
[0058] FIG. 1 lb is a photograph (cross-sectional view) illustrating the
microstructure of
alloy AA7085-UA1 after FSP testing.
[0059] FIG. 11c is a photograph (cross-sectional view) illustrating the
microstructure of
alloy AA7085-0A1 after FSP testing.
[0060] FIG. 1 1 d is a photograph (cross-sectional view) illustrating the
microstructure of
alloy AA7085-0A2 after FSP testing.
[0061] FIG. 12a is a SEM photograph illustrating cracking in AA7085-UA 1 after
FSP
testing.
[0062] FIG. 12b is a close-up of a portion of FIG. 12a.
[0063] FIG. 13a is a SEM photograph illustrating cracking in AA7085-0A1 after
FSP
testing.
[0064] FIG. 13b is a SEM photograph illustrating cracking in AA7085-0A2 after
FSP
testing.
[0065] FIG. 14a is a SEM photograph of an etched sample of AA7085-UA 1 after
FSP
testing.
[0066] FIG. 14b is a SEM photograph of an anodized sample of AA7085-UAl after
FSP
testing.
[0067] FIG. 15a is a SEM photograph illustrating shear bands in AA7085-0A1
after FSP
testing.
[0068] FIG. 15b is a close-up of FIG. 15a illustrating nanometer-sized
precipitates in the
shear bands.
[0069] FIG. 16a is a SEM photograph illustrating shear bands in AA7085-0A1
after FSP
testing.
[0070] FIG. 16b is a close-up of FIG. 16a.
13
CA 02771585 2012-02-17
WO 2011/029033 PCT/US2010/047866
[0071] FIG. 17a is a SEM photograph illustrating cracks in AA7085-0A2 after
FSP
testing.
[0072] FIG. 17b is a close-up of FIG. 17a.
[0073] FIG. 18a is a TEM dark-filled photograph illustrating the
microstructure of
AA7085-UA1 after FSP testing.
[0074] FIG. 18b is a TEM multi-beam bright field photograph illustrating the
microstructure of AA7085-UA1 after FSP testing.
[0075] FIG. 19a is a TEM dark-filled photograph illustrating the
microstructure of
AA7085-0A1 after FSP testing.
[0076] FIG. 19b is a TEM multi-beam bright field photograph illustrating
the
microstructure of AA7085-0A1 after FSP testing.
[0077] FIG. 20a is a TEM dark-filled photograph illustrating the
microstructure of
AA7085-0A2 after FSP testing.
[0078] FIG. 20b is a TEM multi-beam bright field photograph illustrating
the
microstructure of AA7085-0A2 after FSP testing.
Detailed Description
[0079] Example 1 - Testing of 7XXX Alloys
[0080] V50 Testing
[0081] Aluminum association alloy 7085 is prepared for aging, similar to
that illustrated
in FIG. 2, and is tested for FSP performance in several artificially aged
conditions. Two
groups of AA 7085 plates with two different gauges, 1-inch and 2-inch, were
artificially
aged to different under-aged (UA) and over-aged (OA) conditions. For group 1
with 1-inch
thick plates, seven aging conditions were generated: 7085-UAO, -UA0.5, -UAl, -
PS, -0A1, -
0A1.5, and -0A2 (FIG. 4). For UA plates in this group, at least three weeks of
natural aging
were obtained before artificial aging. The tensile yield strength (TYS) in the
rolling
direction (RD) of aged AA 7085 plates in group 1 falls in the range from 69
ksi to 83 ksi.
AA 5083-H131 plates, 1-inch in thickness, were also tested as a benchmark. For
group 2
with 2-inch thick plates, four aging conditions were generated: 7085-W51, -UAL
-0A1, and
-0A2. Note W51 temper, solution heat treated with minimum aging, exhibited
about 62 ksi
in TYS of 2-inch thick plates. The TYS in the RD of aged AA 7085 plates in
this group
ranges from 62 ksi to 79 ksi. Fragment simulating projectile (FSP) ballistic
tests were
conducted for group 1 using 0.50- caliber projectile at Southwest Research
Institute (SWRI)
14
CA 02771585 2012-02-17
WO 2011/029033 PCT/US2010/047866
and group 2 using 20 mm projectile at Army Research Laboratory (ARL),
respectively. For
each alloy/condition in both groups, multiple 12-inch x 12-inch specimens were
tested. The
projectiles used for FSP tests are shown in FIG. 5.
[0082] FIG. 4 illustrates the V50 measured for each aging condition of 1-
inch thick plates
subjected to the FSP ballistic test. The TYS and strain hardening rate (n) are
also presented
for each aging condition. The average V50 of under-aged AA 7085 plates, 3318
ft/s, was
higher than 3179 ft/s, the average V50 of over-aged plates, which indicates
better FSP
ballistic resistance for under-aged plates. In particular, plates under the
UAO temper
exhibited much better FSP ballistic resistance than other tempers. The maximum
difference
in V50 between UA (UAO) and OA (0A2) plates was 368 ft/s. V50s appeared to
decrease
with the progress of artificial aging, i.e., from UA to OA.
[0083] The relationship between V50 and TYS is also illustrated in FIG. 6a.
The results
show that V50 did not increase exclusively with either increasing TYS (FIG.
6a) or
increasing strain hardening rate (FIG. 4). The V50, TYS, and strain hardening
rate of the
baseline material AA 5083-H131 were 1870 feet/second, 47 ksi, and 0.076,
respectively.
V50 of 5083-H131 was significantly lower than that of AA 7085 regardless of
aging
conditions. While its low ballistic resistance may be attributed to low TYS,
AA 5083-H131
exhibited reasonably high strain hardening rate when compared to AA 7085
regardless of
aging conditions.
[0084] FIG. 6b shows the relationship between V50 and TYS of 2-inch thick
plates tested
with a larger FSP projectile (20mm). The UA plates (W51 and UA1) achieved
higher V50
than over-aged plates (OA1 and 0A2); the same trend as that of 1-inch thick
plates even
though the maximum difference in V50 between UA (W51) and OA plates for 2-inch
thick
plates reduced to 157 ft/s. Note that the W51 temper represents only natural
aging at room
temperature. These results suggest that the maximum V50 can be achieved
through
underaging rather than over-aging of AA 7085 plates.
[0085] Armor piercing (AP) tests were also conducted, and the results are
illustrated in
FIG. 6c. AP resistance decreases with decreasing strength.
[0086] FIGS. 7a-7f are pictures of the 1-inch plates after the FSP
ballistic tests. Both
partial (FIGS. 7a, 7c, 7e) and full penetration (FIGS. 7b, 7d, 7f) photographs
are shown.
"TD" as used in stands for transverse direction. The failure of plates can be
generally
categorized into three modes:
CA 02771585 2012-02-17
WO 2011/029033 PCT/US2010/047866
[0087] Mode 1. Spa11 penetration with detachment. The plate spalled during
the partial
penetration test, but to a substantial less degree (FIG. 7a). Obviously, the
plate spalled when
projectile comes out of the plate during the full penetration test (FIG. 7b).
[0088] Mode 2. Spall ¨ prior to penetration. As shown in FIG. 7c, the
degree of spall
during the partial penetration test in Mode 2 is significantly higher than in
Mode 1, which
marks the major difference in characteristics of spall between these two
modes. There is no
remarkable difference in spall for full penetrated plates between Mode 2 and
Mode 1.
[0089] Mode 3. Plug without spall. Mode 3 is characterized by ejection of a
plug. FIG.
7e shows the formation of the plug during partial penetration test. The plug
was ejected
during full penetration test.
[0090] Regarding spall, the failure mode of each experimental alloy (7085-UAO,
-UA0.5,
-UAl, -PS, -0A1, -0A1.5, and -0A2) was determined for the 1" plates, and is
marked as
"1", "2", and "3" for Mode 1, Mode 2, and Mode 3, respectively, in FIG. 4. The
under-aged
plates (UAO, UA0.5, and UA1) exhibit Mode 1 type of failure, while the peak
strength (PS)
and over-aged plates (OAl and ()ALS) incur Mode 2 type of failure. The 0A2
plates,
substantially over-aged, shows Mode 3 type of failure, which is also the
failure mode of
benchmark AA 5083-H131 plates.
[0091] Microstructure Analysis
[0092] FIGS. 8a-8b illustrates the top view (FIG. 8a) and cross-section
microstructure
view (FIG. 8b) of an AA 5083-H131 plate subjected to the FSP ballistic test.
Plug failure
with indications of Hertzian cracks was observed. FIG. 9 illustrates one
proposal relating to
the formation of Hertzian cracks. The impact of the projectile generates
compressive shock
waves which reflect from the back surface and form tensile shock waves. The
interaction of
these waves results in severe shear and Hertzian cracks that eventually leads
to plug failure.
Such a plug failure mode is the major failure mode of benchmark AA 5083-11131
alloy
subject to the FSP ballistic test. Some shear bands and small cracks extended
from the major
Hertzian cracks were also observed (FIG. 10a). The cracks are seen to
propagate along
coarse constituent particle bands (FIG. 10b).
[0093] FIG. 11 shows the cross-section microstructure of AA 7085-UAO plate
subjected
to a FSP ballistic test. Cracks develop in the rolling direction (RD) that is
perpendicular to
the normal direction (ND), i.e., the moving direction of the projectile in the
plate. The
Hertzian cracks are not as severe as those observed in AA 5083-H131 plate. AA
7085-UA 1 ,
another under-aged condition, also shows development of cracks in the RD (FIG.
11).
16
CA 02771585 2012-02-17
WO 2011/029033 PCT/US2010/047866
However, no Hertzian crack was observed even though some shear bands are
present in AA
7085-UA1 plate. FIGS. 11c and lld show microstructures of AA 7085-0A1, and -
0A2
plates, respectively. Both cracks along the RD and Hertzian cracks are well
developed in the
AA 7085-0A1 plate. Interestingly, no cracks along the RD develop in AA 7085-
0A2 plate
in which Hertzian cracks developed in a very similar way as those did in AA
508341131
plate.
[0094] As described above, FIG. 4 illustrates that the failure mode of AA
7085 plates
subjected to FSP ballistic test changes from Mode 1 (Spa11 ¨ penetration with
detachment)
for under-aged conditions to Mode 3 (Plug without spall) for over-aged
conditions. This is
consistent with the above results, which show that the microstructure changes
from cracks
along the RD with very limited development of Hertzian cracks in under-aged
plates to
almost exclusive Hertzian cracks in over-aged conditions.
[0095] For AA7085-UA1 alloy, the cracks, almost parallel to RD as shown in
FIG. 11b,
appear to propagate along the grain boundaries that are almost parallel to the
RD (FIG. 12a).
Fine precipitates are seen on the grain boundary (FIG. 12b). Similar cracks
were also
observed in both AA 7085-0A1 (FIG. 13a), and AA7085-0A2 plates (FIG. 13b).
This type
of crack appears to involve no severe shear deformation.
[0096] Another type of crack involves severe shear deformation. As shown in
FIG. 14a,
severe shear bands interact to create cracks. In this case, cracks propagate
along the shear
bands instead of grain boundaries (FIG. 14b). The figures illustrate that
multiple
transgranular shear bands are present at the crack sites. These shear bands
are characterized
as being parallel in nature at an angle of approximately 45 degree to the RD
of the plate.
Moreover, the shear bands are associated with small precipitates (FIGS. 15a-
15b). The
width of the shear band is about 15 to 20 microns (FIG. 15a). The small
precipitates are
seen uniformly distributed inside the shear band (FIG. 15b). FIG. 16a shows a
crack due to
shear deformation. The small precipitates can be found around the crack (FIG.
16b). FIGS.
17a-17b shows that cracks coalesce in AA 7085-0A2 plate. It can be seen that
the large
crack to be formed by coalescence of cracks is about 45 degree to the RD (FIG.
17a) even
though each crack in coalescence appears to follow the grain boundary (FIG.
17b).
[0097] FIGS. 18a-18b, 19a-19b and 20a-20b show TEM images of grain boundaries
in
AA 7085-UA1, -0A1, and -0A2 plates, respectively. The TEM images are at the
T/2
location from the LT-L plane of the product. FIGS. 18a, 19a and 20a are TEM
dark field
images (Z.A. = <110>). For FIGS. 18a and 19a, the dark field picture was taken
from g =
17
CA 02771585 2012-02-17
WO 2011/029033 PCT/US2010/047866
<1 1 1> from a high angle grain boundary. For FIG. 20a, the dark field picture
was taken
from g = <022> from a high angle grain boundary. As illustrated, the size and
density of
precipitates on the grain boundary increase with the progress of aging. More
precipitates
were seen on the grain boundary in Al condition (FIGS. 19a-19b) than in UA 1
condition
(FIGS. 18a-18b). The grain boundary was almost covered by precipitates in 0A2
condition
(FIGS. 20a-20b). The phases observed on the grain boundary are consistent with
the M
phase (MgZn2) based on Dark Field imaging conditions.
[0098] These results illustrate that aging may affect the ballistic
resistance of AA 7085.
FSP ballistic resistance in terms of V50 correlates to aging status: under-
aged plates
generally outperformed the over-aged plates in FSP ballistic resistance.
Neither TYS nor
strain hardening rate can explain such a trend, which suggests neither TYS nor
strain
hardening rate, alone, is a reliable indication of FSP ballistic resistance
for AA 7085 plates.
[0099] The microstructural analysis shows that AA 7085 responds to FSP
ballistic test
differently depending upon the aging condition. Grain boundary precipitation
appears to
correlate with these different responses. For under-aged plates, the grain
boundary contains
very few precipitates, which helps maintain a high strength level of grain
boundary. In
contrast, the grain boundary of over-aged plates is characterized by intense
precipitates,
which reduces strength level of the grain boundary. High grain boundary
strength of under-
aged plates may explain high resistance to crack coalescence in the ND due to
shear
deformation. As a result, shock energy may be absorbed, and expended to
propagate cracks
in the RD for under-aged plates. The over-aged plates are prone to crack
coalescence in the
ND under shear deformation due to low grain boundary strength. The weakness of
grain
boundary may be responsible, at least in part, for the spall incurred before
penetration and
plug failures of over-aged plates. Also, adiabatic heat generated in the shear
bands appears
to lead to the formation of small precipitates inside of the shear bands.
[00100] Example 2 - Testing of 2XXX+Li Alloy (AA2099)
[00101] AA2099 is prepared for aging, similar to that illustrated in FIG.
2, as a 1" plate. A
first sample of AA2099 is aged to peak strength in a T8 temper, having a
tensile yield
strength (L) of about 71.8 ksi. A second sample of AA2099 produced in a T8
temper, but is
underaged, achieving a tensile yield strength (L) of about 64.9 ksi. Both
samples are
subjected to FSP resistance testing in accordance with MIL-STD-662F(1997)
using 0.50
caliber rounds. The second, underaged aluminum alloy realizes a better FSP
performance
than the peak aged sample. The second, underaged sample realizes a V50 FSP
performance
18
CA 02771585 2012-02-17
WO 2011/029033 PCT/US2010/047866
of about 3000 feet per second, whereas the first, peak aged sample realizes a
V50 FSP
performance of about 2950 feet per second.
[00102] Example 3 - Testing of 2XXX+Li+Ag Alloy
[00103] A second alloy, similar to AA2099, but having about 0.5 wt. %
silver (referred to
in this example as the Al-Li-Ag alloy), is prepared for aging, similar to that
illustrated in
FIG. 2, as a 1" plate. A first sample of the Al-Li-Ag alloy is aged to peak
strength in a T8
temper, having a tensile yield strength (L) of about 83.6 ksi. A second sample
of the Al-Li-
Ag alloy is produced in a T8 temper, but is underaged, achieving a tensile
yield strength (L)
of about 75.9 ksi. Both samples are subjected to FSP resistance testing in
accordance with
MIL-STD-662F(1997) using 20 mm rounds. The second, underaged aluminum alloy
realizes a better FSP performance than the peak aged sample. The second,
underaged
sample realizes a V50 FSP performance of about 1638 feet per second, whereas
the first,
peak aged sample realizes a V50 FSP performance of about 1535 feet per second.
FSP
resistance testing with 50 caliber rounds are also tested. Again, the second,
underaged
aluminum alloy realizes a better FSP performance than the peak aged sample.
The second,
underaged sample realizes a V50 FSP performance (50 cal.) of about 3740 feet
per second,
whereas the first, peak aged sample realizes a V50 FSP performance of about
3550 feet per
second. Both samples are also subjected to AP resistance testing. The first,
peak aged
sample realizes a V50 AP resistance of about 2353 feet per second, and the
second,
underaged sample realizes a V50 AP resistance of about 2305 feet per second.
The increase
in FSP resistance is about 6.3% and about 5.1% for 20 mm and 50 caliber
rounds,
respectively. The decrease in AP resistance is about 2.1%, which is much less
than the FSP
resistance increase. The FSP resistance for 20 mm increased at about 3X the
rate of AP
resistance decrease. In other words, the AP decrease is 33.3% of the FSP
increase relative to
20 mm FSP. The FSP resistance for 50 caliber rounds increased at about 2.4X
the rate of AP
resistance decrease. In other words, the AP decrease is about 41.2% of the FSP
increase
relative to 50 caliber FSP.
19