Note: Descriptions are shown in the official language in which they were submitted.
CA 02778773 2012-04-24
WO 2011/008581 PCT/US2010/040845
DEVICES, METHODS, AND KITS FOR DETERMINING ANALYTE CONCENTRATIONS
FIELD
[0001] The present application relates generally to measuring or otherwise
evaluating (e.g.,
estimating) the concentration of one or more analytes in a fluid sample. More
specifically, the present
application relates to devices, methods, and kits that may be used to collect
sweat from a skin surface,
and to measure the concentration of one or more analytes, such as glucose, in
the collected sweat.
BACKGROUND
[0002] Many people around the world suffer from diabetes, and the number of
affected people
continues to increase. Diabetes is a leading cause of death and can result in
broad complications, such
as blindness, kidney disease, nerve disease, heart disease, amputation, or
stroke.
[0003] Diabetes results from the inability of the body to produce or properly
use insulin. In simple
terms, insulin is a hormone that regulates the level of glucose in the blood
and allows glucose to enter
cells. In diabetics, glucose cannot enter the cells, so glucose builds up in
the blood to toxic levels.
Although the cause of diabetes is not completely understood, it is believed
that genetics,
environmental factors, and viral causes contribute to the incidence of
diabetes in the world population.
[0004] There are two major types of diabetes: Type 1 and Type 2. Type 1
diabetes (also known as
juvenile diabetes) is caused by an autoimmune process destroying the beta
cells that secrete insulin in
the pancreas. Type 1 diabetes most often occurs in young adults and children.
People with Type 1
diabetes are typically required to self-administer insulin using, for example,
a syringe or a pen with a
needle and cartridge. Continuous subcutaneous insulin infusion via external or
implanted pumps is
also available. Type 2 diabetes, which is more common than Type 1 diabetes, is
a metabolic disorder
resulting from the body's inability to make enough insulin or to properly use
insulin. People with
Type 2 diabetes are typically treated with changes in diet and exercise, as
well as with oral
medications. Many Type 2 diabetics become insulin-dependent at later stages of
the disease. Diabetics
1
CA 02778773 2012-04-24
WO 2011/008581 PCT/US2010/040845
using insulin to help regulate their blood sugar levels are at an increased
risk for medically-dangerous
episodes of low blood sugar due to errors in insulin administration, and/or
unanticipated changes in
insulin absorption.
[0005] It is highly recommended by medical professionals that insulin-using
patients practice self-
monitoring of blood glucose ("SMBG"). Based upon the level of glucose in the
blood, individuals
may make insulin dosage adjustments before injection. Adjustments are
generally necessary since
blood glucose levels vary from day to day for a variety of reasons, such as
exercise, stress, rates of
food absorption, types of food, hormonal changes (pregnancy, puberty, etc.),
and the like. Despite the
importance of SMBG, several studies have found that the proportion of
individuals who self-monitor
at least once a day significantly declines with age. This decrease is likely
the result of the most widely
used method of SMBG involving obtaining blood from a capillary fingerstick,
which can be painful,
as discussed below.
[0006] The vast majority of equipment used to self-monitor blood glucose is
invasive, requiring
fingersticks (or lancing alternative sites, such as the forearm) and
application of whole blood samples
to test strips. Lancing the fingers can be particularly painful over time, and
can therefore prevent
many users from measuring their blood glucose as frequently as they should.
Although non-invasive
systems have been developed, some of them exhibit poor correlation to invasive
blood glucose
measurements, and/or high cost.
[0007] In view of the above, it would be desirable to provide additional
devices, methods, and kits
for measuring or otherwise evaluating the concentration of glucose, and/or
other analytes, in a body
fluid. It would also be desirable for such devices, methods, and kits to be
non-invasive and easy to
use. It would further be desirable to provide methods for measuring or
otherwise evaluating the
concentration of one or more analytes in a body fluid in a relatively short
period of time.
2
CA 02778773 2012-04-24
WO 2011/008581 PCT/US2010/040845
SUMMARY
[0008] Described here are devices, methods, and kits for measuring or
otherwise evaluating (e.g.,
estimating) the concentration of one or more analytes in a body fluid. The
devices, methods, and/or
kits may be non-invasive, and thus may not require painful blood draws (e.g.,
fingersticks), or their
resulting wounds. Moreover, the devices, methods, and/or kits may be used to
measure the
concentration of one or more analytes in a body fluid relatively efficiently
(e.g., in a relatively short
period of time).
[0009] While the devices, methods, and kits may be configured, as appropriate,
to measure or
otherwise evaluate the concentration of any analyte or analytes (e.g.,
glucose, proteins, enzymes,
cholesterol, phenylalanine, ketones, etc.) in any body fluid sample (e.g.,
sweat, blood, serum, urine,
saliva, amniotic fluid, etc.), for illustrative purposes, they will be
described here with reference to
measuring the concentration of glucose in sweat. It should be understood,
however, that descriptions
provided here with respect to evaluating sweat glucose concentration may also
be applied to other
suitable analytes and/or body fluid samples. For example, devices, methods,
and/or kits described here
may be used to test whole blood samples (e.g., relatively small volume
samples) for the presence of
one or more analytes (e.g., glucose).
[0010] Additionally, if so desired, the concentration of an analyte in one
body fluid may be used
to estimate the concentration of the analyte in another body fluid. For
example, a sweat glucose
concentration value may be used to estimate a blood glucose concentration
value. As an example, a
sweat glucose concentration measurement may be correlated to a blood glucose
concentration value
using one or more algorithms. Thus, a user may be able to determine critical
blood glucose values,
without having to endure the pain and difficulty that may be associated with
obtaining a whole blood
sample. Because users may not have to endure any pain associated with testing,
it is expected that
users will test more frequently than they might with other, more invasive,
testing methods. This, in
turn, may lead to better compliance with prescribed regimens and, therefore,
better clinical outcomes.
Moreover, in some cases, the devices described here may be manufactured
relatively inexpensively
3
CA 02778773 2012-04-24
WO 2011/008581 PCT/US2010/040845
(e.g., by using low-cost materials and/or methods). Accordingly, a user may
pay a relatively low cost
per test, thereby allowing for more frequent sweat and blood glucose
concentration evaluation.
[0011] The devices described here typically include one or more membranes. In
some variations,
the devices may include one or more colorimetric membranes, such that a
chemical reaction may
occur between an analyte in the collected sweat and one or more chemicals
contained in the
colorimetric membrane to thereby produce an optically detectable reactant.
While devices, methods,
and kits are generally described here with respect to colorimetric membranes,
it should be understood
that devices, methods, and/or kits described here may alternatively or
additionally comprise one or
more other types of collection and/or analysis supports, such as one or more
electrochemical
chambers, as appropriate.
[0012] In some variations, a colorimetric membrane may be placed into contact
with a skin
surface and used to collect sweat from the skin surface (e.g., via capillary
action or by diffusion or
other fluid sequestering means). The concentration of glucose in the collected
sweat may then be
evaluated (e.g., by imaging the colorimetric membrane after it has collected
and reacted with sweat).
In certain variations, the devices described here may additionally comprise
one or more wicking or
collection portions (e.g., layers). The wicking or collection portions may,
for example, be located
between the colorimetric membrane and the skin surface during use, and may
help to wick or collect
sweat into the membrane.
[0013] In some variations, the devices described here may be in the form of a
testing substrate,
such as a test strip. While features and characteristics of test strips are
described herein, it should be
understood that these features and characteristics may also be applied to
other types of testing
substrates, as appropriate. Testing substrates may have any suitable
configuration, including but not
limited to circular, oval, square, and rectangular shapes, irregular shapes,
uniform thicknesses, and
non-uniform thicknesses. In some variations, a testing substrate may be in the
form of a tape that may
be stored and administered in a roll. The configuration of a testing substrate
may depend, for example,
on the particular analyte and/or fluid sample being evaluated, the anatomical
4
CA 02778773 2012-04-24
WO 2011/008581 PCT/US2010/040845
characteristics of the site that contacts the testing substrate during use,
and the methods (e.g.,
colorimetric or electrochemical) for determining the concentration of the
analyte. Moreover, testing
substrates may comprise any variety of different suitable materials.
[0014] In certain variations, the devices, methods, and/or kits described here
may be used to
collect a volume of sweat that is relatively small. For example, the volume of
sweat may be less than
about 10 microliters (e.g., about 5 microliters, about 3 microliters, about 1
microliter, about 0.8
microliter, about 0.5 microliter, about 0.3 microliter, about 0.1 microliter,
or less). In some cases, the
volume of the sweat may be less than about 1 nanoliter. The concentration of
glucose in the sweat
may be, for example, from about 0.1 mg/dL to about 10 mg/dL (e.g., from about
0.1 mg/dL to about 5
mg/dL). Glucose concentration may be measured at these levels or in certain
variations, may be
measured at levels of, for example, less than about 0.5 mg/dL.
[0015] Some variations of methods for measuring the concentration of an
analyte in sweat of a
subject may comprise placing a membrane (e.g., a colorimetric membrane or
electrochemical strip)
into contact with a skin surface of the subject so that the membrane or strip
collects a volume of sweat
from the skin surface, and analyzing the membrane or strip to determine the
concentration of the
analyte in the collected volume of sweat.
[0016] The membrane may be analyzed using any of a number of different
methods. As an
example, an optical system may be used to evaluate spectral emissions (e.g.,
when fluorescence is
used), or the spectral absorption or reflection, of a colorimetric membrane.
As another example, light
from one or more light-emitting diodes may be applied to a colorimetric
membrane, and/or one or
more photodiodes may be used to detect light reflected from a colorimetric
membrane. As an
additional example, an optical system may be used to evaluate the intensity of
spectral light reflected
from a colorimetric membrane. As another example, an optical system may be
used to evaluate the
intensity of monochromatic light reflected from a colorimetric membrane. In
certain variations, a
densitometer may be used to analyze a colorimetric membrane. In some
variations, light from a laser,
and/or a wide spectrum light source, may be directed to a colorimetric
membrane. In certain
CA 02778773 2012-04-24
WO 2011/008581 PCT/US2010/040845
variations, a charge-coupled device (CCD), a CMOS-based detector, and/or a
camera may be used to
image a colorimetric membrane. Some methods may include scanning a
colorimetric membrane to
determine the optical density of at least one colored portion of the membrane.
In certain variations,
the optical transmission property of a colorimetric membrane may be evaluated.
[0017] In some variations, a colorimetric membrane may include one or more
spots generated by a
chemical reaction between the analyte and chemicals contained in the
colorimetric membrane, where
the chemical reaction occurs when the colorimetric membrane contacts the skin
surface. The method
may comprise discriminating the background color of the membrane from the
spot(s). This may, for
example, help to distinguish the target analyte(s) from contaminants.
Alternatively or additionally, the
appearance of spots on the colorimetric membrane may be used to estimate the
sweat rate of the
subject.
[0018] Contacting the membrane with the skin surface may comprise holding the
membrane
against the skin surface. The membrane may, for example, be in contact with
the skin surface for at
most about one hour (e.g., at most about 30 minutes, at most about 10 minutes,
at most about 5
minutes, at most about 4 minutes, at most about 3 minutes, at most about 2
minutes, at most about 1
minute, at most about 30 seconds, at most about 20 seconds, at most about 10
seconds, at most about
seconds). Alternatively or additionally, the membrane may, for example, be in
contact with the skin
surface for at least about 1 second (e.g., at least about 5 seconds, at least
about 10 seconds, at least
about 20 seconds, at least about 30 seconds, at least about 1 minute, at least
about 5 minutes, at least
about 10 minutes, at least about 30 minutes).
[0019] In some variations, the collected volume of sweat may saturate the
membrane. In certain
variations, the collected volume of sweat may be collected by a portion of the
membrane, and the
method may comprise analyzing the portion of the membrane.
[0020] In some variations, the analyte may comprise glucose. The method may
further comprise
calculating or estimating the concentration of glucose in blood of the subject
(e.g., using at least one
6
CA 02778773 2012-04-24
WO 2011/008581 PCT/US2010/040845
algorithm that converts the concentration of glucose in sweat to the
concentration of glucose in
blood). In certain variations, a colorimetric membrane may comprise a first
component (e.g., glucose
oxidase) that converts glucose to hydrogen peroxide. The colorimetric membrane
may further
comprise a second component (e.g., a peroxidase, such as horseradish
peroxidase) that reacts with the
hydrogen peroxide. The colorimetric membrane may also comprise a third
component comprising an
indicator that changes color in the presence of hydrogen peroxide. The
indicator may, for example,
comprise an oxidizable dye or a dye couple, such as meta [3-methyl-2-
benzothiazolinone] N-sulfonyl
benzenesulfonate monosodium combined with 8-anilino-l-naphthalene sulfonic
acid ammonium.
[0021] The method may further comprise inducing sweat prior to collecting the
volume of sweat
from the skin surface. Sweat may be induced, for example, by administering
pilocarpine to the skin
surface.
7
CA 02778773 2012-04-24
WO 2011/008581 PCT/US2010/040845
BRIEF DESCRIPTION OF THE DRAWINGS
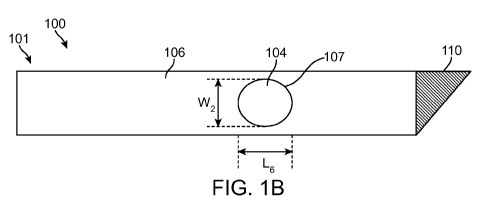
[0022] FIG. 1A is a top view of a variation of a test strip; and FIG. IB is a
bottom view of the test
strip of FIG. 1 A.
[0023] FIG. 2A is a perspective view of a variation of a test region of a test
strip, and FIG. 2B is a
cross-sectional view of the test region of FIG. 2A, taken along line 2B-2B.
[0024] FIGS. 2C-2E are cross-sectional views of additional variations of test
regions of test strips.
[0025] FIGS. 3A-3D are perspective views of different variations of spreading
layers of test
strips.
[0026] FIG. 4 is a flowchart representation of a variation of a method for
making a test strip.
[0027] FIGS. 5A-5C are different views of a variation of a test well array
that may be used to
determine the concentration of glucose in a single sweat bolus.
[0028] FIG. 6A is cross-sectional view of a portion of a test well array. FIG.
6B is a flowchart
representation of a variation of a method for making a test well array.
[0029] FIG. 7 is an illustrative top view of a variation of a meter for
measuring the concentration
of an analyte in a fluid sample.
[0030] FIG. 8 is a flowchart representation of a variation of a method for
evaluating the
concentration of glucose in blood of a subject.
[0031] FIG. 9A is a photograph of a colorimetric membrane contacting a finger
of a subject, and
FIG. 9B is a photograph of the colorimetric membrane of FIG. 9A after its
color has changed as a
result of contact with the finger.
8
CA 02778773 2012-04-24
WO 2011/008581 PCT/US2010/040845
[0032] FIGS. I OA and 1 OB are photographs of colorimetric membranes after
different exposure
times to a skin surface.
[0033] FIGS. 1 OC-1 OH are photographs of colorimetric membranes after
different exposure times
to a skin surface, with each colorimetric membrane having one side wrapped in
Parafilm .
[0034] FIG. I IA is a photograph of a colorimetric membrane after a glucose
solution of known
concentration has been applied to the colorimetric membrane using an inkjet
printer; FIG. 11B is an
image of FIG. I IA taken from a red video channel; FIG. 11C is a photograph of
the colorimetric
membrane of FIG. 11 A; and FIG. I I D is a graphical representation of the
grey scale intensity of a
selection of spots shown in FIG. 11C.
[0035] FIG. 11E is a photograph of portions of six test strips that have been
exposed to glucose
solutions having different concentrations; FIG. 11F depicts the red channel
component of FIG. 11E;
FIG. I IG depicts the blue channel component of FIG. I IE; and FIG. 11H
depicts the green channel
component of FIG. I I E.
[0036] FIG. 11I is a graphical representation of the optical intensity of each
profile of FIGS. I I F-
11 H along a horizontal line drawn through each profile vs. distance along the
profile.
[0037] FIGS. 11J-11O each plot the relationship between the optical signal of
a single channel vs.
glucose concentration or the base 10 logarithm of glucose concentration.
[0038] FIG. I IP is a histogram depicting image data for the red channel
component of FIG. I IE;
FIG. 11Q is a histogram depicting image data for the green channel component
of FIG. I IE; and FIG.
I I R is a histogram depicting image data for the blue channel component of
FIG. I I E.
9
CA 02778773 2012-04-24
WO 2011/008581 PCT/US2010/040845
DETAILED DESCRIPTION
[0039] Devices, methods, and kits for sensing and/or measuring glucose in
sweat are described. In
general, sweat may be collected from a skin surface of a subject (e.g., a
patient) using, for example, a
testing substrate such as a test strip. The collected sweat may then be
evaluated to determine its
concentration of glucose. In some cases, the test strip may be a colorimetric
test strip. For example,
the test strip may comprise one or more colorimetric membranes. The membrane
or membranes may
contain one or more reagents that change color as a function of the
concentration of glucose in the
collected sweat. After sweat has been collected for a certain period of time
(which may be relatively
short), the color of the membrane may be measured (e.g., using optical
techniques, as discussed
further below). If so desired, the resulting measurement may then be
correlated to a blood glucose
concentration. The devices, methods, and kits will now be described below.
While certain components
and materials will be described, it should be understood that other
appropriate components and
materials may alternatively or additionally be used in some variations. For
example, in certain
variations, one or more components and/or materials described in U.S. Patent
Application Serial Nos.
11/159,587 (published as US 2006/0004271 Al) and/or 11/451,738 (published as
US 2007/0027383
Al) may be used. Both of these references are incorporated herein by reference
in their entirety.
Devices
A. Test Strips
[0040] Any suitable test strip or other testing substrate may be used to
measure the concentration
of glucose in sweat. It should be noted again that while the example of
measuring the concentration of
glucose in sweat and then correlating the sweat concentration to a blood
concentration is discussed in
detail here, the devices, methods, and kits described here may be used to
measure or otherwise
evaluate the concentration of any analyte in any fluid sample, as appropriate.
[0041] FIGS. 1A and lB show one variation of a test strip (100). FIG. 1A shows
the top surface
(101) of test strip (100), and FIG. 113 shows the bottom surface (103) of test
strip (100). As shown in
CA 02778773 2012-04-24
WO 2011/008581 PCT/US2010/040845
FIGS. 1A and 1B, test strip (100) comprises a membrane (104) generally located
in a test region
(108), and a base (106). Upon contacting test strip (100), a fluid sample may
flow into membrane
(104), where one or more reagents may be used to detect a characteristic
(e.g., presence,
concentration, absolute quantity, reactivity, etc.) of a target analyte. In
some variations, a detection
system or other appropriate device or method may then be used to interrogate
the test strip (e.g.,
optically, chemically, and/or electrically) and convey information about the
analyte to the user.
[0042] In certain variations, membrane (104) of test strip (100) may be a
colorimetric membrane,
such that the above-described measured property of the target analyte may be
conveyed via color
changes of the membrane. In some variations, a colorimetric membrane may
comprise a substrate or
matrix material and one or more reagents selected to react with or in the
presence of one or more
analytes. When a fluid sample comprising one or more of the specific analytes
is applied to the
colorimetric membrane, the color of the colorimetric membrane may change,
thereby providing a
visual indication of the presence of the analyte or analytes in the fluid
sample. In some cases, the
color change (e.g., the change in the optical absorption and/or reflection
spectrum) may then be
evaluated and/or measured (e.g., to determine the concentration of the analyte
or analytes in the fluid
sample). Examples of measurement devices that may be used to measure and/or
evaluate such a
change, as well as examples of colorimetric membranes, are described in
further detail below.
[0043] Test strip (100) may also comprise a spreading layer. In some
variations, the spreading
layer may extend across a substantial portion of test strip (100), such as at
least about 20% of the
length of test strip (100). In certain variations, a spreading layer may
extend over the entirety of a
membrane (e.g., membrane (104)). In other variations, a spreading layer may
only extend over one or
more portions of a membrane. In variations in which a test strip comprises a
membrane and a
spreading layer, the membrane may be located anywhere along the length of the
spreading layer. For
example, the membrane may be generally centered relative to the spreading
layer. The spreading layer
may be used to help distribute a fluid sample on the test strip, so that the
sample does not over-
11
CA 02778773 2012-04-24
WO 2011/008581 PCT/US2010/040845
saturate a single location of a membrane of the test strip. Spreading layers
are described in additional
detail below.
[0044] Membrane (104) (and, e.g., a spreading layer) may be mounted on base
(106). Base (106)
may provide additional structural support and ease of handling. However, other
variations of test
strips may have different configurations that may or may not include a base.
For example, in certain
variations, instead of including a base, a test strip may comprise a spreading
layer and a membrane in
the form of a tape that is enclosed within a cartridge as a spool, and
installed in a device requiring
little or no manual handling.
[0045] Referring again to FIGS. 1A and 1B, base (106) includes a window (107)
that is located
within test region (108). In some variations, window (107) may expose membrane
(104) for
application of sample to membrane (104) for analysis (e.g., by optical,
chemical, or electrical means).
Window (107) may have any suitable shape or size. In some variations, window
(107) may be molded
at the same time that base (106) is formed, while in other variations window
(107) may be cut out
after base (106) is formed.
[0046] As shown in FIG. IA, test strip (100) has a length L, and a width W1.
As described
previously, a spreading layer may be situated at any appropriate location
along a test strip. For
example, a spreading layer may be located along the length of base (106). In
some variations, length
L1 may be from about 1 centimeter to about 8 centimeters, and/or width W1 may
be from about 0.3
centimeter to about 4 centimeters.
[0047] Referring again to FIGS. 1A and IB, test region (108) is located within
membrane (104).
Additionally, window (107) has a longitudinal dimension L6 (e.g., length or
diameter, depending on
the shape), and a width W2, where L6 and W2 may be, for example, from about
0.1 centimeter to about
3 centimeters.
[0048] Test strips may comprise any appropriate number of layers. For example,
a test strip may
comprise the same number of layers as test strip (100), or may comprise fewer
layers or more layers.
12
CA 02778773 2012-04-24
WO 2011/008581 PCT/US2010/040845
Different exemplary variations of test strips comprising different layers,
configurations, and
compositions are described in further detail below.
[0049] A variation of a test region (200) of a test strip is depicted in FIGS.
2A and 2B. As shown
there, test region (200) comprises a spreading layer (202) and a membrane
(206). During use, a fluid
sample, such as blood or sweat, may come into contact with spreading layer
(202), such that the fluid
sample may be distributed laterally as it flows to membrane (206). The target
analyte may then be
detected in membrane (206).
[0050] In some variations, a test strip may comprise one or more layers that
separate a fluid
sample source (e.g., a source of blood, or a skin surface) from a membrane of
the test strip. For
example, some variations of test strips may have two separating layers, such
as a spreading layer and
a porous layer (e.g., test region (240) of the test strip depicted in FIG.
2D), or may have just one
separating layer, such as a porous spreading layer (e.g., test region (220) of
the test strip depicted in
FIG. 2B).
[0051] The layers of a test strip may have the same thickness, or varying
thicknesses throughout.
For example, the test strip test region (220) shown in FIG. 2B has two layers
of different thicknesses.
As shown there, test region (220) comprises a spreading layer (202) having a
thickness t, which may,
for example, be from about 5 microns to about 700 microns (where one "micron"
is equivalent to one
micrometer). Additionally, test region (220) comprises a membrane (206) having
a thickness t2, where
t2 may be, for example, from about 5 microns to about 500 microns. It should
also be noted that some
variations of test strips may comprise multiple layers of different areas. For
example, a test strip may
comprise a middle layer with a smaller area located between two layers (e.g.,
a top and bottom layer)
each having a larger area.
[0052] FIG. 2C depicts a test region (230) of a test strip comprising just one
porous layer (208). In
such cases, the layer may have a single function, or may have multiple
functions. For example, in
some variations, the layer may function as a membrane (e.g., a colorimetric
membrane). In some such
13
CA 02778773 2012-04-24
WO 2011/008581 PCT/US2010/040845
variations, only the reagent that is in close proximity to the placement of
the fluid sample reacts in the
presence of, and thereby detects, analyte in the sample. Optionally, the layer
may function both as a
spreading layer and as a membrane, such that a fluid sample may traverse
across the surface prior to
contacting and reacting with the reagent. The reagent or reagents may be
distributed throughout the
porous layer, or may, for example, be located in a sub-region (e.g., a sub-
layer) of the porous layer. In
other variations, and as described briefly above, one or more layers may
separate the fluid sample
source (e.g., a skin surface) from the membrane. Porous layer (208) has a
thickness t11, where tõ may
be, for example, about 5 microns to about 500 microns.
[0053] The test region (240) of another variation of a test strip is shown in
FIG. 2D. As shown
there, test region (240) comprises a spreading layer (242), a porous layer
(244), and a membrane
(246). Spreading layer (242) has a thickness t3, where t3 may be, for example,
from about 5 microns to
about 700 microns. Additionally, porous layer (244) has a thickness t4, where
t4 may be, for example,
from about 5 microns to about 500 microns, and membrane (246) has a thickness
t5, where t5 may be,
for example, from about 5 microns to about 500 microns.
[0054] The thickness of any layer in a test strip, such as one of the test
strips described above, may
be based on any of a number of factors. For example, the thickness of a layer
may depend on the fluid
characteristics of the sample to be tested, the porosity of the layer (and/or
other layers), the quantity of
the fluid sample required to provide an accurate detection, the sensitivity of
the membrane to the
target analyte, and any characteristics that may impact the fluid flow from
the sample source (e.g., a
skin surface). As an example, in certain variations, the thickness of the
spreading layer may be
selected based on the features of the fluid sample being tested, and/or based
on the target analyte. In
some variations, the spreading layer may have a thickness of about 5 microns
to about 700 microns.
The material composition of each layer may also be chosen based on optical,
electrical, and/or
capacitive characteristics, and/or one or more other characteristics.
[0055] As described previously, membranes that are used in the devices
described here may have
any appropriate size and shape (e.g., rectangular, circular, oval, etc.). In
some variations, a membrane
14
CA 02778773 2012-04-24
WO 2011/008581 PCT/US2010/040845
may have a thickness of about 5 microns to about 400 microns (e.g., about 5
microns to about 30
microns, about 25 microns to about 50 microns, about 50 microns to about 75
microns, about 75
microns to about 100 microns, about 100 microns to about 150 microns, about
150 microns to about
350 microns, about 200 microns to about 300 microns, about 225 microns to
about 275 microns). For
example, a membrane may have a thickness of about 5 microns, about 10 microns,
about 25 microns,
about 50 microns, about 75 microns, about 100 microns, about 115 microns,
about 125 microns, about
140 microns, about 145 microns, about 150 microns, about 170 microns, about
178 microns, about
200 microns, about 250 microns, about 280 microns, about 305 microns, about
318 microns, about
330 microns, about 343 microns, or about 350 microns. In some cases, the
thickness of a membrane
may be selected based on the analyte that is being evaluated.
[0056] FIG. 2E depicts a test region (250) of another variation of a test
strip. As shown there, test
region (250) comprises a membrane (256), as well as a wicking layer (254) and
a sink layer (252)
beneath membrane (256). During use, wicking layer (254) may draw excess fluid
sample from
membrane (256) to sink layer (252). As shown in FIG. 2E, membrane (256) has a
thickness t8, where
t8 may be, for example, from about 5 microns to about 500 microns.
Additionally, wicking layer (254)
has thickness t9. In some variations, t9 may be from about 5 microns to about
500 microns. Moreover,
sink layer (252) has a thickness t1o. In certain variations, do may be from
about 50 microns to about
500 microns.
[0057] Wicking layer (254) may be composed of any appropriate absorbent
material or materials,
such as hydrophilic treated polycarbonate or polyester, or any other material
or materials that may
provide for relatively efficient fluid transfer from membrane (256) to sink
layer (252). For example,
wicking layer (254) may be composed of hydrophilic track etched polycarbonate,
such as the
polycarbonate track etch (PCTE) series of materials from Sterlitech, of Kent,
Washington.
Alternatively, wicking layer (254) may be composed of one or more hydrophilic
monofilament open
mesh fabrics, such as the PETEX series of materials from Sefar Filtration, of
Depew, New York. In
some variations, sink layer (252) may be in the form of a chamber configured
to contain excess fluid
CA 02778773 2012-04-24
WO 2011/008581 PCT/US2010/040845
sample transferred via wicking layer (254). A sink layer (252) that acts as a
chamber may be made of,
for example, an injection molded thermoplastic, such as polycarbonate,
acrylic, acrylonitrile butadiene
styrene (ABS), or polystyrene. In some variations, sink layer (252) may
comprise one or more porous
materials that absorb a greater quantity of fluid than the wicking layer. An
absorbent sink layer (252)
may be composed of any appropriate highly absorbent material(s), such as Porex
Fiber Media or
Porex Sintered Porous Media from Porex Corporation of Fairburn, Georgia.
[0058] Including an additional wicking layer (254) and sink layer (252) may,
for example,
enhance the precision and accuracy of analyte detection by membrane (256). As
an example, the
presence of the wicking layer and sink layer may prevent the membrane from
becoming over-
saturated with the fluid sample and providing an invalid measurement. For
example, during use the
volume of sweat produced by one sweat gland may over-saturate the reagent(s)
in membrane (256).
Such over-saturation may lead to an erroneous reading. However, by including a
wicking layer (254)
and a sink layer (252), excess sweat may be removed from membrane (256),
thereby enhancing the
accuracy of the sweat glucose concentration measurement. It should be
understood, however, that
these additional layers below the membrane are optional (e.g., depending on
the saturation level of the
reagent(s) and the desired detection precision).
[0059] The different layers of a test strip may be attached or otherwise
coupled to each other in a
variety of ways. In some variations, the individual layers may be bonded with
one or more adhesives,
such as pressure sensitive or heat activated acrylic adhesives, such as the
ARcare series from
Adhesives Research of Glen Rock, Pennsylvania. The adhesive(s) may be
transparent or opaque, as
appropriate for the detection technique of the membrane. In some variations,
test strips that are
optically interrogated may be bonded with a transparent adhesive. In certain
variations, the
adhesive(s) may be applied throughout the test strip, except in the proximity
of the test region. This
may prevent any cross-contamination between the adhesive(s) and the sample.
Additionally, in the
case of methods in which a test strip is optically probed, using an opaque
adhesive away from the test
region may minimize optical interference. Test strip layers may also be
attached to each other by
16
CA 02778773 2012-04-24
WO 2011/008581 PCT/US2010/040845
electrostatic forces, welding, clip compression, hook-and-loop fasteners, and
any other suitable
mechanism that ensures secure and reliable fluid contact between layers.
[0060] As described above, in some variations of test strips, the fluid sample
(here, sweat)
initially contacts a spreading layer. Portions of different variations of
spreading layers are depicted in
FIGS. 3A-3D. The spreading layer may act to wick sweat across the test region,
so that the sweat can
be evenly distributed across a membrane of the test region. This, in turn, may
reduce the saturation of
local regions. In such variations, the spreading layer may be selected to have
a capillary structure that
is strong enough to draw sweat from the skin, but that is weaker than the
capillary structure in the
layers that lead to the membrane. As a result, sweat may be efficiently drawn
from the spreading layer
into the membrane.
[0061] Some variations of spreading layers may be porous. The pores in a
spreading layer may all
be of substantially the same size, or at least some of the pores may differ in
size. In certain variations,
a pore may range in size from about 2 microns to about 350 microns (e.g.,
about 2 microns to about
20 microns, about 50 microns to about 250 microns, about 50 microns to about
150 microns, about
100 microns to about 150 microns). Alternatively or additionally, the pores in
a spreading layer may
have a mean size of about 100 microns.
[0062] FIG. 3A shows a spreading layer (300) including pores (302) in the form
of through-holes
extending substantially straight through one side of the spreading layer to
the other side. A similar
variation is shown in FIG. 3B, in which the through-hole pores (312) are of a
smaller diameter than
the variation shown in FIG. 3A. Pore size may be selected, for example, based
on the fluid
characteristics of the target sample or samples, and/or may be tailored to
efficiently transport one or
more specific types of fluid samples. Through-hole pores may allow for the
formation of a direct fluid
connection from one side of the spreading layer to the other.
[0063] As shown in FIGS. 3C and 3D, in some variations a spreading layer may
be similar to a
sponge, with pores (322) and (332) extending in all directions throughout the
thickness of the
spreading layer. Such sponge-like spreading layers may be more absorbent,
laterally distributing the
17
CA 02778773 2012-04-24
WO 2011/008581 PCT/US2010/040845
fluid sample, and may allow for the formation of an indirect fluid connection
from one side of the
spreading layer to the other.
[0064] A spreading layer may comprise pores that are all of approximately the
same size, or may
comprise at least some pores having different sizes. Pores may be uniformly
distributed throughout a
spreading layer, or may be located in one or more specific regions of a
spreading layer. In variations
of spreading layers including pores of different sizes, the pores may be
uniformly distributed, or may
be distributed in a gradient, for example, such that the pores are grouped by
size.
[0065] Depending on, for example, the fluid sample, the spreading layer may
comprise any of a
variety of different materials or combinations thereof. Examples of materials
which may be suitable
for use in a spreading layer include hydrophilic woven fabrics (e.g., Tetko
mesh #7-280/44, from
Sefar America Inc. (formerly Tetko Inc.)), sintered hydrophilic materials
(e.g., from Porex
Corporation, Fairburn, GA), and membranes (e.g., NucleporeTM track-etched
polycarbonate
membranes from Whatman/GE Healthcare, such as Nuclepore #113516, 12 micron
hydrophilic
membrane, or the PCTE series of materials from Sterlitech, of Kent,
Washington). Membrane
materials also are described, for example, in U.S. Patent Application Serial
Nos. 11/159,587
(published as US 2006/0004271 Al) and 11/451,738 (published as US 2007/0027383
Al), both of
which were previously incorporated herein by reference in their entirety. In
some variations, a
spreading layer may comprise one or more heat-sintered plastics (e.g.,
polyethylene, polypropylene,
etc.) that have been rendered hydrophilic by pre- or post-treatment with one
or more surfactants. An
example of such a material is a porous polyethylene treated with sodium methyl
oleoyl taurate and
available from Porex Corporation (Fairburn, GA). One advantage of this
material is that it has
relatively strong absorption, which can cause fluid to be drawn away from the
surface, where it might
otherwise transfer to objects or people it contacts. Other appropriate
materials may alternatively or
additionally be used.
[0066] As described above, some variations of devices described here may
comprise one or more
membranes. In some cases, a membrane may comprise a colorimetric membrane. For
example, the
18
CA 02778773 2012-04-24
WO 2011/008581 PCT/US2010/040845
membrane may be used to wick small volumes of sweat from a skin surface, to
provide a matrix for
one or more reagents that are to come into contact with the collected sweat,
and/or to allow for optical
measurement of color. Additionally or alternatively, as described above, a
spreading layer or porous
layer may be used to wick small volumes of sweat from a skin surface and
transfer it through capillary
action to the membrane.
[0067] A colorimetric membrane may comprise any of a variety of different
materials. The
selected materials may depend on a number of factors, such as the sample
volume required for testing,
color development, wicking action, optical properties, and desired shelf life.
Examples of materials
that may be appropriate include charged nylon membranes (e.g., from General
Electric Company and
Pall Corporation), polysulfone membranes (e.g., HT Tuffryn Polysulfone
Membrane Disc Filters
from Pall Corporation), nitrocellulose membranes (e.g., from Sartorius AG),
and the like.
[0068] In some variations, the material or materials that are used in a
colorimetric membrane may
be selected based on the reagent(s) that are used to detect the target
analyte(s). Alternatively or
additionally, the material(s) may be selected based on one or more indicator
dyes that may be added
to the colorimetric membrane. As an example, a membrane material may be
selected based on its
ability to retain certain reagent(s) and/or indicator dye(s). In some
variations, a reagent may be fixedly
cross-linked to the membrane material. For example, in some variations, an
enzyme reagent may be
immobilized using glutaraldehyde. Alternatively or additionally, a
colorimetric membrane may
comprise a reagent that is not fixedly cross-linked to the membrane, such that
the reagent is mobile. In
certain variations, membrane materials, as well as reagents and/or indicator
dyes, may be selected
based on their non-toxicity and safety for human contact.
[0069] As shown above, in some variations, a test strip membrane, and/or any
other test strip
components, may be porous. Porous membranes may comprise pores of a relatively
uniform size, or
may comprise pores of different sizes. In certain variations, a porous
membrane may include pores
having a size of about 0.2 micron to about 5 microns (e.g., about 0.45 micron
to about 3 microns,
about 0.65 micron to about 1.2 microns, 0.8 micron to about 1.2 microns). For
example, a pore may
19
CA 02778773 2012-04-24
WO 2011/008581 PCT/US2010/040845
have a size of about 0.2 micron, about 0.45 micron, about 0.65 micron, about
0.8 micron, about 1.2
microns, about 3 microns, or about 5 microns. In some variations, a porous
membrane may have at
least two different regions having different average pore sizes. For example,
one side of a porous
membrane may have an average pore size of about 0.2 micron, while an opposite
side of the porous
membrane may have an average pore size of about 20 microns.
[0070] A test strip may comprise one membrane or a combination of membranes,
including, for
example, any of the membranes described here. Any material having any suitable
pore distribution
(e.g., a pore distribution that promotes efficient unidirectional fluid flow)
may be used in a test strip.
[0071] As discussed above, in some variations, a colorimetric membrane may
comprise one or
more reagents that are selected to react with one or more specific analytes to
produce a certain color
or colors. For example, in cases in which sweat glucose concentration is being
evaluated, a
colorimetric membrane may comprise one or more reagents that are selected to
provide optimal
performance in the range of expected sweat glucose concentrations. A
colorimetric membrane may
comprise, for example, any suitable combination of enzymes, dyes, and/or
additives for detecting a
target analyte or analytes.
[0072] As an example, some variations of colorimetric membranes for evaluating
sweat glucose
concentration (and blood glucose concentration therefrom) may comprise one or
more reagents that
react with glucose to cause a detectable color change. For example, a reagent
may comprise a
component (e.g., glucose oxidase) that converts glucose to hydrogen peroxide,
as well as one or more
components that detect the resulting hydrogen peroxide. An example of such a
hydrogen peroxide-
detecting component is a peroxidase (e.g., horseradish peroxidase) acting in
conjunction with an
indicator that changes color in the course of the reaction. The indicator may,
for example, be an
oxidizable dye or a dye couple. In some variations, the indicator may comprise
meta [3-methyl-2-
benzothiazolinone] N-sulfonyl benzenesulfonate monosodium combined with 8-
anilino-l-naphthalene
sulfonic acid ammonium (MBTHSB-ANS). The peroxidase may catalyze the oxidation
of the
indicator in the presence of hydrogen peroxide.
CA 02778773 2012-04-24
WO 2011/008581 PCT/US2010/040845
[0073] In certain variations in which a specific analyte is being detected,
the reagent may be
selected for optimal use with certain concentration ranges of that analyte.
For example, in the case of
glucose, the reagent may be optimized for measurement of sweat glucose
concentrations in the range
of 0.1 mg/dL to 10 mg/dL (e.g., 0.5 mg/dL to 10 mg/dL, 0.5 mg/dL to 4 mg/dL).
Additionally, the
shelf life of a reagent may, for example, be from about 6 months to about 2
years.
[0074] In certain variations, one or more reagents may be coated onto a
colorimetric membrane.
This may, for example, result in maximized color development while requiring
application of only a
minimal sample volume of sweat.
B. Methods of Making Test Strips
[0075] Test strips or other testing substrates may be made using any
appropriate method.
Typically, a test strip may be designed so that it is easy to use and/or
manufacture. In certain
variations, a test strip may comprise a colorimetric membrane mounted on a
holder. A test strip may
be designed both to position a colorimetric membrane close to a skin surface
during use, and to
register the colorimetric membrane with regard to a reading device (e.g., an
optical device) when the
color is read.
[0076] FIG. 4 illustrates one variation of a method (420) that may be used to
make test strips, such
as the test strips described above. As shown there, method (420) comprises
cleaning and preparing a
base layer or substrate for subsequent layer deposition (400). Next, the base
layer is coated with a first
solution on one side, to form a reactive layer (402). Excess solution is then
removed (e.g., by washing
or physical abrasion, or with a glass rod) (404). The base layer with the
deposited reactive layer is
dried, such as by air-drying (406). An oven or otherwise elevated desiccating
environment may be
used to expedite the drying time. Next, a second solution, such as the
material for the spreading layer,
is applied on top of the first coating (408). Excess solution is again removed
(e.g., with a glass rod)
(410) and the base membrane is again dried (e.g., by air-drying) (412), as
previously described.
Additional layers may be applied by repeating the above method. When all
desired layers have been
21
CA 02778773 2012-04-24
WO 2011/008581 PCT/US2010/040845
applied, the test strip may optionally be packaged (e.g., to preserve
cleanliness and for shipping).
While FIG. 4 depicts one variation of a method of making a test strip, this
method variation is only
exemplary, and other appropriate methods may also be used.
C. Test Well Array
[0077] In some variations, the sample may be collected and tested using an
array of wells or
chambers. A top view of an example of a test well array (500) is shown in FIG.
5A. Each well (510)
may be able to accumulate a volume of sample of about 1 nL to about 10 nL,
such as 5 nL. For
example, each well (510) may be able to accumulate a single sweat bolus for
testing. Test well array
(500) may be an nl by ml matrix of wells, where nl may be, for example, about
200 to about 500
wells, and ml may be, for example, about 200 to about 500 wells, and in some
variations, nl is equal
to ml for a square array. The length L8 of test well array (500) may be about
0.5 cm to about 1.5 cm
(e.g., 1.0 cm), and the width W3 may be, for example, about 0.5 cm to about
1.5 cm (e.g., 1.0 cm).
Referring to FIG. 5B (top view), each well (510) may have a depth of about 20
microns to about 30
microns, a length L10 of about 400 microns to about 500 microns, and/or a
width W5 of about 400
microns to about 500 microns. Of course, these are exemplary dimensions, and
other suitable
dimensions may also be used.
[0078] Referring again to FIG. 513, each well (510) may have an array of posts
(512), where the
array of posts (512) may occupy about 25% of the well volume. The array of
posts (512) may be an
n2 by m2 matrix of posts, where n2 is about 5 to about 20, and m2 is about 5
to about 20. The array of
posts may also have a length L9 of, for example, about 50 microns to about 150
microns (e.g., 100
microns) and a width W4 of, for example, about 50 microns to about 150 microns
(e.g., 100 microns).
As shown in FIG. 5C, each post (512) may have a diameter Dl of, for example,
about 15 microns to
about 35 microns (e.g., 25 microns), and may be spaced PI apart, where PI is,
for example, about 15
microns to about 35 microns (e.g., 25 microns). Each post (512) may have a
height of, for example,
22
CA 02778773 2012-04-24
WO 2011/008581 PCT/US2010/040845
about 40 microns. Once again, it should be understood that all of these
dimensions are only
exemplary, and other appropriate dimensions may be used.
[0079] There may be any number of posts (512) arranged in an array; for
example, there may be
4, 9, 16, 25, 49, 64, or 100 posts. FIG. 5C is a top view of posts (512), and
shows that the posts are
generally circular in cross-section, however, posts (512) may have any
suitable shape, such as a
rectangular, or triangular cross-sectional shape, or the like. Posts (512) may
be solid, or may comprise
a lumen in at least a portion of the post. The interior of wells (510) and
posts (512) may be coated
(e.g., by cross-linking) with a detection reagent, such as a primary binding
agent and/or enzyme
binding agent, such as reagents commonly used in an enzyme-linked
immunoabsorbent assay
(ELISA). For example, the interior of the wells and/or the surfaces of the
posts may be bound to
chemicals that are capable of reacting with the glucose in sweat. In some
variations, the top of each
post (512) may be coated with a glucose detection reagent to ensure that the
reagent is fully exposed
to the applied sample.
[0080] Optionally, test well array (500) may also comprise a hydrophilic
porous membrane to
wick secreted sweat into well (510). FIG. 6A depicts a cross-sectional view of
a portion of a well wall
(600) taken at section 6A-6A in FIG. 5B. As shown there, well wall (600)
comprises a wicking layer
(606), a photoresist layer (604), and a support layer (602). Support layer
(602) may be a microporous
hydrophobic substrate which passes air but not liquid, for example. The pores
in support layer (602)
may be about 10 microns to about 40 microns in size (e.g., 20 microns). As
shown in FIG. 6A,
support layer (602) has a thickness t 12 . In some variations, t 12 may be
about 150 microns to about
300 microns. Photoresist layer (604) may be any suitable material, such as SU-
8, EPON SU-8,
Lithographic Galvanoformung Abformung (LIGA), poly-methyl methacrylate (PMMA),
polymethylglutarimide (PMGI), other photoresistive epoxy resins, and any
positive or negative
photoresistive material that can be etched to form structures with an aspect
ratio of about 20 or more.
The photoresist layer has a thickness t13, where t13 may be, for example,
about 20 microns to about 40
microns. Wicking layer (606) may be a microporous hydrophilic membrane, such
as NucleporeTM
23
CA 02778773 2012-04-24
WO 2011/008581 PCT/US2010/040845
and may be placed over photoresist layer (604) to wick secreted sweat into the
chambers/wells and to
react with the chemistry bound to the interior surfaces of the chamber/wells.
Membrane materials are
also described, for example, in U.S. Patent Application Serial Nos. 11/159,587
(published as US
2006/0004271 Al) and 11/451,738 (published as US 2007/00273 83 Al), both of
which were
previously incorporated herein by reference in their entirety. Wicking layer
(606) has a thickness t1 4,
where t14 may be, for example, about 5 microns to about 50 microns.
[0081] A testing device including the above-described structures and features
may enable the
measurement of glucose from the secretion of a single sweat gland anywhere on
the skin. As a result,
the testing device may allow for completion of a sweat glucose test within a
few seconds. In one
variation of the above described well array, a sweat bolus may be secreted
onto the hydrophilic
wicking layer, where the pores draw the sweat bolus into one of the
chambers/wells. The sweat bolus
may then react with the chemistry that was previously adsorbed into the
chamber. In some variations,
the chemistry may be any enzyme for glucose detection, and may be capable of
changing color to
indicate the quantity of glucose in the sample. In certain variations, the
chemistry applied in the
interior of the chamber may be a reagent used in an ELISA. Once the ELISA is
completed in the
chamber, an optical system may view each chamber in the array of chambers, and
may detect any
color changes in each of the chambers. The collected optical data may then be
used to determine the
quantity of glucose in the sweat bolus by downstream processing (e.g., using
an external or embedded
computing device), which may be recorded and/or reported to the subject.
D. Method of Making Test Well Array
[0082] Test well array (500) may be made using any suitable technique, for
example, using
photolithography methods, such as the method (620) shown in FIG. 6B. Method
(620) is one possible
photolithography method that may be used to form test well array (500), and
other photolithography
methods, using different photoresists (e.g., EPON SU-8 epoxy resin, LIGA,
PMMA, etc.) with
different etch techniques (e.g., different chemicals, for varying quantities
of time) may be used as
appropriate. As shown in FIG. 6B, method (620) comprises preparing a support
layer for application
24
CA 02778773 2012-04-24
WO 2011/008581 PCT/US2010/040845
of a photoresist (622). The support layer may be any rigid, hydrophilic,
microporous material, as
described previously. The surface of the support layer may be treated to
promote adhesion of
photoresist. Next, SU-8 photoresist may be spun onto the support layer to a
thickness t12, as described
above (624). Then, the photoresist may be patterned with a mask in order to
obtain the structures
depicted in FIGS. 5A-5C (626). After light in the UV range has been applied to
the photoresist, the
photoresist may be etched, for example using H2SO4 or any other appropriate
chemical reagent (628).
The etch time may vary depending on the desired depth of the well and height
of posts (e.g., FIG. 5B).
The patterned photoresist and support layer may then be partially baked (630).
The detection reagent
(e.g., enzyme/chemical linked with an optically detectable molecule or any
ELISA reagent for
glucose) may be adsorbed into the interior of the patterned chambers (632). A
wicking layer, such as
NucleporeTM, may be applied over the photoresist (634), and all layers may be
baked (636). In some
variations, the detection reagent may be applied after the final bake (636),
especially if reagent
reactivity may be affected by the final bake. After the final bake (636), any
detection reagent that may
be on the wicking layer may be removed. Alternatively, the patterned
photoresist and support
structure may be completely baked after etching (628). After the complete
bake, the detection reagent
may be applied to the interior of the chambers and dried. The wicking layer
may then be applied to
the patterned photoresist by electrostatic attraction and/or a vapor adhesive
applied to the bottom
surface of the wicking layer. The application of the detection reagent to the
interior of the chambers
may take place before, after, or in addition to any of the steps of method
(620), as suitable for
preserving the reactivity of the detection reagent.
[0083] In other variations, an array of chambers may be formed by crushing or
micro-embossing
crushed and uncrushed regions into a colorimetric membrane that is reactive to
glucose in a sweat
bolus. Other appropriate methods may also be used.
E. Measurement Devices
[0084] In a method that includes collecting sweat for glucose concentration
analysis, once the
glucose in the collected sweat has reacted with the reagent or reagents in the
colorimetric membrane,
CA 02778773 2012-04-24
WO 2011/008581 PCT/US2010/040845
any of a variety of different devices and methods may be used to measure the
resulting color. In some
variations, an optical system may be used to read the color of the membrane,
and to correlate the
reading to blood glucose concentration. The optical system may, for example,
be relatively precise,
easy to use, and/or inexpensive. The particular optical system that is
employed may depend, for
example, on the dye or dyes that are used, and/or on the pattern of color
development in the
membrane. In some variations, the optical system will measure one or more
optical properties of the
test strip, such as reflective, transmissive, absorptive, or emission
properties of the membrane of the
test strip. Each of these properties may require specific forms of optical
illumination and detectors.
[0085] In certain variations, the optical system may comprise a light-tight
chamber that is
configured to retain the test strip. In some variations, the test strip may be
manually placed in the
chamber. In other variations, a test strip-dispensing mechanism may be
integral with the optical
system, thereby eliminating the need for any manual intervention. Within the
light-tight chamber, the
test strip may be positioned (e.g., manually, mechanically, or electrically)
so that the region of interest
(e.g., a test region containing the sample) is accessible for optical probing.
[0086] Optical data obtained from the test strip may be used in a number of
ways. For example,
optical data may be used to determine whether a sufficient quantity of fluid
(e.g., sweat) is present for
accurate testing, and/or may be used to analyze the quantity and/or
concentration of a target analyte.
[0087] Reflectance and transmission readings at single or multiple wavelengths
in both the visible
and non-visible ranges may be employed. In some variations, fluorescent
indicators may be used. In
certain variations, relatively simple reflectance measurements may be made
using any of a variety of
light sources, such as single or multiple light-emitting diodes (LEDs),
lasers, and/or laser diodes.
Illumination may be at a specific wavelength or wavelengths, or may
incorporate a broad range of
wavelengths (e.g., depending on the indicator dye that is used in the
colorimetric membrane). For
example, certain light-emitting indicators (e.g., fluorescent indicators) may
emit a stronger light signal
if excited by light within a particular range of wavelengths. Some variations
of optical systems may
illuminate using monochromatic light, or may incorporate a filter that selects
for the range(s) of
26
CA 02778773 2012-04-24
WO 2011/008581 PCT/US2010/040845
wavelength light (e.g., bandpass, low pass, or high pass filters). The
characteristics of the light that is
used to illuminate the test strip (e.g., wavelength, intensity, exposure time)
preferably are such that the
dye provides reliable emissions, but does not bleach the dye indicator.
[0088] The light emitted or reflected by a dye indicator may be detected by
one or more sensors
configured to capture light of the emission or reflected wavelength. For
example, the light emitted
and/or reflected by the indicator may be detected by one or multiple
photodiodes, where the
photodiodes may be tuned to detect a narrow or broad band of wavelengths.
Reflectance data (e.g.,
color data) may be obtained by at least one photodiode, as appropriate. In
some variations, a wide
spectrum light may be used to illuminate the membrane, and light emitted or
reflected from the dye
indicator may be detected by a charge-coupled device (CCD) or CMOS-based
detector. For example,
the emitted or reflected light may be detected by a CMOS-based camera or any
digital camera which
images the membrane on a pixel-by-pixel basis. Alternatively or additionally,
the light may be
captured on a photographic medium, such as light-sensitive film, or using a
reflection densitometer.
The image may be monochromatic, or may incorporate light of a range of
wavelengths. In other
variations, the light emitted and/or reflected from the colorimetric membrane
may be recorded over a
period of time, in preprogrammed intervals (e.g., using a video camera). The
color of the test strip can
be measured while the colorimetric membrane is reacting with the sample and
changing color (on-
meter dosing), or after the colorimetric membrane has completed the color
change (off-meter dosing).
Time-lapsed image recording may provide additional data that may be used to
evaluate the fluid
sample, for example, to estimate the sweat rate by monitoring the appearance
of colored spots, and
may be used to signal whether sufficient sample has been collected (e.g., to
signal insufficient or
excessive sample volume). Monitoring the appearance of the colored spots
(e.g., timing and location)
may be used as criteria to distinguish between sweat-derived glucose, and
glucose from other sources
that do not change rapidly with time.
[0089] The detector or detectors may acquire an image of a substantial portion
of the test region,
or may acquire an image of a small portion of the test region (e.g., a single
pixel). When a focal light
27
CA 02778773 2012-04-24
WO 2011/008581 PCT/US2010/040845
source is used to image the test strip, such as a laser or pin hole light
source, the light beam may be
scanned across the test region to generate a full image, or the test strip may
be mechanically scanned
through the light beam to generate a full image. The scanning procedure may be
pre-programmed
and/or automated, or may be manual, and subject to real-time adjustment by the
user. The scan speed
may be selected to achieve a certain resolution suitable for adequately
precise analyte detection, and
may be adjusted to reduce photo-bleaching and to acquire the image before
substantial dye indicator
migration. The image data acquired by the detector or detectors may be
transmitted and/or stored for
processing and analysis, or may be processed in real-time, as described below.
[0090] Various optical components may be included to focus light onto the test
strip and/or
detectors. For example, one or more lenses, mirrors, and/or filters may be
employed to direct the path
of illuminating and/or emitted light. The optical system and its constituent
components may be
configured for the illumination and detection of sub-millimeter features. For
example, the optical
system may be tuned to examine the concentration of an analyte (e.g., glucose)
in a sample volume of
less than one microliter, where the colored indicator may be on the order of
tens or hundreds of
microns. Focal light sources, such as lasers, may be suitable for the
detection and measurement of
sub-millimeter and sub-micron test strip features. The light source, optical
components, and detectors
may be calibrated as needed to ensure consistently precise measurements for
both microliter and
nanoliter sample sizes. In some optical systems, calibration may take place at
programmed time
intervals, or may be initiated by the user.
[0091] In certain variations of optical systems, the optical transmission
property of the test region
may be evaluated. For instance, the optical density of a test region may be
measured using a variety of
instruments, such as transmission densitometers, infrared transducers and
receivers, where some
instruments use a scanning optical arrangement and/or others use a fixed
optical arrangement. In some
optical systems, light emitted from each region of the test strip may be
detected by a different
detector, and the data may be combined in post-processing and analysis to form
a complete image. To
this end, the membrane may be scanned, in much the same way as electrophoresis
gels are scanned,
28
CA 02778773 2012-04-24
WO 2011/008581 PCT/US2010/040845
with the optical density of the colored portions analyzed and the transmission
property correlated to
glucose concentrations. The optical transmission data from the instrument may
be transmitted and/or
stored for processing and analysis, as described below.
[0092] Optical data collected from a test strip may be stored in a memory
buffer, or in an external
memory resource (e.g., flash drive, CD/DVD, magnetic tape, etc.) for post-
processing. In some cases,
the data may contain multiple wavelength lengths (e.g., dichromatic or
trichromatic), or may be
monochromatic. Monochromatic data may be analyzed for intensity, where the
intensity may be
denoted as an eight bit value (0 to 255, where 0 is absolute darkness and 255
is maximum brightness).
Individual wavelengths of light may be extracted from wide spectrum light, and
the intensity of each
channel (e.g., red, green, and blue) may be analyzed similarly.
[0093] The optical data collected from a test strip may be mapped against a
standardized curve or
plot that correlates that optical property with the concentration of the
analyte. Alternatively or
additionally, the optical data collected may be compared with a calibration
curve that is obtained prior
to analyzing the test sample. For example, the glucose concentration in a
sweat sample may be
determined based on the optical density of a single wavelength channel
extracted from a composite
image. In some variations, the glucose concentration may be directly related
to the image data. For
example, the intensity value per pixel may be correlated to the analyte
concentration in the fluid
sample. As an example, the intensity value of a given pixel may be
proportional to the concentration
of glucose in a sweat sample. Alternatively, the intensity value of a given
pixel may be proportional to
the quantity of the glucose in a sweat sample. Experiments and examples of
optical detection
techniques used to detect the concentration of glucose in sweat are provided
and described below.
[0094] FIG. 7 illustrates a meter (700) that may be used to measure the
concentration of glucose in
a sample of sweat collected by a test strip. As shown in FIG. 7, meter (700)
comprises an optical
window (702), a power switch (704), and a display (706). The colorimetric
membrane of a test strip
containing a fluid sample therein may be placed on top of optical window
(702), such that the
colorimetric membrane is sufficiently presented to the optical system embedded
in meter (700). To
29
CA 02778773 2012-04-24
WO 2011/008581 PCT/US2010/040845
ensure adequate contact between the test strip and optical window (702), the
user may place a
fingertip on top of the test strip to press it into the optical window, and to
transfer sample to the
colorimetric membrane in the test strip. In some variations, meter (700) may
comprise a pressure
sensor that informs the user whether sufficient pressure has been applied to
obtain an adequate
quantity of sweat. After a period of time (e.g., about 20 seconds) has passed,
meter (700) may detect
spot formation on the colorimetric membrane, and may notify the user (e.g.,
via a visible or audible
signal, such as an audible beep) that his or her finger may be removed from
the membrane. The meter
may measure the color of the colored region or regions (e.g., spots) on the
colorimetric membrane
either while the finger is in contact with the membrane, or when the finger is
no longer in contact with
the membrane, and may thereby determine the glucose concentration in the sweat
that caused the
colored region or regions to form. The meter may then use a built-in algorithm
to correlate the sweat
glucose concentration to blood glucose concentration, and may report the
resulting blood glucose
concentration value to the user. The user may then remove and dispose of the
test strip.
[0095] Alternatively, sweat may be applied to the test strip before the test
strip is inserted into the
meter. In this variation, spot formation on the colorimetric membrane may be
measured after the
user's finger has been removed from the membrane. Of course, while the
concentration of glucose in a
sweat sample is discussed here, it should be understood that any of the
devices, methods, and/or kits
described here may be used to detect other analytes, and/or may be used to
evaluate other types of
fluid samples, as appropriate.
[0096] Some variations of a meter may also comprise an embedded optical
system, configured to
interface with a test strip inserted into the meter. In certain variations,
the interface between the
embedded optical system may include components that provide illumination of
the test strip, and
detect light emitted from the test strip. Examples of such components have
been described above.
[0097] During use, a colorimetric test strip may be optically interrogated to
determine the quantity
(e.g., volume, concentration) of glucose in the sweat sample. This value may
then be presented to the
user on display (706). Display (706) may also prompt the user to take specific
actions based on the
CA 02778773 2012-04-24
WO 2011/008581 PCT/US2010/040845
glucose concentration in the sweat sample. For example, the user may be
prompted to eat certain
foods to increase blood glucose, or to take insulin to reduce blood glucose.
After the glucose reading
is completed, the test strip may be removed from the meter and disposed.
[0098] In some variations, an access port may be used, either as an
alternative to, or in addition to,
an optical window. The access port may allow for substantial contact of a
fingertip to a colorimetric
membrane contained in the meter. In such variations, the colorimetric membrane
may be in the form
of a spool that is turned as each test is conducted, where one spool
accumulates used colorimetric
membrane material, while another spool retains new colorimetric membrane
materials. The access
port would allow for unobstructed contact between a skin surface and the
reactive layer.
[0099] As discussed above, in some variations, a meter or measurement device
may include one
or more algorithms to convert a sweat glucose concentration value to a blood
glucose concentration
value. For example, the meter or measurement device may comprise computer-
executable code
containing a calibration algorithm, which may be used to relate measured
values of detected glucose
to blood glucose values. In some variations, the algorithm may be a multi-
point algorithm, which is
typically valid for about 30 days or longer. The algorithm may necessitate
multiple capillary blood
glucose measurements (e.g., blood sticks) with simultaneous test strip
measurements over about a
one-hour to about a three-day period. This could be accomplished using a
separate dedicated blood
glucose meter provided with a glucose measurement device described herein,
which comprises a
wireless (or other suitable) link to the glucose measurement device. In this
way, an automated data
transfer procedure may be established, and user errors in data input may be
minimized.
[0100] Once a statistically significant number of paired data points has been
acquired having a
sufficient range of values (e.g., covering changes in blood glucose of about
100 mg/dL), a calibration
curve may be generated to relate the measured sweat glucose to blood glucose.
Subjects (e.g.,
patients) may perform periodic calibrations checks with single blood glucose
measurements, or total
recalibrations as desirable or necessary.
31
CA 02778773 2012-04-24
WO 2011/008581 PCT/US2010/040845
[0101] Certain variations of glucose measurement devices may also comprise a
memory for
saving readings and the like. Additionally, glucose measurement devices may
comprise a processor
configured to access the memory and execute computer-executable code stored
therein. It should be
understood that glucose measurement devices may include other hardware such as
an application
specific integrated circuit (ASIC). In addition, glucose measurement devices
may include a link
(wireless, cable, or the like) to a computer. In this way, stored data may be
transferred from a glucose
measurement device to a computer for later analysis, etc. Alternatively or
additionally, glucose
measurement devices may include an interface that is compatible with a mobile
device, such as a
BlackberryTM or iPhoneTM or iPodTM mobile device, where sweat glucose
measurements may be
recorded and optionally uploaded to a website or remote server in real-time.
The sweat glucose data
may be analyzed to determine trends in a subject's glucose levels, as well as
develop predictive
models to aid in glucose management. Trends and models of glucose levels as a
function of any
variable (i.e., time, disease progression, behavior, caloric intake, etc.) may
be displayed on the
website that is accessible to a medical professional monitoring the health of
the subject and the
subject. Glucose measurement devices may also comprise various buttons to
control the various
functions of the devices and to power the devices on and off when necessary.
Methods of Measuring Analyte Concentration
[0102] As discussed above, test strips and related devices described here may
be used to measure
the concentration of glucose in sweat. A test strip comprising a porous
membrane such as one of those
described above may be used, for example, to collect sweat from the skin
surface of a diabetic patient.
The test strip may then be evaluated to estimate the blood glucose level of
the diabetic patient using
the collected sweat. During use, as the sweat enters the pores, one or more
analytes in the sweat may
react with one or more reagents in the membrane, thereby causing a color to
form in the membrane.
The color in the membrane may be measured and correlated to glucose
concentration in the sweat.
The sweat glucose concentration may then be correlated to glucose
concentration in whole blood.
Hence, methods described here may be used as a substitute for traditional
blood glucose monitoring,
32
CA 02778773 2012-04-24
WO 2011/008581 PCT/US2010/040845
where samples of blood are obtained by way of a fingerstick. One variation of
a non-invasive method
(820) is depicted in FIG. 8.
[0103] As shown in FIG. 8, first the subject optionally may clean an area of
skin to remove
residual glucose present at the skin surface (800). Exemplary wipes that may
be used are described,
for example, in U.S. Patent Application Serial No. 10/358,880 (published as US
2003/0176775 Al),
the disclosure of which is hereby incorporated by reference in its entirety.
For example, the subject
may use one or more wipes impregnated with a cleanser that does not interfere
with glucose detection
and/or a surfactant (e.g., sodium lauryl sulfate (SLS)) that modifies one or
more properties of the
sweat and/or the skin surface. In some variations, the wipes may contain one
or more chemical
markers that are identifiable (e.g., using a measurement device) to confirm
that the skin was wiped
before the sweat was collected by the test strip. Alternatively or
additionally, the subject may wipe the
skin surface with ethanol to remove unwanted substances from the skin surface.
Other sterilization
techniques may also be employed to remove substances that may cause an
erroneous reading by the
test strip or meter.
[0104] Next, the subject may hold the test strip against a skin surface (802).
While it may not be
necessary to do so, in some variations, the subject may attach the test strip
to the skin surface. The test
strip may be attached to a skin surface in any of a number of different ways.
In some variations, the
subject may remove a release liner from a bottom surface of the test strip to
expose a pressure-
sensitive adhesive that may adhere to the skin. Alternatively or additionally,
other adhesives (e.g.,
heat-sensitive or soluble adhesives) may be used. In certain variations, the
test strip may be positioned
using an elastic band configured to hold the test strip in place. In some
variations, the subject may
tape the test strip to a skin surface (e.g., using medical tape), and/or may
hold the test strip to a skin
surface. In certain variations, the test strip may be held in place on the
skin using a "watch-like"
device. In other variations, the test strip may be retained within the meter,
where the meter comprises
an access port. The subject may contact a portion of skin (e.g., a finger tip)
to the test strip by placing
33
CA 02778773 2012-04-24
WO 2011/008581 PCT/US2010/040845
the finger through the access port and pressing against the test strip.
Alternatively, the membrane
portion of the test strip may protrude from the meter to ensure sufficient
contact with a subject's skin.
[0105] The subject's skin surface may be engaged with the test strip for a
period of time so that a
sufficient quantity of sweat is collected (804). The meter may employ optical
means (such as those
described previously) to determine the volume of sweat collected. A program or
algorithm may
determine whether the collected volume is sufficient, and indicate an
instruction to the subject to
maintain contact with the test strip, or disengage from the test strip. In
some variations, skin may be
engaged with a test strip for a pre-determined amount of time that has been
shown to be sufficiently
long to collect a testable quantity of sweat. For example, the subject may
contact his/her skin to the
test strip for a period of about 2 seconds to about 30 seconds. In some
variations, the subject may
contact his/her skin to the test strip for about 1 minute to about 30 minutes.
Alternatively or
additionally, a colorimetric test strip may comprise a dye indicator that
changes its optical qualities
(e.g., changes color and/or opacity) to signal that a sufficient quantity of
sweat sample has been
collected. The optical change may be detected by an optical system, or by
visual inspection.
[0106] Once the test strip has collected a sufficient volume of sweat, the
subject may disengage
from the test strip (806) and use a measurement device (e.g., a meter) to
interrogate the test strip and
quantitatively measure the sweat glucose concentration (808). In some
variations, the test strip may be
removed from the skin and inserted into, or otherwise contacted with, the
measurement device (for
example, as shown in FIG. 7). In other variations, the measurement device
measures the sweat
glucose concentration (808) while the test strip is in contact with the
subject's skin. Alternatively or
additionally, the glucose measurement device may be placed in contact with the
test strip (for
example, via an optical port as shown in FIG. 7). In variations in which the
test strip is retained in the
meter, the meter may directly interrogate the membrane of the test strip by
measuring chemical,
electrical, or optical signals. For colorimetric test strips, an optical
system as described previously
may be used.
34
CA 02778773 2012-04-24
WO 2011/008581 PCT/US2010/040845
[0107] During interrogation (808), the sweat glucose concentration may be
obtained, and if so
desired, may then be used to derive a blood glucose concentration. The
concentration of other analytes
may also be determined, as enabled by the colorimetric membrane of the test
strip. The concentration
of the target analyte(s) may be output to the patient (810) using, for
example, a display and/or sound
speaker. Optionally, the measurement device may also issue instructions to the
subject based on the
concentration of the target analyte(s), where the instructions are pre-
programmed by a physician or
healthcare professional. The subject may respond to the test result (812). For
example, based on the
sweat glucose concentration and/or blood glucose concentration, the subject
may be instructed to self-
administer insulin. Once the testing is completed, the subject may remove the
test strip from the
measurement device and dispose of the test strip (814). In some variations
where the test strip is
retained by the measurement device, the device may then advance the used test
strip and present an
unused test strip for the next test.
[0108] It should be noted that in some variations, method (820) may be
performed by someone
other than the subject (e.g., a medical/healthcare professional) on the
subject's behalf. Additionally,
the above description is directed to employing test strips to obtain a sweat
glucose concentration from
skin surface sweat. It should be understood that method steps may be removed
or added, and/or
repeated as appropriate.
[0109] In some variations, the devices, methods, and kits described here may
be configured for use
with measuring an analyte in a specific concentration range in a fluid sample.
For example, in certain
variations in which sweat glucose concentration is being evaluated, the
expected concentration range
may be from about 0.1 mg/dL to about 10 mg/dL (e.g., about 0.5 mg/dL to about
4 mg/dL).
Accordingly, the devices used to measure the sweat glucose concentration may
be designed or
otherwise configured to measure the concentration in that expected range. In
some variations, devices,
methods, and/or kits described here may be used to measure the concentration
of an analyte in a fluid
sample when the expected concentration is up to about 500 mg/dL (e.g., from
about 0.1 mg/dL to
about 500 mg/dL, from about 0.1 mg/dL to about 400 mg/dL, from about 0.1 mg/dL
to about 300
mg/dL, from about 0.1 mg/dL to about 200 mg/dL, from about 0.1 mg/dL to about
100 mg/dL, from
CA 02778773 2012-04-24
WO 2011/008581 PCT/US2010/040845
about 0.1 mg/dL to about 50 mg/dL, from about 0.1 mg/dL to about 10 mg/dL,
from about 0.1 mg/dL
to about 4 mg/dL, from about 0.5 mg/dL to about 500 mg/dL, from about 0.5
mg/dL to about 400
mg/dL, from about 0.5 mg/dL to about 300 mg/dL, from about 0.5 mg/dL to about
200 mg/dL, from
about 0.5 mg/dL to about 100 mg/dL, from about 0.5 mg/dL to about 50 mg/dL,
from about 0.5
mg/dL to about 10 mg/dL, from about 0.5 mg/dL to about 4 mg/dL, from about 50
mg/dL to about
500 mg/dL, from about 50 mg/dL to about 400 mg/dL, from about 50 mg/dL to
about 300 mg/dL,
from about 50 mg/dL to about 200 mg/dL, from about 50 mg/dL to about 100
mg/dL). The expected
concentration range of an analyte will likely depend, for example, on the type
of analyte and/or the
type of fluid sample involved.
[0110] While both detection of an analyte in a fluid sample and measurement of
the concentration
of the analyte in the fluid sample have been described, some variations of
methods may comprise
detecting an analyte in a fluid sample without also measuring the
concentration of the analyte in the
fluid sample. Additionally, while measurement of the concentration of an
analyte in a sweat sample
and correlation of the sweat concentration measurement to a blood
concentration measurement have
been described, certain variations of methods may comprise measuring the
concentration of an analyte
in a first fluid sample (e.g., sweat) without later correlating the
measurement to a concentration of the
analyte in a second, different fluid sample (e.g., blood). For example, a
diabetic may use a sweat
glucose concentration measurement to determine whether to administer insulin,
and therefore may not
need to convert the sweat glucose concentration value to a blood glucose
concentration value.
[0111] In certain variations, a relatively small sample of sweat may be
collected and evaluated.
This may be advantageous because, for example, it may result in a short
procedure time. Moreover, it
may allow relatively small test strips to be used. Such relatively small test
strips may, for example, be
easily transportable and/or inexpensive to produce.
[0112] In some variations, a test strip may be used to determine the
concentration of glucose in a
sample of sweat having a volume of about 220 picoliters to about 0.01
microliter (e.g., about 1
nanoliter to about 10 nanoliters, or about 0.00 1 microliter). The volume of
sweat collected may be
36
CA 02778773 2012-04-24
WO 2011/008581 PCT/US2010/040845
determined in part by the material composition and structure of the portion of
the test strip that
directly contacts the skin surface (e.g., the spreading layer, and/or the
membrane). Some test strip
membranes may have a structure and material composition configured to obtain
the volume of one,
and only one, sweat secretion of a given sweat gland. This may be achieved,
for example, using an
array of chambers where each chamber is capable of completing a measurement of
the glucose in a
sweat secretion and of retaining a given volume of a fluid sample (e.g., about
1 nanoliter of a sweat
sample). The reactive dye indicator in each chamber may be capable of
detecting the quantity of
glucose in that given volume of sweat. The concentration of glucose may be
determined by dividing
the quantity of glucose measured by the volume of sample collected. This
computation may be
completed for a single chamber, or for multiple chambers in an array.
Examples
[0113] The following examples are intended to be illustrative and not to be
limiting.
Example 1 - Evaluating Colorimetric Membranes from Test Strips
[0114] OneTouch SureStep test strips (from LifeScan, Inc.) were purchased
from pharmacies
and disassembled to obtain their colorimetric membranes. According to their
package inserts, the
colorimetric membranes included a reagent that reacts with glucose to cause a
detectable color
change.
[0115] Three different types of fluid samples were applied to the test regions
of the colorimetric
membranes removed from the test strips: (1) aqueous glucose solutions of known
concentration, (2)
contrived sweat (i.e., a solution of salt and glucose meant to simulate
sweat), and (3) sweat from
human subjects. The results of the glucose solution tests will be described in
Example 1, and the
results of the human sweat tests will be described in Example 2 below.
[0116] FIG. 9A shows that prior to contacting a fluid sample, colorimetric
membrane (910) had
certain optical properties (i.e., generally light in color and translucent). A
thin film of sucrose solution
37
CA 02778773 2012-04-24
WO 2011/008581 PCT/US2010/040845
was then applied to the finger tip and thumb of a subject, and colorimetric
membrane (910) was
squeezed between the finger tip and thumb for 30 seconds. After 30 seconds,
the optical properties of
colorimetric membrane (910) changed (i.e., turned blue and more opaque), as
shown in FIG. 9B.
[0117] This experiment suggests that the glucose in the sucrose solution on
the surface of the
finger and thumb quickly migrated into the pores of colorimetric membrane
(910), and that the
colorimetric membrane may be suitable for measuring the glucose concentration
of a thin film of
liquid sample on the surface of skin.
Example 2 - Evaluating Glucose Concentration in Sweat Excreted by a Sweat
Gland
[0118] A colorimetric membrane was obtained from a OneTouch SureStep test
strip (from
LifeScan, Inc.), and its ability to detect glucose in unstimulated sweat was
evaluated.
[0119] First, a finger tip and thumb of a subject were washed with soap and
water, and then wiped
with ethanol.
[0120] Next, a portion of the colorimetric membrane was squeezed between the
finger tip and
thumb of a subject. The process was repeated for additional colorimetric
membranes from
OneTouch SureStep test strips, varying the amount of squeezing time. The
time in which
colorimetric membrane (1000) was squeezed was varied.
[0121] FIG. 10A depicts a colorimetric membrane (1000) that was squeezed
between the finger tip
and thumb for 5 seconds. After squeezing colorimetric membrane (1000) for 5
seconds, sweat entered
the membrane and reacted with the reagent in the colorimetric membrane,
forming bright blue spots
(1002) corresponding to the locations where sweat glands deposited sweat onto
the colorimetric
membrane.
38
CA 02778773 2012-04-24
WO 2011/008581 PCT/US2010/040845
[0122] FIG. I OB depicts another colorimetric membrane (1004) after being
squeezed for 60
seconds. After 60 seconds, sufficient sweat had entered the colorimetric
membrane to turn the entire
surface blue.
[0123] FIGS. I OC and IOD depict an additional colorimetric membrane (1010),
where the top side
(where the average pore size was about 20 microns) was wrapped with a layer of
Parafilm , leaving
only the bottom side (where the average pore size was about 0.2 micron)
available for applying a test
sample.
[0124] Colorimetric membrane (1010) was relatively lightly contacted with a
skin surface, with
only enough pressure to ensure physical contact.
[0125] FIG. I OC shows that after 10 seconds of relatively light contact, blue
spots (1012) began to
appear, where the blue spots may have corresponded to individual sweat glands.
It is believed that the
intensity of spots such as these may be analyzed, for example, to determine
the glucose concentration
in the sweat secreted by a particular sweat gland.
[0126] FIG. IOD shows that after 30 minutes of relatively light contact, blue
streaks (1014) formed
in the shape of a fingerprint. It is believed that such a fingerprint may be
used to uniquely identify the
test result as belonging to a particular subject (e.g., thereby ensuring that
the data collected is
authentic).
[0127] FIGS. I OE-10H depict a colorimetric membrane (1020) where the top side
was sealed with
Parafilm , and the bottom side was contacted with a skin surface. Here,
colorimetric membrane
(1020) was squeezed between a finger tip and a thumb. The squeeze time was
varied (2 seconds, 5
seconds, 60 seconds, and 120 seconds) for each of the panels in FIGS. I OE-
IOH.
[0128] As shown in FIG. I OE, sweat secreted by individual sweat glands could
migrate into the
membrane and react with the reagent within 2 seconds. In FIG. I OE, each spot
(1022) corresponds to
an individual sweat gland.
39
CA 02778773 2012-04-24
WO 2011/008581 PCT/US2010/040845
[0129] Referring to FIG. I OF, after 5 seconds, more spots appeared, some
accompanied by a
diffuse distribution (1024) of dye.
[0130] By 60 seconds (FIG. I OG) and 120 seconds (FIG. I OH), the diffusive
dye effect was more
pronounced, and may have represented the migration of indicator dye, or the
oversaturation of the
colorimetric membrane. In post-processing, the diffuse dye staining may be
subtracted out to permit
analysis of spots (1022), each of which represents the sweat glucose signal
from a sweat gland.
Additionally, it is believed that contacting the colorimetric membrane to the
skin surface for about 2
seconds to about 10 seconds may prevent excessive indicator dye spreading, as
well as contamination
from other glucose sources. For example, sweat glucose may be distinguishable
from skin surface
glucose.
Example 3 - Evaluating Sensitivity of Colorimetric Membranes
[0131] Membranes were removed from OneTouch SureStep test strips (from
LifeScan, Inc.) as
described in Example 1 above, and mounted on a base, so that they could be fed
into an inkjet printer.
[0132] Inkjets and micropipettes were then used to dispense glucose solutions
onto the
membranes, and the color of the reacted membranes was measured.
[0133] FIGS. 11A-11C depict a colorimetric membrane (1100) from one of the
test strips. Small
quantities of a solution with a known glucose concentration were applied to
colorimetric membrane
(1100) with an inkjet printer. More specifically, using a commercially
available inkjet head (part
number 51612A, from Hewlett-Packard), a 5 mg/dL glucose solution was applied
onto the bottom
portion (where the pore size is about 0.2 micron) of colorimetric membrane
(1100). The
approximately 220 picoliter drops were dispensed such that they were
approximately 250 microns
apart (center to center spacing). The drops had volumes in the same order of
magnitude as the drops
that pulse out of sweat glands in the epidermal ridges of a finger. As
mentioned previously, it is
CA 02778773 2012-04-24
WO 2011/008581 PCT/US2010/040845
estimated that 1 nanoliter droplets are periodically excreted by sweat glands
in the epidermal ridges of
the fingers.
[0134] As seen in FIG. 11 A, which is an RGB (red-green-blue) composite image,
spots (1102)
formed at the location of glucose solution deposition. FIG. 11B is the red
video channel of the frame
illustrated in FIG. 11 A.
[0135] FIG. 11C depicts a group of spots (1103) from the image in FIG. 1 IB
that have been
selected and analyzed for grey scale intensity.
[0136] FIG. 1 ID is a plot of the grey scale intensity of the spots selected
in FIG. 11C as a function
of pixels. FIG. 11D shows that the grey scale intensity of a horizontal slice
through the row of spots
(1103) from FIG. 11C (where an intensity value of zero is absolute darkness,
and an intensity value of
255 is maximum brightness) varies by about plus or minus 2.5%. Grey scale
intensity might be a way
to measure the intensity of color development in the colorimetric membrane.
[0137] FIGS. 11A-1 ID suggest that a very small volume of 5 mg/dL glucose
solution may cause
measurable color change in a colorimetric membrane.
Example 4 - Calibrating Color Changes in a Test Strip to Glucose Concentration
[0138] Color changes in a colorimetric membrane may be calibrated to a glucose
concentration.
[0139] Six colorimetric membranes were obtained from a OneTouch SureStep
test strip as
described in Example 1.
[0140] A 5 microliter drop of glucose solution was applied to each test strip,
where the glucose
concentration was different for each strip (100, 50, 10, 5, 1, or 0 mg/dL of
glucose).
[0141] After developing the colorimetric membranes for about 2 minutes, a
camera module was
used to capture an image of the colorimetric membranes. The camera module was
IV-CCAM2, with a
41
CA 02778773 2012-04-24
WO 2011/008581 PCT/US2010/040845
normal lens, backlight compensation OFF, manual shutter at a speed of 1/60
second, and white
balance AWC calibrated against a white background. The colorimetric membranes
were illuminated
by a light source (Dolan-Jenner MI-150, quartz-halogen, 3200K, color
temperature, intensity 80% of
max, backlight compensation OFF), using a microscope (Optem). The light source
was applied with a
dual-arm fiber optic head without focusing lenses, where both fiber optic
heads shine into stack of two
inverted coffee filters with a hole punched in the center for optics.
[0142] The image for each of the six test strips was cropped in the center
(100x100 pixel patch).
[0143] The six cropped images were analyzed with the ImagJ program (NIH) for
optical density
(pixel value of zero for total darkness, and 255 for maximum brightness). A
profile with the six
cropped images (from an image with red, green and blue channels) is shown in
FIG. 11 E.
[0144] The red, green, and blue channels may be extracted and analyzed
separately. Thus, FIGS.
I I F-I I H show the red, green, and blue component (respectively) of the
composite profile in FIG.
11 E.
[0145] The optical density for each component was plotted against glucose
concentration, thereby
calibrating an optical change in the colorimetric membrane with glucose
concentration.
[0146] FIG. III plots the optical density of a horizontal line drawn through
each profile in FIGS.
I IF-I IH (optical density encoded by 8 bits, where zero is absolute darkness,
and 255 is maximum
brightness) vs. distance along the profile. As the concentration of glucose in
the solution varies across
the profile, the optical density of each channel also varies.
[0147] The plots from FIGS. 11F-I IH were used to derive the plots in FIGS.
11J-110, which plot
the relationship between the optical intensity of a single channel vs. glucose
concentration (or base 10
logarithm of glucose concentration).
[0148] A linear approximation was obtained for each channel, where the slope
of the best-fit line
indicates the sensitivity of that channel to glucose concentration. A larger
slope indicates that for a
42
CA 02778773 2012-04-24
WO 2011/008581 PCT/US2010/040845
given magnitude change in glucose concentration, a greater change in optical
density occurs to signal
that change. As shown, the red channel has the largest slope, while the blue
channel has the smallest
slope, which indicates that the red channel signals changes in glucose
concentrations with greater
sensitivity.
[0149] The sensitivity of each channel to glucose concentration is also shown
in histograms
depicted in FIGS. I IP-11R. To obtain these histograms, the number of pixels
of a particular optical
density in a profile of a single channel was counted.
[0150] FIG. I IP shows the image data for the red channel, where there are
clearly six peaks, with
each peak corresponding to one of the six test strips to which different
solutions with different glucose
concentrations were applied.
[0151] FIG. 11Q shows the image data for the green channel, where the six
peaks are evident,
corresponding to each of the six different glucose concentrations. However,
the separation between
the peaks centers around density values of about 150 and 160, and may be
difficult for an optical
algorithm to discern.
[0152] FIG. 11 R shows the image data for the blue channel, where only four
peaks are seen, which
indicates that the difference between optical densities for different glucose
concentrations may not be
sufficient here to map optical density to glucose concentration.
Kits
[0153] Also described here are kits. The kits may include one or more packaged
test strips, either
alone, or in combination with other test strips, one or more glucose
measurement devices, and/or
instructions. Typically the test strips may be individually packaged in
sterile containers or wrappings,
and may be configured for a single use. In some variations, multiple test
strips may be individually
sealed within one sterile container or wrapping. Additionally, some kits may
comprise multiple test
strips that test for the same analyte, and/or may comprise multiple test
strips that test for different
analytes.
43
CA 02778773 2012-04-24
WO 2011/008581 PCT/US2010/040845
[0154] While the devices, methods, and kits have been described in some detail
here by way of
illustration and example, such illustration and example is for purposes of
clarity of understanding
only. It will be readily apparent to those of ordinary skill in the art in
light of the teachings herein that
certain changes and modifications may be made thereto without departing from
the spirit and scope of
the described variations.
44