Note: Descriptions are shown in the official language in which they were submitted.
WO 2011/056836 PCT/US2010/055242
B B 1682 PCT
TITLE
GENETIC LOCI ASSOCIATED WITH RESISTANCE TO TROPICAL
RUST IN MAIZE
CROSS-REFERENCE TO RELATED APPLICATION
This application claims the benefit of U.S. Provisional Application No.
61/257,977, filed November 4, 2009, which is incorporated by reference in its
entirety.
FIELD OF THE INVENTION
The present disclosure relates to compositions and methods useful in
enhancing resistance to tropical rust in plants and methods to identify
allelic
variations associated with a trait of interest.
BACKGROUND OF THE INVENTION
Tropical rust is a fungal disease caused by the pathogen Physopella zeae
(Mains) Cummins & Ramachar (syn. Angiopsora zeae Mains), previously classified
as Angiopsora zeae Mains (Donald G. White, ed. 1999. Compendium of corn
diseases. Third edition. APS Press, ISBN 0-89054-234-1). Tropical rust can
spread
very rapidly, killing the plant in a short time.
Disease management strategies include crop rotation, destruction of old
maize residues by tillage, and fungicide application, all of which are aimed
at
reducing the fungal inoculum. However, the most effective and most preferred
method of control for tropical rust is the planting of resistant hybrids.
The methods of controlling tropical rust by reducing fungal inoculum require
additional time and resources on the part of the farmer, and in addition, can
have
detrimental effects on the environment. This makes the planting of resistant
hybrids
even more attractive to farmers and the general public. Thus, it is desirable
to
provide compositions and methods for identifying and selecting maize plants
with
enhanced resistance to tropical rust.
SUMMARY OF THE INVENTION
Compositions and methods for identifying and selecting maize plants with
enhanced resistance to tropical rust are provided. Also provided are methods
for
marker assisted selection of plants that have enhanced resistance to tropical
rust.
1
WO 2011/056836 PCT/US2010/055242
In one embodiment, methods for selecting maize plants or germplasm with
enhanced resistance to tropical rust by detecting the presence of at least one
allele
of a first marker locus that is linked to and associated with the "T" deletion
at
position 16 of PHMTR (SEQ ID NO:155) or the "GAG" haplotype at positions 337-
339 of reference sequence SEQ ID NO:167 and selecting the maize plants or
germplasm that comprise the at least one allele of a first marker locus that
is linked
to and associated with the "T" deletion at position 16 of PHMTR (SEQ ID
NO:155) or
the "GAG" haplotype at positions 337-339 of reference sequence SEQ ID NO: 167
are provided. The at least one allele of the first marker locus can be linked
to and
associated with the "T" deletion at position 16 of PHMTR (SEQ ID NO:155) or
the
"GAG" haplotype at positions 337-339 of reference sequence SEQ ID NO:167 by up
to 20 cM on a single meiosis map.
In another embodiment, methods for selecting maize plants or germplasm
with enhanced resistance to tropical rust by detecting the "T" deletion at
position 16
of PHMTR (SEQ ID NO:155) or the "GAG" haplotype at positions 337-339 of
reference sequence SEQ ID NO:167; and selecting the maize plants or germplasm
that comprise the "T" deletion at position 16 of PHMTR (SEQ ID NO:155) or the
"GAG" haplotype at positions 337-339 of reference sequence SEQ ID NO:167 are
provided.
In another embodiment, methods for identifying maize plants with enhanced
resistance to tropical rust by detecting a marker locus in the genome of the
maize
plant using the sequence of the marker locus, a portion of the sequence of the
marker locus, or a complement of the sequence of the marker locus, or of a
portion
thereof, as a marker probe, are provided. The marker probe hybridizes under
stringent conditions to the contiguous DNA between and including SEQ ID NO:89,
or a nucleotide sequence that is 95% identical to SEQ ID NO:89 based on the
Clustal V method of alignment, and SEQ ID NO:96, or a nucleotide sequence that
is
95% identical to SEQ ID NO:96 based on the Clustal V method of alignment, and
the marker locus comprises at least one allele that is associated with the
enhanced
resistance to tropical rust.
In another embodiment, methods for identifying maize plants with enhanced
resistance to tropical rust by detecting at least one marker allele associated
with the
enhanced resistance in the germplasm of the maize plant are provided. The
marker
2
WO 2011/056836 PCT/US2010/055242
locus can be selected from any of the following marker loci: PHM1192-26-U,
PHM1192-4-U, C00435-802-U, 000436-801-U, PHM187-7-U, 000423-801-U,
PHM5028-24-U, PHM13818-15-U, PHM15721-39-U, PHM15721-180-U, C00441-
801-U, C00441-802-U, PHM4370-19-U, PHM731-107-U, C00071-01-U, PHM8249-
21-U, C00428-801-U, PHM18427-13-U, PHM9535-10-U, PHM9535-6-U, PHM9535-
7-U, and PHM4003-13-U; the PHM markers PHM15590, PHM13818, PHM1192,
PHM187, PHM5028, PHM4370, PHM731, and PHM15721; Sub2e, Sub9d, Sub19c,
Sub23m, C06621-1-K2, and C06621-1-K4; as well as any other marker that is
linked
to these markers. The marker locus can also be found within any of the
following
intervals on chromosome 10 comprising and flanked by:
i. PHM15590 and PHM9535;
ii. PHM15590 and PHM15721;
iii. C00441 and C00428;
iv. PHM731 and PHM15721; and
v. C00071 and PHM731.
The marker locus comprises at least one allele that is associated with
enhanced
resistance to tropical rust.
In another embodiment, methods for identifying maize plants with enhanced
resistance to tropical rust by detecting a haplotype in the germplasm of the
maize
plant that is associated with enhanced resistance to tropical rust are
provided. The
haplotype comprises alleles at one or more marker loci, wherein the one or
more
marker loci are found within any of the following intervals on chromosome 10
comprising and flanked by:
i. PHM15590 and PHM9535;
ii. PHM15590 and PHM15721;
iii. C00441 and C00428;
iv. PHM731 and PHM15721; and
v. C00071 and PHM731.
The haplotype can comprise a "T" deletion at position 16 of PHMTR or "GAG"
at positions at 337-339 of reference sequence SEQ ID NO:167.
In another embodiment, methods of selecting maize plants with enhanced
resistance to tropical rust are provided. In this method, a first maize plant
is
obtained wherein the maize plant has at least one allele of a marker locus
that is
3
WO 2011/056836 PCT/US2010/055242
located within any of the following intervals on chromosome 10 comprising and
flanked by:
i. PHM15590 and PHM9535;
ii. PHM15590 and PHM15721;
iii. C00441 and C00428;
iv. PHM731 and PHM15721; and
v. C00071 and PHM731;
and the allele is associated with enhanced resistance to tropical rust. The
first
maize plant is crossed to a second maize plant, and the resulting progeny
plants are
evaluated for the allele of the first maize plant. Progeny plants that possess
the
allele of the first maize plant are then selected as having enhanced
resistance to
tropical rust.
In another embodiment, methods of selecting maize plants with enhanced
resistance to tropical rust are provided. In this method, a first maize plant
is
obtained wherein the maize plant comprises in its genome the "T" deletion at
position 16 of PHMTR or the "GAG" haplotype at positions 337-339 of reference
sequence SEQ ID NO:167. The first maize plant is crossed to a second maize
plant, and the resulting progeny plants are evaluated for the "T" deletion at
position
16 of PHMTR or the "GAG" haplotype at positions 337-339 of reference sequence
SEQ ID NO:167. Progeny plants that possess the "T" deletion at position 16 of
PHMTR or the "GAG" haplotype at positions 337-339 of reference sequence SEQ
ID NO:167 are then selected as having enhanced resistance to tropical rust.
Additionally, maize plants identified or selected by the methods described
above, wherein the plant is not CML339, are of interest. Furthermore, progeny
of
maize plants identified or selected by the methods described above are of
interest.
In another embodiment, methods of identifying allelic variations associated
with a desirable form of a trait are presented. In these methods, raw
sequences are
aligned with an open:extension cost ratio greater than 10 and background noise
is
removed by trimming the tails. Random allelic variation is then trimmed , and
an
unweighted pair group method with arithmetic mean (UPGMA) is applied. The
trimming of random allelic variation and the application of UPGMA to the
alignment
are repeated until a phenogram is identified. Allelic variations associated
with the
phenotype of interest can then be identified from the phenogram.
4
WO 2011/056836 PCT/US2010/055242
BRIEF DESCRIPTION OF FIGURES AND SEQUENCE LISTINGS
The invention can be more fully understood from the following detailed
description and the accompanying drawings and Sequence Listing which form a
part
of this application. The Sequence Listing contains the one letter code for
nucleotide
sequence characters and the three letter codes for amino acids as defined in
conformity with the IUPAC-IUBMB standards described in Nucleic Acids Research
13:3021-3030 (1985) and in the Biochemical Journal 219 (No. 2): 345-373
(1984),
which are herein incorporated by reference in their entirety. The symbols and
format used for nucleotide and amino acid sequence data comply with the rules
set
forth in 37 C.F.R. 1.822.
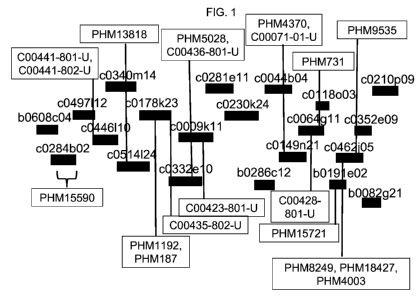
FIG. 1 shows the physical map arrangement of sequenced BACs (obtained
from the Maize Genome Browser, which is publicly available on the internet)
that
assemble to the chromosome 10 region defined by and including BACs c0497L12
and b0191 E02. The positions of the PHM markers described herein (region
defined
by and including PHM15590 and PHM15721) are indicated, as are the positions of
the public markers lying within the interval.
FIGs. 2A and 2B show the frequency distributions of PH468 x PHS6Y F2
population for tropical and southern rust scores, respectively.
FIG. 3 shows the composite interval mapping results obtained using the
PH468 x PHS6Y F2 population. A peak of significance was identified on the
short
arm of chromosome 10. Marker positions on the x-axis correspond to the PHB
genetic map. The y-axis represents the LOD score.
FIG. 4 (a) Susceptible inbred line and corresponding resistant conversion
using PHS6Y as donor parent. (b) Hybrid made with a susceptible version of an
inbred. (c) Hybrid made with the resistant ("converted") version of the same
inbred.
This shows that the tropical rust gene has a dominant effect in the hybrid
level.
FIG. 5 shows a hybrid that is highly susceptible to tropical rust (on left)
and
the same hybrid that has been converted to have enhanced resistance from PHS6Y
(on right).
FIG. 6 shows the public BAC clones used as reference for primer design to
genotype maize lines that are resistant and susceptible to tropical rust.
Internal
information regarding BAC overlap was used to further narrow the sequence
order
of the 2-2.5 Mb region into 24 sub-regions.
5
WO 2011/056836 PCT/US2010/055242
FIG. 7 shows part of the reference sequence (top) obtained by the
genotyping of maize lines resistant and susceptible to tropical rust using PCR
primers (SEQ ID NOs: 133 and 134) designed for clone ID Ct9050c064G11 c (Table
9). SEQ ID NOs:137-142 represent amplicons obtained from resistant lines,
while
SEQ ID NOs: 143-154 represent amplicons obtained from susceptible lines. The
area highlighted in grey represents a 21 bp-region of the reference sequence
(referred to as PHMTR; SEQ ID NO:155). Maize lines having a T-deletion at bp
16
(indicated by the arrow) all showed enhanced resistance to tropical rust and
have
the sequence of SEQ ID NO:156.
FIG. 8 shows part of the alignment of amplicon sequences obtained using
primers SEQ ID NO:135 and SEQ ID NO:136. A "GAG" haplotype (boxed) was
found to be unique to all lines with enhanced resistance to tropical rust.
The sequence descriptions and Sequence Listing attached hereto comply
with the rules governing nucleotide and/or amino acid sequence disclosures in
patent applications as set forth in 37 C.F.R. 1.821-1.825. The Sequence
Listing
contains the one letter code for nucleotide sequence characters and the three
letter
codes for amino acids as defined in conformity with the IUPAC-IUBMB standards
described in Nucleic Acids Res. 13:3021-3030 (1985) and in the Biochemical J.
219
(2):345-373 (1984) which are herein incorporated by reference. The symbols and
format used for nucleotide and amino acid sequence data comply with the rules
set
forth in 37 C.F.R. 1.822.
Table 1 lists the sequences described herein that are associated with the
InvaderPlus Production markers, along with the corresponding identifiers (SEQ
ID
NO:) as used in the attached Sequence Listing.
TABLE 1: InvaderPlus Production Markers
Forward Reverse Allele Allele Dye Dye Probe Probe
Marker Name Primer Primer Sense 1 2 1 2 1 2
SEQ ID NO: SEQ ID NO:
ANTI-
PHM1192-26-U 1 2 SENSE G A FAM RED 3 4
PHM1192-4-U 5 6 SENSE D I FAM RED 7 8
000435-802-U 9 10 SENSE A T RED FAM 11 12
000436-801-U 13 14 SENSE A G RED FAM 15 16
ANTI-
PHM187-7-U 17 18 SENSE G A FAM RED 19 20
6
WO 2011/056836 PCT/US2010/055242
000423-801-U 21 22 SENSE T C RED FAM 23 24
ANTI-
PHM5028-24-U 25 26 SENSE T C FAM RED 27 28
PHM13818-15-U 29 30 SENSE T C FAM RED 31 32
ANTI-
PHM15721-39-U 33 34 SENSE D I FAM RED 35 36
PHM 15721-180-
U 37 38 SENSE C T FAM RED 39 40
000441-801-U 41 42 SENSE T G RED FAM 43 44
000441-802-U 45 46 SENSE T C RED FAM 47 48
PHM4370-19-U 49 50 SENSE G A FAM RED 51 52
PHM731-107-U 53 54 SENSE T C FAM RED 55 56
ANTI-
C00071-01-U 57 58 SENSE D I FAM RED 59 60
PHM8249-21-U 61 62 SENSE T C FAM RED 63 64
ANTI-
C00428-801-U 65 66 SENSE G A RED FAM 67 68
ANTI-
PHM18427-13-U 69 70 SENSE D I FAM RED 71 72
PHM9535-10-U 73 74 SENSE G T FAM RED 75 76
ANTI-
PHM9535-6-U 77 78 SENSE T A FAM RED 79 80
ANTI-
PHM9535-7-U 81 82 SENSE G A FAM RED 83 84
ANTI-
PHM4003-13-U 85 86 SENSE T C FAM RED 87 88
Table 2 lists the sequences described herein that are associated with the
PHM markers, along with the corresponding identifiers (SEQ ID NO:) as used in
the
attached Sequence Listing.
TABLE 2: PHM Marker Sequences: amplicon and primer information
Marker Locus Amplicon Primer Forward Reverse
reference Primer Primer
sequence (SEQ ID NO:) (SEQ ID NO:)
(SEQ ID NO:)
PHM15590 89 Internal 98 99
External 97 100
PHM13818 90 Internal 102 103
External 101 104
PHM 1192 91 Internal 106 107
External 105 108
7
WO 2011/056836 PCT/US2010/055242
PHM187 92 Internal 110 111
External 109 112
PHM5028 93 Internal 114 115
External 113 116
PHM4370 94 Internal 118 119
External 117 120
PHM731 95 Internal 122 123
External 121 124
PHM15721 96 Internal 126 127
External 125 128
SEQ ID NO:129 is the L primer designed for Clone ID Ct905Oc497L12e.
SEQ ID NO:130 is the R primer designed for Clone ID Ct905Oc497L12e.
SEQ ID NO:131 is the L primer designed for Clone ID Ct905OcO64Gl ld.
SEQ ID NO:132 is the R primer designed for Clone ID Ct905OcO64G1 Id.
SEQ ID NO:133 is the L primer designed for Clone ID Ct905OcO64G11c.
SEQ ID NO: 134 is the R primer designed for Clone ID Ct905OcO64G11 c.
SEQ ID NO:135 is the L primer designed for Clone ID Ct905Obl9l EO2m.
SEQ ID NO:136 is the R primer designed for Clone ID Ct905Obl91 E02m.
SEQ ID NO:137 is the sequence of the amplicon obtained using SEQ ID
NO:133 and SEQ ID NO:134 as the primers and PHS6Y DNA.
SEQ ID NO:138 is the sequence of the amplicon obtained using SEQ ID
NO:133 and SEQ ID NO:134 as the primers and PH1JG22 DNA. PH1JG22 is a
maize inbred line that is resistant to tropical rust.
SEQ ID NO:139 is the sequence of the amplicon obtained using SEQ ID
NO:133 and SEQ ID NO:135 as the primers and PH1 FT71 DNA. PH1 FT71 is a
maize inbred line that is resistant to tropical rust.
SEQ ID NO:140 is the sequence of the amplicon obtained using SEQ ID
NO:133 and SEQ ID NO:135 as the primers and PH1G3H1 DNA. PH1G3H1 is a
maize inbred line that is resistant to tropical rust.
SEQ ID NO:141 is the sequence of the amplicon obtained using SEQ ID
NO:133 and SEQ ID NO:135 as the primers and PH1JG01 DNA. PH1JG01 is a
maize inbred line that is resistant to tropical rust.
8
WO 2011/056836 PCT/US2010/055242
SEQ ID NO:142 is the sequence of the amplicon obtained using SEQ ID
NO:133 and SEQ ID NO:135 as the primers and PHS7W DNA. PHS7W is a maize
inbred line that is resistant to tropical rust.
SEQ ID NO:143 is the sequence of the amplicon obtained using SEQ ID
NO:133 and SEQ ID NO:135 as the primers and PH7W3 DNA. PH7W3 is a maize
inbred line that is susceptible to tropical rust.
SEQ ID NO:144 is the sequence of the amplicon obtained using SEQ ID
NO:133 and SEQ ID NO:135 as the primers and PH9VF DNA. PH9VF is a maize
inbred line that is susceptible to tropical rust.
SEQ ID NO:145 is the sequence of the amplicon obtained using SEQ ID
NO:133 and SEQ ID NO:135 as the primers and PHBNA DNA. PHBNA is a maize
inbred line that is susceptible to tropical rust.
SEQ ID NO:146 is the sequence of the amplicon obtained using SEQ ID
NO:133 and SEQ ID NO:135 as the primers and PH2JR DNA. PH2JR is a maize
inbred line that is susceptible to tropical rust.
SEQ ID NO:147 is the sequence of the amplicon obtained using SEQ ID
NO:133 and SEQ ID NO:135 as the primers and PHOTJ DNA. PHOTJ is a maize
inbred line that is susceptible to tropical rust.
SEQ ID NO:148 is the sequence of the amplicon obtained using SEQ ID
NO:133 and SEQ ID NO:135 as the primers and PH467 DNA. PH467 is a maize
inbred line that is susceptible to tropical rust.
SEQ ID NO:149 is the sequence of the amplicon obtained using SEQ ID
NO:133 and SEQ ID NO:135 as the primers and PH48F DNA. PH48F is a maize
inbred line that is susceptible to tropical rust.
SEQ ID NO:150 is the sequence of the amplicon obtained using SEQ ID
NO:133 and SEQ ID NO:135 as the primers and PH7WC DNA. PH7WC is a maize
inbred line that is susceptible to tropical rust.
SEQ ID NO:151 is the sequence of the amplicon obtained using SEQ ID
NO:133 and SEQ ID NO:135 as the primers and 625 DNA. 625 is a maize inbred
line that is susceptible to tropical rust.
SEQ ID NO:152 is the sequence of the amplicon obtained using SEQ ID
NO:133 and SEQ ID NO:135 as the primers and PHP3P1 DNA. PHP3P1 is a maize
inbred line that is susceptible to tropical rust.
9
WO 2011/056836 PCT/US2010/055242
SEQ ID NO:153 is the sequence of the amplicon obtained using SEQ ID
NO:133 and SEQ ID NO:135 as the primers and PHY7M2 DNA. PHY7M2 is a
maize inbred line that is susceptible to tropical rust.
SEQ ID NO:154 is the sequence of the amplicon obtained using SEQ ID
NO:133 and SEQ ID NO:135 as the primers and PH147G5 DNA. PH147G5 is a
maize inbred line that is susceptible to tropical rust.
SEQ ID NO:155 is the sequence of the PHMTR region.
SEQ ID NO:156 is the sequence of the PHMTR region without the "T" at
position 16 of SEQ ID NO:155.
SEQ ID NOs:157-164 are the sequences for primers C06621-1-K2 and
C06621-1-K4 (Table 3).
Table 3: C06621-1-K2 and C06621-1-K4 KASP Marker Information
Marker Name C06621-1-K2 C06621-1-K4
Reverse Primer for Marker 1 SEQ ID SEQ ID
(Target Specific) NO:157 NO:161
Reverse Primer for Marker 2 SEQ ID SEQ ID
(Internal control) NO:158 NO:162
Allelel P P
Allele2 X X
Dyel VIC VIC
Dye2 FAM FAM
Forward Primer for Marker 1 +
VIC universal Sequence SEQ ID SEQ ID
(Target Specific) NO:159 NO:163
Forward Primer for Marker 2 +
FAM universal Sequence SEQ ID SEQ ID
(Internal Control) NO:160 NO:164
SEQ ID NO:165 is the FAM universal sequence.
SEQ ID NO:166 is the VIC universal sequence.
SEQ ID NO:167 is the reference sequence for Sub23M.
WO 2011/056836 PCT/US2010/055242
DETAILED DESCRIPTION
The present invention provides allelic compositions in maize and methods for
identifying and for selecting maize plants with enhanced resistance to
tropical rust.
Also within the scope of this invention are allelic compositions and methods
used to
identify and to counter-select maize plants that have decreased resistance to
tropical rust. The following definitions are provided as an aid to understand
this
invention.
The term "Enhanced resistance", "increased resistance " or "newly conferred
resistance" are used interchangeable and refers to an increased level of
resistance
against a particular pathogen, a wide spectrum of pathogens, or an infection
caused
by the pathogen(s). An increased level of resistance against a particular
fungal
pathogen, such tropical rust, for example, constitutes "enhanced" or improved
fungal resistance. The embodiments of the invention will enhance or improve
fungal
plant pathogen resistance, such that the resistance of the plant to a fungal
pathogen
or pathogens will increase, which in turn, will increase resistance to the
disease
caused by the fungal pathogen. The term "enhance" refers to improve, increase,
amplify, multiply, elevate, raise, and the like. Herein, plants of the
invention are
described as having "enhanced resistance" to tropical rust infection, as a
result of
specific alleles at the locus of the invention.
A maize plant that displays enhanced resistance to tropical rust is a plant
that
is less affected with respect to yield and/or survivability or other relevant
agronomic
measures, upon introduction of the causative agents of that disease.
Resistance is
a relative term, indicating that the infected plant produces better yield of
maize than
another, similarly treated, more susceptible plant. That is, the conditions
cause a
reduced decrease in maize survival and/or yield in a resistant maize plant, as
compared to a susceptible maize plant. One of skill will appreciate that maize
plant
resistance to tropical rust varies widely, can represent a spectrum of more
resistant
or less resistant phenotypes, and can vary depending on the severity of the
infection. However, by simple observation, one of skill can determine the
relative
resistance or susceptibility of different plants, plant lines or plant
families to tropical
rust, and furthermore, will also recognize the phenotypic gradations of
"resistant".
As used in the art, "resistance" is sometimes referred to as "general
resistance",
"rate-reducing resistance", or "partial resistance".
11
WO 2011/056836 PCT/US2010/055242
"Disease resistance" is a characteristic of a plant, wherein the plant avoids
the disease symptoms that are the outcome of plant-pathogen interactions, such
as
maize-tropical rust interactions. That is, pathogens are prevented from
causing
plant diseases and the associated disease symptoms, or alternatively, the
disease
symptoms caused by the pathogen are minimized or lessened. One of skill in the
art will appreciate that the compositions and methods disclosed herein can be
used
with other compositions and methods available in the art for protecting plants
from
pathogen attack.
As used herein, "fungal resistance" refers to enhanced resistance or
tolerance to a fungal pathogen when compared to that of a wild type plant.
Effects
may vary from a slight increase in tolerance to the effects of the fungal
pathogen
(e.g., partial inhibition) to total resistance such that the plant is
unaffected by the
presence of the fungal pathogen.
A plant referred to herein as "diploid" has two sets of chromosomes.
A plant referred to herein as a "doubled haploid" is developed by doubling the
haploid set of chromosomes. A doubled haploid plant is considered a homozygous
plant.
An "elite line" is any line that has resulted from breeding and selection for
superior agronomic performance.
The term "allele" refers to one of two or more different nucleotide sequences
that occur at a specific locus.
"Allele frequency" refers to the frequency (proportion or percentage) of an
allele within a population, or a population of lines. One can estimate the
allele
frequency within a population by averaging the allele frequencies of a sample
of
individuals from that population.
An "amplicon" is an amplified nucleic acid, e.g., a nucleic acid that is
produced by amplifying a template nucleic acid by any available amplification
method (e.g., PCR, LCR, transcription, or the like).
The term "amplifying" in the context of nucleic acid amplification is any
process whereby additional copies of a selected nucleic acid (or a transcribed
form
thereof) are produced. Typical amplification methods include various
polymerase
based replication methods, including the polymerase chain reaction (PCR),
ligase
mediated methods such as the ligase chain reaction (LCR) and RNA polymerase
12
WO 2011/056836 PCT/US2010/055242
based amplification (e.g., by transcription) methods.
The term "assemble" applies to BACs and their propensities for coming
together to form contiguous stretches of DNA. A BAC "assembles" to a contig
based on sequence alignment, if the BAC is sequenced, or via the alignment of
its
BAC fingerprint to the fingerprints of other BACs. Public assemblies can be
found
using the Maize Genome Browser, which is publicly available on the internet.
An allele is "associated with" a trait when it is part of or linked to a DNA
sequence or allele that affects the expression of a trait, and the presence of
the
allele is an indicator that the desired trait or trait form will occur in a
plant comprising
the allele.
A "BAC", or bacterial artificial chromosome, is a cloning vector derived from
the naturally occurring F factor of Escherichia coli. BACs can accept large
inserts of
DNA sequence. In maize, a number of BACs, or bacterial artificial chromosomes,
each containing a large insert of maize genomic DNA, have been assembled into
contigs (overlapping contiguous genetic fragments, or `contiguous DNA").
"Backcrossing" refers to the process whereby hybrid progeny are repeatedly
crossed back to one of the parents. The "donor" parent refers to the parental
plant
with the desired gene/genes, locus/loci, or specific phenotype to be
introgressed.
The "recipient" parent (used one or more times) or "recurrent" parent (used
two or
more times) refers to the parental plant into which the gene or locus is being
introgressed. For example, see Ragot, M. et al. (1995) Marker-assisted
backcrossing: a practical example, in Techniques et Utilisations des Marqueurs
Moleculaires Les Colloques, Vol. 72, pp. 45-56, and Openshaw et al., (1994)
Marker-assisted Selection in Backcross Breeding, Analysis of Molecular Marker
Data, pp. 41-43. The initial cross gives rise to the F1 generation; the term
"BC1"
then refers to the second use of the recurrent parent, "BC2" refers to the
third use of
the recurrent parent, and so on.
A centimorgan ("cM") is a unit of measure of recombination frequency. One
cM is equal to a 1 % chance that a marker at one genetic locus will be
separated
from a marker at a second locus due to crossing over in a single generation.
As used herein, the term "chromosomal interval" designates a contiguous
linear span of genomic DNA that resides in planta on a single chromosome. The
genetic elements or genes located on a single chromosomal interval are
physically
13
WO 2011/056836 PCT/US2010/055242
linked. The size of a chromosomal interval is not particularly limited. In
some
aspects, the genetic elements located within a single chromosomal interval are
genetically linked, typically with a genetic recombination distance of, for
example,
less than or equal to 20 cM, or alternatively, less than or equal to 10 cM.
That is,
two genetic elements within a single chromosomal interval undergo
recombination
at a frequency of less than or equal to 20% or 10%.
As used herein, the term "chromosomal interval" designates a contiguous
linear span of genomic DNA that resides in planta on a single chromosome. The
genetic elements or genes located on a single chromosomal interval are
physically
linked. The size of a chromosomal interval is not particularly limited. In
some
aspects, the genetic elements located within a single chromosomal interval are
genetically linked, typically with a genetic recombination distance of, for
example,
less than or equal to 20 cM, or alternatively, less than or equal to 10 cM.
That is,
two genetic elements within a single chromosomal interval undergo
recombination
at a frequency of less than or equal to 20% or 10%.
A "chromosome" is a single piece of coiled DNA containing many genes that
act and move as a unit during cell division and therefore can be said to be
linked.can also be referred to as a "linkage group".
The phrase "closely linked", in the present application, means that
recombination between two linked loci occurs with a frequency of equal to or
less
than about 10% (i.e., are separated on a genetic map by not more than 10 cM).
Put
another way, the closely linked loci co-segregate at least 90% of the time.
Marker
loci are especially useful in the present invention when they demonstrate a
significant probability of co-segregation (linkage) with a desired trait
(e.g.,
pathogenic resistance). Closely linked loci such as a marker locus and a
second
locus can display an inter-locus recombination frequency of 10% or less,
preferably
about 9% or less, still more preferably about 8% or less, yet more preferably
about
7% or less, still more preferably about 6% or less, yet more preferably about
5% or
less, still more preferably about 4% or less, yet more preferably about 3% or
less,
and still more preferably about 2% or less. In highly preferred embodiments,
the
relevant loci display a recombination a frequency of about 1 % or less, e.g.,
about
0.75% or less, more preferably about 0.5% or less, or yet more preferably
about
0.25% or less. Two loci that are localized to the same chromosome, and at such
a
14
WO 2011/056836 PCT/US2010/055242
distance that recombination between the two loci occurs at a frequency of less
than
10% (e.g., about 9 %, 8%, 7%, 6%, 5%, 4%, 3%,2%,1%, 0.75%, 0.5%, 0.25%, or
less) are also said to be "proximal to" each other. In some cases, two
different
markers can have the same genetic map coordinates. In that case, the two
markers
are in such close proximity to each other that recombination occurs between
them
with such low frequency that it is undetectable.
In bioinformatics, "clustering" refers to the grouping of sequences that are
somehow related and is often used to make a non-redundant set of
representative
sequences. The sequences can be genomic, "transcriptomic" (ESTs) or protein in
nature.
The term "complement" refers to a nucleotide sequence that is
complementary to a given nucleotide sequence, i.e. the sequences are related
by
the base-pairing rules.
The term "contiguous DNA" refers to an uninterrupted stretch of genomic
DNA represented by partially overlapping pieces or contigs.
When referring to the relationship between two genetic elements, such as a
genetic element contributing to resistance and a proximal marker, "coupling"
phase
linkage indicates the state where the "favorable" allele at the resistance
locus is
physically associated on the same chromosome strand as the "favorable" allele
of
the respective linked marker locus. In coupling phase, both favorable alleles
are
inherited together by progeny that inherit that chromosome strand.
The term "crossed" or "cross" means the fusion of gametes via pollination to
produce progeny (e.g., cells, seeds or plants). The term encompasses both
sexual
crosses (the pollination of one plant by another) and selfing (self-
pollination, e.g.,
when the pollen and ovule are from the same plant). The term "crossing" refers
to
the act of fusing gametes via pollination to produce progeny.
A plant referred to herein as "diploid" has two sets (genomes) of
chromosomes.
A plant referred to herein as a "doubled haploid" is developed by doubling the
haploid set of chromosomes (i.e., half the normal number of chromosomes). A
doubled haploid plant has two identical sets of chromosomes, and all loci are
considered homozygous.
WO 2011/056836 PCT/US2010/055242
An "elite line" is any line that has resulted from breeding and selection for
superior agronomic performance.
An "exotic maize strain" or an "exotic maize germplasm" is a strain or
germplasm derived from a maize not belonging to an available elite maize line
or
strain of germplasm. In the context of a cross between two maize plants or
strains
of germplasm, an exotic germplasm is not closely related by descent to the
elite
germplasm with which it is crossed. Most commonly, the exotic germplasm is not
derived from any known elite line of maize, but rather is selected to
introduce novel
genetic elements (typically novel alleles) into a breeding program.
A "favorable allele" is the allele at a particular locus that confers, or
contributes to, an agronomically desirable phenotype, e.g., enhanced
resistance to
tropical rust, and that allows the identification of plants that agronomically
desirable
phenotype. A" favorable" allele of a marker is a marker allele that segregates
with
the favorable phenotype.
"Fragment" is intended to mean a portion of a nucleotide sequence.
Fragments can be used as hybridization probes or PCR primers using methods
disclosed herein.
A "genetic map" is a description of genetic linkage relationships among loci
on one or more chromosomes (or linkage groups) within a given species,
generally
depicted in a diagrammatic or tabular form. For each genetic map, distances
between loci are measured by how frequently their alleles appear together in a
population (i.e. their recombination frequencies). Alleles can be detected
using
DNA or protein markers, or observable phenotypes. A genetic map is a product
of
the mapping population, types of markers used, and the polymorphic potential
of
each marker between different populations. Genetic distances between loci can
differ from one genetic map to another. However, information can be correlated
from one map to another using common markers. One of ordinary skill in the art
can use common marker positions to identify positions of markers and other
loci of
interest on each individual genetic map. The order of loci should not change
between maps, although frequently there are small changes in marker orders due
to
e.g. markers detecting alternate duplicate loci in different populations,
differences in
statistical approaches used to order the markers, novel mutation or laboratory
error.
16
WO 2011/056836 PCT/US2010/055242
A "genetic map location" is a location on a genetic map relative to
surrounding genetic markers on the same linkage group where a specified marker
can be found within a given species.
"Genetic mapping" is the process of defining the linkage relationships of loci
through the use of genetic markers, populations segregating for the markers,
and
standard genetic principles of recombination frequency.
The term "Genetic Marker" shall refer to any type of nucleic acid based
marker, including but not limited to, Restriction Fragment Length Polymorphism
(RFLP), Simple Sequence Repeat (SSR), Random Amplified Polymorphic DNA
(RAPD), Cleaved Amplified Polymorphic Sequences (CAPS) (Rafalski and Tingey,
1993, Trends in Genetics 9:275-280), Amplified Fragment Length Polymorphism
(AFLP) (Vos et al, 1995, Nucleic Acids Res. 23:4407-4414), Single Nucleotide
Polymorphism (SNP) (Brookes, 1999, Gene 234:177-186), Sequence Characterized
Amplified Region (SCAR) (Paran and Michelmore, 1993, Theor. Appl. Genet.
85:985-993), Sequence Tagged Site (STS) (Onozaki et al., 2004, Euphytica
138:255-262), Single Stranded Conformation Polymorphism (SSCP) (Orita et al.,
1989, Proc Natl Acad Sci USA 86:2766-2770), Inter-Simple Sequence Repeat
(ISSR) (Blair et al., 1999, Theor. Appl. Genet. 98:780-792), Inter-
Retrotransposon
Amplified Polymorphism (IRAP), Retrotransposon-Microsatellite Amplified
Polymorphism (REMAP) (Kalendar et al., 1999, Theor. Appl. Genet. 98:704-711),
an
RNA cleavage product (such as a Lynx tag), and the like.
"Genetic recombination frequency" is the frequency of a crossing over event
(recombination) between two genetic loci. Recombination frequency can be
observed by following the segregation of markers and/or traits following
meiosis.
"Genome" refers to the total DNA, or the entire set of genes, carried by a
chromosome or chromosome set.
The term "genotype" is the genetic constitution of an individual (or group of
individuals) at one or more genetic loci, as contrasted with the observable
trait (the
phenotype). Genotype is defined by the allele(s) of one or more known loci
that the
individual has inherited from its parents. The term genotype can be used to
refer to
an individual's genetic constitution at a single locus, at multiple loci, or,
more
generally, the term genotype can be used to refer to an individual's genetic
make-up
for all the genes in its genome.
17
WO 2011/056836 PCT/US2010/055242
"Germplasm" refers to genetic material of or from an individual (e.g., a
plant),
a group of individuals (e.g., a plant line, variety or family), or a clone
derived from a
line, variety, species, or culture. The germplasm can be part of an organism
or cell,
or can be separate from the organism or cell. In general, germplasm provides
genetic material with a specific molecular makeup that provides a physical
foundation for some or all of the hereditary qualities of an organism or cell
culture.
As used herein, germplasm includes cells, seed or tissues from which new
plants
may be grown, or plant parts, such as leafs, stems, pollen, or cells that can
be
cultured into a whole plant.
A "haplotype" is the genotype of an individual at a plurality of genetic loci,
i.e.
a combination of alleles. Typically, the genetic loci described by a haplotype
are
physically and genetically linked, i.e., on the same chromosome segment. The
term
"haplotype" can refer to a series of polymorphisms with a specific sequence,
such
as a marker locus, or a series of polymorphisms across multiple sequences,
e.g.
multiple marker loci.
A "heterotic group" comprises a set of genotypes that perform well when
crossed with genotypes from a different heterotic group (Hallauer et al.
(1998) Corn
breeding, p. 463-564. In G.F. Sprague and J.W. Dudley (ed.) Corn and corn
improvement). Inbred lines are classified into heterotic groups, and are
further
subdivided into families within a heterotic group, based on several criteria
such as
pedigree, molecular marker-based associations, and performance in hybrid
combinations (Smith et al. (1990) Theor. Appl. Gen. 80:833-840). The two most
widely used heterotic groups in the United States are referred to as "Iowa
Stiff Stalk
Synthetic" (BSSS) and "Lancaster" or "Lancaster Sure Crop" (sometimes referred
to
as NSS, or non-Stiff Stalk).
The term "heterozygous" means a genetic condition wherein different alleles
reside at corresponding loci on homologous chromosomes.
The term "homozygous" means a genetic condition wherein identical alleles
reside at corresponding loci on homologous chromosomes.
The term "hybrid" refers to the progeny obtained between the crossing of at
least two genetically dissimilar parents.
"Hybridization" or "nucleic acid hybridization" refers to the pairing of
complementary RNA and DNA strands as well as the pairing of complementary
18
WO 2011/056836 PCT/US2010/055242
DNA single strands.
The term "hybridize" means to form base pairs between complementary
regions of nucleic acid strands.
An "IBM genetic map" refers to any of following maps: IBM, IBM2, IBM2
neighbors, IBM2 FPC0507, IBM2 2004 neighbors, IBM2 2005 neighbors, or IBM2
2005 neighbors frame. IBM genetic maps are based on a B73 x Mo17 population in
which the progeny from the initial cross were random-mated for multiple
generations
prior to constructing recombinant inbred lines for mapping. Newer versions
reflect
the addition of genetic and BAC mapped loci as well as enhanced map refinement
due to the incorporation of information obtained from other genetic maps.
The term "inbred" refers to a line that has been bred for genetic homogeneity.
The term "indel" refers to an insertion or deletion, wherein one line may be
referred to as having an insertion relative to a second line, or the second
line may
be referred to as having a deletion relative to the first line.
The term "introgression" refers to the transmission of a desired allele of a
genetic locus from one genetic background to another. For example,
introgression
of a desired allele at a specified locus can be transmitted to at least one
progeny via
a sexual cross between two parents of the same species, where at least one of
the
parents has the desired allele in its genome. Alternatively, for example,
transmission of an allele can occur by recombination between two donor
genomes,
e.g., in a fused protoplast, where at least one of the donor protoplasts has
the
desired allele in its genome. The desired allele can be, e.g., a selected
allele of a
marker, a QTL, a transgene, or the like. In any case, offspring comprising the
desired allele can be repeatedly backcrossed to a line having a desired
genetic
background and selected for the desired allele, to result in the allele
becoming fixed
in a selected genetic background.
The process of "introgressing" is often referred to as "backcrossing" when the
process is repeated two or more times. In introgressing or backcrossing, the
"donor" parent refers to the parental plant with the desired gene or locus to
be
introgressed. The "recipient" parent (used one or more times) or "recurrent"
parent
(used two or more times) refers to the parental plant into which the gene or
locus is
being introgressed. For example, see Ragot, M. et al. (1995) Marker-assisted
backcrossing: a practical example, in Techniques et Utilisations des Marqueurs
19
WO 2011/056836 PCT/US2010/055242
Moleculaires Les Colloques, Vol. 72, pp. 45-56, and Openshaw et al., (1994)
Marker-
assisted Selection in Backcross Breeding, Analysis of Molecular Marker Data,
pp. 41-
43. The initial cross gives rise to the F1 generation; the term "BC1" then
refers to the
second use of the recurrent parent, "BC2" refers to the third use of the
recurrent
parent, and so on.
As used herein, the term "linkage" is used to describe the degree with which
one marker locus is associated with another marker locus or some other locus
(for
example, a tropical rust locus). The linkage relationship between a molecular
marker and a phenotype (for example, enhanced resistance to tropical rust) is
given
as a "probability" or "adjusted probability". Linkage can be expressed as a
desired
limit or range. For example, in some embodiments, any marker is linked
(genetically
and physically) to any other marker when the markers are separated by less
than
50, 40, 30, 25, 20, or 15 map units (or cM). In some aspects, it is
advantageous to
define a bracketed range of linkage, for example, between 10 and 20 cM,
between
10 and 30 cM, or between 10 and 40 W. The more closely a marker is linked to a
second locus, the better an indicator for the second locus that marker
becomes.
Thus, "closely linked loci" such as a marker locus and a second locus display
an
inter-locus recombination frequency of 10% or less, preferably about 9% or
less, still
more preferably about 8% or less, yet more preferably about 7% or less, still
more
preferably about 6% or less, yet more preferably about 5% or less, still more
preferably about 4% or less, yet more preferably about 3% or less, and still
more
preferably about 2% or less. In highly preferred embodiments, the relevant
loci
display a recombination frequency of about 1 % or less, e.g., about 0.75% or
less,
more preferably about 0.5% or less, or yet more preferably about 0.25% or
less.
Two loci that are localized to the same chromosome, and at such a distance
that
recombination between the two loci occurs at a frequency of less than 10%
(e.g.,
about 9 %, 8%, 7%, 6%, 5%, 4%, 3%, 2%, 1%, 0.75%, 0.5%, 0.25%, or less) are
also said to be "proximal to" each other. Since one cM is the distance between
two
markers that show a 1 % recombination frequency, any marker is closely linked
(genetically and physically) to any other marker that is in close proximity,
e.g., at or
less than 10 cM distant. Two closely linked markers on the same chromosome can
be positioned 9, 8, 7, 6, 5, 4, 3, 2, 1, 0.75, 0.5 or 0.25 cM or less from
each other.
WO 2011/056836 PCT/US2010/055242
The term "linkage disequilibrium" refers to a non-random segregation of
genetic loci or traits (or both). In either case, linkage disequilibrium
implies that the
relevant loci are within sufficient physical proximity along a length of a
chromosome
so that they segregate together with greater than random (i.e., non-random)
frequency (in the case of co-segregating traits, the loci that underlie the
traits are in
sufficient proximity to each other). Markers that show linkage disequilibrium
are
considered linked. Linked loci co-segregate more than 50% of the time, e.g.,
from
about 51% to about 100% of the time. In other words, two markers that co-
segregate have a recombination frequency of less than 50% (and by definition,
are
separated by less than 50 cM on the same linkage group.) As used herein,
linkage
can be between two markers, or alternatively between a marker and a phenotype.
A marker locus can be "associated with" (linked to) a trait, e.g., resistance
to tropical
rust. The degree of linkage of a molecular marker to a phenotypic trait is
measured,
e.g., as a statistical probability of co-segregation of that molecular marker
with the
phenotype.
Linkage disequilibrium is most commonly assessed using the measure r2,
which is calculated using the formula described by Hill, W.G. and Robertson,
A,
Theor. Appl. Genet. 38:226-231(1968). When r2 = 1, complete LD exists between
the two marker loci, meaning that the markers have not been separated by
recombination and have the same allele frequency. Values for r2 above 1/3
indicate
sufficiently strong LD to be useful for mapping (Ardlie et al., Nature Reviews
Genetics 3:299-309 (2002)). Hence, alleles are in linkage disequilibrium when
r2
values between pairwise marker loci are greater than or equal to 0.33, 0.4,
0.5, 0.6,
0.7, 0.8, 0.9, or 1Ø
As used herein, "linkage equilibrium" describes a situation where two markers
independently segregate, i.e., sort among progeny randomly. Markers that show
linkage equilibrium are considered unlinked (whether or not they lie on the
same
chromosome).
A "locus" is a position on a chromosome where a gene or marker is located.
The "logarithm of odds (LOD) value" or "LOD score" (Risch, Science
255:803-804 (1992)) is used in interval mapping to describe the degree of
linkage
between two marker loci. A LOD score of three between two markers indicates
that
linkage is 1000 times more likely than no linkage, while a LOD score of two
21
WO 2011/056836 PCT/US2010/055242
indicates that linkage is 100 times more likely than no linkage. LOD scores
greater
than or equal to two may be used to detect linkage.
"Maize" refers to a plant of the Zea mays L. ssp. mays and is also known as
corn.
The term "maize plant" includes: whole maize plants, maize plant cells,
maize plant protoplast, maize plant cell or maize tissue cultures from which
maize
plants can be regenerated, maize plant calli, and maize plant cells that are
intact in
maize plants or parts of maize plants, such as maize seeds, maize cobs, maize
flowers, maize cotyledons, maize leaves, maize stems, maize buds, maize roots,
maize root tips, and the like.
A "marker" is a nucleotide sequence or encoded product thereof (e.g., a
protein) used as a point of reference. A marker can be derived from genomic
nucleotide sequence or from expressed nucleotide sequences (e.g., from a
spliced
RNA or a cDNA), or from an encoded polypeptide. The term also refers to
nucleic
acid sequences complementary to or flanking the marker sequences, such as
nucleic acids used as probes or primer pairs capable of amplifying the marker
sequence.
Markers corresponding to genetic polymorphisms between members of a
population can be detected by methods well-established in the art. These
include,
e.g., DNA sequencing, PCR-based sequence specific amplification methods,
detection of restriction fragment length polymorphisms (RFLP), detection of
isozyme
markers, detection of polynucleotide polymorphisms by allele specific
hybridization
(ASH), detection of amplified variable sequences of the plant genome,
detection of
self-sustained sequence replication, detection of simple sequence repeats
(SSRs),
detection of single nucleotide polymorphisms (SNPs), or detection of amplified
fragment length polymorphisms (AFLPs). Well established methods are also known
for the detection of expressed sequence tags (ESTs) and SSR markers derived
from EST sequences and randomly amplified polymorphic DNA (RAPD).
A "marker allele", alternatively an "allele of a marker locus", can refer to
one
of a plurality of polymorphic nucleotide sequences found at a marker locus in
a
population that is polymorphic for the marker locus.
"Marker assisted selection" (of MAS) is a process by which individual plants
are selected based on marker genotypes.
22
WO 2011/056836 PCT/US2010/055242
"Marker assisted counter-selection" is a process by which marker genotypes
are used to identify plants that will not be selected, allowing them to be
removed
from a breeding program or planting.
A "marker locus" is a specific chromosome location in the genome of a
species where a specific marker can be found. A marker locus can be used to
track
the presence of a second linked locus, e.g., a linked locus that encodes or
contributes to expression of a phenotypic trait. For example, a marker locus
can be
used to monitor segregation of alleles at a locus, such as a gene or QTL, that
are
genetically or physically linked to the marker locus.
A "marker probe" is a nucleic acid sequence or molecule that can be used to
identify the presence of a marker locus, e.g., a nucleic acid probe that is
complementary to a marker locus sequence, through nucleic acid hybridization.
Marker probes comprising 30 or more contiguous nucleotides of the marker locus
("all or a portion" of the marker locus sequence) may be used for nucleic acid
hybridization. Alternatively, in some aspects, a marker probe refers to a
probe of
any type that is able to distinguish (i.e., genotype) the particular allele
that is present
at a marker locus. Nucleic acids are "complementary" when they specifically
"hybridize", or pair, in solution, e.g., according to Watson-Crick base
pairing rules.
The term "molecular marker" may be used to refer to a genetic marker, as
defined above, or an encoded product thereof (e.g., a protein) used as a point
of
reference when identifying a linked locus. A marker can be derived from
genomic
nucleotide sequences or from expressed nucleotide sequences (e.g., from a
spliced
RNA, a cDNA, etc.), or from an encoded polypeptide. The term also refers to
nucleic acid sequences complementary to or flanking the marker sequences, such
as nucleic acids used as probes or primer pairs capable of amplifying the
marker
sequence. A "molecular marker probe" is a nucleic acid sequence or molecule
that
can be used to identify the presence of a marker locus, e.g., a nucleic acid
probe
that is complementary to a marker locus sequence. Alternatively, in some
aspects,
a marker probe refers to a probe of any type that is able to distinguish
(i.e.,
genotype) the particular allele that is present at a marker locus. Nucleic
acids are
"complementary" when they specifically hybridize in solution, e.g., according
to
Watson-Crick base pairing rules. Some of the markers described herein are also
referred to as hybridization markers when located on an indel region, such as
the
23
WO 2011/056836 PCT/US2010/055242
non-collinear region described herein. This is because the insertion region
is, by
definition, a polymorphism vis a vis a plant without the insertion. Thus, the
marker
need only indicate whether the indel region is present or absent. Any suitable
marker detection technology may be used to identify such a hybridization
marker,
e.g. SNP technology is used in the examples provided herein.
" Tropical rust" is the disease caused by the pathogen Physopella zeae
(Mains) Cummins & Ramachar (syn. Angiopsora zeae Mains). The disease is
characterized by the formation of small round yellow pustules on the upper
surface
of the corn leaf. These uredial pustules are often found in small groups and
the leaf
epidermal layer covers the developing urediniospores. The obovoid to ellipsoid
shaped urediniospores are released through a small slit or pore that forms in
the
epidermal layer. While the urediniospores are nearly colorless their released
urediniospores give the pustules a white or creamy appearance. Some maize
genotypes display pustules with a darker coloration (reddish to purplish)
which
accentuates the white/creamy urediniospores vs. a more traditional. A telial
stage,
with blister like appearance can also develop following uredial stage
formation. The
teliospores (brown to black in color) can develop within the telia which forms
around
the existing uredial pustules. (Donald G. White, ed. 1999. Compendium of corn
diseases. Third edition. APS Press, ISBN 0-89054-234-1).
" Southern rust" is the disease caused by the pathogen Puccinia polysora
Underw.. The disease is characterized by small round yellow pustules that form
primarily on the upper surface of the leaf, but occasionally break through to
the
lower leaf surface with uredial sporulation most often found adjacent to the
leaf
midrib. These uredial pustules contain the obovoid to ellipsoid shaped
urediniospores, which typically are orange to reddish orange in coloration.
The
pustules often are round to oval in shape and become very numerous on the
leaf.
This pathogen can also form uredial pustules on the ear husk, ear shank and
leaf
sheaths. A telial stage is known to exist, with dark brown to black
teliospores
forming in telial which found in a semi-circle to circle around existing
uredia.
"Nucleotide sequence", "polynucleotide", "nucleic acid sequence", and
"nucleic acid fragment" are used interchangeably and refer to a polymer of RNA
or
DNA that is single- or double-stranded, optionally containing synthetic, non-
natural
or altered nucleotide bases. A "nucleotide" is a monomeric unit from which DNA
or
24
WO 2011/056836 PCT/US2010/055242
RNA polymers are constructed, and consists of a purine or pyrimidine base, a
pentose, and a phosphoric acid group. Nucleotides (usually found in their
5'-monophosphate form) are referred to by their single letter designation as
follows:
"A" for adenylate or deoxyadenylate (for RNA or DNA, respectively), "C" for
cytidylate or deoxycytidylate, "G" for guanylate or deoxyguanylate, "U" for
uridylate,
"T" for deoxythymidylate, "R" for purines (A or G), "Y" for pyrimidines (C or
T), "K" for
G or T, "H" for A or C or T, "I" for inosine, and "N" for any nucleotide.
A phenogram is a diagram depicting taxonomic relationships among
organisms based on overall similarity of many characteristics without regard
to
evolutionary history or assumed significance of specific characters, usually
generated by a computer.
The terms "phenotype", or "phenotypic trait" or "trait" refers to one or more
trait of an organism. The phenotype can be observable to the naked eye, or by
any
other means of evaluation known in the art, e.g., microscopy, biochemical
analysis,
or an electromechanical assay. In some cases, a phenotype is directly
controlled by
a single gene or genetic locus, i.e., a "single gene trait". In other cases, a
phenotype is the result of several genes.
"Phylogenetic trees" are diagrams showing the inferred evolutionary
relationships among various biological species or other entities based upon
similarities and differences in their physical and/or genetic characteristics.
They can
be constructed using a variety of methods including but not limited to the
distance-
matrix methods such as neighbor-joining or UPGMA, which calculate genetic
distance from multiple sequence alignments.
A "physical map" of the genome is a map showing the linear order of
identifiable landmarks (including genes, markers, etc.) on chromosome DNA.
However, in contrast to genetic maps, the distances between landmarks are
absolute (for example, measured in base pairs or isolated and overlapping
contiguous genetic fragments) and not based on genetic recombination.
A "plant" can be a whole plant, any part thereof, or a cell or tissue culture
derived from a plant. Thus, the term "plant" can refer to any of: whole
plants, plant
components or organs (e.g., leaves, stems, roots, etc.), plant tissues, seeds,
plant
cells, and/or progeny of the same. A plant cell is a cell of a plant, taken
from a
plant, or derived through culture from a cell taken from a plant.
WO 2011/056836 PCT/US2010/055242
A "polymorphism" is a variation in the DNA that is too common to be due
merely to new mutation. A polymorphism must have a frequency of at least 1 %
in a
population. A polymorphism can be a single nucleotide polymorphism, or SNP, or
an insertion/deletion polymorphism, also referred to herein as an "indel".
The "probability value" or "p-value" is the statistical likelihood that the
particular combination of a phenotype and the presence or absence of a
particular
marker allele is random. Thus, the lower the probability score, the greater
the
likelihood that a phenotype and a particular marker will co-segregate. In some
aspects, the probability score is considered "significant" or
"nonsignificant". In some
embodiments, a probability score of 0.05 (p=0.05, or a 5% probability) of
random
assortment is considered a significant indication of co-segregation. However,
an
acceptable probability can be any probability of less than 50% (p=0.5). For
example, a significant probability can be less than 0.25, less than 0.20, less
than
0.15, less than 0.1, less than 0.05, less than 0.01, or less than 0.001.
Each "PHM" marker represents two sets of primers (external and internal)
that when used in a nested PCR, amplify a specific piece of DNA. The external
set
is used in the first round of PCR, after which the internal sequences are used
for a
second round of PCR on the products of the first round. This increases the
specificity of the reaction. All of the PHM markers described herein are
listed in
Table 2, and the annealing temperature for these primers is 55 C.
A "production marker" or "production SNP marker" is a marker that has been
developed for high-throughput purposes. Production SNP markers were developed
for specific polymorphisms identified using PHM markers and the nested PCR
analysis (see, for example, PHM1192-26-U in Table 1). The production SNP
markers were designed for use with the Invader Plus (Third Wave Technologies)
platform.
A "reference sequence" is a defined sequence used as a basis for sequence
comparison. The reference sequence is obtained by genotyping a number of lines
at the locus, aligning the nucleotide sequences in a sequence alignment
program
(e.g. Sequencher), and then obtaining the consensus sequence of the alignment.
Hence, a reference sequence identifies the polymorphisms in alleles at a
locus. A
reference sequence may not be a copy of an actual DNA sequence; however, it is
useful for designing primers and probes for actual polymorphisms in the locus.
26
WO 2011/056836 PCT/US2010/055242
The term "progeny" refers to the offspring generated from a cross.
A "progeny plant" is generated from a cross between two plants.
The term "quantitative trait locus" or "QTL" refers to a region of DNA that is
associated with the differential expression of a phenotypic trait in at least
one
genetic background, e.g., in at least one breeding population. QTLs are
closely
linked to the gene or genes that underlie the trait in question.
A "topcross test" is a progeny test derived by crossing each parent with the
same tester, usually a homozygous line. The parent being tested can be an open-
pollinated variety, a cross, or an inbred line.
The phrase "under stringent conditions" refers to conditions under which a
probe or polynucleotide will hybridize to a specific nucleic acid sequence,
typically in
a complex mixture of nucleic acids, but to essentially no other sequences.
Stringent
conditions are sequence-dependent and will be different in different
circumstances.
An "unfavorable allele" of a marker is a marker allele that segregates with
the
unfavorable plant phenotype, therefore providing the benefit of identifying
plants that
can be removed from a breeding program or planting.
Longer sequences hybridize specifically at higher temperatures. Generally,
stringent conditions are selected to be about 3-5 C lower than the thermal
melting
point (Tm) for the specific sequence at a defined ionic strength pH. The Tm is
the
temperature (under defined ionic strength, pH, and nucleic acid concentration)
at
which 50% of the probes complementary to the target hybridize to the target
sequence at equilibrium (as the target sequences are present in excess, at Tm,
50%
of the probes are occupied at equilibrium). Stringent conditions will be those
in
which the salt concentration is less than about 1.0 M sodium ion, typically
about
0.01 to 1.0 M sodium ion concentration (or other salts) at pH 7.0 to 8.3, and
the
temperature is at least about 30 C for short probes (e.g., 10 to 50
nucleotides) and
at least about 60 C for long probes (e.g., greater than 50 nucleotides).
Stringent
conditions may also be achieved with the addition of destabilizing agents such
as
formamide. For selective or specific hybridization, a positive signal is at
least two
times background, preferably 10 times background hybridization. Exemplary
stringent hybridization conditions are often: 50% formamide, 5x SSC, and 1 %
SDS,
incubating at 42 C, or, 5x SSC, 1 % SDS, incubating at 65 C, with wash in 0.2x
SSC, and 0.1 % SDS at 65 C. For PCR, a temperature of about 36 C is typical
for
27
WO 2011/056836 PCT/US2010/055242
low stringency amplification, although annealing temperatures may vary between
about 50 C and 65 C, depending on primer length. Additional guidelines for
determining hybridization parameters are provided in numerous references.
Sequence alignments and percent identity calculations may be determined using
a
variety of comparison methods designed to detect homologous sequences
including, but not limited to, the MEGALIGN program of the LASERGENE
bioinformatics computing suite (DNASTAR Inc., Madison, WI). Unless stated
otherwise, multiple alignment of the sequences provided herein were performed
using the Clustal V method of alignment (Higgins and Sharp, CABIOS. 5:151-153
(1989)) with the default parameters (GAP PENALTY=10, GAP LENGTH
PENALTY=1 0). Default parameters for pairwise alignments and calculation of
percent identity of protein sequences using the Clustal V method are KTUPLE=1,
GAP PENALTY=3, WINDOW=5 and DIAGONALS SAVED=5. For nucleic acids
these parameters are KTUPLE=2, GAP PENALTY=5, WINDOW=4 and
DIAGONALS SAVED=4. After alignment of the sequences, using the Clustal V
program, it is possible to obtain "percent identity" and "divergence" values
by
viewing the "sequence distances" table on the same program; unless stated
otherwise, percent identities and divergences provided and claimed herein were
calculated in this manner.
The "Clustal V method of alignment" corresponds to the alignment method
labeled Clustal V (described by Higgins and Sharp, CABIOS. 5:151-153 (1989);
Higgins, D.G. et al. (1992) Comput. Appl. Biosci. 8:189-191) and found in the
MegAlignTM program of the LASERGENE bioinformatics computing suite (DNASTAR
Inc., Madison, WI). For multiple alignments, the default values correspond to
GAP
PENALTY=10 and GAP LENGTH PENALTY=10. Default parameters for pairwise
alignments and calculation of percent identity of protein sequences using the
Clustal
method are KTUPLE=1, GAP PENALTY=3, WINDOW=5 and DIAGONALS
SAVED=5. For nucleic acids these parameters are KTUPLE=2, GAP PENALTY=5,
WINDOW=4 and DIAGONALS SAVED=4. After alignment of the sequences using
the Clustal V program, it is possible to obtain a "percent identity" by
viewing the
"sequence distances" table in the same program.
Standard recombinant DNA and molecular cloning techniques used herein
are well known in the art and are described more fully in Sambrook, J.,
Fritsch, E.F.
28
WO 2011/056836 PCT/US2010/055242
and Maniatis, T. Molecular Cloning: A Laboratory Manual; Cold Spring Harbor
Laboratory Press: Cold Spring Harbor, 1989 (hereinafter "Sambrook").
Before describing the present invention in detail, it should be understood
that
this invention is not limited to particular embodiments. It also should be
understood
that the terminology used herein is for the purpose of describing particular
embodiments, and is not intended to be limiting. As used herein and in the
appended claims, terms in the singular and the singular forms "a", "an" and
"the", for
example, include plural referents unless the content clearly dictates
otherwise.
Thus, for example, reference to "plant", "the plant" or "a plant" also
includes a
plurality of plants. Depending on the context, use of the term "plant" can
also
include genetically similar or identical progeny of that plant. The use of the
term "a
nucleic acid" optionally includes many copies of that nucleic acid molecule.
Tropical rust resistance
Tropical rust resistance is a fungal disease of maize caused by the pathogen
Physopella zeae. The identification of molecular markers and alleles
associated
with tropical rust resistance allows selection for resistance based solely on
the
genetic composition of the progeny. Methods for identifying and selecting
maize
plants with enhanced resistance to tropical rust through the evaluation of
genetic
composition (as assessed using molecular markers and their alleles) are
presented
herein.
Genetic mapping
It has been recognized for quite some time that specific genetic loci
correlating with particular phenotypes, such as resistance to tropical rust,
can be
mapped in an organism's genome. The plant breeder can advantageously use
molecular markers to identify desired individuals by identifying marker
alleles that
show a statistically significant probability of co-segregation with a desired
phenotype, manifested as linkage disequilibrium. By identifying a molecular
marker
or clusters of molecular markers that co-segregate with a trait of interest,
the
breeder is able to rapidly select a desired phenotype by selecting for the
proper
molecular marker allele (a process called marker-assisted selection, or MAS).
Such
markers could also be used by breeders to design genotypes in silico and to
practice whole genome selection.
A variety of methods well known in the art are available for detecting
29
WO 2011/056836 PCT/US2010/055242
molecular markers or clusters of molecular markers that co-segregate with a
quantitative trait such as resistance to tropical rust. The basic idea
underlying these
methods is the detection of markers, for which alternative genotypes (or
alleles)
have significantly different average phenotypes. Thus, one makes a comparison
among marker loci of the magnitude of difference among alternative genotypes
(or
alleles) or the level of significance of that difference. Trait genes are
inferred to be
located nearest the marker(s) that have the greatest associated genotypic
difference.
Two such methods that can be used to detect loci of interest are: 1)
Population-based association analysis and 2) Pedigree-based association
analysis
(or traditional linkage mapping). In a population-based association analysis,
lines
are obtained from pre-existing populations with multiple founders, e.g. elite
breeding
lines. Population-based association analyses rely on the decay of linkage
disequilibrium (LD) and the idea that in an unstructured population, only
correlations
between genes controlling a trait of interest and markers closely linked to
the those
genes will remain after so many generations of random mating. In reality, most
pre-
existing populations have population substructure. Thus, the use of a
structured
association approach helps to control population structure by allocating
individuals
to populations using data obtained from markers randomly distributed across
the
genome, thereby minimizing disequilibrium due to population structure within
the
individual populations (also called subpopulations). The phenotypic values are
compared to the genotypes (alleles) at each marker locus for each line in the
subpopulation. A significant marker-trait association indicates the close
proximity
between the marker locus and one or more genetic loci that are involved in the
expression of that trait.
The same principles underlie the pedigree-based association analyses (also
referred to as traditional linkage analysis); however, LD is generated by
creating a
population from a small number of founders. The founders are selected to
maximize the level of polymorphism within the constructed population, and
polymorphic sites are assessed for their level of cosegregation with a given
phenotype. A number of statistical methods have been used to identify
significant
marker-trait associations. One such method is an interval mapping approach
(Lander and Botstein, Genetics 121:185-199 (1989), in which each of many
WO 2011/056836 PCT/US2010/055242
positions along a genetic map (say at 1 cM intervals) is tested for the
likelihood that
a gene controlling a trait of interest is located at that position. The
genotype/phenotype data are used to calculate for each test position a LOD
score
(log of likelihood ratio). When the LOD score exceeds a threshold value, there
is
significant evidence for the location of a gene controlling the trait of
interest at that
position on the genetic map (which will fall between two particular marker
loci).
The present invention provides molecular marker loci that demonstrate co-
segregation with resistance to tropical rust as determined by traditional
linkage
analysis (FIG. 3). Detection of these marker loci or additional linked marker
loci can
be used in marker assisted maize breeding programs to produce plants with
enhanced resistance to tropical rust or to eliminate plants with an
unfavorable
tropical rust phenotype from breeding programs or planting.
Markers associated with resistance to tropical rust
Markers associated with resistance to tropical rust are identified herein, as
are marker alleles associated with either increased (enhanced) or decreased
resistance to tropical rust. The methods involve detecting the presence of one
or
more marker alleles associated with the enhanced resistance in a maize plant
or
germplasm. The maize plant can be a hybrid or an inbred.
The marker locus can be selected from any of the marker loci provided
herein, including but not limited to the SNP production markers PHM1192-26-U,
PHM1192-4-U, C00435-802-U, 000436-801-U, PHM187-7-U, 000423-801-U,
PHM5028-24-U, PHM13818-15-U, PHM15721-39-U, PHM15721-180-U, C00441-
801-U, C00441-802-U, PHM4370-19-U, PHM731-107-U, C00071-01-U, PHM8249-
21-U, 000428-801-U, PHM18427-13-U, PHM9535-10-U, PHM9535-6-U, PHM9535-
7-U, and PHM4003-13-U; the PHM markers PHM15590, PHM13818, PHM1192,
PHM187, PHM5028, PHM4370, PHM731, and PHM15721; Sub2e, Sub9d, Subl9c,
Sub23m, C06621-1-K2, and C06621-1-K4, as well as any other marker linked to
these markers.
Physical map location of the interval comprising the tropical rust resistance
gene
The genetic elements or genes located on a contiguous linear span of
genomic DNA on a single chromosome are physically linked.
The present invention provides molecular marker loci on an area of
chromosome 10 defined by and including PHM15590 and PHM15721, thereby
31
WO 2011/056836 PCT/US2010/055242
delineating a region comprising a gene that confers resistance to tropical
rust.
PHM15590 is located on BAC c0497L12, and PHM15721 is located on b0191 E02.
Any polynucleotide that can hybridize or assemble to the contiguous DNA
between
and including SEQ ID NO:89 (the reference sequence for PHM15590), or a
nucleotide sequence that is 95% identical to SEQ ID NO:89 based on the Clustal
V
method of alignment, and SEQ ID NO:96 (the reference sequence for PHM15721 or
a nucleotide sequence that is 95% identical to SEQ ID NO:96 based on the
Clustal
V method of alignment, and that is associated with tropical rust resistance
can be
used as a marker for tropical rust. This physical region encompasses marker
loci
that are shown herein to be associated with the tropical rust resistance
trait.
FIG.1 shows the physical map arrangement of the sequenced B73 BACs that
make up the contiguous stretch of DNA between and including BAC c0497L12 and
BAC c0352EO9. The gaps (represented by open spaces) are not gaps in the
contiguous stretch of DNA per se but are areas where genome sequencing
information is incomplete.
Linkage relationships
A common measure of linkage is the frequency with which traits cosegregate.
This can be expressed as a percentage of cosegregation (recombination
frequency)
or in centiMorgans (cM). The cM is a unit of measure of genetic recombination
frequency. One cM is equal to a 1 % chance that a trait at one genetic locus
will be
separated from a trait at another locus due to crossing over in a single
generation
(meaning the traits segregate together 99% of the time). Because chromosomal
distance is approximately proportional to the frequency of crossing over
events
between traits, there is an approximate physical distance that correlates with
recombination frequency.
Marker loci are themselves traits and can be assessed according to standard
linkage analysis by tracking the marker loci during segregation. Thus, one cM
is
equal to a 1 % chance that a marker locus will be separated from another
locus, due
to crossing over in a single generation.
The closer a marker is to gene controlling a trait of interest, the more
effective
and advantageous that marker is as an indicator for the desired trait. Closely
linked
loci display an inter-locus cross-over frequency of about 10% or less,
preferably
about 9% or less, still more preferably about 8% or less, yet more preferably
about
32
WO 2011/056836 PCT/US2010/055242
7% or less, still more preferably about 6% or less, yet more preferably about
5% or
less, still more preferably about 4% or less, yet more preferably about 3% or
less,
and still more preferably about 2% or less. In highly preferred embodiments,
the
relevant loci (e.g., a marker locus and a target locus) display a
recombination
frequency of about 1 % or less, e.g., about 0.75% or less, more preferably
about
0.5% or less, or yet more preferably about 0.25% or less. Thus, the loci are
about
cM, 9 cM, 8 cM, 7 cM, 6 cM, 5 cM, 4 cM, 3 cM, 2 cM, 1 cM, 0.75 cM, 0.5 cM or
0.25 cM or less apart. Put another way, two loci that are localized to the
same
chromosome, and at such a distance that recombination between the two loci
10 occurs at a frequency of less than 10% (e.g., about 9%, 8%, 7%, 6%, 5%, 4%,
3%,
2%, 1 %, 0.75%, 0.5%, 0.25%, or less) are said to be "proximal to" each other.
Although particular marker alleles can show co-segregation with the tropical
rust resistance phenotype, it is important to note that the marker locus is
not
necessarily part of a gene or QTL locus responsible for the expression of the
tropical rust resistance phenotype. For example, it is not a requirement that
the
marker polynucleotide sequence be part of a gene that imparts tropical rust
resistance (for example, be part of the gene open reading frame). The
association
between a specific marker allele with either a favorable or unfavorable
tropical rust
resistance phenotype is due to the original "coupling" linkage phase between
the
marker allele and the founder allele in the ancestral maize line. Eventually,
with
repeated recombination, crossing over events between the marker and the
genetic
locus can change this orientation. For this reason, the favorable marker
allele may
change depending on the linkage phase that exists within the resistant parent
used
to create segregating populations. This does not change the fact that the
marker
can be used to monitor segregation of the phenotype. It only changes which
marker
allele is considered favorable in a given segregating population.
Markers provided herein can be used to predict the state of the tropical rust
resistance trait in a maize plant. This includes any marker within 20, 10, 9,
8, 7, 6,
5, 4, 3, 2, 1, 0.9, 0.8, 0.7, 0.6, 0.5, 0.4, 0.3, 0.2, or 0.1 cM of any of the
SNP
production markers PHM1192-26-U, PHM1192-4-U, C00435-802-U, C00436-801-U,
PHM187-7-U, 000423-801-U, PHM5028-24-U, PHM1 381 8-1 5-U, PHM15721-39-U,
PHM15721-180-U, C00441-801-U, C00441-802-U, PHM4370-19-U, PHM731-107-
U, 000071-01-U, PHM8249-21-U, 000428-801-U, PHM18427-13-U, PHM9535-10-
33
WO 2011/056836 PCT/US2010/055242
U, PHM9535-6-U, PHM9535-7-U, and PHM4003-13-U; the PHM markers
PHM15590, PHM13818, PHM1192, PHM187, PHM5028, PHM4370, PHM731, and
PHM15721; and the other markers identified herein, Sub2e, Sub9d, Subl9c,
Sub23m, C06621-1-K2, and C06621-1-K4.
Chromosomal intervals
A variety of methods well known in the art are available for identifying
chromosomal intervals. The boundaries of such chromosomal intervals are drawn
to encompass markers that will be linked to the gene controlling the trait of
interest.
In other words, the chromosomal interval is drawn such that any marker that
lies
within that interval (including the terminal markers that define the
boundaries of the
interval) can be used as markers for tropical rust resistance.
Chromosomal intervals encompassing markers that co-segregate with
tropical rust resistance are provided . These intervals are located on
chromosome
10 and may be defined by and include:
(i) PHM15590 and PHM9535;
(ii) PHM15590 and PHM15721;
(iii) C00441 and c00428;
(iv) PHM731 and PHM15721; or
(v) c00071 and PHM731.
Any marker located within any of these intervals can find use as a marker for
tropical rust resistance.
Chromosomal intervals can also be defined by markers that are linked to
(show linkage disequilibrium with) a QTL marker, and r2 is a common measure of
linkage disequilibrium (LD) in the context of association studies. If the r2
value of LD
between a chromosome 10 marker locus lying within the interval of PHM15590 and
PHM9535, for example, and another chromosome 10 marker locus in close
proximity is greater than 1/3 (Ardlie et al., Nature Reviews Genetics 3:299-
309
(2002)), the loci are in linkage disequilibrium with one another.
Marker alleles and haplotypic combinations
A marker of the invention can also be a combination of alleles at one or more
marker loci (i.e. a haplotype). The alleles described below could be used
alone or in
combination to identify and select maize plants with enhanced tropical rust
resistance.
34
WO 2011/056836 PCT/US2010/055242
Favorable alleles associated with enhanced tropical rust resistance have
been identified herein. One such allele is a "T" deletion at position 16 of
PHMTR
(SEQ ID NO:155). FIG. 7 shows a part of the reference sequence (top) obtained
by
the genotyping of maize lines resistant and susceptible to tropical rust using
PCR
primers (SEQ ID NO: 133 and 134) designed for clone ID Ct905OcO64G11 c (Table
9). SEQ ID NOs: 137-142 represent amplicons obtained from resistant lines, and
SEQ ID NOs: 143-154 represent amplicons obtained from susceptible lines. The
area highlighted in grey represents a 21 bp-region of the reference sequence
(referred to as PHMTR; SEQ ID NO:155). Maize lines having a T-deletion at bp
16
of PHMTR (indicated by the arrow) all showed enhanced resistance to tropical
rust.
Maize lines having an intact PHMTR region all showed sensitivity to tropical
rust.
Tables 7 and 8 also show chromosome 10 markers that have been
successfully used in combination to convert susceptible inbreds into resistant
inbreds using PHS6Y as the source. The alleles possessed by PHS6Y at each of
the markers can be used in combination (as a haplotype) to identify and select
plants with enhanced resistance to tropical rust.
While a haplotype associated with enhanced resistant to tropical rust may
comprise any of the favorable alleles described herein (including the "T"
deletion at
position 16 of PHMTR and any of the marker alleles possessed by the resistant
line
PHS6Y in Tables 7 and 8), the "GAG" haplotype at positions 337-339 of
reference
sequence SEQ ID NO:167 was shown to be associated with enhanced resistance to
tropical rust and can be used in a marker assisted selection program to select
for
maize plants with enhanced resistance to tropical rust.
The skilled artisan would expect that there might be additional polymorphic
sites at marker loci in and around the chromosome 10 markers identified
herein,
wherein one or more polymorphic sites is in linkage disequilibrium (LD) with
an
allele at one or more of the polymorphic sites in the haplotype. Two
particular
alleles at different polymorphic sites are said to be in LD if the presence of
the allele
at one of the sites tends to predict the presence of the allele at the other
site on the
same chromosome (Stevens, Mol. Diag. 4:309-17 (1999)).
The skilled artisan would understand that allelic frequency (and hence,
haplotype frequency) can differ from one germplasm pool to another. Germplasm
pools vary due to maturity differences, heterotic groupings, geographical
WO 2011/056836 PCT/US2010/055242
distribution, etc. As a result, SNPs and other polymorphisms may not be
informative
in some germplasm pools.
Marker assisted selection
Molecular markers can be used in a variety of plant breeding applications
(e.g. see Staub et al. (1996) Hortscience 31: 729-741; Tanksley (1983) Plant
Molecular Biology Reporter. 1: 3-8). One of the main areas of interest is to
increase
the efficiency of backcrossing and introgressing genes using marker-assisted
selection (MAS). A molecular marker that demonstrates linkage with a locus
affecting a desired phenotypic trait provides a useful tool for the selection
of the trait
in a plant population. This is particularly true where the phenotype is hard
to assay,
e.g. many disease resistance traits, or, occurs at a late stage in plant
development,
e.g. kernel characteristics. Since DNA marker assays are less laborious and
take
up less physical space than field phenotyping, much larger populations can be
assayed, increasing the chances of finding a recombinant with the target
segment
from the donor line moved to the recipient line. The closer the linkage, the
more
useful the marker, as recombination is less likely to occur between the marker
and
the gene causing the trait, which can result in false positives. Having
flanking
markers decreases the chances that false positive selection will occur as a
double
recombination event would be needed. The ideal situation is to have a marker
in
the gene itself, so that recombination cannot occur between the marker and the
gene. Such a marker is called a 'perfect marker'.
When a gene is introgressed by MAS, it is not only the gene that is
introduced but also the flanking regions (Gepts. (2002). Crop Sci; 42: 1780-
1790).
This is referred to as "linkage drag." In the case where the donor plant is
highly
unrelated to the recipient plant, these flanking regions carry additional
genes that
may code for agronomically undesirable traits. This "linkage drag" may also
result in
reduced yield or other negative agronomic characteristics even after multiple
cycles
of backcrossing into the elite maize line. This is also sometimes referred to
as "yield
drag." The size of the flanking region can be decreased by additional
backcrossing,
although this is not always successful, as breeders do not have control over
the size
of the region or the recombination breakpoints (Young et al. (1998) Genetics
120:579-585). In classical breeding it is usually only by chance that
recombinations
are selected that contribute to a reduction in the size of the donor segment
36
WO 2011/056836 PCT/US2010/055242
(Tanksley et al. (1989). Biotechnology 7: 257-264). Even after 20 backcrosses
in
backcrosses of this type, one may expect to find a sizeable piece of the donor
chromosome still linked to the gene being selected. With markers however, it
is
possible to select those rare individuals that have experienced recombination
near
the gene of interest. In 150 backcross plants, there is a 95% chance that at
least
one plant will have experienced a crossover within 1 cM of the gene, based on
a
single meiosis map distance. Markers will allow unequivocal identification of
those
individuals. With one additional backcross of 300 plants, there would be a 95%
chance of a crossover within 1 cM single meiosis map distance of the other
side of
the gene, generating a segment around the target gene of less than 2 cM based
on
a single meiosis map distance. This can be accomplished in two generations
with
markers, while it would have required on average 100 generations without
markers
(See Tanksley et al., supra). When the exact location of a gene is known, a
series
of flanking markers surrounding the gene can be utilized to select for
recombinations in different population sizes. For example, in smaller
population
sizes, recombinations may be expected further away from the gene, so more
distal
flanking markers would be required to detect the recombination.
The availability of integrated linkage maps of the maize genome containing
increasing densities of public maize markers has facilitated maize genetic
mapping
and MAS. See, e.g. the IBM2 Neighbors maps, which are available online on the
MaizeGDB website.
The key components to the implementation of MAS are: (i) Defining the
population within which the marker-trait association will be determined, which
can
be a segregating population, or a random or structured population; (ii)
monitoring
the segregation or association of polymorphic markers relative to the trait,
and
determining linkage or association using statistical methods; (iii) defining a
set of
desirable markers based on the results of the statistical analysis, and (iv)
the use
and/or extrapolation of this information to the current set of breeding
germplasm to
enable marker-based selection decisions to be made. The markers described in
this disclosure, as well as other marker types such as SSRs and FLPs, can be
used
in marker assisted selection protocols..
SSRs can be defined as relatively short runs of tandemly repeated DNA with
lengths of 6 bp or less (Tautz (1989) Nucleic Acid Research 17: 6463-6471;
Wang et
37
WO 2011/056836 PCT/US2010/055242
al. (1994) Theoretical and Applied Genetics, 88:1-6) Polymorphisms arise due
to
variation in the number of repeat units, probably caused by slippage during
DNA
replication (Levinson and Gutman (1987) Mol Biol Evol 4: 203-221). The
variation in
repeat length may be detected by designing PCR primers to the conserved non-
repetitive flanking regions (Weber and May (1989) Am J Hum Genet. 44:388-396).
SSRs are highly suited to mapping and MAS as they are multi-allelic,
codominant,
reproducible and amenable to high throughput automation (Rafalski et al.
(1996)
Generating and using DNA markers in plants. In: Non-mammalian genomic
analysis:
a practical guide. Academic press. Pp 75-135).
Various types of SSR markers can be generated, and SSR profiles from
resistant lines can be obtained by gel electrophoresis of the amplification
products.
Scoring of marker genotype is based on the size of the amplified fragment. An
SSR
service for maize is available to the public on a contractual basis by DNA
Landmarks in Saint-Jean-sur-Richelieu, Quebec, Canada.
Various types of FLP markers can also be generated. Most commonly,
amplification primers are used to generate fragment length polymorphisms. Such
FLP markers are in many ways similar to SSR markers, except that the region
amplified by the primers is not typically a highly repetitive region. Still,
the amplified
region, or amplicon, will have sufficient variability among germplasm, often
due to
insertions or deletions, such that the fragments generated by the
amplification
primers can be distinguished among polymorphic individuals, and such indels
are
known to occur frequently in maize (Bhattramakki et al. (2002). Plant Mol Biol
48,
539-547; Rafalski (2002b), supra).
SNP markers detect single base pair nucleotide substitutions. Of all the
molecular marker types, SNPs are the most abundant, thus having the potential
to
provide the highest genetic map resolution (Bhattramakki et al. 2002 Plant
Molecular
Biology 48:539-547). SNPs can be assayed at an even higher level of throughput
than SSRs, in a so-called ultra-high-throughput' fashion, as they do not
require
large amounts of DNA and automation of the assay may be straight-forward. SNPs
also have the promise of being relatively low-cost systems. These three
factors
together make SNPs highly attractive for use in MAS. Several methods are
available for SNP genotyping, including but not limited to, hybridization,
primer
extension, oligonucleotide ligation, nuclease cleavage, minisequencing and
coded
38
WO 2011/056836 PCT/US2010/055242
spheres. Such methods have been reviewed in: Gut (2001) Hum Mutat 17 pp. 475-
492; Shi (2001) Clin Chem 47, pp. 164-172; Kwok (2000) Pharmacogenomics 1, pp.
95-100; Bhattramakki and Rafalski (2001) Discovery and application of single
nucleotide polymorphism markers in plants. In: R. J. Henry, Ed, Plant
Genotyping:
The DNA Fingerprinting of Plants, CABI Publishing, Wallingford. A wide range
of
commercially available technologies utilize these and other methods to
interrogate
SNPs including Masscode.TM. (Qiagen), Invader® (Third Wave Technologies),
SnapShot® (Applied Biosystems), Taqman® (Applied Biosystems),
KASPar assays by Kbioscience, and Beadarrays.TM. (Illumina).
A number of SNPs together within a sequence, or across linked sequences,
can be used to describe a haplotype for any particular genotype (Ching et al.
(2002),
BMC Genet. 3:19 pp Gupta et al. 2001, Rafalski (2002b), Plant Science 162:329-
333). Haplotypes can be more informative than single SNPs and can be more
descriptive of any particular genotype. For example, a single SNP may be
allele 'T'
for a specific line or variety with enhanced resistance to tropical rust, but
the allele
'T' might also occur in the maize breeding population being utilized for
recurrent
parents. In this case, a haplotype, e.g. a series of alleles at linked SNP
markers,
may be more informative. Once a unique haplotype has been assigned to a donor
chromosomal region, that haplotype can be used in that population or any
subset
thereof to determine whether an individual has a particular gene. See, for
example,
W02003054229. Using automated high throughput marker detection platforms
known to those of ordinary skill in the art makes this process highly
efficient and
effective.
Many of the primers listed in Table 2 can readily be used as FLP markers to
select for the gene locus or QTL on chromosome 10 controlling resistance to
tropical rust, owing to the presence of insertions/deletion polymorphisms.
These
primers can also be used to convert these markers to SNP or other structurally
similar or functionally equivalent markers (SSRs, CAPs, indels, etc), in the
same
regions. One very productive approach for SNP conversion is described by
Rafalski
(2002a) Current opinion in plant biology 5 (2): 94-100 and also Rafalski
(2002b)
Plant Science 162: 329-333. Using PCR, the primers are used to amplify DNA
segments from individuals (preferably inbred) that represent the diversity in
the
population of interest. The PCR products are sequenced directly in one or both
39
WO 2011/056836 PCT/US2010/055242
directions. The resulting sequences are aligned and polymorphisms are
identified.
The polymorphisms are not limited to single nucleotide polymorphisms (SNPs),
but
also include indels, CAPS, SSRs, and VNTRs (variable number of tandem
repeats).
Specifically with respect to the fine map information described herein, one
can
readily use the information provided herein to obtain additional polymorphic
SNPs
(and other markers) within the region amplified by the primers listed in this
disclosure. Markers within the described map region can be hybridized to BACs
or
other genomic libraries, or electronically aligned with genome sequences, to
find
new sequences in the same approximate location as the described markers.
In addition to SSR's, FLPs and SNPs, as described above, other types of
molecular markers are also widely used, including but not limited to expressed
sequence tags (ESTs), SSR markers derived from EST sequences, randomly
amplified polymorphic DNA (RAPD), and other nucleic acid based markers.
Isozyme profiles and linked morphological characteristics can, in some
cases, also be indirectly used as markers. Even though they do not directly
detect
DNA differences, they are often influenced by specific genetic differences.
However, markers that detect DNA variation are far more numerous and
polymorphic than isozyme or morphological markers (Tanksley (1983) Plant
Molecular Biology Reporter 1:3-8).
Sequence alignments or contigs may also be used to find sequences
upstream or downstream of the specific markers listed herein. These new
sequences, close to the markers described herein, are then used to discover
and
develop functionally equivalent markers. For example, different physical
and/or
genetic maps are aligned to locate equivalent markers not described within
this
disclosure but that are within similar regions. These maps may be within the
maize
species, or even across other species that have been genetically or physically
aligned with maize, such as rice, wheat, barley or sorghum.
In general, MAS uses polymorphic markers that have been identified as
having a significant likelihood of co-segregation with tropical rust
resistance. Such
markers are presumed to map near a gene or genes that give the plant its
tropical
rust resistance phenotype, and are considered indicators for the desired
trait, or
markers. Plants are tested for the presence of a desired allele in the marker,
and
plants containing a desired genotype at one or more loci are expected to
transfer
WO 2011/056836 PCT/US2010/055242
the desired genotype, along with a desired phenotype, to their progeny.
The markers and intervals presented herein find use in MAS to select plants
that demonstrate enhanced resistance to tropical rust.
Methods for selection can involve detecting the presence (or absence) of
either an identified marker allele or an unknown marker allele that is linked
to and
associated with an identified marker allele in a maize plant or germplasm and
then
selecting the maize plant or germplasm based on the allele detected. Favorable
alleles identified herein that could be detected in MAS include: the "T"
deletion at
position 16 of PHMTR and any of the marker alleles possessed by PHS6Y in
Tables
7 and 8. In addition, favorable haplotypes, such as the "GAG" haplotype at
positions 337-339 of reference sequence SEQ ID NO:167, can also be used in MAS
to introduce enhanced resistance to tropical rust into susceptible maize lines
or
varieties.
Usefulness of MAS for Enhancing Resistance to Tropical Rust in Maize
Maize plant breeders desire combinations of desired genetic loci, such as
those marker alleles associated with enhanced resistance to tropical rust,
with
genes for high yield and other desirable traits to develop improved maize
varieties.
Screening large numbers of samples by non-molecular methods (e.g., trait
evaluation in maize plants) can be expensive, time consuming, and unreliable.
Use
of the polymorphic markers described herein, when genetically-linked to
resistance
to tropical rust loci, provide an effective method for selecting varieties
with enhanced
resistance to tropical rust in breeding programs. For example, one advantage
of
marker-assisted selection over field evaluations for the selection of plants
that have
enhanced resistance to tropical rust is that MAS can be done at any time of
year,
regardless of the growing season. Moreover, environmental effects are largely
irrelevant to marker-assisted selection.
Another use of MAS in plant breeding is to assist the recovery of the
recurrent parent genotype by backcross breeding. Backcross breeding is the
process of crossing a progeny back to one of its parents or parent lines.
Backcrossing is usually done for the purpose of introgressing one or a few
loci from
a donor parent (e.g., a parent comprising enhanced resistance to tropical rust
marker loci) into an otherwise desirable genetic background from the recurrent
parent (e.g., an otherwise high yielding maize line). The more cycles of
41
WO 2011/056836 PCT/US2010/055242
backcrossing that are done, the greater the genetic contribution of the
recurrent
parent to the resulting introgressed variety. This is often necessary, because
plants
may be otherwise undesirable, e.g., due to low yield, low fecundity, or the
like. In
contrast, strains which are the result of intensive breeding programs may have
excellent yield, fecundity or the like, merely being deficient in one desired
trait such
as resistance to tropical rust.
MAS can increase the efficiency of an introgression or backcrossing effort
aimed at introducing enhanced resistance to tropical rust into a desired
(typically
high yielding) background. In marker assisted backcrossing of specific markers
from a donor source, e.g., to an elite or exotic genetic background, one
selects
among backcross progeny for the donor trait and then uses repeated
backcrossing
to the elite or exotic line to reconstitute as much of the elite/exotic
background's
genome as possible.
Multiple stages cluster methodology
A multiple stages cluster methodology can be used to direct primer design
into non-random variation. This method uses phylogenetic trees and a
sequential
alignment process to identify unique regions containing allelic variations
exclusive to
lines with a desired trait. If any given sequence in a BAC collection contains
a
variation in DNA to be related to a trait, this variation can be
hidden/confounded by
other independent and random variations within the same BAC, therefore a
single
alignment may not be effective in detecting the targeted variation(s). The
first stage
of this process involves an alignment of raw sequences with an open:extension
cost
ratio greater than 10. The second stage consists of trimming the tails (noise)
and
realigning the original sequence, whose cluster will already indicate the BAC
potential for bearing a region of interest. Subsequent stages consist of
upstream or
downstream trimming of random allelic variation, i.e., alleles inside the
sequence
that showed diversity across any phenotype. UPGMA (Unweighted Pair Group
Method with Arithmetic Mean) can then be applied to the resulting alignment
until a
phenogram identifies a unique cluster exclusive to lines having a desired
trait or
phenotype. The final cluster can then be used to identify the specific
variation that
will be used for primer design to generate a trait specific marker.
42
WO 2011/056836 PCT/US2010/055242
EXAMPLES
The following examples are offered to illustrate, but not to limit, the
appended
claims. It is understood that the examples and embodiments described herein
are
for illustrative purposes only and that persons skilled in the art will
recognize various
reagents or parameters that can be altered without departing from the spirit
of the
invention or the scope of the appended claims.
EXAMPLE 1
Phenotypic Assessment of Enhanced Resistance to Tropical and Southern Rust
Maize plants were inoculated in the field with Physopella zeae to promote
symptoms of tropical rust. Three inoculations were done starting at the V10
stage
(each inoculation with -500,000 spores per ml to a total volume of 200 liters
per
hectare).
Maize plants were evaluated for enhanced resistance to southern rust
(pathogen Puccinia polysora) based on natural infection conditions in a field
located
in Itumbiara, Brazil
Tropical rust develops from the top of the plant to the bottom of the plant,
while southern rust moves from the bottom of the plant to the top. Thus, in
the
same plant, it is possible to observe symptoms of both tropical and southern
rust
diseases.
Two systems were used to score the plants in the field at the R2 stage
(around 20 days after pollination time). The first system is on a 1 to 9
scale, where
1 = most susceptible and 9 = most resistant, while the second system
corresponds
to the Modified International Standard Scale for Rust (Table 4).
TABLE 4: Scoring Scales for Tropical and Southern Rust
International PiONEER
Symbol Scale Description of the host: Parasite interaction
Oi 9 Immune - No signs of infection
Oc 8 Highly resistant, minute chlorotic flecks
On 7 Highly resistant, minute necrotic flecks
Resistant, small pustules with necrotic
1 6 surrounding tissue
Mod. Resistant, medium size pustules with
2 5 necrotic sorrounding tissue
Mod. Susceptible, medium size pustules with
3 4 chlorotic surrounding tissue
43
WO 2011/056836 PCT/US2010/055242
Susceptible. Large pustules with little or no
4 2 chlorosis
Most Severe Mesotheric reaction. Mixed reaction types on
X score observed one leaf
EXAMPLE 2
Development of PHS6Y Inbred population
PHS6Y was developed using a pedigree selection scheme at the Itumbiara
Research Center in Brazil. Individual ears were selected in the F2 generation
from
a cross between PH7W3 and CML339. CML339 (Makumbi et al. Combining Ability
and Heterosis in Tropical Maize Inbreds under Stress and Optimal Conditions.
The
ASA-CSSA-SSSA International Annual Meetings (November 6-10, 2005), Salt Lake
City, UT.2005) is a line with enhanced resistance to tropical rust that was
obtained
from the International Maize and Wheat Improvement center (CIMMYT). Each
selected F2 ear was planted as an F3 row in the following generation. Three
ears
from each selected F3 row were then planted in the next generation, and the
best
F4 row was selected and the seed designated as PHS6Y inbred seed. All
selections were performed based on the tropical rust resistance phenotype.
EXAMPLE 3
Segregation for Tropical Rust Resistance Indicates that a Single Dominant Gene
is
Responsible for Conferring Tropical Rust Resistance
An F2 population was developed from a cross between PH468, an inbred
susceptible to tropical rust, and PHS6Y, the inbred identified in EXAMPLE 2.
Frequency distributions demonstrating the tropical and southern rust scores
for
individuals in the PH468 x PHS6Y F2 population are shown in FIGs. 2A and 2B,
respectively. Each distribution indicates a segregation ratio of 3 resistant
(scores >
5 on the 1-9 scale): 1 susceptible (scores < 5 on the 1-9 scale) for tropical
rust (FIG.
2A) and for southern rust (FIG. 2B).
Table 5 shows a Chi-square test which provides evidence for the presence of
a single dominant gene that confers resistance to tropical rust, wherein the
favorable genotype is present in the PHS6Y inbred. Results also show that a
single
dominant gene confers resistance to southern rust. However, based on genetic
recombination frequencies between tropical and southern resistance in two F2
populations in which PHS6Y is a parent, the genes that confer resistance
appear to
44
WO 2011/056836 PCT/US2010/055242
be different for tropical and southern rust (Table 6).
TABLE 5
Chi-square Test Results for PH468xPHS6Y F2 Population
Population PH468/PHS6Y
Tropical rust score
# Plants p-value CHI-Square
<5 ?5
Observed 305 84 0.128 2.321
Expected 292 97
Southern rust score
# Plants p-value CHI-Square
<5 ?5
Observed 298 91 0.482 0.494
Expected 292 97
Table 6 shows the genetic recombination frequencies between tropical and
southern
resistance in two F2 populations with PHS6Y. Control is another F2 population
where both tropical and southern rust traits are also segregating but in an
independent manner.
TABLE 6.
Genetic Recombination Between Tropical and Southern Resistance in Two F2
Populations with PHS6Y as a Parent
-0 (n -0
E a o
U _
o
m
0
F2 POPULATION
468/S6Y 13 389 3
467/S6Y 18 341 5
Control (7513126N) 126 342 37
468 = PH468; S6Y = PHS6Y; 467 = PH467
EXAMPLE 4
Composite Interval Mapping
A composite interval mapping approach that combines interval mapping with
linear regression was undertaken to identify maize chromosomal intervals and
markers associated with resistance to tropical rust. In an interval mapping
approach
WO 2011/056836 PCT/US2010/055242
(Lander and Botstein, Genetics 121:185-199 (1989)), each of many positions
along
the genetic map (say at 1 cM intervals) is tested for the likelihood that a
gene or
QTL controlling a trait of interest is located at that position. The
genotype/phenotype data are used to calculate for each test position a LOD
score
(log of likelihood ratio). When the LOD score exceeds a threshold value
(herein the
threshold value is 2.5), there is significant evidence for the location of a
gene or QTL
at that position on the genetic map (which will fall between two particular
marker
loci).
Windows QTL Cartographer (the most up-to-date version of this software was
used at the date of QTL mapping) was used to perform the composite interval
mapping. LOD scores (logarithm of the odds ratio) were estimated across the
genome according to standard QTL mapping procedures.
Results from composite interval mapping for resistance to tropical rust using
the PH468 x PHS6Y F2 population are shown in FIG. 3. The composite interval
mapping analysis detected a large effect QTL on chromosome 10 (FIG. 3) located
between markers C00441-801 and C00428-801. The linkage map used for
composite interval mapping was an internally-derived proprietary genetic map
(identified herein as "PHB") for which the genetic distances correspond to a
single
meiosis recombination fraction. Marker positions on the x-axis correspond to
the
PHB genetic map. The y-axis represents the LOD score.
EXAMPLE 5
Backcrossing of the Tropical Rust Resistance Locus from PHS6Y into Susceptible
Inbred Lines
The tropical rust resistant inbred line PHS6Y was elected as the donor parent
for the backcrossing program. This inbred line carries a favorable allele
within the
segment of Chromosome 10 harboring the tropical rust gene. In the initial
backcrossing program, four inbred lines (PH9VF, PHDGA, PH467 and PHOTJ) were
elected to be converted with the tropical rust resistance locus from PHS6Y.
Each inbred line (PH9VF, PHDGA, PH467 and PHOTJ) was crossed to
PHS6Y. After obtaining F1 seed from each cross, five subsequent backcrosses
were performed in which the susceptible parent was used as the recurrent
parent.
Two generations a year were evaluated to accelerate the process, one in North
of
46
WO 2011/056836 PCT/US2010/055242
Brazil at the Balsas Winter Nursery location and the other at Itumbiara
Research
Center. In the first backcross, only phenotypic selection was done at
Itumbiara
center. In subsequent backcrosses, marker-assisted selection was performed.
The
backcrossing process was followed by two generations of selfing to fix the
resistant
allele in each inbred.
Three to six markers were used in the process of converting each inbred
(Table 7). The markers were used in the Backcross 2 (BC2) generation up to the
BC4 generation as well as for the identification of homozygous plants carrying
the
resistance alleles at BC4F2.
Table 7 shows the markers on Chromosome 10 that were used for
introgressing the resistance locus from PHS6Y into inbreds PH9VF, PHDGA,
PH467, and PHOTJ, and the polymorphisms between each susceptible inbred and
PHS6Y.
Other inbreds were converted to have the tropical rust resistance locus from
PHS6Y. The conversions were done similarly as described above except more
markers were used for the conversion. Table 8 shows the markers on Chromosome
10 that were used for introgressing the resistance locus from PHS6Y into 18
inbreds
and the polymorphisms between each susceptible inbred and PHS6Y.
TABLE 7
Chromosome 10 Markers Used for Conversion of Four Inbreds
PHB 4 9.7 12.6 12.6 15 18.2 19.5 20.4 24.2 24.2 24.2 25.4
O N 0 a0 10 co
o O Pr M
N N r O N r
N 00 9i i Lf') LO LO A
co co co 0
M M
0 LO ~ O ONO co C) O O 0
LO r-
O
d d 2a d U d o d d d o d
INBRED
PHS6Y 1,1 4,4 2,2 6,6 6,6 2,2 2,2 6,6 3,3 1,1 3,3 2,2
'
PH9VF 1,1 4,4 2,2 2 2 6 6 ' ' '' ' > ' ' > 2 2
47
WO 2011/056836 PCT/US2010/055242
PHDGA 1,1 2,2 6,6 `<< `} 2,2 6,6 3,3 1,1 3,3 2,2
PH467 1 1 2.2 2 23 3
PHOTJ d 6 6 6 6 2.2 6,6 3,3 1,1 3 3 2 2
1 = "A", 2 = "C", 3 = "G", 4 = "T", 5 = "I" or insertion, 6 = "D" or deletion
Table 8
Chromosome 10 Markers Used for Conversion of Eighteen Inbreds
PHM1192- PHM1192- PHM13818- PHM15721-
C00071-01 26 4 15 180
PHS6Y 6,6 1,1 5,5 2,2 2,2
P H 92 E 6,6 1,1 2,2 PHOR8 6,6 n/a n/a 2,4
PHOTJ 66 55 22
PH1BC 6,6 1 1 2,2
PHS6M 6,6 5,5 2,2 2,2
PHKTE 6,6 n/a n/a 2,4
PHS7S 5, 1,1 5,5 2,2 2,2
PH9TJ 55 1,1 5,5 2,2 2,2
PHBNF 5, 1,1 5,5 2,2 2,2
PHD18 1,1 5,5 2,2 2,4
PHR33 6,6 5,5 2,2 2,4
PH9VC 6,6 1,1 , 2,2 2,2
...............................
PHKNC 1,1 n/a 2,2 2,2
PH819 6,6 1,1 2,2 2,2
PHKNF 6,6 1,1 5,5 2,2 2,2
PH9V7 55 f 1,1 5,5 2,2 2,2
PHDNV 1 1 5,5 2,2
PHM 3 M 1 1 5,5
2,2
PHM15721- PHM18427- PHM4003-
39 13 PHM187-7 13 PH M4370-19
PHS6Y 6,6 6,6 1,1 2,2 3,3
..................................
..................................
..................................
..................................
PH92E n/a 1,1 2,2 3,3
PHOR8 n/a 6,6n/a 2,2 3,3
...............................
...............................
...............................
...............................
PHOTJ 6,6 6,6 3a 2,2 3,3
...............
PH1BC 6,6 1,1 2,2 3,3
PHS6M n/a n/a.......... 2,2 3,3
PHKTE 6,6 6,6 2,2 3,3
..............................
PHS7S 6,6 1,1 2,2 3,3
PH9TJ 6,6 ............. 6,6 1,1 2,4 3,3
PHBNF 6,6 6,6 1,1 2,2 3,3
48
WO 2011/056836 PCT/US2010/055242
PHD18 6,6 6,6 1,1 2,2 3,3
...............................
...............................
...............................
...............................
PHR33 6,6 6,6 2,2 3,3
PH9VC ......... 1'1............ 2,2 ........
..................................
..................................
..................................
..................................
PHKNC 6,6 1,1 2,2 3,3
P H 819 ''55 1 1 2 2 7'T>
PHKNFr 6,6 1,1 2,2 3,3
PH9V7 6,6 ............. 6,6 1,1 n/a 3,3
PHDNV 6,6 6,6 1,1 2,2 3,3
..................................
.................................
..................................
.................................
PHM3M 6,6 6,6 n/a 3,3
PHM5028- PHM731- PHM9535-
24 107 10 PHM9535-6 PHM9535-7
PHS6Y 4,4 2,2 3,3 1,1 3,3
PH92E 4,4 2,2 3,3 1,1 3,3
...................................................................
...................................................................
...................................................................
...................................................................
PHOR8 2 4 4 3 3 1 1 3 3
P H OTJ' 3 3 1 1 3 3
PH1BC 44 n /a n /a
PHS6M '' n /a 3,3 4'' 14
PHKTE n/a 3,3 1,1 n/a
PHS7S 4,4 n /a
PH9TJ 4,4 2,2 3,3 3,3
PHBNF 4,4
PHD18 4,4 3,3 1,1 3,3
PHR33 3 3 1 1 3,3
PH9VC.......................... Q'F>>ll'?1 1 1 3,3
PHKNC 4,4
4 3 3 44
...................................................................::::::::::::
::::::::::::::::::::::.........................................................
............
2,2 1 1 3,3
P H819
PHKNF 4,4 A''F> ......... 3,3
>
PH9V7 4,4 2,2 3,3 44 3,3
PHDNV n/a 3,3 1,1 3,3
...........................
PHM3M 4,4 n /a 3,3
> l: > . n /a
C00435- 000423-
802-U C00436-801 801 C00441-801 C00441-802
PHS6Y 4,4 3,3 4,4 3,3 4,4
PH92E 1f .............: n/a.... .4f4............. n/a
PHOR8 n/a n/a n/a n/a n/a
...............................................................................
...............................................................................
........ .
...............................................................................
...............................................................................
......... .
...............................................................................
...............................................................................
........
...............................................................................
...............................................................................
.........
P H 1 BC 1`1 3,3 n /a n a
PHS6M
PHKTE n a1:::::>:......... n a
4::::>::::>::::>::::>::::>::::>::>::>::>`:::>::>::>::>::
.....................................................................
PHS7S 4,4 3,3 4,4 3,3 4,4
PH9TJ 4,4 3,3 2,2....,?.....,.. ...
.........
...............................................................................
......................
PHBNF n/a n/a n/a n/a n/a
PHD18 n/a n/a n/a n/a n/a
PHR33 22 44 .2,2. ....
...............................................................................
..................................................................::.:.:.......
...::::..
49
WO 2011/056836 PCT/US2010/055242
...................................................................
..................................
....................................................................
..................................
.....
PH9VC n/a n/a
PHKNC n/a n/a n/a n/a n/a
PH819 ............: 3,3 n/a,?.... n/a
PHKNF 4,4 n/a 4,4 n/a n/a
PH9V7 n/a n/a n/a n/a n/a
...............................................................................
.....................
...................
P H DN V n /a 2'2>? ?>
................:::::::::::.......................
...............................................................................
...................
PHM3M n/a n/a n/a n/a
C00428-801
PHS6Y 1,1
PH92E 1,1
..................................
.................................
..................................
.................................
PHOR8
P H OTJ
PH1BC 1,1
PHS6M 1,1
.................................
..................................
.................................
..................................
PH KTEf>
P H S7S>
P H 9TJ 1,1
PHBNF n/a
PHD18 n/a
..................................
.................................
..................................
.................................
..................................
PHR33>
P H 9VC Ã 33>
PHKNC n/a .............
..................................
.................................
..................................
.................................
..................................
P H 819>
PHKNF 3 3 .....> .
PH9V7 n/a .............
PHDNV 1,1
PHM3M 1,1
1 = "A", 2 = "C", 3 = "G", 4 = "T", 5 = "I" or insertion, 6 = "D" or deletion
EXAMPLE 6
Hybrid Production with Enhanced Resistance to Tropical Rust
The converted inbreds were used to make hybrids, and the field trial results
have shown that the excellent level of resistance seen in the converted
inbreds (for
example, FIG. 4) is maintained in hybrids made with the conversion inbreds
(FIG.5;
e.g. hybrid GEID6170295).
WO 2011/056836 PCT/US2010/055242
EXAMPLE 7
Genotyping of Maize Lines for Tropical Rust Resistance and Identification of
Polymorphisms Associated with Enhanced Tropical Rust Resistance
Genotyping of maize lines for tropical rust resistance
Resistant and susceptible lines were genotyped by Sanger re-sequencing of
genomic targets. The targets were PCR-amplified products from single-copy
genomic sections of the tropical rust QTL region mapped on the short arm of
chromosome 10.
Available public genomic sequence was used as reference for primer design.
The public sequence corresponds to inbred line B73 and was obtained by a BAC
minimum tiling path strategy (available on the Maize Genome Browser, which is
publicly available on the internet). The following sequenced BAC clones have
been
mapped to the region of interest: c0497112, c0284b0l, c0446110, c0340m14,
c0178k23, c0332e10, c0009k11, c0281 e11, c0230k24, b0286c12, c0044b04,
c0149n21, c0064gl 1, cOl 18o03, b0191 e02, c0462j05. While the order and
orientation of the BACs in the tiling path has been determined by
fingerprinting
(Nelson et al, 2005. Whole-Genome Validation of High-Information-Content
Fingerprinting. Plant Physiology. 139:27-38), the order and orientation of
sequence
contigs within each clone has not been fully determined. For this work,
internal
information on BAC overlap was used to further narrow the sequence order of
the 2-
2.5 Mb region into 24 sub-regions (FIG. 6).
The sequence includes large portions of highly repetitive DNA, mostly as
retrotransposon-like sequences. Multiple-copy sequence tracks were identified
and
removed from the sequence by masking repeats using Cross-match
(http://www.phrap.org). Low copy sequences were further identified and removed
by BLAST analysis.
PCR primers were initially designed to amplify 270 to 720-bp amplicons in
single-copy tracts spanning the 24 sub-regions in the chromosome 10 target
region
(Table 9). Primers sets were designed using proprietary tools based on Primer3
(Rozen, S. and Skaletsky, 2000, Primer3 on the WWW for general users and for
biologist programmers, Methods Mot Biol. 132:365-386.). Sequencing primers
M13R (5-GGAAACAGCTATGACCATG) and M13F (5-TGTAAAACGACGGCCAGT)
51
WO 2011/056836 PCT/US2010/055242
were added to the L and R primers, respectively, as tails to facilitate
sequencing.
Quality and uniqueness of PCR assays were validated by performing and
analyzing
preliminary PCR and sequencing on control DNA samples from lines B73 and
Mol 7. Maize-oat addition line amplification was used to further validate
assays.
PCR primers that produced amplified products in multiple addition lines or did
not
produce an amplified product exclusively in the chromosome 10 maize-oat
addition
line were discarded.
TABLE 9
PCR primers Designed to Amplify Products in the Chromosome 10 Target Region
L primer R primer
Namer region u B73 BAC Clone ID (no M13 (no M13 Size
(p)
tail) tail)
Sub2e 2 c049711-12 Ct9050c497L12e SEQ ID SEQ ID 616
NO: 129 NO: 130
Subl9d 19 c0064G11 Ct905OcO64G 11 d SEQ ID SEQ ID 601
NO: 131 NO: 132
Subl9c 19 c0064G11 Ct9050c064G11 c SEQ ID SEQ ID 649
NO: 133 NO: 134
Sub23m 23 c0462JO5 Ct905Obl91 E02m SEQ ID SEQ ID 605
NO: 135 NO: 136
PCR was performed on 10-30 ng DNA using HotStar Taq Polymerase Master
Mix (Qiagen), according to recommendations by the manufacturers with some
modifications. The total reaction volume was 10 pl and contained 5U HotStar
Taq
DNA polymerase, 1.5mM MgCI2, 200pM dNTPs and 5pM of each tailed primer.
PCR amplification was performed as follows: 1) 15-minute initial step at 95 C;
2) 40
cycles of 30 seconds at 95 C, 30 seconds at 60 C, 1 minute at 72 C; and 3)
final
extension step of 10 minutes at 72 C. PCR products were confirmed by gel
electrophoresis. One fifth (2pl) of the PCR reaction was diluted in 17pl of
sterile
distilled water and cleaned up with 0.5 to 0.75 pl ExoSAP-IT (USB
Corporation),
incubating at 37 C for 25min then 80 C for 25min.
Bidirectional cycle sequencing of PCR amplicons was performed using Big
Dye Terminator cycle sequencing protocols and capillary sequencing in Applied
Biosystems 3730 XL DNA analyzers. 3-5pl of the cleaned-up DNA was sequenced
using M13F and M13R oligonucleotides and the BigDye Prism sequencing kit (ABI;
52
WO 2011/056836 PCT/US2010/055242
version 3.1), according to manufacturer conditions. After cycle sequencing,
reaction
products were cleaned up by ethanol precipitation and processed on AB13730x1
automated sequencers (ABI), according to standard protocols.
Sequences were assembled using internal tools based on the Phrap, Phred
software, (Ewing et al, 1998, Basecalling of automated sequencer traces using
phred. 1. Accuracy assessment. Genome Research. 8:175-185; Ewing and Green,
1998, Basecalling of automated sequencer traces using phred. 11. Error
probabilities.
Genome Research. 8:186-194). Polymorphisms (single nucleotide and insertion-
deletions) were identified and tagged using the Consed sequence viewer
(Gordon,
2003, Viewing and Editing Assembled Sequences Using Consed, in Current
Protocols in Bioinformatics, A. D. Baxevanis and D. B. Davison (eds), New
York:
John Wiley & Co., 2004, 11.2.1-11.2.43). Generated SNP tables, assembly sets
and
consensus sequences were used to select appropriate polymorphisms for marker
development.
Identification of polymorphisms associated with enhanced resistance to
tropical rust
DNA fragments bearing a high level of internal diversity are more likely to
contain genes of interest. However, designing primers in these regions can be
difficult because primer design applications have a tendency to select areas
of
random variation for primer design. A multiple stages cluster methodology was
tested in order to direct primer design into non-random variation. This method
uses
phylogenetic trees and a sequential alignment process to identify unique
regions
containing allelic variations exclusive to lines with enhanced resistance to
tropical
rust. The first stage of this process involves an alignment of raw sequences
with an
open:extension cost ratio greater than 10. The second stage consists of
trimming
the tails (noise). Subsequent stages consist of trimming random allelic
variation,
i.e., alleles inside the sequence that showed diversity across any phenotype.
UPGMA (Unweighted Pair Group Method with Arithmetic Mean) is then applied to
the resulting alignment until a phenogram identifies a unique cluster
exclusive to
resistant lines.
One primer pair (SEQ ID NO:133 and SEQ ID NO:134) produced an
amplicon with the reference sequence (SEQ ID NO:155) that is referred to
herein as
PHMTR. All lines that showed resistance to tropical rust contained a T-
deletion of
bp 16 of PHMTR (the sequence of the PHMTR-T region is SEQ ID NO:156) while all
53
WO 2011/056836 PCT/US2010/055242
maize lines susceptible to tropical rust contained an intact PHMTR region (SEQ
ID
NO: 155).
FIG. 7 shows a part of the reference sequence (top) obtained by the
genotyping of maize lines resistant and susceptible to tropical rust using PCR
primers (SEQ ID NO: 133 and 134) designed for clone ID Ct9050c064G11 c (Table
9). SEQ ID NOs:137-142 represent amplicons obtained from resistant lines,
while
SEQ ID NOs:143-154 represent amplicons obtained from susceptible lines. The
area highlighted in grey represents a 21 bp-region of the reference sequence
(SEQ
ID NO:155).
Amplicon sequences were also obtained using primers SEQ ID NO:135 and
SEQ ID NO:136 (SEQ ID NO:167 is the reference sequence for this region) and
eight independent clusters. Table 10 shows 21 lines evaluated for the cluster
analysis. A GAG haplotype (at positions 337-339 of reference sequence SEQ ID
NO:1 67; see FIG. 8) was found to be unique to all lines with enhanced
resistance to
tropical rust (Table 10 and FIG. 8). Two new presence/absence markers were
developed to assay this haplotype, C06621-1-K2 and C06621-1-K4 (Table 3; SEQ
ID NOs: 157-164), using the KASPar assay techniques described on the
kbioscience website. C06621-1-K2 and C06621-1-K4 are X/P type markers, where
X indicates absence and P indicates presence. The P marker detects the GAG
polymorphism and the X marker detects ADH, an internal control gene, which is
used to show that the reaction worked. Eighteen lines were evaluated with the
C06621-1-K2 and C06621-1-K4 markers. All fit the expectation for both markers
(except one sample that had missing data) given their cluster analysis.
TABLE 10
Exclusive Haplotype in Lines with Enhanced Tropical Rust Resistance
Group Line Haplotype Trait
A PHS6Y GAG Tropical and Southern rust
A PH1 FT71 GAG Tropical and Southern rust
A PH1JG22 GAG Tropical and Southern rust
A PH1G3H1 GAG Tropical and Southern rust
A PH1JG01 GAG Tropical and Southern rust
B PH9VF ACA None
C A63 ACG None
C PH9PR ACG None
C PH7WC ACG None
C PH48F ACG None
54
WO 2011/056836 PCT/US2010/055242
C PHDGA ACG None
C A63-1 ACG None
C PH7W3 ACG None
C PHOTJ ACG None
D PHBNA GCG None
D Mo17 GCG None
D PH467 GCG None
D PH147G5 GCG Common rust
D PHP3P1 GCG Common rust
D PH1AGK1 GCG Common rust
D PHY7M2 GCG Common rust
The multiple stages cluster methodology proved to be an efficient method to
identify unique regions containing allelic variations exclusive to lines with
enhanced
resistance to tropical rust, and this methodology can be applied to any trait
of
interest.
EXAMPLE 8
Markers and/or Haplotypes for Use in Marker Assisted Selection of Maize Plants
with Enhanced Resistance to Tropical Rust
A set of common markers can be used to aid in the identification of other
markers that can be used to select for maize plants with enhanced resistance
to
tropical rust. Table 11 shows markers identified herein that define the
interval
comprising a gene that confers resistance to tropical rust. Markers are in
physical
map order (as depicted in FIG. 1). The positions of the markers on the PHB
internally derived map (based on single meiosis) and on the IBM2 neighbors
genetic
map (high resolution B73/Mo17 genetic map) are also shown.
WO 2011/056836 PCT/US2010/055242
TABLE 11
Molecular Marker Positions on the PHB map and the IBM2 Neighbors map
PHB map
position IBM2
Marker Locus (CM) neighbors
PHM15590 11.7 na
C00441-801 13.0 na
C00441-802 13.6 na
PHM13818-15 10.8 na
PHM1192-26 4.1 na
PHM1192-4 4.1 na
PH M 187-7 9.3 na
C00435-802 6.3 na
C00436-801 7.8 na
PHM5028-24 9.7 na
C00423-801 9.4 na
PHM4370-19 15.0 na
000071-01 18.2 na
C00428-801 20.2 na
PHM731-107 18.2 19.1
PHM15721-39 12.6 na
PHM15721-180 12.6 na
PHM8249-21 19.5 na
PHM18427-13 20.4 na
PHM4003-13 25.4 na
PHM9535-10 24.2 29.6
PHM9535-6 24.2 29.6
PHM9535-7 24.2 29.6
na = not available
Closely linked markers flanking the locus of interest that have alleles in
linkage disequilibrium with a resistance allele at that locus may be
effectively used
to select for progeny plants with enhanced resistance to tropical rust. Thus,
the
markers described herein, such as those listed in Table 11, as well as other
markers
genetically or physically mapped to the same chromosomal segment, may be used
to select for maize plants with enhanced resistance to tropical rust.
Typically, a set
of these markers will be used, (e.g., 2 or more, 3 or more, 4 or more, 5 or
more) in
the flanking region above the gene and a similar set in the flanking region
below the
gene. Optionally, a marker within the actual gene and/or locus may also be
used.
56
WO 2011/056836 PCT/US2010/055242
The parents and their progeny are screened for these sets of markers, and the
markers that are polymorphic between the two parents are used for selection.
The
most proximal polymorphic markers to the gene or locus are used to select for
the
gene or locus, and the more distal polymorphic markers are used to select
against
the gene or locus. In an introgression program, this allows for selection of
the gene
or locus genotype at the more proximal polymorphic markers and selection for
the
recurrent parent genotype at the more distal polymorphic markers.
A haplotype, or a combination of alleles, can also be used to select for
plants
in a breeding program. Haplotypes can be more informative than single
polymorphisms and can be more descriptive of any particular genotype. Once a
unique haplotype has been assigned to a donor chromosomal region, such as a
haplotype for PHS6Y in the short arm of chromosome 10, that haplotype can be
used in that population or any subset thereof to determine whether an
individual has
a particular gene. Using automated high throughput marker detection platforms
known to those of ordinary skill in the art makes this process highly
efficient and
effective. The marker alleles disclosed herein can be used alone or in
combination
to select for plants with enhanced resistance to tropical rust through the use
of
marker assisted selection.
57