Note: Descriptions are shown in the official language in which they were submitted.
CA 02786917 2012-07-12
WO 2011/091517 PCT/CA2011/000098
Risk Modeling for Pressure Ulcer Formation
INVENTOR(S): Ian Main, Robert Miller; Terry Russel; Mitch Ousdahl
ASSIGNEE(S): Xsensor Technology Inc.
DOCKET NO.: 46346.31
Field of the Invention
The present invention is directed to methods and systems for monitoring and
assessing
risk of pressure ulcer formation.
Background
Pressure imaging systems have been used to provide interface pressure
information for the
assessment of medical support surfaces such as wheelchair seats and hospital
beds. The
primary goal of performing these surface assessments has been to prevent the
development of
pressure ulcers.
Pressure ulcers (also known as pressure sores, decubitus ulcers or bed sores)
are areas of
localized damage to the skin and underlying tissue, generally understood to be
caused by
pressure, shear or friction. Deep tissue damage can occur under bony
prominences and there
is a much greater potential for these wounds to deteriorate without treatment
since the initial
lesion is not visible on inspection of the skin.
Pressure ulcers occur on patients in hospitals as well as in the community.
They are
commonly found in the elderly and in patients with reduced mobility and poor
nutrition. The
prevalence of pressure ulcers in hospitals within Canada and the United States
ranges from 5-
CA 02786917 2012-07-12
WO 2011/091517 PCT/CA2011/000098
33% and represents a significant burden on quality of life as well as a
financial burden on the
health care system.
In hospitals, caregivers try to reduce the prevalence of pressure ulcers by
manually turning
the patient on a regular turning schedule, typically every two hours. This is
an attempt to
relieve pressure in body areas that have been in contact with the hospital bed
for prolonged
periods of time. Cushion supports and specialty beds are other tools that can
be used to
relieve interface pressure. However, the cost of these tools varies widely and
their ability to
actually reduce the incidence of ulcers is not well understood.
Clinical studies have shown that a consistently executed turning schedule can
reduce the
incidence of pressure ulcers (DeFloor et al. (2005)). However, in spite of the
fact that
hospitals typically include turning schedules in their clinical pathway for
the prevention of
pressure ulcers, the prevalence of hospital acquired pressure ulcers remains
high.
Therefore, there is a need in the art for method and system which provides
useful and
meaningful information regarding pressure sensor information, and that assists
clinical staff in
more effectively and reliably implementing patient turning protocols.
Summary Of The Invention
The present invention relates to a method and system for modelling pressure
exposure
and/or the risk of pressure ulcer formation in a meaningful and useful manner
and presenting
the risk assessment to a user in a novel and informative manner. The method
and system may
also provide information that increases a caregiver's awareness of the
presence of elevated bed
2
CA 02786917 2012-07-12
WO 2011/091517 PCT/CA2011/000098
pressures, and the effect of long term exposure to pressure in areas of the
body that are
susceptible to pressure ulcers. Better informed clinical staff may be more
confident in their
decision to reposition a patient and are more likely to effectively follow a
turning schedule.
In one aspect, the invention comprises a method of assessing a patient's
exposure to
interface pressure, wherein the patient is supported on a support surface and
a pressure
sensing interface having a plurality of sensels is placed between the patient
and the support
surface, the method comprising the steps of:
(a) determining a desired turning interval;
(b) calculating a pressure exposure delta, EA, for each of a plurality of
sensels,
based on the measured pressure value, P, multiplied by an interval of time (E4
= P x At);
(c) determining a pressure exposure value, E(t), for each of a plurality of
sensels,
by accumulating pressure exposure deltas over a pre-determined period of time
(E(t) = E EA(t));
(d) deriving a normalized pressure exposure, Eõorm, from E(t), the selected
turning
interval and the maximum pressure range of the sensor;
(e) displaying the normalized pressure exposure value for each sensel to a
user;
and
(f) periodically repeating steps (b) to (e).
In another aspect, the invention comprises a system for determining and
displaying
pressure exposure values for a patient supported on a support surface,
comprising:
(a) a pressure sensing interface having a plurality of sensels placed between
the
patient and the support surface;
3
CA 02786917 2012-07-12
WO 2011/091517 PCT/CA2011/000098
(b) computer-implemented processing means comprising a component for
calculating a pressure exposure delta, EA, for each of a plurality of sensels
based on the measured pressure value, P, multiplied by an interval of time (E4
= P x At); a component for determining a pressure exposure, E(t), for each of
a
plurality of sensels by accumulating pressure exposure deltas over a chosen
period of time (E(t) = E EA(t)); a component for deriving a normalized
pressure exposure Enos,, based on a selected turning interval and a maximum
pressure range of the sensor for each of the plurality of sensels; wherein the
processing means is operatively connected to the pressure sensing interface;
and
(c) a display connected to the processing means for showing the Enos,, values
to a
user.
In one embodiment, the processing means further comprises a component for
producing a
pressure exposure map from the plurality of Enorm values, which pressure
exposure map is
shown on the display.
In another aspect, the invention comprises a method of assessing the risk of a
patient
developing a pressure ulcer, wherein the patient is supported on a support
surface, and a
pressure sensing interface having a plurality of sensels is placed between the
patient and the
support surface, the method comprising the steps of:
(a) obtaining a pressure value from each of a plurality of sensels and
deriving a
time-to-high risk (THR) value for each sensel from the pressure value;
(b) adjusting the THR value by considering at least one risk modifier;
(c) converting the risk-adjusted THR value into a risk delta comprising a
change in
risk over a unit of time;
(d) adjusting a risk value by the risk delta;
(e) displaying the adjusted risk value to a user; and
(f) periodically repeating steps (a) to (e).
4
CA 02786917 2012-07-12
WO 2011/091517 PCT/CA2011/000098
In one embodiment, the THR value is determined by comparing the pressure value
to stored
pressure vs. time data which comprises a THR value for a given pressure value,
or by applying
a pre-determined mathematical formula to the pressure value.
In another aspect, the invention comprises a risk assessment system for
assessing the risk
of a patient developing a pressure ulcer, wherein the patient is supported on
a support surface,
the system comprising:
(a) a pressure sensing interface having a plurality of sensels placed between
the
patient and the support surface;
(b) an input device for accepting a risk modifier level by considering at
least one
risk modifier;
(c) computer-implemented processing means comprising a component for
determining a pressure value for each of the plurality of sensels and deriving
a
THR value for each pressure value, a component for adjusting the THR value for
the risk modifier level, a component for converting the risk-adjusted THR
value
into a risk delta comprising the change in risk over a unit of time, and
adjusting
a risk value by the risk delta, wherein the processing means is operatively
connected to the pressure sensing interface and the input device; and
(d) a display connected to the processing means for displaying the adjusted
risk
value to a user.
The component for determining a TF-R value for each of the plurality of
sensels may do so by
obtaining a pressure value from the sensels and comparing it to stored
pressure vs. time data
which comprises a THR value for a given pressure value, or by applying a
mathematical
formula to the pressure value. The system may further comprise a component for
creating a
5
CA 02786917 2012-07-12
WO 2011/091517 PCT/CA2011/000098
risk map from the risk values for each of the plurality of sensels, which risk
map is shown on
the display.
In another aspect, the invention may comprise a patient turn management system
comprising:
(a) a pressure sensing interface having a plurality of sensels placed between
the
patient and the support surface and means for producing a pressure interface
map;
(b) an input device for indicating when a caregiver has initiated a patient
turn or
repositioning;
(c) a timer for tracking elapsed time since the last caregiver initiated turn
or
repositioning; or the remaining time until the next scheduled turn is due;
(d) computer-implemented processing means comprising:
(i) a component for determining a pressure value for each of the plurality of
sensels and deriving a pressure exposure value based on the determined
pressure value; wherein the processing means is operatively connected to the
pressure sensing interface; or
(ii) a component for determining a pressure value for each of the plurality
of sensels and deriving a THR value for each pressure value, a component for
adjusting the THR value for the risk modifier level, a component for
converting
the risk-adjusted THR value into a risk delta comprising the change in risk
over
a unit of time, and adjusting a risk value by the risk delta;
wherein the processing means is operatively connected to the pressure sensing
interface and the input device; and
(e) a display connected to the processing means for displaying the pressure
exposure values or risk values, the pressure interface map, and the elapsed
time
since the last caregiver turn or repositioning.
6
CA 02786917 2012-07-12
WO 2011/091517 PCT/CA2011/000098
Brief Description Of The Drawings
In the drawings, like elements are assigned like reference numerals. The
drawings are not
necessarily to scale, with the emphasis instead placed upon the principles of
the present
invention. Additionally, each of the embodiments depicted are but one of a
number of
possible arrangements utilizing the fundamental concepts of the present
invention. The
drawings are briefly described as follows:
Figure 1 shows representations three functions of one embodiment of the
present
invention: pressure exposure map, interface pressure map, and elapsed time
turn timer with
patient turn input button.
Figure 2 shows a mathematical representation of pressure exposure.
Figure 3 shows the relationship between pressure, elapsed time, and pressure
exposure,
including one possible representation of a colour scale applied to normalized
pressure
exposure.
Figure 4 shows a proposed patient turn workflow that incorporates the present
invention.
Figure 5 shows one embodiment of the present invention.
Figure 6 shows pressure map images of two different body positions.
Figure 7 shows one exemplary representation of the pressure exposure map.
7
CA 02786917 2012-07-12
WO 2011/091517 PCT/CA2011/000098
Figure 8 (prior art) shows a clinically derived pressure vs. time graph known
in the
literature.
Figure 9 (prior art) shows another clinically derived pressure vs. time graph
known in the
literature.
Figure 10 shows a schematic representation of one embodiment of a risk
algorithm of the
present invention.
Figure 11 is a screen shot of one embodiment of a risk assessment input
interface.
Figure 12 is a screen shot of one embodiment of a pressure map. Figure 13
shows a three-
dimensional risk model derived from a two-dimensional pressure map through
machine
vision.
Figure 14 is a screen shot of one embodiment of a risk adjustment input
interface.
Figure 15 is a screen shot of one embodiment of a risk map.
Figure 16 shows a schematic representation of a method of preventing or
reducing
pressure ulcer formation.
Detailed Description Of Preferred Embodiments
The invention relates to a system and method for deriving and displaying
useful
information from real-time pressure measurements, for caregivers or health
workers
concerned with subjects or patients at risk of forming pressure ulcers. When
describing the
present invention, all terms not defined herein have their common art-
recognized meanings.
8
CA 02786917 2012-07-12
WO 2011/091517 PCT/CA2011/000098
To the extent that the following description is of a specific embodiment or a
particular use of
the invention, it is intended to be illustrative only, and not limiting of the
claimed invention.
The following description is intended to cover all alternatives, modifications
and equivalents
that are included in the spirit and scope of the invention, as defined in the
appended claims.
In one aspect, the present invention relates to a system and method for
tracking a patient's
exposure to bed pressure and managing the execution of patient turning or
repositioning
protocols in a novel informed manner. In one embodiment, the present invention
provides a
novel method of tracking the measured patient/bed interface pressure over time
and providing
this information to a user in the form of a pressure exposure map. In one
embodiment areas
of highest exposure are located using visual indicators overlaid on an
interface pressure map.
In another embodiment, the present invention provides a system and method of
assessing
overall pressure ulcer risk by monitoring specific factors and combinations of
factors in a
novel manner, and presenting the risk assessment to a user in a novel and
informative manner.
In one embodiment, the risk assessment is presented as a risk map which allows
a user to
visually determine areas of high and low risk. In one embodiment, areas of
highest risk are
located using visual indicators overlaid on the interface pressure map.
Embodiments of the present invention also provide a system and method of
managing
patient turning protocols using the pressure exposure or risk assessment
information provided.
9
CA 02786917 2012-07-12
WO 2011/091517 PCT/CA2011/000098
By providing continuous, patient-specific risk information, either or both of
the pressure
exposure map and the risk map can assist a caregiver in making more informed
choices
regarding the repositioning of the patient for the prevention of pressure
ulcers.
In one embodiment, pressure exposure over time is presented as a pressure
exposure map
which allows a user to visually identify body areas with higher or lower
exposure to pressure,
based on the measured pressures and the time that the patient is exposed to
these pressures.
Pressure Exposure Management
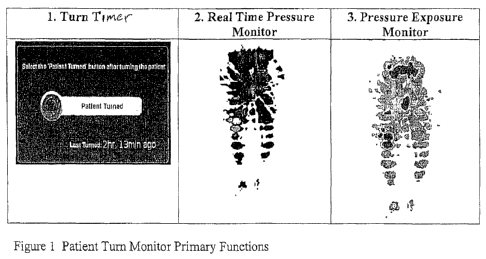
In another embodiment, pressure exposure, interface pressure, and patient turn
tracking
information is used to improve the quality and consistency of patient turn
management by
providing continuous feedback to the caregiver. A representation of these
three functions is
shown schematically in Figure 1.
A pressure exposure map of the present invention utilizes real-time interface
pressure
inputs to track and accumulate pressure exposure over time. The interface
pressure inputs are
obtained by pressure sensors associated with the patient support surface,
which report the
pressure exerted between the support surface and the patient. A pressure
sensor mat which
provides a plurality of sensels, typically arranged in a 2-dimensional grid,
may be used. A
sensel is an individual pressure sensor within the overall array of sensors.
Such mats are well-
known in the art and commercially available. The determination of pressure
exposure is
processed over a plurality of locations, and over time, and may be combined
with or
determined independently of any risk factors described herein.
CA 02786917 2012-07-12
WO 2011/091517 PCT/CA2011/000098
Pressure exposure is a quantification of the body/support surface interface
pressure that
the patient is subjected to over a period of time. Conceptually, this is
similar to sun exposure,
radiation exposure, or a sport diver's exposure to pressure based on the time
spent at various
depths. Mathematically, pressure exposure is calculated as shown in Figure 2.
The unit of
measure for pressure exposure is a standard unit of pressure multiplied by a
standard unit of
time, such as mmHg(s), psi(s) Kpa(s), or N/m2(s).
Pressure exposure over a given period of time is calculated by summing
pressure deltas,
which are calculated by multiplying the measured interface pressure by the
elapsed time since
the last pressure measurement (Pressure exposure delta, EA = P x At). The
pressure exposure
value is determined based on an accumulation of pressure exposure deltas over
a defined
period of time, E(t) = E EA(t).
In one embodiment, the absolute pressure exposure is normalized with reference
to the
scheduled turn interval and the calibration limit of the sensor, Enorn, =
E(t)/ tturn interval /Prnax.
For example, based on a 2 hour turn interval and a maximum calibration
pressure of 200 mm
Hg, the normalized pressure exposure will reach a maximum value after 2 hours
if the
measured pressure is a constant 200 mm Hg. Table 1 provides examples of
normalized
pressure exposure (Enorn,) values based on a maximum sensor calibration limit
of 200 mm Hg,
where the maximum Enorn, = I
11
CA 02786917 2012-07-12
WO 2011/091517 PCT/CA2011/000098
Turning Interval Maximum E(t) for 200mmHg limit Enorm
(seconds) mmH .s
3600 (1 Hr) 720000 1
7200 (2 Hrs) 1440000 1
10800 (3 Hrs) 2160000 1
14400 (4 Hrs) 2880000 1
Table 1.0 Max Pressure Exposure Values Based on Turning Interval
E(t) and Enorm are calculated for each sensel in the pressure sensing grid.
In another embodiment, the normalized pressure exposure value is based on
other time or
pressure reference values. Based on clinical data or specific user
requirements, a lower
pressure can be used as a reference value for the purpose of normalizing
pressure exposure.
Similarly, time periods other than the recommended turning interval can be
used. By
adjusting the time and pressure reference values, the system can potentially
be optimized for
different patient types or different patient environments.
The normalized pressure exposure, Enorm. will accumulate towards a maximum
value,
which is in one embodiment, Enorm = 1. At the maximum reference pressure, a
value of one is
reached once the turning interval time has elapsed. At pressures lower than
the maximum
reference pressure, Enorm does not reach I during the turning interval time,
but will continue to
accumulate, up to the maximum value. Enorm will not decrease until pressure
has been
relieved or until the caregiver has provided input that the patient has been
turned or
repositioned. Figure 3 illustrates the accumulation of normalized pressure
exposure based on
12
CA 02786917 2012-07-12
WO 2011/091517 PCT/CA2011/000098
a 2 hour turning interval and maximum sensor pressure limit of 200mmHg.
Enormalized values
are plotted for constant measured pressures of 200mmHg, 100mmHg, and 50mmHg.
In one embodiment, the normalized pressure exposure, Enorm, shall continue to
accumulate
beyond a maximum value of 1. This allows for the location of sensels with the
highest
accumulated Enorm. Enorm will continue to increase until pressure has been
relieved or until the
caregiver has provided input that the patient has been turned or repositioned.
In one embodiment, the normalized pressure exposure may be presented as a
pressure
exposure map. The pressure exposure map is a two dimensional representation of
the
normalized pressure exposure, absolute pressure exposure, or other value based
on the
accumulation of pressure measurements over time, obtained from the sensel grid
placed
between the patient and the support surface.
In one embodiment, areas of highest pressure exposure are highlighted on the
pressure
exposure map, or two dimensional interface pressure map, using a visual marker
such as a
color, a ring, arrow, pointer, or other geometric identifier. The visual
markers may also
provide additional call out information including but not limited to: pressure
exposure,
normalized pressure exposure, average pressure, peak pressure, time duration
of pressure
exposure, time duration at current pressure, or time duration at peak
pressure. The call out
information can be presented by textual or graphical means. In one embodiment,
the pressure
exposure map may be three-dimensional, with areas of high pressure exposure
displayed as
peaks with heights proportional to the pressure exposure value.
13
CA 02786917 2012-07-12
WO 2011/091517 PCT/CA2011/000098
By providing continuous, patient-specific pressure exposure information, the
pressure
exposure map can assist a caregiver in making more informed choices regarding
where to look
for the physical signs of pressure ulcer development and how to best
reposition the patient to
relieve pressure in the areas with highest pressure exposure. In one
embodiment the pressure
exposure information can be used to provide an indication of the patient's
level of mobility as
a mobile patient is less likely to accumulate higher levels of pressure
exposure. Mobility
information can be presented by textual or graphical means.
After locating areas of high pressure exposure, a caregiver can verify that
pressure
exposure has been appropriately relieved from a specific area on the patient's
body, by
referring to the real time pressure image.
In one embodiment, the pressure exposure tracking process of the present
invention
translates physical inputs (such as interface pressure and duration of
interface pressure) into a
value that is used to identify where the patient has been exposed to the
highest pressures for
the longest duration. The sensitivity of the pressure exposure tracking is
adjusted based on the
patient turn interval implemented by the clinical institution (eg. every 2
hours) or by other
modifiers such as known clinical risk scales, or other physical information
such as
temperature, moisture, or shear force, which may be acquired by additional
sensors or
manually. By adjusting the turn interval, or applying other modifiers, the
pressure exposure
value will accumulate slower or faster. For example, a patient who is
completely immobile
and at very high risk of developing a pressure ulcer, the turning interval can
be reduced to one
hour. In this case, higher levels of normalized pressure exposure will be
achieved more
14
CA 02786917 2012-07-12
WO 2011/091517 PCT/CA2011/000098
quickly. Table 2.0 provides an example of normalized pressure exposure
accumulation for a
sample pressure profile based on turning intervals of 1 hour and 2 hours. (As
with previous
examples Enorm is based on a sensor pressure limit of 200mmHg.)
P Accumulated 2Hr Interval IHr Interval
Interval (mmHg) At (s) Time (s) Enormalized Enormalized
1 60 900 900 0.038 0.075
2 60 900 1800 0.075 0.150
3 100 900 2700 0.138 0.275
4 150 900 3600 0.231 0.463
5 50 900 4500 0.263 0.525
6 50 900 5400 0.294 0.588
7 120 900 6300 0.369 0.738
8 200 900 7200 0.494 0.988
9 180 900 8100 0.606 1.213
90 900 9000 0.663 1.325
Table 2.0 Comparison of Pressure Exposure based on 2Hr and 1Hr Turning
Intervals
10 In addition to the bed surface sensor, in one embodiment, specialized
sensors may be
placed in pillows and other pressure relieving support surfaces to provide
auxiliary support
surface interface pressure information. These auxiliary sensors would be
monitored in the
same way as the main bed sensor.
When the interface pressure falls below a minimum pressure threshold, the
normalized
pressure exposure value will begin to decrease. The minimum pressure threshold
may be
chosen over a range of pressure values. For example, there is clinical data
that suggests a
capillary pressure of 30 mm Hg may be sufficient pressure relief to reduce the
risk of tissue
breakdown. In one embodiment, minimum pressure thresholds can be set by the
user at any
value between 30 mm Hg to the minimum value in the sensor's calibration range,
which may
CA 02786917 2012-07-12
WO 2011/091517 PCT/CA2011/000098
be 5 mm Hg. In one embodiment, the minimum pressure value is fixed at a
clinically
accepted level, such as 20mmHg.
A recent study (Makhous et al (2007)) proposed that for full tissue perfusion
recovery the
interface pressure should be relieved and relief maintained for a recovery
period of 200 to 300
seconds. In one embodiment, the recovery period may be any length of time
between 3
minutes minimum up to 20 minutes maximum. In one embodiment, the recovery
period is
fixed at a clinically accepted level such as 300 seconds.
In one embodiment the pressure exposure value, or normalized pressure exposure
value,
will be reduced at such a rate that the value will reach zero after the
selected recovery period
has elapsed. The length of the recovery period chosen determines the magnitude
of the
negative pressure exposure delta. In one embodiment, this process may be
implemented using
the following logic statement:
Where:
interface_pressure = IP
normalized_pressure_exposure = NEP
stored_normalized_pressure_exposure = SNEP (value is stored as NEP
accumulates)
minimum_pressure_threshold = selected capillary or relief pressure (eg.
20mmHg)
recovery_period = selected recovery period (eg. 10 mins)
max-pressure = max pressure in sensor calibration range (eg. 200mmHg)
turn_interval = scheduled turn interval (eg. 2Hrs)
At = elapsed time used to calculate pressure exposure delta
IF (IP < minimum-pressure-threshold ) THEN
IF NEP <> 0 THEN
NEP = NEP - (SNEP / recovery_period) x At
END IF
ELSE
NEP = NEP + (IP / max_pressure) x (At / turn_interval)
SNEP = NEP
END IF
16
CA 02786917 2012-07-12
WO 2011/091517 PCT/CA2011/000098
In one embodiment, the pressure exposure map and system comprises a reset
mechanism
which resets the pressure exposure values to zero for all sensels. A user may
utilize the reset
mechanism, for example, if the patient is completely repositioned, such as
being rolled over
completely. In one embodiment, an input button is the reset mechanism that,
when pressed,
resets the pressure exposure map to zero for all sensels.
In one embodiment, the pressure exposure values from a plurality of sensels
results in a
pressure exposure map that is a graphical representation of the pressure
exposure on a
patient's body. The system displays the normalized pressure exposure values
for all sensels in
the form of a pressure exposure map. The pressure exposure map provides an
indication of
the location and level of pressure exposure over the patient's body. In one
embodiment, if the
pressure exposure level in a certain area exceeds a certain level, it may be
highlighted, or
otherwise modified to catch the attention of a caregiver. As shown for example
in Figure 7,
the pressure exposure monitor indicates that the patient has experienced the
greatest pressure
for the longest period of time in the area of the right buttock, as indicated
by the highest
colour in the colour scale (red for example). Orange and yellow coloration
indicate other
areas of significant pressure exposure. Grey coloration indicates low pressure
exposure areas.
Areas with no coloration do not have significant interface pressure (below
SmmHg for
example) and are typically bed surface areas not in contact with the patient.
In one embodiment a real-time interface pressure map is also available to
identify body
areas with highest interface pressure. This is different from pressure
exposure in that it is
instantaneous and provides no indication of the duration of the interface
pressure. The
17
CA 02786917 2012-07-12
WO 2011/091517 PCT/CA2011/000098
interface pressure map facilitates a workflow whereby new patient positions
can be validated.
The workflow may be iterative, where repositioning is validated to ensure new
high interface
pressure points have not been created, and further repositioning is performed
if required.
In one aspect, the invention may comprise a method of adjusting the patient
position in
response to a high pressure exposure value or group of pressure exposure
values exceeding a
pre-determined threshold. The method of adjustment may be executed manually by
a
caregiver, or automatically by system actuated devices.
RISK MAP
In another embodiment, the real-time pressure measurements may be converted
into a risk
assessment and displayed as a risk map, which is analogous to the pressure
exposure map
described above. A risk map of the present invention is created by a risk
algorithm which
utilizes physical factor inputs and physiological factor inputs to assign a
risk level, by
comparing the input data with stored data which correlates input values with
pre-defined risk
levels. The physical factor and physiological factor inputs are obtained by
sensors or by user
observation or determination and input, or a combination of sensors and direct
user input.
The determination of risk level is processed over a plurality of locations,
and over time.
The key physical risk factor is interface pressure. Obviously, increased
pressure results in
reduction or cessation of soft tissue perfusion. Time is also an important
factor as the longer
the increased pressure bears on the soft tissue, the greater the potential for
the development of
pressure ulcers. The interface pressure sensor utilizes an array of capacitive
pressure sensing
18
CA 02786917 2012-07-12
WO 2011/091517 PCT/CA2011/000098
elements to create a pressure map of the patient / support surface interface.
In one
embodiment, pressure is measured over the range of 5 mm Hg to 200 mm Hg.
Other key risk factors for pressure ulcer formation include physical and
physiological
factors. Physical factors include:
Moisture / Incontinence
= Alters the skin's natural barrier protection and increases the potential for
skin
breakdown
Temperature
= High skin temperatures result in perspiration and increases risk factors due
to
moisture.
= Low skin temperatures result in poor circulation.
Shear
= Increases strain on tissue and can result in reduced circulation.
Physiological factors may include:
Age
= Elderly people are at higher risk for the development of pressure ulcers due
to
skin changes, slower metabolism, poorer nutrition and hydration, and
compromised respiratory function.
= Elderly people are also at higher risk of chronic health conditions such as
circulatory problems and diabetes.
Mobility
= Mobility reduces the risk of developing pressure ulcers as pressure is
frequently relieved in areas that may be at risk
= The exception is shear and friction that can result from excessive movement
and contribute to skin breakdown.
Disease
= Diseases such as Peripheral Vascular Disease (PVD) can cause acute or
chronic ischemia that results in a lack of blood supply to at risk tissues.
= Similarly, heart and lung disease can restrict blood or oxygen supply to at
risk
tissues.
19
CA 02786917 2012-07-12
WO 2011/091517 PCT/CA2011/000098
Surgery
= Surgery often restricts the movement of the patient either during surgery or
post-op and exposes the patient to longer term pressure points that have
greater risk of causing pressure ulcers.
= During recovery it can be more difficult the re-position a patient that is
connected to monitoring equipment.
Circulation
= Poor blood circulation results in inadequate delivery of oxygen, nutrients
and
blood cells to the tissue cells and therefore increases risk of breakdown.
Diabetes
= Poor blood circulation.
= People with diabetes can have very poor circulation in the arms and legs in
particular. Diabetes is often listed as a separate risk factor for tissue
breakdown.
Nutrition
= Vitamin & protein deficiencies increase risk of tissue breakdown.
= National Pressure Ulcer Long-term Care Study (NPULS) associated
involuntary weight loss with a 74% increase in risk of developing pressure
ulcers.
Dehydration
= NPULS associated dehydration with a 42% increase in risk of developing
pressure ulcers.
Obesity
= Poor blood flow in fatty tissues.
= Fatty tissues tend to compress more than muscle tissue.
= Reduced mobility.
The number of risk factors and their inter-relationship make it difficult to
perform an
assessment on a patient that takes all factors into consideration. There are
risk assessment
tools that attempt to address the most critical factors to predict a patient's
level of risk.
Patients that are assessed with a higher level of risk are candidates for a
higher level of
CA 02786917 2012-07-12
WO 2011/091517 PCT/CA2011/000098
preventative care, including, more frequent turning schedules and skin
inspection, special
support surfaces, friction reducing creams and massage in the areas of high
risk.
For example, the Braden Scale uses six categories where patients are assessed
and rated on
a scale of 1 to 4. The lower the overall score the greater the risk of
developing pressure
ulcers. The categories are:
= Sensory Perception
= Moisture
= Activity
= Mobility
= Nutrition
= Friction & Shear
The Waterlow prevention/treatment policy uses a scoring scheme that is based
on six
categories plus three additional "special risks" categories. The higher the
overall score the
greater the risk of developing pressure ulcers. The six main categories are
= Body type and weight
= Skin condition
= Sex and Age
= Nutrition
= Continence
= Mobility
The three "special risks" categories are:
= Tissue malnutrition
= Neurological deficit
= Major surgery or trauma
21
CA 02786917 2012-07-12
WO 2011/091517 PCT/CA2011/000098
The Norton Scale uses five categories where patients are assessed and rated on
a scale of 1
to 4. The lower the overall score the greater the risk of developing pressure
ulcers. The
categories are:
= General physical condition
= Mental state
= Activity
= Mobility
= Incontinence
Additional risk assessment scales include the modified Norton risk scale, the
Glamorgan
pediatric risk scale, and the Risk Assessment Pressure Sore (RAPS) scale. The
modified
Norton scale adds some additional categories to the traditional Norton scale.
The RAPS scale
utilizes some categories taken from the modified Norton scale, Braden scale
and adds three
new categories derived from research results. The Glamorgan risk scale was
developed more
recently and focuses on pressure ulcer risk for children.
In one embodiment, the risk modeling process of the present invention
translates physical
inputs (such as interface pressure and duration of interface pressure) into a
risk value that is
used to identify when the patient is at risk of developing a pressure ulcer.
The sensitivity of
the risk model is adjusted based on physiological factors that are captured
through risk scale
assessment, patient specific physiology, and the caregiver's own assessment of
the patient.
The risk model uses this information to calculate risk values that can be
mapped onto the
patient's body where it contacts the support surface. This biometric risk
information can then
22
CA 02786917 2012-07-12
WO 2011/091517 PCT/CA2011/000098
be used by caregivers to monitor and assess a patient's level of risk in
specific areas of the
body. Figure 10 provides a block diagram of the risk model concept of the
present invention.
The primary clinical data input into the risk model comprises a pressure v.
time curve such
as Reswick & Rogers (1976) or Linder-Ganz et al (2006) as the basis for
calculating the risk
of tissue breakdown. Reswick and Rogers (1976) formulated tissue tolerance
guidelines based
on clinical data and the results of their study were summarized in a pressure
v. time curve that
highlighted the threshold where pressure ulcers where likely to develop. The
Reswick and
Rogers pressure v. time curve is shown in Figure 8.
These curves indicate that there is a direct relationship between the
magnitude of interface
pressure, the hours of continuous pressure, and the risk of developing a
pressure ulcer. Other
curves may be utilized, including those derived in other studies (Patterson
and Fisher 1986,
Peters et al 2005,, Gefen et al 2008) or other customized or proprietary
pressure v. time
curves. Proprietary pressure v. times curves may be obtained through
independent clinical
studies or research into biometric feedback such as a seating comfort study.
The Linder-Ganz
curve is different from the Reswick and Rogers curve at the high and low ends
of the pressure
curve. The Linder-Ganz curve is compared against the Reswick and Rogers curve
in Figure 9.
For example, based on the pressure v. time curve shown in Figure 9, an
interface pressure
of approximately 160mmHg is acceptable for just under two hours. If the
pressure is not
relieved within this time frame, then the patient is at high risk of
developing a pressure ulcer.
23
CA 02786917 2012-07-12
WO 2011/091517 PCT/CA2011/000098
Table 1 details the high risk time intervals for various pressures based on
the Linder Ganz et
al (2006) curve.
Interface Pressure Time to Accumulate High Risk
(mmHg) Time (hrs) Time (mins)
233 0.33 20
231 0.5 30
218 1.083 65
201 1.33 80
181 1.58 95
164 1.75 105
141 2 120
122 2.25 135
100 2.58 155
80 3.67 190
70 3.83 230
Table I - Pressure v, Time Data based on Linder Ganz et al (2006)
The time-to-high risk based on interface pressure shall be referred to herein
as THR and is
defined as an estimate of the duration of time a patient can be exposed to the
pressure
currently being experienced before a pressure ulcer may begin to form. For
example, the
Linder-Ganz et al (2006) study concludes that pressures in excess of 240 mmHg
can cause
pressure ulcers in as little as 15 minutes to 1 hour. Thus, in one embodiment,
a conservative
estimate of 20 minutes as the THR is applied to a pressure of 233 mmHg (based
on the Linder-
Ganz curve in Figure 9).
The risk model calculates a THR value based on a pressure v. time curve for
every sensor
in the sensor array, which may be of any size. In one embodiment, the sensor
comprises
50x 125 (6250) sensors. The THR value maybe derived from a look-up table or by
using a
mathematical function that is fit to the chosen pressure v. time curve.
24
CA 02786917 2012-07-12
WO 2011/091517 PCT/CA2011/000098
Although the invention has been exemplified using known clinical data of
pressure v. time
relationships, it is not limited to the clinical data presented in the
literature cited above or
presented in the Figures and Tables herein. As new clinical data becomes
available the
pressure v. time curve used in the risk model can be modified to reflect
better models for
predicting tissue breakdown. Field data acquired by the use of the present
invention could
also be used to develop alternative pressure v. time curves.
RISK ADJUSTMENT
After the risk scale assessment is complete, the patient is assigned the risk
level
determined by the patient's skin condition or based on patient history. In one
embodiment,
risk levels are adjusted based on the clinician's input for Braden Assessment
and Skin
Condition or the Waterlow scale, is also provided as an input into the risk
algorithm. Figure
11 illustrates one possible user interface for entering a Braden Risk scale
assessment.
Once the user completes the risk assessment the patient is assigned a score
that translates
to risk level. In one embodiment, three risk levels (Low, Medium and High) are
used. The
sensitivity of the risk model is then adjusted based on the assigned risk
level. Table 3
illustrates the relationship between Braden Risk Level and the THR in one
embodiment. Based
on the Braden Risk level, the THR value is reduced by a corresponding safety
factor. In one
embodiment, the THR value is reduced by 25% for Moderate risk and 50% for High
risk, as
shown in Table 3. More risk levels may be used if more granularity is required
in the risk
model adjustment.
CA 02786917 2012-07-12
WO 2011/091517 PCT/CA2011/000098
Braden Risk Level Pressure Versus Time Curve
Low Baseline pressure versus time curve (such as unmodified Linder-Ganz)
Medium Reduce THR by 25% (Linder-Ganz curve shown in Figure 9 shifts to the
left)
High Reduce THR by 50% (Linder-Ganz curve shown in Figure 9 shifts to the
left)
Table 3 Effect of Braden Risk Level on Pressure v. Time Curve
As an example, a patient with "low risk" might have an area on their body
where the
interface pressure is measured to be 141 mmHg. Based on Table 1, the risk
model would
assign this area a THR value of two hours. If the same patient where rated as
"high risk" then
the risk model would assign this area the maximum risk value after only 50% of
the THR, or in
this case one hour.
In this manner, other risk assessment scales can be incorporated into the risk
model in
addition or in the alternative. In addition, data from more recent clinical
studies can be
incorporated as proprietary risk factors. New risk factors or new
combinations, relative
weightings of risk factors (such as age, sex, recent weight loss, muscle
deterioration, or
obesity) could be used as part of an alternative risk scale.
Preferably, different anatomical zones are assigned different risk levels. A
patient with a
previous history or early signs of pressure ulceration in the sacrum area
could have the risk
level increased in the "Hips" body zone or more specifically for the sacrum
body area. This
will increase the sensitivity of the risk model for the relevant body zone.
Figure 14 illustrates
26
CA 02786917 2012-07-12
WO 2011/091517 PCT/CA2011/000098
one embodiment of a user interface for adjusting the risk level for body
areas. An alternative
Skin Condition interface would allow selection of specific body areas using a
3D body image.
Tissue Deformation
Recent studies have proposed that there is a relationship between the relative
deformation
of a tissue and the risk of breakdown of that tissue, Gefen (2009). Thus, in
one embodiment,
the potential for a patient's tissue to deform around bony prominences could
be measured as
part of the risk assessment process. The deformation of a patient's tissue
could be measured
using an indenter device that measures the amount of indentation when a known
force is
applied to the tissue. Alternatively, the elasticity of the tissue could be
measured using vibro-
elastography. Tissue deformation or elasticity data is then applied to adjust
the risk level for a
body zone. More detailed machine vision would be even more effective because
the risk level
could be adjusted for areas around the bony prominences based on the tissue
deformation
characteristics.
Tissue Health
Deep tissue injuries may be used as part of the risk assessment process. For
example, a
non-invasive sensor capable of measuring multiple deep tissue characteristics,
such as blood
flow and oxygenation, would permit the assessment of risk areas on the
patient. Testing could
be done as part of the risk assessment process to determine if areas around
the bony
prominences shows signs of pre-existing poor tissue health. The risk level
assigned to
27
CA 02786917 2012-07-12
WO 2011/091517 PCT/CA2011/000098
corresponding body zones could be elevated to increase the sensitivity of the
risk model in
these areas.
Other Sensor Data
In one embodiment, the risk model uses sensor data to calculate a risk value.
The primary
input is interface pressure but other important risk factors may also be
monitored and have an
impact on the calculated risk value. For example, moisture is a known
contributor to the risk
of developing pressure ulcers. A moisture sensor would allow the assigned risk
level to be
automatically increased in the event that moisture was detected at the patient
/ support surface
interface. Similarly, temperature and shear could also be used to adjust the
sensitivity of the
risk model.
In addition to the bed surface sensor, in one embodiment, specialized sensors
may be
placed in pillows and other pressure relieving support surfaces to provide
auxiliary support
surface interface pressure information. These auxiliary sensors would be
monitored in the
same way as the main bed sensor. Each auxiliary sensor would have a risk level
assigned to it
and a risk value would be calculated for each of its individual sensors based
on the same
pressure vs time curve used by the main bed sensor.
Shear
In one embodiment, one or more shear sensors are used to create a shear map of
the
patient / support surface interface. A shear sensor tracks the displacement of
two conductive
elements in the direction of the applied shear force. An elastomer or
piezoelectric material is
28
CA 02786917 2012-07-12
WO 2011/091517 PCT/CA2011/000098
bonded between the two conductors and provides an elastic force corresponding
to the
displacement due to shear. This allows the shear force to be calculated based
on the
displacement of the conductive elements. The greater the shear force the
greater the risk of
tissue breakdown. A risk value for each shear sensor is calculated based on
the intensity of
the shear force.
Moisture
In one embodiment, one or more moisture sensors detect the presence of
moisture on the
support surface. It provides a simple YES/NO status to indicate if more than a
negligible
amount of moisture has been detected. A single sensor can provide moisture
status for the
entire support surface or moisture information can be more localized by using
multiple
moisture sensors on a surface. The moisture sensor uses strips of conductive
fabric adhered to
an absorbent sheet to detect the presence of bodily fluids on the sensor
surface. A minimum
of two conductive strips are required. The moisture sensor monitors the two
conductive strips
to determine when the impedance between the conductors has reduced below a
threshold
level. A saline solution (bodily fluid) absorbed into the cotton between the
two conductive
fabric strips will conduct electricity between the two fabric strips and
therefore the impedance
between the fabric strips will decrease as the conductivity increases. An
impedance below the
threshold level indicates the presence of sufficient moisture to cause the
risk of developing a
pressure ulcer to increase.
Multiple strips of conductive fabric can be used in a grid arrangement to
further locate the
area on the patient support surface where moisture has been detected. The
moisture detection
29
CA 02786917 2012-07-12
WO 2011/091517 PCT/CA2011/000098
and location information is communicated from the sensor to the application
software using a
standard serial communication protocol such as USB.
Temperature
The temperature sensor utilizes an array of temperature sensing elements to
create a
temperature map of the patient / support surface interface. Temperatures above
or below
normal body temperature can elevate the risk of pressure ulcers. A risk value
for each
temperature sensor is calculated based on the temperature deviation from
normal. Higher
temperatures can also be assigned a greater risk factor than lower
temperatures.
Body Zones
In one embodiment of the present invention, a pressure sensor or a group of
pressure
sensors may be correlated to a specific locations on the body, either
manually, or by machine
processing (machine vision). The two-dimensional interface pressure map may be
processed
to determine body zones, which may be used to visualize or analyze the
pressure exposure
map, or the risk map. In one embodiment, where a pressure sensor array
receives interface
pressure inputs from a support surface with a human body resting on it, the
application
software creates a pressure map which corresponds to a body image as shown in
Figure 12 and
13. The machine vision component recognizes anatomical patterns of a human
body, and can
thus correctly assign anatomical labels to features apparent on a two-
dimensional interface
pressure map. The anatomical feature is then assigned to the sensor, or group
of sensors,
until the patient is repositioned. In one embodiment, the machine vision
component is
CA 02786917 2012-07-12
WO 2011/091517 PCT/CA2011/000098
capable of identifying if the patient is on their side, back or front. For
example, based on the
position of the patient, a group of sensors can be assigned to the "left heel
bottom", "left heel
top", "left heel outside", or "left heel inside". By identifying the
anatomical feature, the
machine vision process allows the risk model to adjust risk based on body
location. For
example, if skin redness is observed in the "left heel outside" area then the
risk for this body
area can be elevated via a User Interface as shown in Figure 12. Machine
vision would then
track the location of the "left heel outside" on the pressure image and
maintain a higher risk
level for this area.
In one embodiment, the machine vision component simply predicts body position
(left
side, back, right side) based on image processing of the pressure map. Changes
in body
position result in resetting of the pressure exposure map or risk map.
In one embodiment, the body is divided into a plurality of zones, three zones
for example.
The location of the body zones is calculated based a simplified machine vision
process and the
risk model can be adjusted separately for each body zone.
The body zones may be divided along the transverse plane by recognizable
features, such
as the neck or waist or the like. In addition, left and right zones may be
created along the
sagittal plane of the body.
In one embodiment, specific areas of concern on the body may be identified
(manually or
automatically) within a body zone, and correlated with the pressure map. For
example, the
left and right heels may be identified in a "Feet Zone".
31
CA 02786917 2012-07-12
WO 2011/091517 PCT/CA2011/000098
RISK ALGORITHM
The risk algorithm converts THR into a quantification of risk. In one
embodiment, risk is
quantified as a value between 0 and 1, where 0 is the lowest risk and 1 the
highest risk. In one
embodiment, the model tracks risk in different zones, and may track risk by
individual sensel.
The risk for a sensel will increase when the pressure is at or above a minimum
pressure
threshold. The minimum pressure threshold is the interface pressure deemed to
be sufficient
to allow tissue recovery. In one example, the value is set at 20 mm Hg, but
this may be
adjusted after further trials and performance testing. If the pressure at the
sensel is less than
the minimum pressure threshold, the risk will reduce over time. This indicates
that the
pressure has been sufficiently relieved by repositioning of the patient.
Risk Accumulation
After the acquisition of an initial data set, the sensor data is periodically
sampled, for
example at one frame per second (a frame is a complete set of interface
pressure samples from
all the sensors in the array). With each frame, a risk delta is calculated for
every sensel as a
function of the assigned risk level, the measured pressure, and the time
interval between
frames (the sampling rate). The current risk value is then updated by the risk
delta. The risk
value will then constantly fluctuate according to the current risk value, and
may continue to
accumulate until it reaches a maximum value of 1, or decrease to a minimum
value of zero.
Therefore, at a constant pressure above a minimum threshold, the risk value
will increase
linearly with time.
32
CA 02786917 2012-07-12
WO 2011/091517 PCT/CA2011/000098
A risk delta may be calculated as a risk coefficient, which is calculated by
dividing the
maximum risk value (which is for example 1) by the time it takes to achieve
high risk for a
given pressure. In one embodiment, risk coefficients are expressed as
risk/millisecond and
become smaller as the THR increases. In a case where the maximum risk value is
1, a risk
coefficient is calculated by the reciprocal of the THR in milliseconds. Table
3 illustrates how
the risk curve described in Table 1 is converted to risk coefficients.
Interface Pressure Time to Accumulate Risk Coefficient
(mmHg) High Risk (mins) risk/ms
233 20 8.33E-07
231 30 5.56E-07
218 65 2.56E-07
201 80 2.08E-07
181 95 1.75E-07
164 105 1.59E-07
141 120 1.39E-07
122 135 1.23E-07
100 155 1.08E-07
80 190 8.77E-08
70 230 7.25E-08
Table 3 Risk Coefficients
For example, if the current risk value is 0.5 for a given sensel and the
interface pressure on
the sensel is 201 mmHg, then after one frame (at I frame per second) the risk
delta will be:
1000 * 2.08E-07 = 2.08E-04
If this interface pressure were maintained, it would take approximately 480
seconds at 1 frame
per second (8 minutes) for the risk value to increase linearly from 0.5 to
0.6. Higher pressures
would result in higher risk deltas, and the risk value would increase faster.
Lower pressures
33
CA 02786917 2012-07-12
WO 2011/091517 PCT/CA2011/000098
would result in lower (or negative) risk deltas and the risk value would
increase more slowly
or decrease.
In one embodiment, if the THR value has not already been adjusted, the set of
risk
coefficients may be adjusted for the each risk assessment level (ie. low risk,
medium risk, high
risk). Therefore, risk deltas are affected by the risk assessment level and
body zone risk
adjustment as well as by the interface pressure. For example, at a given
pressure a patient
with a high risk assessment would have a risk coefficient that is double what
the coefficient
would be for a patient with a low risk assessment. For a body zone risk
adjustment, risk
coefficients would be calculated for each body area and scaled accordingly if
the risk was
higher for a particular body area.
When the interface pressure falls below the minimum pressure threshold, the
risk value
will begin to decrease with negative risk deltas. There is clinical data that
suggests 50 mm Hg
may be sufficient pressure relief to reduce the risk of tissue breakdown. The
minimum
pressure threshold may be 40, 30, 25, 20 mm Hg, or less. In one embodiment, as
a
conservative starting point, 20mmHg will be used as the minimum pressure
threshold.
A study by Makhous et al (2007) proposed that for full tissue perfusion
recovery the
interface pressure should be relieved and relief maintained for 200 to 300
seconds. Therefore,
a clinically accepted recovery period of 300 seconds may be chosen for one
embodiment of
risk model. This means that the risk model will reduce a sensel's risk value
from maximum
risk (value of 1) to minimum risk (value of 0) when the interface pressure at
a sensel is less
than the minimum pressure threshold for the duration of the recovery period.
The length of
34
CA 02786917 2012-07-12
WO 2011/091517 PCT/CA2011/000098
the full recovery period chosen determines the magnitude of the negative risk
delta (rate of
risk decrease).
In one embodiment, the risk monitor has a reset mechanism which resets the
risk level to
zero for all sensels. A user may utilize the reset mechanism, for example, if
the patient is
completely repositioned, such as being rolled over or when resetting the
system for a new
patient. When a "RESET" or "PATIENT TURNED" action is input and accepted, the
risk
level will be reset to zero for all sensels. In one embodiment, a change in
patient position is
detected by machine vision processes and the risk level is reset to zero for
all sensels.
In one embodiment, the risk algorithm described herein results in a graphical
representation of the accumulated risk value for each sensel in the pressure
sensor. The system
displays the risk values for all sensels in the form of a risk map, which is
updated by the
sampling rate or frame rate. The risk map provides an indication of the
location and level of
risk over the patient's body. In one embodiment, if the risk level in a
certain area exceeds a
certain level, it may be highlighted, or otherwise modified to catch the
attention of a caregiver.
As shown for example in Figure 15, the risk monitor indicates that the patient
has high risk at
the right shoulder, as indicated by the change in coloration (red for
example). Other
information may be provided, for example, a pop up timer may be attached to
high risk areas
indicating how long the area has been at high risk. Grey coloration indicates
low risk areas.
Areas with no coloration do not have significant interface pressure (below
SmmHg for
example).
CA 02786917 2012-07-12
WO 2011/091517 PCT/CA2011/000098
In one embodiment, the risk map may be shown as a three-dimensional
representation,
with higher risk values shown as peaks having a height which is proportional
to the magnitude
of the risk value.
PATIENT TURN MANAGEMENT IMPLEMENTATION
In one embodiment, patient turn management is achieved through effective use
of the risk
map or the pressure exposure map, the interface pressure map, and the turn
timer. The turn
timer and risk or pressure exposure map are used to track how often the
patient is turned or
repositioned. The risk map or pressure exposure map and interface pressure map
are used to
identify body areas with highest risk or pressure exposure and highest
interface pressure
respectively. The interface pressure map, which shows pressures in real time,
may be used to
confirm the effectiveness of patient turning or repositioning by indicating
that pressure has
been relieved and no new high pressure areas have been created.
In one embodiment, patient turn management is achieved through effective use
of the turn
timer, the interface pressure map, and graphical indicators on the interface
pressure map that
highlight areas of high pressure exposure. The graphical indicators may
provide information
on the degree of pressure exposure via call out boxes or pop up windows.
In one embodiment an input device such as a "PATIENT TURN" or "RESET TURN
TIMER" button is used to allow the caregiver to indicate that they have turned
or repositioned
the patient. The input device is used to indicate that the patient has been
turned and
subsequently the turn timer and pressure exposure or risk values are reset.
The input device
36
CA 02786917 2012-07-12
WO 2011/091517 PCT/CA2011/000098
is appropriately labelled as "Patient Turn", "Reset Turn Clock", "Reset
Clock", "Reset
Timer", or other text that provides a reasonable indication of the function of
this button.
In one embodiment a new and effective patient turn workflow can be implemented
through use of the pressure exposure information, the interface pressure map,
and the turn
timer. One embodiment of this workflow is illustrated in Figure 4.
By identifying the patient's body position, a machine vision component allows
the turn
timer to monitor patient initiated turns in addition to the caregiver
initiated turn. Based on
this additional turn information the turn timer and pressure exposure map or
risk map can be
modified to account for patient initiated turns. For example, if the machine
vision method
identifies that the patient has turned from their back onto their side, the
pressure exposure map
can be reset in the same way it is reset when the caregiver presses the "RESET
TURN
TIMER" button.
In one embodiment, shown schematically in Figure 5, a patient turn management
system
includes a patient support surface (10), which includes an interface pressure
mapping system
(12), which may comprise a capacitive pressure mapping grid which is well
known in the art,
and may also include a moisture sensor (14), a shear sensor (16) and a
temperature sensor
(18). The pressure mapping system comprises a grid which covers all, or
substantially all, of
the area upon which a patient would be supported on. The pressure mapping
system inputs
into a general purpose computer (20) which is operating software designed to
implement the
methods of the present invention, as described above. The software comprises
components
which implement the various steps of the methods described herein. The
computer (20)
37
CA 02786917 2012-07-12
WO 2011/091517 PCT/CA2011/000098
includes a graphical display (22) and user input devices (24), which are well
known in the art.
The computer may comprise at least one memory, the memory containing a set of
program
instructions, and a processor operatively connected to the memory, the
processor having
components responsive to the program instructions to implement the methods
described
herein.
In one embodiment, the system of the present invention may utilize moisture,
shear, and/or
temperature sensor information to modify the scheduled turn interval or
reference values used
for calculating normalized pressure. For example, the scheduled turn interval
may be
automatically reduced, for example 15 minutes or 30 minutes, if moisture is
detected by the
moisture sensor.
A real-time interface pressure map may also be provided in conjunction with
the risk map
to correlate risk areas to the current interface pressure. The combination of
real-time pressure
map with the risk map can be used to improve the existing clinical pathway for
the prevention
of pressure ulcers, as shown schematically in Figure 16. In one aspect, the
invention may
comprise a method of preventing pressure ulcer formation in a patient, by
including a step of
adjusting the patient position in response to a risk value or set of risk
values exceeding a pre-
determined threshold. This may be done manually by a user, or automatically by
system
actuated devices. The workflow is iterative, where high risk pressure points
are validated and
relieved by periodically repositioning the patient.
In one embodiment, the system of the present invention may comprise adjustable
support
surfaces which are operatively connected to the risk or pressure exposure
monitor. For
38
CA 02786917 2012-07-12
WO 2011/091517 PCT/CA2011/000098
example, air bladders may be disposed in a hospital bed mattress and which can
be inflated or
deflated under control of a system which reacts to a risk value or pressure
exposure value
produced as described above. Therefore, if the risk map or pressure exposure
map shows an
elevated level of risk or pressure exposure in a particular zone, the system
may inflate or
deflate air bladders in or adjacent to that zone in an effort to reduce
pressure or to reduce a
risk modifier. The system may respond to rate of change of risk or pressure
exposure in
addition to absolute level of risk or pressure exposure, and react to reduce
the rate of
accumulation.
The system components shown in the Figures or described above may be or may
include a
computer or multiple computers. The components may be described in the general
context of
computer-executable instructions, such as program modules, being executed by a
computer.
Generally, program modules include routines, programs, objects, components,
data structures,
etc., that perform particular tasks or implement particular abstract data
types.
Those skilled in the art will appreciate that the invention may be practiced
with various
computer system configurations, including hand-held wireless devices such as
mobile phones
or PDAs, multiprocessor systems, microprocessor-based or programmable consumer
electronics, minicomputers, mainframe computers, and the like. The invention
may also be
practiced in distributed computing environments where tasks are performed by
remote
processing devices that are linked through a communications network. In a
distributed
computing environment, program modules may be located in both local and remote
computer
storage media including memory storage devices.
39
CA 02786917 2012-07-12
WO 2011/091517 PCT/CA2011/000098
The computer system may include a general purpose computing device in the form
of a
computer including a processing unit, a system memory, and a system bus that
couples various
system components including the system memory to the processing unit.
Computers typically include a variety of computer readable media that can form
part of the
system memory and be read by the processing unit. By way of example, and not
limitation,
computer readable media may comprise computer storage media and communication
media.
The system memory may include computer storage media in the form of volatile
and/or
nonvolatile memory such as read only memory (ROM) and random access memory
(RAM). A
basic input/output system (BIOS), containing the basic routines that help to
transfer
information between elements, such as during start-up, is typically stored in
ROM. RAM
typically contains data and/or program modules that are immediately accessible
to and/or
presently being operated on by processing unit. The data or program modules
may include an
operating system, application programs, other program modules, and program
data.
At a minimum, the memory includes at least one set of instructions that is
either
permanently or temporarily stored. The processor executes the instructions
that are stored in
order to process data. The set of instructions may include various
instructions that perform a
particular task or tasks, such as those shown in the appended flowcharts. Such
a set of
instructions for performing a particular task may be characterized as a
program, software
program, software, engine, module, component, mechanism, or tool. The patient
monitoring
system may include a plurality of software processing modules stored in a
memory as
described above and executed on a processor in the manner described herein.
The program
CA 02786917 2012-07-12
WO 2011/091517 PCT/CA2011/000098
modules may be in the form of any suitable programming language, which is
converted to
machine language or object code to allow the processor or processors to read
the instructions.
That is, written lines of programming code or source code, in a particular
programming
language, may be converted to machine language using a compiler, assembler, or
interpreter.
The machine language may be binary coded machine instructions specific to a
particular
computer. Any suitable programming language or combinations of languages may
be used in
accordance with the various embodiments of the invention.
The processing unit that executes commands and instructions may be a general
purpose
computer, but may utilize any of a wide variety of other technologies
including a special
purpose computer, a microcomputer, mini-computer, mainframe computer,
programmed
micro-processor, micro-controller, peripheral integrated circuit element, a
CSIC (Customer
Specific Integrated Circuit), ASIC (Application Specific Integrated Circuit),
a logic circuit, a
digital signal processor, a programmable logic device such as an FPGA (Field
Programmable
Gate Array), PLD (Programmable Logic Device), PLA (Programmable Logic Array),
RFID
processor, smart chip, or any other device or arrangement of devices that is
capable of
implementing the steps of the processes of the invention.
It should be appreciated that the processors and/or memories of the computer
system need
not be physically in the same location. Each of the processors and each of the
memories used
by the computer system may be in geographically distinct locations and be
connected so as to
communicate with each other in any suitable manner. Additionally, it is
appreciated that each
of the processor and/or memory may be composed of different physical pieces of
equipment.
41
CA 02786917 2012-07-12
WO 2011/091517 PCT/CA2011/000098
A user may enter commands and information into the computer through a user
interface
that includes input devices such as a keyboard and pointing device, commonly
referred to as a
mouse, trackball or touch pad. Other input devices may include a microphone,
joystick, game
pad, satellite dish, scanner, voice recognition device, keyboard, touch
screen, toggle switch,
pushbutton, or the like. These and other input devices are often connected to
the processing
unit through a user input interface that is coupled to the system bus, but may
be connected by
other interface and bus structures, such as a parallel port, game port or a
universal serial bus
(USB).
One or more monitors or display devices may also be connected to the system
bus via an
interface. In addition to display devices, computers may also include other
peripheral output
devices, which may be connected through an output peripheral interface. The
computers
implementing the invention may operate in a networked environment using
logical
connections to one or more remote computers, the remote computers typically
including many
or all of the elements described above.
Various networks may be implemented in accordance with embodiments of the
invention,
including a wired or wireless local area network (LAN) and a wide area network
(WAN),
wireless personal area network (PAN) and other types of networks. When used in
a LAN
networking environment, computers may be connected to the LAN through a
network
interface or adapter. When used in a WAN networking environment, computers
typically
include a modem or other communication mechanism. Modems may be internal or
external,
and may be connected to the system bus via the user-input interface, or other
appropriate
42
CA 02786917 2012-07-12
WO 2011/091517 PCT/CA2011/000098
mechanism. Computers may be connected over the Internet, an Intranet,
Extranet, Ethernet, or
any other system that provides communications. Some suitable communications
protocols
may include TCP/IP, UDP, or OSI for example. For wireless communications,
communications protocols may include Bluetooth, Zigbee, IrDa or other suitable
protocol,
Furthermore, components of the system may communicate through a combination of
wired or
wireless paths.
Although many other internal components of the computer are not shown, those
of
ordinary skill in the art will appreciate that such components and the
interconnections are well
known. Accordingly, additional details concerning the internal construction of
the computer
need not be disclosed in connection with the present invention.
As will be apparent to those skilled in the art, various modifications,
adaptations and
variations of the foregoing specific disclosure can be made without departing
from the scope
of the invention claimed herein.
43