Note: Descriptions are shown in the official language in which they were submitted.
CA 02787218 2012-07-16
WO 2010/082039 PCT/GB2010/000076
1
Methods Employing Non-Coding RNA Expression Assays
Field of the Invention
The invention concerns methods employing non-coding RNA expression assays.
Embodiments of the invention addresses problems including, but not limited to,
determining similarities in the mechanism by which two or more interventions
affect
biological systems, identifying candidate therapeutic applications of test
agents and
identifying new applications of therapeutic agents which have previously been
the
subject of clinical trials in respect of one or more indications.
Background to the invention
Issues concerning the invention will now be discussed with reference to
applications
of microRNA (miRNA) expression assays, however, the invention may employ
expression assays concerning other non-coding RNA molecules.
miRNAs are single-stranded RNA molecules having a length of around 21 to 23
nucleotides. miRNAs were first described by Victor Ambros in 1993 and since
then
over 2,000 papers on have been published on the subject of miRNAs. There are
predicted to be about 1,000 miRNAs in humans of which around 600 have been
described and experimentally validated to date, although some estimates place
the
figure at tens of thousands. However, a recent report, which sought to produce
an
CA 02787218 2012-07-16
WO 2010/082039 PCT/GB2010/000076
2
expression atlas of miRNA in various human and rodent tissues and cell lines,
reported that around 300 miRNAs accounted for 97% of all detected miRNAs.
miRNA is not translated into protein but instead regulates the expression of
one or
more other genes. Known biology currently shows that microRNAs target
particular
individual messenger RNAs (mRNAs) or groups of mRNAs, thereby preventing their
translation or, less frequently, accelerating mRNA degradation. The mature
single
stranded miRNA molecule complexes with the RNA-Induced Silencing Complex
(RISC) protein and binds to a partially complementary sequence within the 3'
untranslated region (3'-UTR) of the protein coding mRNA from its target gene.
Further proteins are recruited to form a silencing complex and the expression
of the
target gene product is repressed by a mechanism that blocks the translation of
the
mRNA.
Although much remains to be discovered about the biology of miRNAs and the
composition and mechanism of the silencing complex it is apparent that miRNAs
are
involved in the regulation of many genes. MiRNAs are thought to regulate as
many
as 30% of all genes (Xie et al, 2005) at the translational level. An miRNA can
regulate multiple genes and each gene can be regulated by multiple miRNAs.
Tissue-specific expression of miRNAs is thought to guide commitment of cells
to
differentiate and/or actively maintain tissue identity. This wide-ranging
influence and
interplay between different miRNAs suggests that deregulated expression of a
single
miRNA or small sub-set of miRNAs may result in complex disease traits (Lim et
al,
2005, Nature). More than 50% of known human miRNAs reside in genomic regions
prone to alteration in cancer cells (Calin et al, 2004 PNAS, 101, 299-3004).
Not
surprisingly, the expression pattern of miRNAs change in cancer and other
disease
states. This information has begun to be used to classify and stage cancers,
reveal
biomarkers for prognosis and response and provide a critical determinant to
guide
therapeutic intervention, explain chemosensitivity and inform the mechanisms
of
chemoresistance by allowing the definition of specific miRNA expression
patterns in
cancer stem cells.
Applications of miRNAs to research and the development of possible new
therapeutics have typically resulted from detailed and time consuming analysis
of the
mechanisms by which miRNA expression and processing is regulated and the
mechanisms by which specific miRNAs regulate mRNA translation. Specific drug
targets have been identified and research in connection with these drug
targets in
CA 02787218 2012-07-16
WO 2010/082039 PCT/GB2010/000076
3
ongoing. However, although thorough, this research paradigm is time consuming
and expensive.
Thus, the invention aims to provide alternative methods for discovering
practical
applications of interventions, such as the administration of a therapeutic
agent, which
do not require a detailed understanding of the mechanism of action of the
intervention
or the identification of a specific drug target. Some embodiments of the
invention
address the problem of determining new indications for known therapeutic
entities or
predicting pharmacological properties of test agents, such as aspects of their
toxicological profile.
Summary of the invention
According to the present invention there is provided a method comprising the
steps
of:
(1) carrying out a plurality of expression assays, each expression assay
comprising the steps of: carrying out an intervention on a biological system,
measuring an expression profile of non-coding RNAs in the biological system
resulting from the intervention, and storing an expression data set derived
from the measured expression profile, the said expression assays concerning
either or both a plurality of different interventions and a plurality of
different
biological systems; and
(2) analysing the resulting expression data sets to determine correlations
between the effect on the expression profile of non-coding RNAs of the
respective intervention in groups of two or more expression assays
concerning either or both different interventions or different biological
systems.
By analysing expression data sets to determine similarities between the effect
of an
intervention on the expression profile of non-coding RNAs in groups of two or
more
expression assays, which differ in terms of either or both the intervention
which was
carried out and the biological system upon which the intervention was carried
out,
correlations may be determined without it being necessary to determine the
mechanism by which one or more interventions affect the expression profile of
non-
coding RNAs in one or more biological systems.
CA 02787218 2012-07-16
WO 2010/082039 PCT/GB2010/000076
4
Thus, where a second intervention is found to have an effect on the expression
profile
of non-coding RNAs which is correlated with the effect of a first intervention
which is
of known therapeutic relevance, the second intervention can be treated as a
candidate for the same or a similar therapeutic application. There is at least
some
possibility that the first and second interventions will have the same, a
similar, or a
related mechanism of action. This methodology is in direct contrast to known
strategies for discovering therapeutic interventions, in which a specific
target (such as
a protein, nucleic acid or liquid molecule) is identified, and analysed, the
biology of
the target is studied in depth, and therapeutic interventions suitable to
modulate one
or more activities of the target are developed by rational and/or
combinatorial
methods.
One or more (and optionally all) said interventions may comprise the
application of
one or more test agent to a biological system, either simultaneously or
sequentially.
The one or more test agent may be a chemical entity, for example, a molecule
having
a molecular weight of less than 2,000 Daltons, less than 1,000 Daltons or less
than
500 Daltons. The chemical entity may be non-polymeric. The one or more test
entity
may be a biological entity, for example, a biological macromolecule, such as a
lipid,
an oligonucleotide, or a protein (e.g. an enzyme, an antibody, or antibody
fragment,
humanized antibody or antibody fragment, phage or ribosome displayed protein
fragment, or a prion). The biological entity may be a virus or bacteria. Thus,
some or
each of the expression assays may measure the effect of a test agent on the
expression profile of non-coding RNAs in a biological system.
One or more said test agents may be a therapeutic agent. One or more said test
agents may be a therapeutic agent having a known application to the treatment
or
prevention of a known condition. One or more said test agents may be a
therapeutic
agent which has been the subject of clinical trials (whether or not
successfully) in
relation to one or more indications. However, one or more (and optionally all)
said
interventions may comprise the application to a biological system of one or
more of a
group comprising: ionising radiation, continuously emitted or pulsed
electromagnetic
radiation (for example, visible light, ultra-violet light, infra-red light),
acoustic energy
(delivered through air or through a liquid medium), mechanical intervention
(for
example, the application of pressure), electricity, changes in temperature,
changes in
the osmolarity, tonicity or pH of a growth medium, magnetic fields, changes in
fluid
dynamics, and mechanochemical signal transduction. Thus, at least some
CA 02787218 2012-07-16
WO 2010/082039 PCT/GB2010/000076
interventions may be interventions which are known to be deleterious to the
biological
system. The expression profile resulting from such deleterious interventions
may be
useful to identify agents which reverse or prevent the deleterious effects.
One or more said biological systems may comprise cells, such as mammalian
cells,
for example, the cells of a human, a rabbit, or a rodent (for example a mouse
or a
rat), or cultured insect, amphibian or fish cell lines. One or more said
biological
systems may comprise a mixture of cell types. The intervention is typically
carried
out on cultured mammalian cells. The mammalian cells may be stem cells or
progenitor cells. By stem cells we refer to cells which are capable of self-
renewal and
differentiation into at least one other specialised cell type. However, one or
more
said biological systems may be a whole organism, ex-vivo tissue, a synthetic
system
or transformed cells. The one or more said biological systems may be
transgenic.
Cultured cells may have synchronous or asynchronous cell cycles. One or more
said
interventions may be an intervention which changes the differentiation or de-
differentiation state of a stem cell or progenitor cell, or which causes a
stem cell or
progenitor cell to specialise, or to replicate while maintaining the
characteristics of a
particular cell lineage or differentiation state.
The expression assays may be repeated and the expression data sets which are
analysed may be compiled from some or all repeat experiments using equivalent
interventions on equivalent biological systems.
Correlations are typically between the expression of a subset of the non-
coding RNAs
in connection with which expression data is stored in the expression data
sets.
Correlations between effects on the expression profile of non-coding RNAs are
typically correlations, which may be positive or negative, in the change in
the
expression of one, or a small number of (e.g. two, three, five or fewer than
five, or ten
or fewer then ten) non-coding RNAs between two or more expression assays. A
positive correlation may comprise an increase in the expression of one or more
non-
coding RNAs in each of two expression assays. A positive correlation may
comprise
a decrease in the expression of one or more non-coding RNAs in each of two
expression assays. A negative correlation may comprise an increase in the
expression of one or more non-coding RNAs in a first expression assay and a
decrease in expression of the same one or more non-coding RNAs in a second
expression assay.
CA 02787218 2012-07-16
WO 2010/082039 PCT/GB2010/000076
6
In order to determine correlations between the effect on the expression
profile of non-
coding RNAs of a respective intervention, the method may further comprise
measuring the expression profile of non-coding RNAs in a suitable control
assay, for
example a control assay in which the respective intervention is not carried
out, or a
control assay comprising measuring the expression profile of non-coding RNAs
in a
biological system prior to the respective intervention being carried out.
Differences
between the expression profile of non-coding RNAs in expression assays and
corresponding control assays may be determined. The stored expression data set
may be derived from a measured expression profile and an expression profile of
a
corresponding control assay. The step of analysing the resulting expression
data
may comprise taking into account expression profiles from control assays.
However,
in some applications it will not be necessary to carry out control assays. For
example, if a plurality of interventions are carried out on equivalent
biological systems
it may be necessary only to analyse data sets derived solely from the
expression
profiles resulting from each expression assay to determine correlations
between the
effect on the expression profile of non-coding RNAs of the respective
interventions.
It may be that at least some of the said correlations are positive
correlations, for
example, similarities between the effect on the expression of non-coding RNAs
of the
respective intervention in groups of two or more expression assays. The step
of
analysing the resulting expression data sets to determine correlations may
include
the step of categorising (for example, clustering or grouping) expression
assays on
the basis of similarities between the expression data sets resulting from
expression
assays. Advantageously, this may allow similarities in the mechanism by which
two
or more different interventions have an effect directly or indirectly on the
expression
profile of non-coding RNAs (typically on the same or equivalent biological
systems) to
be identified without a requirement for the nature of the shared mechanism to
be
understood.
Thus, the method may be a method of determining that two or more interventions
have similar effects on the expression of one or more non-coding RNAs. A first
intervention may be the application of a first therapeutic entity, having at
least one
known first therapeutic application, and the method may be a method of
determining
that there is a positive correlation between the effect on non-coding RNA
expression
of a second intervention, comprising the application of a second therapeutic
entity.
Accordingly, the method may be a method of determining a possible new
therapeutic
application (the first therapeutic application) for a known therapeutic entity
(the
CA 02787218 2012-07-16
WO 2010/082039 PCT/GB2010/000076
7
second therapeutic entity). The method may further comprise the test of
testing
whether a second intervention is applicable to the treatment of a said known
first
therapeutic application.
The first intervention may be the application of an entity without a known
first
therapeutic application, but which is known to have pharmacological and
toxicological
profiles suitable for deployment as a therapy. Thus, the method may be a
method of
determining a possible new therapeutic application of a therapeutic entity
which has
passed toxicology trials but failed to be found to be efficacious, or more
efficacious
than a control therapeutic entity, in clinical trials.
It may be that at least some of the said correlations are negative
correlations, for
example, it may be determined that two or more interventions have opposite
effects
on the expression of one or more non-coding RNAs. Advantageously, a negative
correlation between the effect on the expression profile of non-coding RNAs of
a first
intervention and a second intervention may indicate that the second
intervention
could possibly be useful to reverse one or more effects of the second
intervention in
therapy. Thus, the first intervention may be an intervention which is known to
have a
deleterious effect on the biological system, for example, the first
intervention may be
the application of a toxin. In this case, the method may comprise identifying
the
second intervention as a candidate for the treatment or prevention of a
condition
known to be caused by the first intervention.
Thus, a plurality of interventions may comprise the administration of a toxin
or a
treatment which is deleterious to the biological system. The method may
therefore
be part of a method of determining candidate interventions (e.g. candidate
therapeutic entities) which may treat or prevent a condition known to be
causable by
one or more other interventions. The method may be a part of a method of
determining candidates to treat or prevent side effects of known therapeutic
interventions (e.g. the application of a therapeutic entity or a
radiotherapy).
The method may be a method of predicting one or more aspects of the toxicity
of a
test agent, for example, by detecting that the expression profile of non-
coding RNAs
arising from a first intervention is positively correlated with the expression
profile of an
intervention which is known to have a deleterious effect on the biological
system, or
positively correlated with the expression profile of an intervention
comprising the
administration of an agent, one or more aspects of the toxicology of which are
known.
CA 02787218 2012-07-16
WO 2010/082039 PCT/GB2010/000076
8
The method maybe a method of determining that a first test agent is a
candidate
agonist or antagonist of a second test agent, or a specific target
macromolecule, by
determining a correlation respectively between the effect on the expression
profile of
non-coding RNA of the first test agent and the second test agent, or a test
agent
which is a known agonist or antagonist of the target molecule.
The method may comprise the step of grouping interventions which have similar
effects on the expression of non-coding RNAs. The resulting expression
profiles may
be useful starting points for further research to identify further therapeutic
entities.
The method may be a method of determining changes in an expression profile of
non-coding RNAs associated with a group of interventions, for example, a group
of
therapeutic entities. Thus, the method may be a method of determining that a
chemical or biological entity has a mechanism of action on a biological system
which
is related to the mechanism of action of another chemical or biological entity
on a
biological system. Groups may be ordered in a hierarchy.
Where an intervention is the application of a second test agent to the
biological
system and the effect of the application of the second test agent on the non-
coding
RNA expression profile is found to be correlated (positively or negatively) to
the effect
of another first test agent on the biological system, which first test agent
is known to
be useful for the treatment or prevention of a first condition, the second
test agent, or
test agents obtained by modifying the second test agent, may be tested for
efficacy in
the treatment or prevention of the first condition, or a condition related to
the first
condition. Test agents which are found to be efficacious for the treatment or
prevention of the first condition, or a condition related to the first
condition, may be
deployed from the treatment or prevention of the relevant condition.
In some embodiments, expression assays are carried out in which the same
intervention, or group of interventions are carried out on a plurality of
different
biological systems. Thus, the method may enable the discovery of correlations
between the effects of interventions which are present in only some of the
plurality of
different biological systems. In some embodiments, the plurality of different
biological
systems are stem cells in different states of differentiation or de-
differentiation, for
example, different stages of development. Thus, the method may enable the
discovery of correlations between the effects of interventions on stem cells
in specific
states of differentiation or de-differentiation. This information is useful to
investigate
CA 02787218 2012-07-16
WO 2010/082039 PCT/GB2010/000076
9
the mechanisms of development and stem cell or progenitor cell differentiation
and
de-differentiation. The plurality of different biological systems may comprise
mammalian cells in different disease states. An intervention may be an
intervention
which causes stem cells or progenitor cells to differentiate or de-
differentiate, or drive
the attainment of a specific differentiation state or maintain the stability
of stem cells
or progenitor cells in a particular differentiation state.
The expression profile is related to the expression of at least one, and
typically a
plurality of non-coding RNAs, preferably at least 10, or more preferably at
least 100
non-coding RNAs. The expression profile may be related to the expression of
one or
more transgenic non-coding RNAs functioning as markers. An expression profile
may include quantitative or qualitative measurements of the level of
expression of
one or more non-coding RNAs. The level of expression of one or more said non-
coding RNA may be determined indirectly via measurements of the amount or
level of
activation of a reporter construct, for example, a transgenic reporter
construct
incorporated into the genome of the biological system, or maintenance
episomally, in
a particular biological system. The expression profile is typically related to
the
amount of one or more non-coding RNAs which are expressed in at least some
circumstances in the biological system, for example, the steady state or peak
amount
of the one or more non-coding RNAs. However, the expression profile may, for
example, be related to the rate of change of expression of one or more non-
coding
RNAs. In some embodiments, the expression profiles are obtained using a
microarray.
The non-coding RNAs typically include microRNAs (miRNAs) and may include
either
or both miRNA precursors and mature miRNAs. The non-coding RNAs may
comprise one or more of small interfering RNAs (siRNA), piwi-interacting RNA
(piRNA), small nuclear RNAs (snRNA), and short hairpin RNA (shRNA). The non-
coding RNAs may be transgenic. Some or all of the RNAs may, for example, be
transgenic RNAs which function as reporters of non-coding RNA expression. The
non-coding RNAs may be episomal and the method may include the step of
introducing episomal DNA into the biological system, for example by infection
of a
biological system with a virus, wherein the episomal DNA can be transcribed to
produce non-coding RNA which constitute all or part of the profiled non-coding
RNA.
Expression profiles may be measured for each non-coding RNA in a group of non-
coding RNAs and the method may comprise identifying individual non-coding
RNAs,
CA 02787218 2012-07-16
WO 2010/082039 PCT/GB2010/000076
or a sub-group of the group of non-coding RNAs, which have expression profiles
on
which a plurality of interventions have a correlated effect.
The plurality of interventions which have correlated effects may be identified
by the
method of the invention, thus enabling both interventions which have
correlated
effects on the expression profile of a group of non-coding RNAs and the
individual
non-coding RNAs or subgroup of non-coding RNAs within the group having
expression levels which are affected by the plurality of interventions to be
identified.
The plurality of interventions which have correlated effects may be
interventions
which are previously known to have a related mechanism of action, for example,
the
plurality of interventions may comprise the administration of agents known or
believed to have the same or a similar mechanism of action, for example a
class of
drugs. Thus, the invention provides a method of identifying the individual non-
coding
RNAs or a subgroup of non-coding RNAs having expression levels affected by the
plurality of interventions.
The resulting identified individual non-coding RNAs or identified sub-groups
of non-
coding RNAs may then be selected for use in further expression assays in which
the
expression profile of a reduced group of non-coding RNAs is measured, the
reduced
group of non-coding RNAs including only some of the group of non-coding RNAs,
including, or optionally consisting of, at least the identified individual non-
coding
RNAs or identified sub-groups of non-coding RNAs. The effect of further
interventions on the expression profile of the reduced group of non-coding
RNAs and
correlations between the effect of further interventions on the expression
profile of the
reduced group of non-coding RNAs and the effect of the said plurality of
interventions
on the expression profile of the reduced group of non-coding RNAs can be
thereby
determined. Thus, subsequent assays and tests may employ fewer non-coding
RNAs, reducing costs and increasing throughput. For example, a reduced group
of
non-coding RNAs having expression levels upon which a class of therapeutic
agents
have a correlated effect may be used to screen candidate agents, either to
find novel
therapeutically useful agents or to identify new indications for known
therapeutic
agents.
The relevance of the expression level of a group or sub-group of non-coding
RNAs to
discrimination between the effect of biological interventions may be
determined. The
method may comprise the step of ranking non-coding RNAs within the group or
sub-
CA 02787218 2012-07-16
WO 2010/082039 PCT/GB2010/000076
I1
group depending on their relevance to discrimination between the effects of
biological
interventions. The method may comprise the step of ranking the effect on the
expression of non-coding RNAs in a group or sub-group of non-coding RNAs of a
biological intervention, or a group of biological interventions having a
correlated effect
on the expression of non-coding RNAs. The resulting rankings may be used to
identify correlations between the effects of biological interventions.
Correlations may be identified by statistical mathematical methods, for
example,
principle component analysis. The effect of a biological intervention on the
expression of each of a plurality of specific non-coding RNAs may be allocated
one of
a group of codes indicative of properties of the effect of the biological
intervention on
the expression of the respective non-coding RNA. The resulting codes may be
analysed to identify correlations.
The invention also extends to assay apparatus (for example a test kit or a
solid phase
support having non-coding RNAs immobilised thereto) having non-coding RNAs
consisting of a said reduced group of non-coding RNAs, obtained by the method
of
the invention.
Description of the Drawings
An example embodiment of the present invention will now be illustrated with
reference to the following Figure in which:
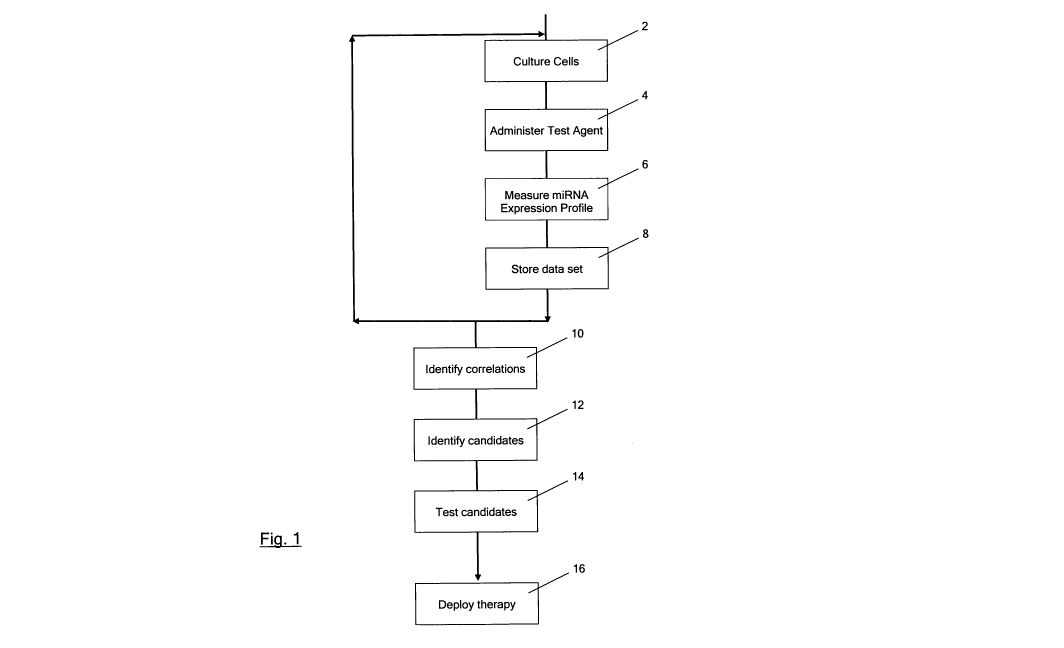
Figure 1 is a flow diagram of a method according to the invention;
Figure 2 is a plot of the results from principal component analysis for one
biological
intervention (a) and for one variable (b);
Figure 3 is a table giving statistical rankings of 11 miRNAs by their p-value
and q-
value; and
Figure 4 is a plot of data from principal component analysis showing (a) a
labelled
sub-group of discriminatory miRNAs, and (b) data from four intervention types
showing how the expression data from different intervention types cluster.
CA 02787218 2012-07-16
WO 2010/082039 PCT/GB2010/000076
12
Detailed Description of an Example Embodiment
In an example application of the invention, a database of miRNA expression
data
sets (being an example of an expression data set derived from a measured non-
coding RNA expression profile) is prepared. With reference to Figure 1,
suitable
human cells are cultured 2 by known methods and a test agent is administered 4
to
the cultured cells. A miRNA expression profile is then measured 6 using a
sample of
the treated cells, at one or more periods of time after the intervention is
made, to
determine the expression level of each of a number of miRNAs in the treated
cells.
Two alternative methods for measuring the miRNA expression profiles,
microarray
analysis and qualitative real-time PCR analysis, are set out below.
(1) miRNA microarray and data analysis
Total RNA from drug-treated (n = 3) and control treated cells (n = 3) are
isolated using
a column-based kit from Exiqon A/S of Vedbaek, Denmark. Two pg of total RNA
from
each sample is analysed by miRNA microarray. miRNA microarray analysis
including labelling, hybridization, scanning, normalization and data analysis
is
commercially available from a number of sources, for example, from Exiqon A/S.
Briefly, RNA Quality Control is performed using Bioanalyser 2100 microfluidics
platform (Bioanalyser is a trade mark of Agilent Technologies). Samples are
labelled
using the Complete Labelling Hyb Kit from Agilent, following the provided
instructions.
(2) Quantitative real-time PCR
As with option (1) above, all cellular RNA is extracted using a column-based
kit from
Exiqon and following the manufacturer's instructions. Quantification of miRNAs
by
TaqMan Real-Time PCR is carried out as described by the manufacturer (Applied
Biosystems of Foster City, California, USA). (TaqMan is a trade mark of Roche
Molecular Systems, Inc.). Briefly, 10 ng of RNA is used as a template for
reverse
transcription (RT) using the TaqMan MicroRNA Reverse Transcription Kit and
miRNA-specific stem-loop primers (Applied Biosystems). An aliquot (1.5 f) of
the RT
product is introduced into 20 pl PCR reactions which are incubated in 96-well
plates
on the ABI 7900HT thermocycler (Applied Biosystems) at 95 C for 10 min,
followed
by 40 cycles of 95 C for 15 s and 60 C for 1 min. Target gene expression is
CA 02787218 2012-07-16
WO 2010/082039 PCT/GB2010/000076
13
normalized between different samples based on the values of U48 RNA (a small,
non-coding RNA) expression (or GAPDH, if U48 is found to vary with drug
treatment).
In each case, the resulting miRNA expression levels are stored as 8 expression
data
sets. A large number of expression assays are preferably carried out.
Typically,
many (e.g. hundreds or thousands) of test agents are introduced to cell
cultures and
analysed in this way to create a database of miRNA expression data.
Once a suitably large database of miRNA expression data sets are available,
the
expression data sets are analysed 10 to determine correlations between the
effects
of each test agent on miRNA expression and to create hierarchical clusters of
test
agents which have similar effects on the miRNA expression profiles.
Methods for determining correlations between nucleic acid expression data sets
are
well known to those skilled in the art. For example, one method is to import
microarray data obtained from Exiqon A/S in the GPR format into a spreadsheet.
(GPR is the data format used by Genepix6 software, available from Molecular
Devices of Union City, California, USA. Genepix is a trade mark of Molecular
Devices). Spot intensities for each miRNA are analysed against quality control
and
calibration spots provided on the miRNA array (indicated by Genepix6 software
as a
negative flag). Values with signal intensities below 50 are brought up to 0.
For each
of the four replicate spots for each miRNA capture probe species, the median
value
of the background corrected spot intensity is calculated and imported into
TMeV
microarray analysis software which performs hierarchical clustering and/or
other
statistical analyses familiar to one skilled in the art. (TMeV is provided by
the Dana-
Farber Cancer Institute, at the URL www.tm4.org).
Alternatively, GRP format expression data may be imported into Genespring GX
software, available from Agilent Technologies. (Genespring GX is a trade mark
of
Agilent Technologies), normalised to the 75th percentile and then processed
using
hierarchial clustering and other statistical tools built into Genespring GX.
Where positive correlations are found between the effects of two or more test
agents
on the expression of one or more miRNAs, this may be indicative that the test
agents
share the same, or a related, mechanism of action. Thus, test agents which are
found to have similar effect on miRNA expression profile as an agent which is
known
as a treatment for a condition can be identified 12 as candidates for
treatment of the
CA 02787218 2012-07-16
WO 2010/082039 PCT/GB2010/000076
14
same, or a related condition. This may be useful to facilitate the
repositioning of
drugs which have already been identified as potentially useful for one
therapeutic
application. Candidate test agents can be tested to determine whether they may
be
useful for treatment of the same, or a related condition, or used as the
starting point
for further research. For example, they might be modified using rational or
combinatorial design methodologies, a mimetic compound might be prepared and
tested and so forth. Candidate test agents can be tested 14 to determine
whether
they are suitable for use as therapeutic entities and, if, they are, deployed
16 as
therapeutic entities.
It is especially useful to group test agents which have similar effects on the
expression of one or more miRNAs as this classification by effect on miRNA
expression may be reflected in a similar or related mechanism of action,
whether
direct or indirect, on miRNA expression levels.
Where negative correlations are identified, one test agent might be identified
as a
candidate to prevent, mitigate or obviate one or more undesirable affects of a
further
test agent or other intervention. Thus, a test agent which is known to have an
opposite effect on the expression of one or more miRNAs to another test agent
which
has an undesirable effect could be considered as a candidate entity for the
treatment
or prevention of that undesirable effect.
Advantageously, miRNA expression assays are carried out to assess the effect
of a
range of interventions, including interventions other than the administration
of a
chemical or biological entity. For example, cells may be treated with
ultraviolet light,
ionising radiation, acoustic waves and other interventions which are
deleterious to the
cells. Where a test agent can be identified which has an effect on the
expression of
one or more miRNAs which is negatively correlated to the effect of such
interventions, the test agent may be a candidate for the treatment or
prevention of
undesirable effects resulting from a corresponding intervention in vivo. This
may be
useful to identify agents for the prevention of damage caused by ultraviolet
light or as
side effects from radiotherapies.
The method can be applied to the high-throughput screening of large numbers of
test
agents (e.g. combinatorial libraries of small chemical entities, peptides,
peptidomimetics or polynucleic acids). As new expression assays are carried
out the
resulting expression data sets can be compared against previously stored
expression
CA 02787218 2012-07-16
WO 2010/082039 PCT/GB2010/000076
data sets to look for correlations between the effects of screened test agents
and
agents which have been previously assayed.
The method is typically best employed using a large database of miRNA
expression
data sets. However, for some specific applications it may only be necessary to
have
a small number of miRNA expression data sets, or even one miRNA expression
data
set, available for comparison with the miRNA expression data set resulting
from a
new assay. This may be relevant in high-throughput screens to find agents
which
have an effect on miRNA expression which correlates positively or negatively
with a
particular identified effect, for example, the effect of an agent which is
known or
suspected as having a significant effect on miRNA expression.
Thus, the invention is based on a principle that similarities in mechanism of
action,
and therefore practical applications, of test agents (such as chemical
entities and
biologics) may be found through the comparative analysis of their effects on
the
expression of miRNAs (and potentially other non-coding RNAs) without it being
essential to understand the mechanism through which the test agents affect
miRNA
expression profiles. This is in direct contrast to conventional drug discovery
and drug
repositioning strategies in which a mechanism of action is researched in depth
to
identify a drug target for use in screening assays to discover agents which
have a
desired interaction with the drug target.
Experimental Findings and their Implications
Using the methods described we have determined that it is possible to
determine
potential modes of therapeutic application of interventions based on the
grouping of
miRNA expression data. Furthermore, the method can be employed to identify
certain miRNAs, having expression levels which are indicative of certain
therapeutic
applications for interventions being screened. Such indicative miRNAs will
enable
future intervention screening to analyse a relatively small group of miRNA
expression
levels to identify potential therapeutic applications of the interventions
being
screened, and not the entire miRNA library.
An example of using a select small group of miRNAs to determine potential
therapeutic uses for an intervention is given below.
CA 02787218 2012-07-16
WO 2010/082039 PCT/GB2010/000076
16
During experiments described here, by way of a control, a group of cells were
treated
with a drug solvent mix comprising dimethyl sulphoxide, or DMSO, and phosphate
buffered saline. It was assumed that the drug solvent mix would not have an
effect
on miRNA expression, and if it did, it would not be consistent with any of the
patterns
associated with the drugs being tested. However, the drug solvent mix was
found to
have a miRNA expression pattern consistent with an HDAC inhibitor.
Subsequently,
it was found from a literature review that DMSO had been shown to be an HDAC
inhibitor, confirming that unknown potential therapeutic properties of drugs
can be
determined using the methods of the invention.
Materials and Methods
HeLa cells were cultured using standard methods. The cells were split into
DMEM
medium.
The media was aspirated and the cell monolayer was washed with an appropriate
amount of Phosphate Buffered Saline (PBS, 8 g NaCI, 0.2 g KCI, 1.44 g Na2HPO4
and 0.24 g KH2PO4 dissolved in 800 ml of distilled H2O). The PBS was
aspirated.
The test agent in question was administered to the cells and incubated for 48
hours.
RNA extraction
RNA was isolated and purified from these cells using a column-based kit from
Exiqon
the following procedure.
The medium the cells were grown on was aspirated and the cell monolayer was
washed with an appropriate amount of PBS. The PBS was further aspirated.
350 pL of the lysis solution was added directly to a culture plate. The cells
were lysed
by gently tapping the culture dish and swirling buffer around the plate
surface for five
minutes. The lysate was then transferred to a micro-centrifuge tube.
200 L of 95-100% ethanol was added to the lysate and mixed by vortexing for
10
seconds.
CA 02787218 2012-07-16
WO 2010/082039 PCT/GB2010/000076
17
A column was assembled using one of the tubes provided in the kit. 600 pL of
the
lysate/ethanol was applied onto the column and centrifuged for 1 minute at
14,000 x
g. The flow-through was discarded and the spin column was reassembled with its
collection tube.
400 pL of the supplied wash solution was applied to the column and centrifuged
for 1
minute at 14,000 x g. The flow-through was discarded and the spin column was
reassembled with its collection tube.
The column was washed twice more by adding another 400 pL of wash solution and
centrifuging for 1 minute at 14,000 x g. The flow-through was discarded and
the spin
column was reassembled with its collection tube.
The column was spun for two minutes at 14,000 x g to thoroughly dry the resin
and
the collection tube was discarded.
The column was assembled into a 1.7 mL elution tube provided with kit. 50 pL
of
elution buffer was added to the column and centrifuged for two minutes at 200
x g
followed by one minute at 14,000 x g.
The resulting purified RNA sample could be stored at -20 C for a few days. For
long-
term storage of samples were stored at -70 C.
(1) miRNA microarray and data analysis
Labelling
Purified RNA samples were labelled using a labelling kit from Agilent.
The total RNA sample was diluted to 50 ng/pL in 1 x TE pH 7.5. 2 pL of the
diluted
total RNA was added to a 1.5 mL micro-centrifuge tube and put on ice.
Immediately
prior to use, 0.4 pL 10 x calf intestinal phosphatase buffer, 1.1 pL nuclease
free water
and 0.5 pL calf intestinal phosphatase were gently mixed to prepare a calf
intestinal
alkaline phosphatase master mix.
CA 02787218 2012-07-16
WO 2010/082039 PCT/GB2010/000076
18
2 pL of the calf intestinal alkaline phosphatase master mix was added to each
sample
tube for a total reaction volume 4 pL, and was gently mixed by pipetting. The
reaction
volume was incubated at 37 C in a circulating water bath for 30 minutes.
2.8 pL of 100% DMSO was added to each sample. Samples were incubated at 100 C
in a circulating water bath for 5-10 minutes and then immediately transferred
to an ice
bath.
x T4 RNA ligase buffer was warmed to 37 C and spun until all precipitate had
dissolved. Immediately prior to use, 1 pL of 10 x T4 RNA ligase buffer, 3 PL
cyanine3-
pCp and 0.5 pL T4 RNA ligase were gently mixed to make a ligation master mix
and
put on ice.
4.5 pL of the ligation master mix was added to each sample tube for a total
reaction
volume of 11.3 pL. Samples were gently mixed by pipetting and spun down. The
samples were then incubated at 16 C in a circulating waterbath for two hours.
The
samples were then dried using a vacuum concentrator at 45-55 C and the samples
were determined to be dry if, when the tube was flicked the pellets did not
move or
spread.
Hybridization
125 pL of nuclease free water was added to the vial containing lyophilised 10
x GE
blocking agent supplied with the Agilent Kit and mixed.
The dried sample was resuspended in 18 pL of nuclease free water. 4.5 pL of
the 10
x GE blocking agent was added to each sample. 22.5 pL of 2 x Hi- RPM
Hybridization
buffer was added to each sample and mixed well. The resulting samples were
incubated at 100 C for 5 minutes, and then immediately transferred to an ice
waterbath for a further 5 minutes.
A clean gasket slide was loaded into the Agilent SureHyb chamber base ensuring
the
gasket slide was flush with the chamber base. The hybridization sample was
dispensed onto the gasket well ensuring no bubbles were present.
An array was placed active side down onto the SureHyb gasket slide and
assembled
with the SureHyb chamber cover to form an assembled chamber. The assembled
CA 02787218 2012-07-16
WO 2010/082039 PCT/GB2010/000076
19
chamber was placed into a hybridization oven set at 55 C and rotated at 20 rpm
for
20 hours at that temperature.
The arrays were subsequently washed using the supplied GE wash buffers before
being scanned.
(2) Quantitative real-time PCR
Preparing the RT Reaction Master Mix
The components were thawed from frozen on ice. The RT reaction master mix was
prepared by mixing 0.15 pL dNTPs (100 mM), 1 pL MultiScribe Reverse
Transcriptase (MultiScribe is a trade mark of Applera Corporation) (50 U/ L),
1.5 PL
10x Reverse Transcription Buffer, 0.19 uL RNase Inhibitor (20 U/ L), 4.16 L
nuclease-free water, and then stored on ice. Note that the volumes quoted
above are
per 15 pL RT reaction and were scaled up for the number of RT reactions to be
carried out.
Preparing the RT Reaction
For each 15 pL RT reaction, 7 pL RT master mix was combined with 5 pL total
RNA.
The RT Primers were thawed on ice and 3 pL of RT primer was added to the 12 L
of
the RT master mix/total RNA in a 96-well plate well. The plate was kept on ice
until
filled and then put into the thermal cycler.
Thermal Cycler steps:
16 C for 30 minutes
42 C for 30 minutes
85 C for 5 minutes
4 C for as long as convenient
PCR Amplification
For each well, 10 pL Taqman 2X Universal PCR Master Mix was mixed with 7.67 L
nuclease-free water, 1 L of 20x Taqman MicroRNA Assay mix and 1.33 L of the
RT
product from the previous step. When all the wells were filled the plate was
sealed
with an optical adhesive cover and centrifuged to remove any air bubbles.
CA 02787218 2012-07-16
WO 2010/082039 PCT/GB2010/000076
The plate was then loaded into a real-time capable thermal cycler/PCR machine
and
the following program followed:
95 C for 10 minutes (Activation of the AmpliTaq Gold Enzyme)
40 x (95 C for 15 seconds, 60 C for 60 seconds).
Data Analysis
Data from both of these techniques was normalised against the spike-in miRNA
spots
for each plate, allowing data from separate arrays to be compared.
Normalised data was analysed using Principal Component Analysis, a standard
technique well understood by those skilled in the art to identify correlations
between
miRNA expression profiles, and any grouping of data observed determined to be
a
consequence of the action of the particular test agent applied to the original
cells on
the expression of the individual miRNA.
Figure 1 is a flow diagram of a method for obtaining an expression profile for
micro
RNA.
Figure 2 shows an example of an expression profile after principal component
analysis. Part (a) shows a three dimensional projection of three principal
components of the total multidimensional expression data set of miRNA
expression
and illustrates clustering of miRNA expression data for one treatment type.
Part (b)
shows the data spread for the expression of single miRNA exp
Figure 3 shows a statistical ranking of 11 discriminatory miRNAs labelled has-
miR-1
through has-miR-1 1. The p-value is the standard statistical test value of
whether a
result is statistically significant or the result of chance (generally given
to be a p-value
of <_ 0.05) and the q-value being the p-value corrected for multiple testing
and
provides a measure of the false discovery rate. All p-values shown are much
less
than 0.05.
Figure 4 (a) shows a projection of three principal components of the
multidimensional
data set for miRNA expression for multiple miRNAs and the clustering of miRNAs
indicative of a potential therapeutic applications. (b) shows a projection of
three
principal components of the multidimensional data set for miRNA expression for
CA 02787218 2012-07-16
WO 2010/082039 PCT/GB2010/000076
21
multiple miRNAs wherein the individual miRNAs are shaded to indicate the
therapeutic application for which the biological intervention applied in their
expression
is used.
As can be seen, the results are clearly grouped and that this grouping is
according to
the therapeutic use of the biological intervention applied to the cells in
which the
miRNAs were expressed. In other words, it is possible to determine that the
grouped
biological interventions may have a similar mechanism of action upon the cells
to
which they were applied, and the shared mechanism resulted in similar effects
on
miRNAs expression levels.
Biological interventions with similar mechanisms of action may also have
similar
therapeutic properties and therefore they may have similar therapeutic
applications.
Data presented in Figures 3 and 4 demonstrates that for the biological
interventions
tested, the projection of three principal components of the multidimensional
data set
for miRNA expression for biological interventions of similar therapeutic
application
(for example, anti-metabolites) did indeed group together, and that the
groupings of
biological interventions with a different therapeutic use (for example
epigenetic
modifiers) were grouped separately.
A database of miRNA expression patterns can be built up by carrying out many
biological interventions and analysing the resulting changes in miRNA
expression
profile. Such a database would enable identification of the therapeutic use,
or
potential future therapeutic use, of an untested biological intervention by
comparing a
miRNA expression profile of said untested biological intervention with that in
the
database and determining whether the said expression profile falls within one
of the
therapeutic application groupings. If such a correlation occurs, the untested
biological intervention may be considered for that specific therapeutic
application.
Furthermore, building up a database of miRNA expression data may reveal a
subset
of certain miRNAs that are indicative of a certain therapeutic application.
Once said
subset of indicative miRNAs are identified, future testing of new biological
interventions to find potential therapeutic applications, or testing known
biological
interventions for new therapeutic applications, can be carried out by looking
at the
expression profiles of the subset of indicative miRNA expression profiles and
not the
entire range of miRNAs produced by the cells.
CA 02787218 2012-07-16
WO 2010/082039 PCT/GB2010/000076
22
The database of miRNA expression data may also be employed to determine a
subset of certain miRNAs, the expression levels of which are most useful for
discriminating between biological interventions, or between groups of
biological
interventions known or hypothesized to have similar modes of action. miRNAs
may
be ranked in order of the relevance of their expression levels for
discriminating
between biological interventions, or between groups of biological
interventions known
or hypothesized to have similar modes of action. miRNAs may be allocated a
numerical value indicative of the relevance of their expression levels for
discriminating between biological interventions, or between groups of
biological
interventions known or hypothesized to have similar modes of action. For
example,
the numerical value may be related to the contribution of the expression level
of an
miRNA to the variance of principle components.
As an alternative to, or in addition to, the comparison of miRNA expression
profiles
using statistical methods such as principal component analysis, the effect of
a
biological intervention on the expression of each of a limited group of miRNAs
(for
example, 10-50) may be identified and used to assign a code, selected from a
group
of codes, to the effect of the biological intervention on the expression of
each
respective miRNA. The resulting codes may be compared to identify similarities
in
effect.
For example, for each biological intervention (e.g. for each screened
compound) a 3-
digit binary number may be allocated as a code to each ranked miRNA based on:
1. If expression of the miRNA is unchanged (within normal limits of
experimental
variability) in response to the biological intervention, the first bit is set
to 0. If
expression has changed significantly, the first bit is set to 1.
2. If a change in expression level was identified and the change was an
increase, the
second bit is set to 1. If the change resulting from the biological
intervention was a
decrease, the second bit is set to 0.
3. If the change in expression level was more than 4-fold, the third bit is
set to 1,
otherwise it is set to 0.
Thus, the effect of a biological intervention level on the expression of an
miRNA is
allocated a code having one of five possible values:
CA 02787218 2012-07-16
WO 2010/082039 PCT/GB2010/000076
23
1. No change in expression - 000
2. Large increase in expression - 111
3. Small increase in expression - 110
4. Large decrease in expression -101
5. Small decrease in expression - 100
The effect of a biological intervention (for example, the administration of a
particular
compound) on the expression level of a group of miRNAs may be characterised by
the associated code, permitting identification of changes in expression level
not
immediately apparent from principal component analysis, permitting alternative
methods of scoring the similarity of biological interventions and rendering
the
resulting expression data comprehensible by visual inspection.
Another way to characterise the effect of a biological intervention and to
determine
correlations between the effects on miRNA expression of different biological
interventions is to carry out an expression assay to determine the effects of
a
biological intervention on the expression of each of a group (of typically 10
to 50)
miRNAs and to rank the miRNAs in that group in order of the effect, for
example, in
order from the miRNA in the group which has the largest increase in expression
to
the miRNA in the group which has the largest decrease in expression, or vice
versa.
The resulting rankings are indicative of the effects of particular biological
interventions. Thus, the effect of other biological interventions on the group
of
miRNAs may be measured and the miRNAs in the group ranked in order of the
effect.
The resulting rankings may be compared to enable correlations between the
effect of
biological interventions to be identified.
A kit comprising plates operable to test the subset of indicative miRNAs may
be
provided to significantly increase the efficiency and speed with which
biological
interventions can be screened for potential novel therapeutic applications.
Further variations and modifications may be made within the scope of the
invention
herein disclosed.
CA 02787218 2012-07-16
WO 2010/082039 PCT/GB2010/000076
24
References
1. Xie, X., et al., Systematic discovery of regulatory motifs in human
promoters
and 3'-UTRs by comparison of several mammals. Nature, 2005. 434(7031): p.
338-45
2. Lim, L.P., et al., Microarray analysis shows that some microRNAs
downregulate large numbers of target mRNAs. Nature, 2005. 433(7072): p.
769-73
3. Calin, G.A., et al., MicroRNA profiling reveals distinct signatures in B
cell
chronic lymphocytic leukemias. Proc Natl Acad Ad USA, 2004. 101 (32): p.
11755-60