Note: Descriptions are shown in the official language in which they were submitted.
CA 02802796 2012-12-14
WO 2011/159509 PCT/US2011/039258
METHOD FOR DETERMINING SPATIAL DISTRIBUTION OF FLUID
INJECTED INTO SUBSURFACE ROCK FORMATIONS
Cross-reference to related applications
Not applicable.
Statement regarding federally sponsored research or development
Not applicable.
Background of the Invention
Field of the Invention
[0001] The invention relates generally to the field of mapping spatial
distribution with
respect to time of fluids injected into subsurface rock formations. More
specifically, the
invention relates to methods for determining spatial distribution of an
injected fluid in
rock pore spaces when electrical conductivity contrast between the native
(connate) fluid
and the injected fluid is insufficient for conductivity based fluid mapping.
Background Art
[0002] Fluids are injected into subsurface rock formations for a number of
different
purposes, for example, to flush hydrocarbon from pore spaces in the formations
and to
move contamination or help remediate rock formations in environmental clean-up
situations. For many such purposes, it is desirable that the spatial
distribution of the
injected fluid is determined or mapped as a function of time. If there is
sufficient
electrical resistivity (conductivity) contrast between the injected fluid and
the existing
fluid in the rock formation pore spaces, then the electrical resistivity of
the formation
containing the injected fluid will differ from that of the surrounding
formation containing
native fluid. In such cases, surface or borehole electromagnetic ("EM")
measurement
methods (e.g., galvanic or induction) can be used to map the spatial
distribution of fluid
movement and the fluid front with respect to time.
1
CA 02802796 2012-12-14
WO 2011/159509 PCT/US2011/039258
[0003] However, in a number of instances there is not a large enough
resistivity/conductivity contrast between the injected fluid and fluid in the
surrounding
rock formation in order to use EM mapping techniques known in the art.
[0004] It is also known in the art to impart injected fluid with detectable
characteristics to
physically distinguish the injected fluid from the fluid already present in
the pore spaces
of an injection formation. One example of such technique is to include a
radioisotope in
the injected fluid that can be monitored by a suitable radiation detector.
However, use of
radioisotopes may be prohibited in certain areas, and their range of
detectability through
rock formations is generally limited to a distance of about one foot from the
radiation
detector.
[0005] There is a need for other methods to be able to map the spatial
distribution of the
injected fluid.
Summary of the Invention
[0006] A method according to one aspect of the invention for determining
spatial
distribution of fluid injected into a subsurface rock formation includes
injecting the fluid
into the rock formation. The fluid includes therein electrically conductive
solid particles
dispersed in an electrolyte. An electromagnetic response of the formation is
measured.
The measured electromagnetic response is used to determine spatial
distribution of the
injected fluid.
[0007] Other aspects and advantages of the invention will be apparent from the
following
description and the appended claims.
Brief Description of the Drawings
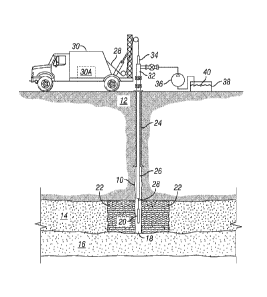
[0008] FIG. 1 shows an example borehole EM measuring instrument in a wellbore
drilled
through an injection formation, and a pump system configured to inject a
selected fluid
into the injection formation.
[0009] FIG. 2 shows an example of induced polarization adjacent to an
electrically
conductive particle suspended in an electrolytic fluid.
2
CA 02802796 2012-12-14
WO 2011/159509 PCT/US2011/039258
[0010] FIG. 3A shows an example surface EM measurement system for mapping
spatial
distribution of induced polarization.
[0011] FIG. 3B shows electric current distribution in the subsurface resulting
from the
transmitter arrangement shown in FIG. 3A.
[0012] FIG. 3C shows receiver sensitivity for the arrangement shown in FIG.
3A.
[0013] FIG. 3D shows an example through casing resistivity measurement
arrangement.
[0014] FIG. 4 shows simulated array induction resistivity values for various
values of
dielectric permittivity in a 10 ohm-m rock formation.
Detailed Description
[0015] An example of injecting fluid into a subsurface formation through a
wellbore and
making EM measurements from within the same or different wellbore is shown
schematically in FIG. 1. A wellbore 10 that may be used for fluid injection is
drilled
through subsurface rock formations, shown generally at 12, and into or through
an
injection formation 14. As explained in the Background section herein, the
injection
formation 14 is one in which fluid is to be injected, for example, to displace
hydrocarbon
or contaminants, and/or to maintain fluid pressure in the formation 14. It is
desirable in
certain circumstances to be able to determine the spatial distribution of the
injected fluid
and its boundary or "front" 22 with respect to fluids already present in the
pore spaces of
the injection formation 14.
[0016] The example wellbore 10 may include a pipe or casing 24 cemented in
place to a
selected depth to protect shallower formations from fluid entry and to
maintain the
mechanical integrity of the wellbore 10. In some examples, a tubing 26 may be
inserted
into the interior of the casing 24 to increase the velocity of fluid pumped
from the
surface.
[0017] Fluid to be pumped into the formation may be stored, at 40, in a tank
or pit 38 at
the surface. A pump 36 lifts the fluid from the tank 38 and discharges it
under selected
pressure into a wellhead 32 which includes control valves for maintaining
hydraulic
3
CA 02802796 2012-12-14
WO 2011/159509 PCT/US2011/039258
control of the wellbore 10. In the present example, the fluid 40 may travel
through the
tubing 26 and be discharged from the wellbore 10 into the injection formation
14. In
some examples, the wellbore may extend, as shown at 18, to the depth of the
bottom of
the injection formation 14, bounded on the bottom by another rock formation
16. Other
wellbores may extend deeper and may include casing all the way to the bottom
of the
wellbore 10. The configuration shown in FIG. 1 is only meant to serve as an
example of
fluid injection into a subsurface rock formation and is not intended to limit
the scope of
the present disclosure and/or invention.
[0018] In some examples, measurement of an electromagnetic property of the
injection
formation 14 may be performed by an instrument 20 extended into the wellbore
10. The
instrument may be, for example, an EM induction resistivity measurement
instrument, for
example one used to provide services under the service mark AIT, which is a
mark of the
assignee of the present invention. The EM induction instrument 20 in the
present
example may be conveyed into the wellbore 10 at the end of an armored
electrical cable
28. The cable 28 may include one or more insulated electrical conductors to
supply
electrical power to the instrument 20 and to transmit signals from the
instrument 20 to a
surface recording unit 30, having a data recorder/processor 30A therein for
recording and
interpreting the signals transmitted over the cable 28 by the instrument 20.
If the
instrument 20 is used contemporaneously with fluid injection as shown in FIG.
1, a pack
off/lubricator 32 or similar combination of cable pressure seal and instrument
receiving
conduit may be coupled to the upper part of the wellhead 32. The pack
off/lubricator
enables movement of the cable 28 while preventing escape of fluid under
pressure from
the wellhead 32 and the wellbore 10.
[0019] The example shown in FIG. 1 is based on the land surface, however,
those skilled
in the art will readily appreciate that corresponding equipment may be used to
perform
similar operations on wellbores below the bottom of a body of water such as a
lake or
ocean.
[0020] As explained in the Background section herein, the spatial distribution
of fluid,
shown as within the fluid front 22, can be readily mapped using an instrument
such as the
4
CA 02802796 2012-12-14
WO 2011/159509 PCT/US2011/039258
one shown in and described with reference to FIG. 1 if there is substantial
contrast in
resistivity between the pumped fluid 40 and the fluid already present in the
pore spaces of
the injection formation 14. The present invention can also relate to the
situation where
such resistivity contrast is not present. Methods according to the invention
may be
configured to create a detectable EM phenomenon by injecting, along with the
fluid 40,
micro-scale, electrically conductive particles. The electrically conductive
particles
produce an induced-polarization ("IP") effect that can be measured with a
suitable
apparatus. Examples of suitable conductive particles are fine-grained metallic
powders or
carbon nanotubes. From the surface, inductive or galvanic methods can be used
to
measure the IP spatial distribution, and thereby the injected fluid front.
From within
wellbores, such as shown in FIG. 1, induction tools operating in the tens of
kHz
frequency range can be used to map the fluid distribution. The spatial
distribution of the
conductive particle-filled fluid can then be determined by mathematical
inversion
methods as solutions to Maxwell's Equations.
[0021] The Induced Polarization (IP) effect is produced in a porous subsurface
rock
formation when the formation contains both salt water and particles having
metallic
conductivity. See, Anderson, B., Barber, T., Luling, M., and Sen, P.:
Observations of
large dielectric effects on induction logs, or, can source rocks be detected
with induction
measurements?, SPWLA 47th Annual Logging Symposium, Veracruz, Mexico, June 4-
7,
2006. Naturally-occurring electrically conductive particles that fit this
description
include pyrite and graphite. The observed effects of IP include a large
apparent dielectric
effect on the measurements made by induction tools having transmitter
frequency in the
tens of kHz range. The induction quadrature (X) signals and in phase (R)
signals are
perturbed by the IP effect. The raw R and X signals can be inverted to provide
the
apparent conductivity and apparent dielectric permittivity of the rock
formation. See,
Anderson, B., Barber, T., Luling, M., Sen. P., Taherian, R., and Klein, J.:
Identifying
potential gas producing shales from large dielectric permittivities measured
by induction
quadrature signals, SPWLA 49th Annual Logging Symposium, Edinburgh, Scotland,
May 25-28, 2008.
CA 02802796 2012-12-14
WO 2011/159509 PCT/US2011/039258
[0022] In the presence of electrically conductive particles, oxidation-
reduction reactions
on the particle surfaces (which happen during the transition of the electric
current from
moving as a result of ionic conduction in the formation water to moving by
electron
conduction within the electron structure of the particles) can result in
similar large values
of dielectric permittivities in induction measurements made in the kHz range.
FIG. 2
shows schematically the source of apparent over-voltage as a result of redox
(or IP) in an
electrically conductive particle 50 disposed in a source shale 42. In such
situations,
metallic grains (pyrite, etc.) are in contact with electrolytes (water
containing various
salts). In the presence of an electric field, electric currents flow in the
system. The
conduction is by ions in the electrolyte, but by electrons inside the
electrically conductive
particle grain 50. Oxidation is defined as the loss of an electron to a
negative ion in
solution, such as Cl-. Reduction is defined as the uptake of an electron by a
positive ion,
such as Na'. High dielectric permittivities are caused by an accumulation of
ions and
gases on the electrolyte side of the interface between the conductive particle
and the
electrolyte. See, for example, Klein, J.D., Biegler, T., and Horne, M.D.,
1984, Mineral
interfacial processes in the method of induced polarization, Geophysics, vol.
49, no. 7,
p.1105-1114.
[0023] Using data quoted in Wong, J., 1979, An electrochemical model of the
induced
polarization phenomena in disseminated sulfide ores, Geophysics, vol. 44, no.
7, p.
1245-1265 and Wong, J., and Strangway, D.W., 1981, Induced polarization in
disseminated sulfide ores containing elongated mineralization, Geophysics,
vol. 46, no.
9, p. 1258-1268, observed dielectric permittivities can be as much as 1000 for
even a
small volume fraction of electrically conductive particles dispersed in
electrolyte.
[0024] The magnitude of the dielectric permittivity effect on induction tools
can be
derived from simple induction response equations. The multi-frequency array
induction
tool provides deep (in the sense of lateral displacement from the axis of the
wellbore)
conductivity measurements using two operating frequencies: 26 kHz and 52 kHz.
For the
foregoing frequencies, the conductivity scale co = 44 becomes
26kHz 6(,, i) -1.45 uS/ m
6
CA 02802796 2012-12-14
WO 2011/159509 PCT/US2011/039258
fz = 52kHz c(o2) - 2.90,uS/m
[0025] These values are two orders of magnitude below the lower end of the
conductivity
range. As a result, it can be inferred that relative dielectric permittivities
of E. > 10000
will produce observable dielectric effects on the induction instrument
response.
[0026] Elementary three-coil induction tools are designed to directly measure
the electric
conductivity. Electromagnetic signals are described by a wave number
k = wu (+ i6) = iwu6" Induction tools and their data-reduction algorithms are
designed in such a way that the square of this wave number is directly
detected to provide
the conductivity as a real term,
k 2
-=6 =6-iC0
iOU
[0027] In calculating conductivity of formations from the above relationships,
usually the
dielectric permittivity is neglected, so that any imaginary term only provides
a small,
positive, higher-order "skin-effect" correction in very conductive media.
[0028] FIG. 4 shows the AIT response computed for five values of Er: 1,
10,000, 20,000,
30,000 and 40,000. These values are within the range observed in a rock
formation
known as the Woodford shale. Rt was set tolO ohm-m in all formation layers.
The left
track in FIG. 4 shows the raw R- and X-signals for the 21-inch longitudinal
spaced (i.e.,
distance between transmitter and receiver) array in the AIT at 26 and 52 kHz.
The right
track shows the five processed apparent resistivity curves. The center-bed
values of the
raw R- and X-signals are given in Table 1. The raw X-signal curves are
proportional to
the operating frequencies and differ by approximately a factor of 2. The raw R-
signal
curves cross and separate as 8r increases. The processed apparent resistivity
curves
separate and systematically depart from 10 ohm-m as 8r increases.
Table 1. Center-bed R- and X-signals (mS/m) for the five values of Cr in FIG.
2
Er Rat 26 kHz Rat 52 kHz X at 26 kHz X at 52 kHz
1 95.3 93.3 4.5 6.3
10,000 96.2 96.1 -9.2 -20.2
7
CA 02802796 2012-12-14
WO 2011/159509 PCT/US2011/039258
20,000 97.3 99.5 -22.7 -46.9
30,000 98.5 103.4 -36.4 -74.0
40,000 99.7 107.8 -50.3 -101.1
[0029] Where boreholes are drilled into the formation of interest (i.e.,
injection formation
14 in FIG. 1), wellbore measurement techniques such as shown in FIG. 1 enable
the
detection and mapping of the IP-producing fluid/conductive particle
distribution. Note
that the disclosed methods are not limited to the existing induction tools and
in particular
induction tools operating at higher or lower frequencies can be used. As the
data of
Table 1 shows higher frequencies lead to higher signals. On the other hand the
dielectric
permittivity increases with decreasing frequency so that there is an optimum
frequency
which depends on the properties of the injected material. Additionally, the
present
disclosure is not limited to induction tools in general. Rather, as will be
recognized by
one or ordinary skill in the art having benefit of the present disclosure,
methods
consistent with the disclosure can be used with propagation tools (such as
certain tools
without the need for bucking coils to cancel the effect of direct coupling
between a
transmitter and receiver coil). In certain embodiments, propagation tools may
be better
suited for methods involving logging-while-drilling applications and induction
tools may
be better suited for methods involving wireline applications, though as would
be
recognized by one of ordinary skill in the art, either type of tool could be
used in either
type application. In order to produce the required IP effects, it is necessary
to have the
fine particles having solid phase electrical conductivity dispersed in an
electrolytic fluid.
Where fluids are injected downhole for production enhancement or for
environmental
remediation, if the injected fluids carry such electrically conductive
particles, then
wellbore EM induction measurement techniques as explained with reference to
FIG. 1
can be used to map the distribution of the injected fluids. Solid phase
electrical
conductivity, or the term "electrically conductive particles" as used herein
is intended to
mean any substance that conducts electricity in its solid phase. Examples of
such
substances include many metals, graphite and pyrite, among others.
[0030] In certain cases, no wellbores are drilled through the injection
formation (14 in
FIG. 1) from within which EM induction measurements can be performed. To map
the
8
CA 02802796 2012-12-14
WO 2011/159509 PCT/US2011/039258
spatial distribution of injected fluids in such cases, surface measurements
may be
required. One such surface measurement system is described in Davydycheva, S.,
Rykhlinski, N., and Legeido, P.: Electrical-prospecting method for hydrocarbon
search
using the induced-polarization effect, Geophysics, Vol. 71, No. 4 July-August
2006 ; p.
179-189. FIG. 3A shows one example of an apparatus to measure the induced
polarization distribution from the surface. Another system is shown in Slater,
L. D., and
Glaser, D. R., 2003, Controls on induced polarization in sandy unconsolidated
sediments
and application to aquifer characterization, Geophysics, 68, No. 5, 1547-1558.
The
method described in the Davydycheva, et al. publication is particularly
adapted to image
the IP-producing rock formation layers (e.g., 14 in FIG. 1).
[0031] In the method described in the Davydycheva et al publication,
electromagnetic
transmitters, oriented along the horizontal x-axis, as depicted in FIG. 3A at
44A and 44B,
have selected frequency alternating current or appropriately switched direct
current (e.g.,
switched on, switched off, reversed polarity or a sequence such as a pseudo
random
binary sequence) passed across the grounded electrodes to excite an
electromagnetic field
in the formation. In the present example, the transmitters may be electric
dipoles. The
moments of the transmitter dipoles are opposite to each other. The distance
between the
transmitters 44A, 44B can vary depending on the desired vertical depth of
investigation.
A receiver 46 can be placed at the surface at the midpoint between the
transmitters 44A,
44B and in the present example may consist of three equidistant grounded
electrodes, so
that the first and the second spatial differences of the electric potential
can be measured.
[0032] If U is the potential of the electric field, then the voltmeter
depicted in FIG. 3A
measures the voltage equal to (U1 - 2U2 + U3)/2 which is the second potential
difference
between the electrodes 1, 2, and 3 (numbered in a sequential order) divided by
two. Thus,
the depicted receiver 46 is a quadrupole.
[0033] In other examples, the transmitters 44A, 44B and/or the receiver 46 may
be wire
loops or coils, solenoids or other form of magnetic dipole. Thus,
electromagnetic
measurement usable with the present invention is not limited in scope to
electric dipole
transmitters and receivers.
9
CA 02802796 2012-12-14
WO 2011/159509 PCT/US2011/039258
[0034] The axial current, which is strong in the vicinity of each transmitter
44A, 44B,
can be negligibly small in the area of the receiver 46, so that the vertical
current prevails
in the formation below the receiving electrodes as shown by the arrows in FIG.
3B, for
zT~
example. Moreover, the second potential difference AxV measured by the
receiver 46 is
exactly proportional to the total vertical current below it. Indeed, because V
J = 0 at the
receiver location, and the component on the axis of the transmitting dipoles
can be
neglected, we can apply Stokes' theorem ds = 0 to the area from x to x + Ax
along
the x-axis and from 0 to some depth Az along z, as follows:
AxU=Axv(x+Ax)-Axv(x): [Jx(x+Ax)-Jx(x)]Az= f x+AJZ(x)dx,
where Jx and Jz represent the linear current densities along the x- and z-
directions,
respectively. In other words, the quantity is sensitive to the vertical
current directed
downward, from the receiver area to deep structures. In this way, a vertical
current
focusing can be realized. The sensitivity of the receiver 46 is shown by the
arrows in
FIG. 3C. Below will be described in detail two different ways to perform such
focusing
using two transmitters. The arrangement for measuring shown in FIG. 3A allows
the
elimination of the effect of the near-surface inhomogeneities and of the
adjacent
formations, which are generally large for conventional resistivity methods.
[0035] With measurement systems available that are sensitive to the IP effect,
the basic
technique for determining spatial distribution of the injected fluid is a)
dispersing
microparticles having metallic conductivity within the injected fluid to
produce a strong
IP effect; and b) using known techniques to measure the IP effect to map the
spatial
distribution of the injected fluids in the rock formation.
[0036] Electrically conductive particles, for example, are not normally
soluble in water
and if they are injected into the formation they will precipitate within a
short distance
from the injection point. For the particles to move with the injecting fluid,
the particles
need to be made soluble or suspended in the injection fluid. Techniques for
solubilization of metal particles so that they can be mixed with water and
injected into the
injection formation (14 in FIG. 1) are described in, Journal of Materials
Chemistry, 2007,
CA 02802796 2012-12-14
WO 2011/159509 PCT/US2011/039258
volume 17, p. 613 for example. The method described in the foregoing article
uses clay
minerals to solubilize metal particles. The presence of clay and metal
together is
expected to enhance the IP effect even further beyond that provided by the
metal particles
alone. Alternatively, the electrically conductive particles can be embedded
within a
micelle to make them soluble in the injection fluid and the micelles may be
made to be
water or oil soluble depending on the type of injection fluid used. As will be
explained
further below, the particles may alternatively be suspended in the injected
fluid.
[0037] One electrically conductive microparticle type that may be used in some
examples
is carbon nanotubes. These have the required electrical conductivity and have
been
proposed as carriers for chemical or biological agents in the earth for
environmental
remediation. Although carbon nanotubes are also not normally soluble in water,
they can
be modified to render them water soluble. See for example, J Am. Chem. Soc.
2006 Jan
11;128(1):95-9. Carbon nanotube particles have been shown to be water soluble
without
any loss of electrical conductivity.
[0038] In practice a suitable amount of solubilized carbon nanotubes or metal
particles
are dissolved in the injection fluid and the resulting solution is injected
into the formation
(e.g., into formation 14 as shown in FIG. 1). Measurements may be made both
before the
fluid injection and during the course of the fluid injection. A wellbore
induction (FIG. 1)
or surface to borehole measurement (see FIG. 3A) is typically performed before
the
injection starts to obtain a background map, and the measurements may be
repeated at
selected times based on the desired time and spatial resolution. The surface
to borehole
measurement is inherently a multi point measurement and provides a sufficient
number of
measurements for generating an IP map of the region of interest. The wellbore
induction
instrument however, provides fewer measurements, but such measurements can be
made
along the wellbore (i.e., as a function of wellbore measured depth) in order
to provide
more data points. A preferred method is to measure a combination of both
techniques,
namely, perform the surface to borehole measurement in addition to wellbore
induction
measurement with respect to depth in both injection and production wells. The
surface to
borehole EM measurement will have greater depth of investigation than the
wellbore
induction measurements, but lower resolution. Thus a simultaneous inversion of
all
11
CA 02802796 2012-12-14
WO 2011/159509 PCT/US2011/039258
measurements can provide a map of the fluid front in the injection formation
(14 in FIG.
1) with enhanced resolution close to any wellbore in which induction
measurements are
made.
[0039] It is also possible to add chemicals to cause the electrically
conductive particles,
whether metal particles, carbon nanostructures or other conductive particles,
to be
suspended in the injected fluid. Thus, dissolving the particles through
solubilization is
only one possible technique for dispersing the particles in the injected
fluid.
[0040] FIG. 3D shows an example configuration for measuring electromagnetic
response
where an electrically conductive casing is disposed in the wellbore. Two
spaced apart
transmitters 44A, 44B are disposed along the casing, and a quadrupole receiver
46 as
explained with reference to FIG. 3A may be provided proximate a center point
between
the transmitters 44A, 44B.
[0041] In addition to the measurements made from within a wellbore as shown in
FIG. 1,
surface measurements shown in FIGS. 3A, 3B and 3C, and combinations of the
foregoing
two types of measurements, in other examples, measurements may be made using a
wellbore instrument such as shown in FIG. 1 disposed in each of two or more
wellbores
substantially simultaneously. Thus, a plurality of induction measurements made
as
explained with reference to FIG. 1 may be used to map the spatial distribution
of the
pumped fluid, both at any single time and with respect to time.
[0042] Methods according to the various aspects of the invention may enable
mapping
spatial distribution of injected fluid and its changes with respect to time
wherein
electrical resistivity or other techniques that provide contrast between the
injected fluid
and the existing pore fluid in a rock formation are not applicable.
[0043] While the invention has been described with respect to a limited number
of
embodiments, those skilled in the art, having benefit of this disclosure, will
appreciate
that other embodiments can be devised which do not depart from the scope of
the
invention as disclosed herein. Accordingly, the scope of the invention should
be limited
only by the attached claims.
12